Embed Size (px)
Citation preview
FUNDAMENTALS VALUATION
SANWARIA AGRO OILS
LIMITED
29th
June 2011
ANALYTICAL CONTACT
Ms. Revati Kasture +91-22-6754 3465 [email protected]
BUSINESS DEVELOPMENT CONTACTS
MUMBAI
Mr. P. N. Satheeskumar +91-22-6754 3555 [email protected]
KOLKATA
Mr. Sukanta Nag +91-33- 2283 1800 [email protected]
CHENNAI
Mr. V Pradeep Kumar +91-44-2849 7812 [email protected]
AHMEDABAD
Mr. Mehul Pandya +91-79-40265656 [email protected]
NEW DELHI
Ms. Swati Agrawal +91- 11- 2331 8701 [email protected]
BANGALORE
Mr. G. Sundara Vathanan +91-80-2211 7140 [email protected]
HYDERABAD
Mr. Ashwini Kumar Jani +91-40-40102030 [email protected]
CARE EQUITY RESEARCH OFFERS
Independent Research of equities on fundamentals or valuations or both
IPO Grading
White Label Research
Valuation of companies for Institutional Investors, Asset Managers and Corporates
Sector Write-ups for Offer Documents of securities
SANWARIA AGRO OILS LTD
1 www.careratings.com
EQUIGRADE
EQUIGRADE – Analytical Power for Investment Decisions
Sanwaria Agro Oils Limited Solvent Extraction Industry
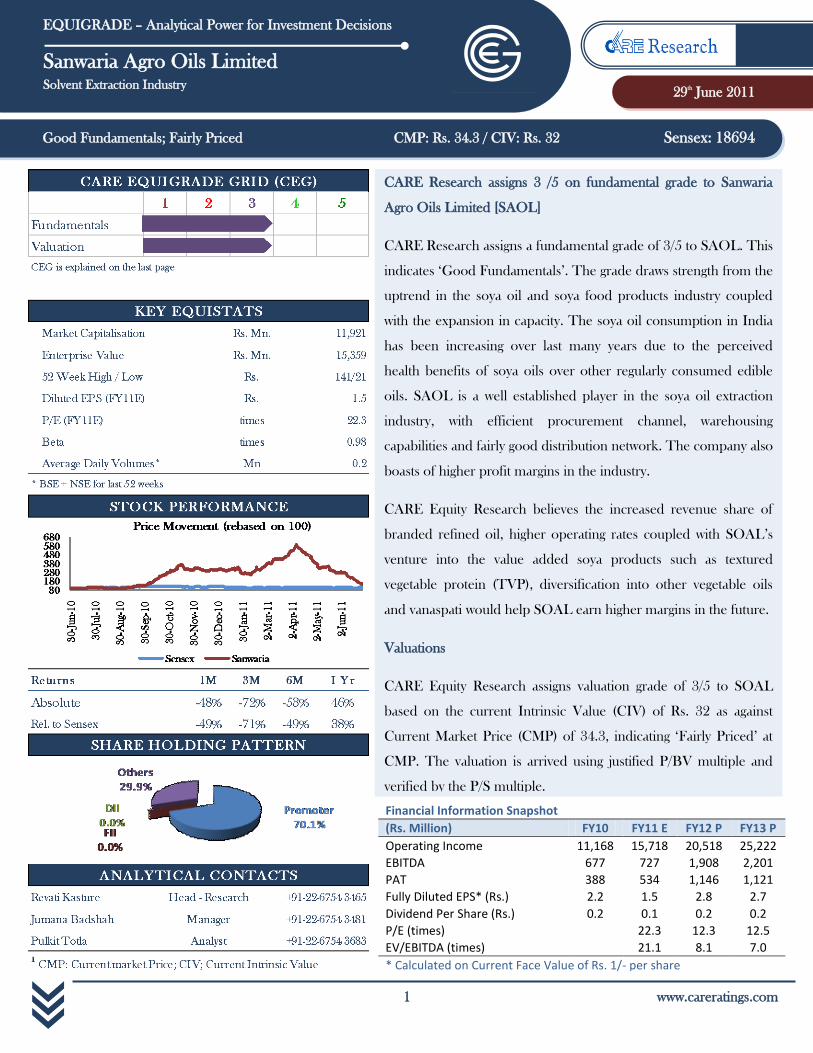
Good Fundamentals; Fairly Priced CMP: Rs. 34.3 / CIV: Rs. 32 Sensex: 18694
CARE Research assigns 3 /5 on fundamental grade to Sanwaria
Agro Oils Limited [SAOL]
CARE Research assigns a fundamental grade of 3/5 to SAOL. This
indicates ‘Good Fundamentals’. The grade draws strength from the
uptrend in the soya oil and soya food products industry coupled
with the expansion in capacity. The soya oil consumption in India
has been increasing over last many years due to the perceived
health benefits of soya oils over other regularly consumed edible
oils. SAOL is a well established player in the soya oil extraction
industry, with efficient procurement channel, warehousing
capabilities and fairly good distribution network. The company also
boasts of higher profit margins in the industry.
CARE Equity Research believes the increased revenue share of
branded refined oil, higher operating rates coupled with SOAL’s
venture into the value added soya products such as textured
vegetable protein (TVP), diversification into other vegetable oils
and vanaspati would help SOAL earn higher margins in the future.
Valuations
CARE Equity Research assigns valuation grade of 3/5 to SOAL
based on the current Intrinsic Value (CIV) of Rs. 32 as against
Current Market Price (CMP) of 34.3, indicating ‘Fairly Priced’ at
CMP. The valuation is arrived using justified P/BV multiple and
verified by the P/S multiple.
29th
June 2011
Financial Information Snapshot
(Rs. Million) FY10 FY11 E FY12 P FY13 P
Operating Income 11,168 15,718 20,518 25,222
EBITDA 677 727 1,908 2,201
PAT 388 534 1,146 1,121
Fully Diluted EPS* (Rs.) 2.2 1.5 2.8 2.7
Dividend Per Share (Rs.) 0.2 0.1 0.2 0.2
P/E (times)
22.3 12.3 12.5
EV/EBITDA (times)
21.1 8.1 7.0
* Calculated on Current Face Value of Rs. 1/- per share
SANWARIA AGRO OILS LTD
www.careratings.com 2
EQUIGRADE
Revenues and profitability affected by agricultural commodity cycles; however uptrend in edible oil
consumption to augur well
Since SOAL’s revenue primarily comprises of sales of de-oiled cakes and soya oil (crude and refined), the
company’s revenues are heavily dependent on the soya production and prices which are in turn linked to the
agricultural commodities cycle both domestic and international.
Soya oil is currently in an uptrend; soya oil prices surged in FY11, with refined soya oil prices in March 2011 at
Rs. 63,000/ tonne - around 50% higher y-o-y and crude soya oil prices at Rs 58,300/ tonne - around 45% higher
y-o-y. Although, there may be a slight correction in prices, CARE Equity Research believes the prices are
expected to be on the higher side for the next two years; above the average prices in FY11.
Given, the current demand supply gap of around 9 million tonnes, and a relatively lower per capita
consumption of edible oil at around 14.5 kgs per annum in India, as compared with the world average of 23.9
kgs per annum, demand for edible oil is expected to rise. After considering the capacity additions of around
15,700 TPD expected in the industry by 2013, there will still to be a substantial demand supply gap. The same
is expected to augur well for SOAL’s business.
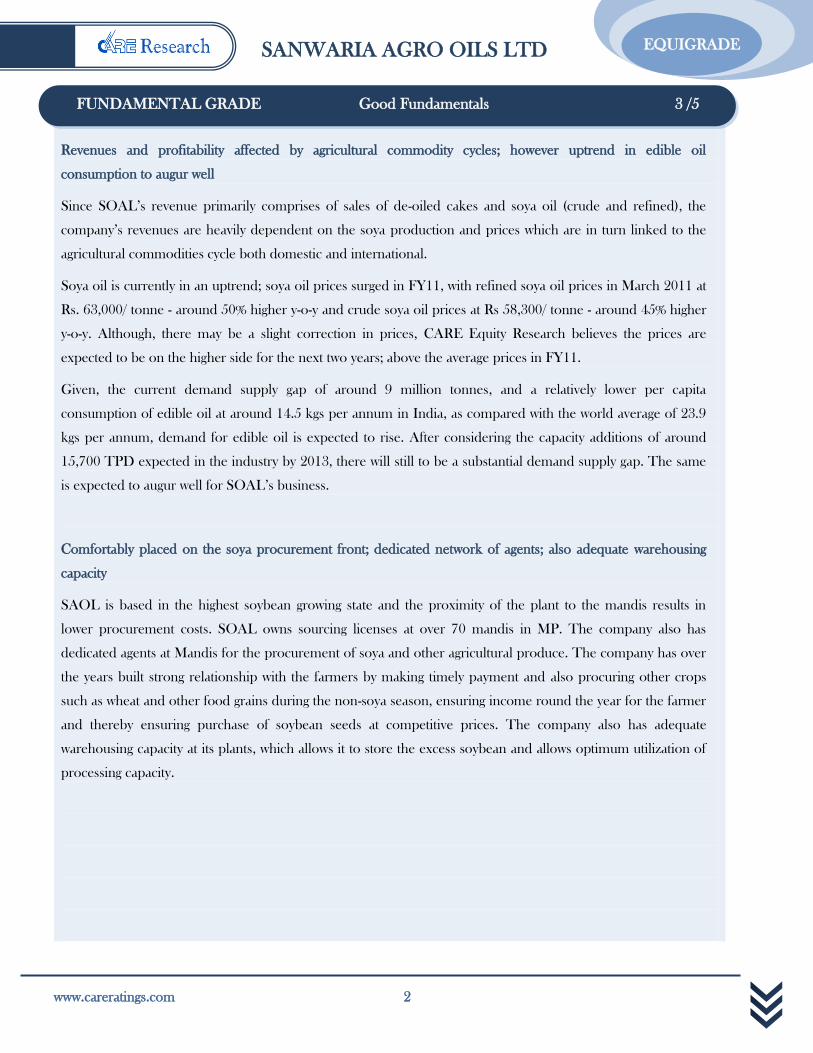
Comfortably placed on the soya procurement front; dedicated network of agents; also adequate warehousing
capacity
SAOL is based in the highest soybean growing state and the proximity of the plant to the mandis results in
lower procurement costs. SOAL owns sourcing licenses at over 70 mandis in MP. The company also has
dedicated agents at Mandis for the procurement of soya and other agricultural produce. The company has over
the years built strong relationship with the farmers by making timely payment and also procuring other crops
such as wheat and other food grains during the non-soya season, ensuring income round the year for the farmer
and thereby ensuring purchase of soybean seeds at competitive prices. The company also has adequate
warehousing capacity at its plants, which allows it to store the excess soybean and allows optimum utilization of
processing capacity.
FUNDAMENTAL GRADE Good Fundamentals 3 /5
SANWARIA AGRO OILS LTD
3 www.careratings.com
EQUIGRADE
SAOL: Raw materials procurement network
Source: Company and CARE Equity Research
Source: Company and CARE Equity Research
Efficient revamp in the distribution channel
SAOL boasts of a very efficient distribution network. SOAL’s distribution channel comprises of C&F agents
who sell goods to distributors and retail outlets, who in turn cater to the final consumer. The company has a
network of 5 C&F agents in Madhya Pradesh, with plans to add another 10 C&F agents, set up depots and add
up to 150 new dealers and distributors in FY12.
SOAL has a tie-up arrangement with big retailers like Hariyali Kisan Bazar, Vishal Retail Ltd, Reliance Fresh
Ltd, Pantaloon Retail Ltd, ITC Choupals, etc. for the sale of its branded oil. With the company planning to
expand into the value added soya products, and other vegetable oils, these tie ups with big retailers will help the
SOAL reach the customer with ease.
SAOL: Distribution system
Source: Company and CARE Equity Research
SANWARIA AGRO OILS LTD
www.careratings.com 4
EQUIGRADE
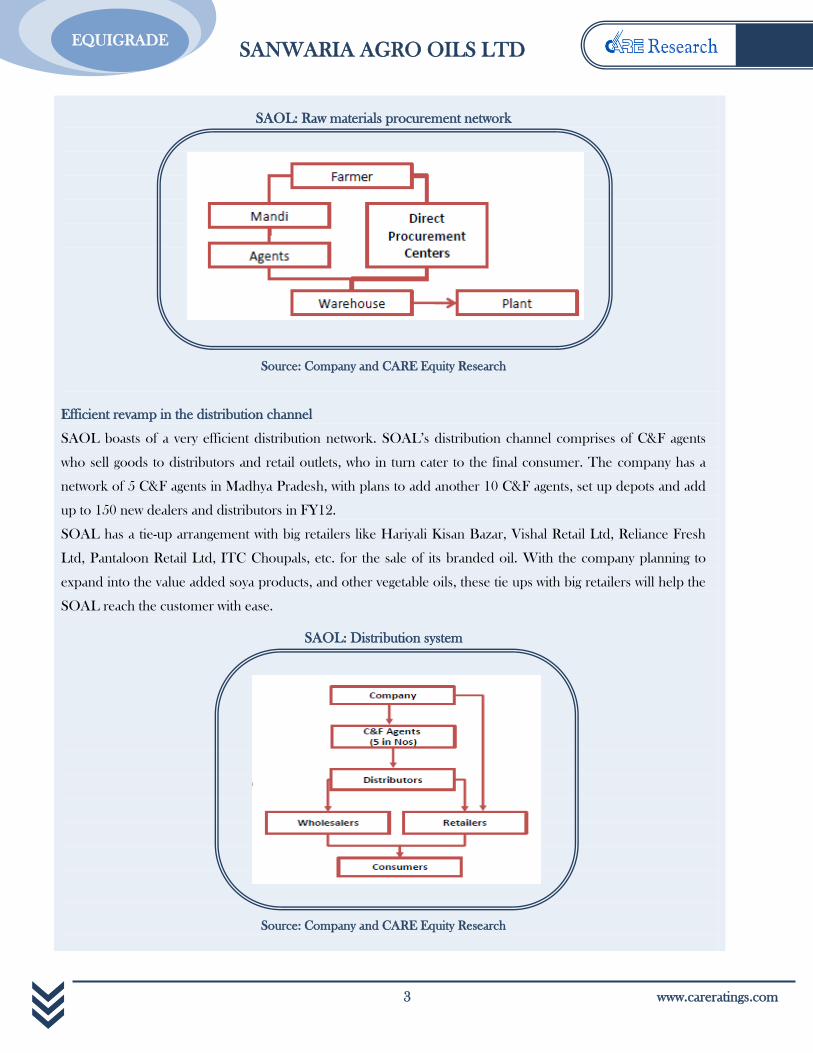
SAOL: Network presence
Source: Company and CARE Equity Research
Expansion directed towards value added products and diversification
SAOL mainly derives its revenues from soya oil and de-oiled cake, the base products in the soya oil chain. The
future expansion is expected to be into value added products such as like Soy Flour, Textured Vegetable
Protein (TVP), etc. These are high margin products in the soya value chain hence their addition in the product
mix; coupled with improvement in the operating rates would help SAOL improve their overall margins in
future. Going forward the company also plans to diversify into Mustard oil extraction, Palm oil refining and
Basmati rice production. Given the seasonal nature of the soybean crop, such additions to the product portfolio
will help SOAL stabilize revenues throughout the year. Mustard being a Rabi crop is perfect complement for
Soya which is a Kharif crop.
SAOL: Capacity trend
Source: Company and CARE Equity Research
SANWARIA AGRO OILS LTD
5 www.careratings.com
EQUIGRADE
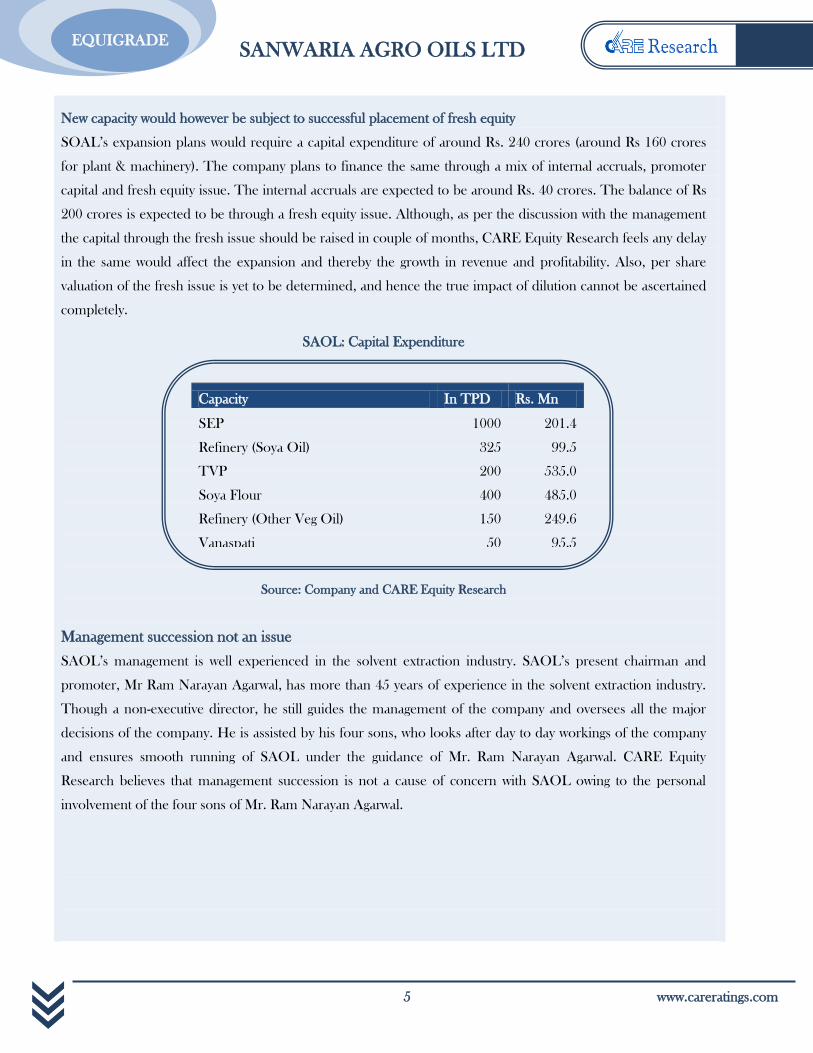
New capacity would however be subject to successful placement of fresh equity
SOAL’s expansion plans would require a capital expenditure of around Rs. 240 crores (around Rs 160 crores
for plant & machinery). The company plans to finance the same through a mix of internal accruals, promoter
capital and fresh equity issue. The internal accruals are expected to be around Rs. 40 crores. The balance of Rs
200 crores is expected to be through a fresh equity issue. Although, as per the discussion with the management
the capital through the fresh issue should be raised in couple of months, CARE Equity Research feels any delay
in the same would affect the expansion and thereby the growth in revenue and profitability. Also, per share
valuation of the fresh issue is yet to be determined, and hence the true impact of dilution cannot be ascertained
completely.
SAOL: Capital Expenditure
Source: Company and CARE Equity Research
Management succession not an issue
SAOL’s management is well experienced in the solvent extraction industry. SAOL’s present chairman and
promoter, Mr Ram Narayan Agarwal, has more than 45 years of experience in the solvent extraction industry.
Though a non-executive director, he still guides the management of the company and oversees all the major
decisions of the company. He is assisted by his four sons, who looks after day to day workings of the company
and ensures smooth running of SAOL under the guidance of Mr. Ram Narayan Agarwal. CARE Equity
Research believes that management succession is not a cause of concern with SAOL owing to the personal
involvement of the four sons of Mr. Ram Narayan Agarwal.
Capacity In TPD Rs. Mn
SEP 1000 201.4
Refinery (Soya Oil) 325 99.5
TVP 200 535.0
Soya Flour 400 485.0
Refinery (Other Veg Oil) 150 249.6
Vanaspati 50 95.5
SANWARIA AGRO OILS LTD
www.careratings.com 6
EQUIGRADE
In compliance with the listing agreement 49
The company has 12 Board of Directors, with 4 of them being Executive, 2 Non-Executive and 6 Non Executive
and Independent Directors. The board has formed 3 sub committees for audit, remuneration and investor
grievances. The audit board has 3 members, all Independent and Non-Executive, headed by Mr. Santosh Kumari
Tiwari. The remuneration and investor grievances committee too has 3 members each and is again formed of
Independent and Non–Executive directors. As per the annual report the same is in compliance with the listing
agreement of the stock exchanges.
SANWARIA AGRO OILS LTD
7 www.careratings.com
EQUIGRADE
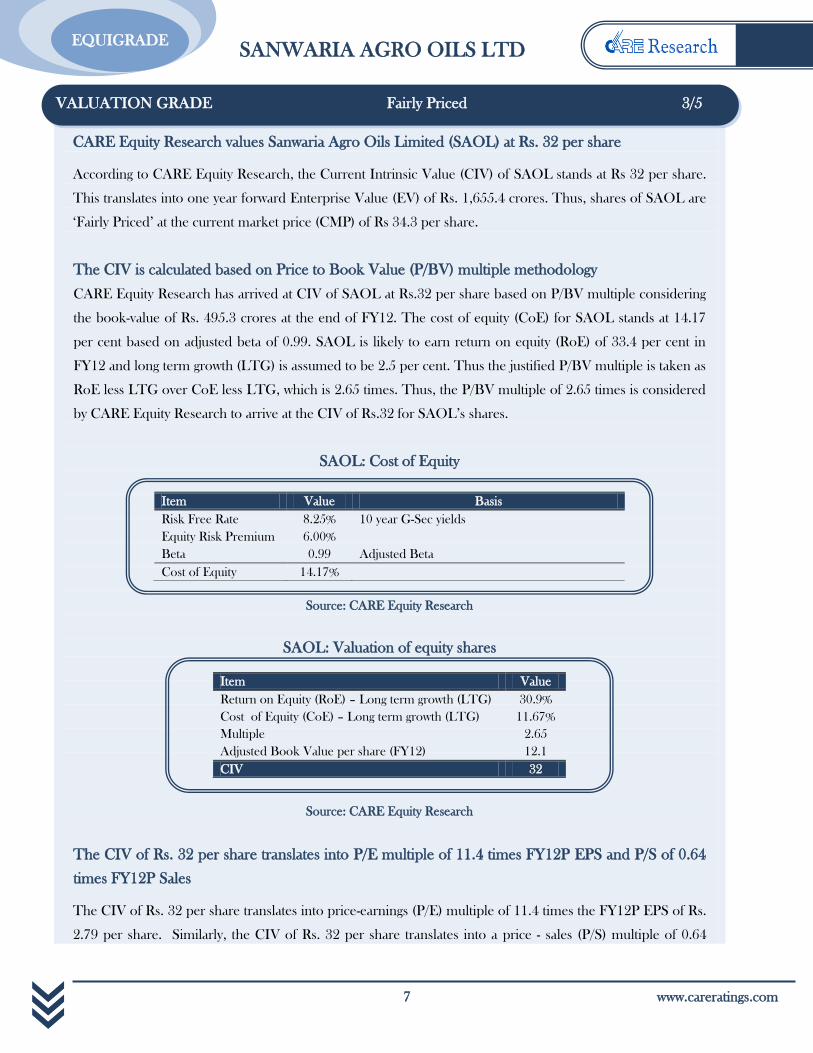
CARE Equity Research values Sanwaria Agro Oils Limited (SAOL) at Rs. 32 per share
According to CARE Equity Research, the Current Intrinsic Value (CIV) of SAOL stands at Rs 32 per share.
This translates into one year forward Enterprise Value (EV) of Rs. 1,655.4 crores. Thus, shares of SAOL are
‘Fairly Priced’ at the current market price (CMP) of Rs 34.3 per share.
The CIV is calculated based on Price to Book Value (P/BV) multiple methodology
CARE Equity Research has arrived at CIV of SAOL at Rs.32 per share based on P/BV multiple considering
the book-value of Rs. 495.3 crores at the end of FY12. The cost of equity (CoE) for SAOL stands at 14.17
per cent based on adjusted beta of 0.99. SAOL is likely to earn return on equity (RoE) of 33.4 per cent in
FY12 and long term growth (LTG) is assumed to be 2.5 per cent. Thus the justified P/BV multiple is taken as
RoE less LTG over CoE less LTG, which is 2.65 times. Thus, the P/BV multiple of 2.65 times is considered
by CARE Equity Research to arrive at the CIV of Rs.32 for SAOL’s shares.
SAOL: Cost of Equity
Source: CARE Equity Research
SAOL: Valuation of equity shares
Source: CARE Equity Research
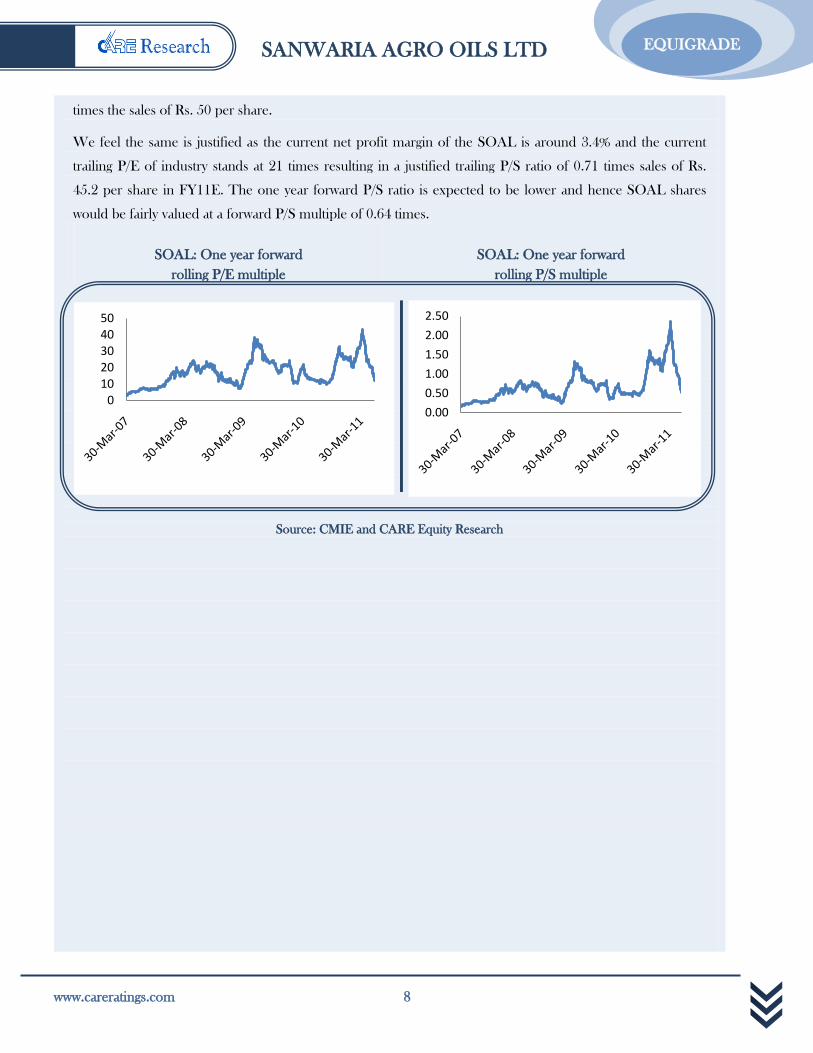
The CIV of Rs. 32 per share translates into P/E multiple of 11.4 times FY12P EPS and P/S of 0.64
times FY12P Sales
The CIV of Rs. 32 per share translates into price-earnings (P/E) multiple of 11.4 times the FY12P EPS of Rs.
2.79 per share. Similarly, the CIV of Rs. 32 per share translates into a price - sales (P/S) multiple of 0.64
VALUATION GRADE Fairly Priced 3/5
Item Value Basis
Risk Free Rate 8.25% 10 year G-Sec yields
Equity Risk Premium 6.00%
Beta 0.99 Adjusted Beta
Cost of Equity 14.17%
Item Value
Return on Equity (RoE) – Long term growth (LTG) 30.9%
Cost of Equity (CoE) – Long term growth (LTG) 11.67%
Multiple 2.65
Adjusted Book Value per share (FY12) 12.1
CIV 32
SANWARIA AGRO OILS LTD
www.careratings.com 8
EQUIGRADE
times the sales of Rs. 50 per share.
We feel the same is justified as the current net profit margin of the SOAL is around 3.4% and the current
trailing P/E of industry stands at 21 times resulting in a justified trailing P/S ratio of 0.71 times sales of Rs.
45.2 per share in FY11E. The one year forward P/S ratio is expected to be lower and hence SOAL shares
would be fairly valued at a forward P/S multiple of 0.64 times.
SOAL: One year forward
rolling P/E multiple
SOAL: One year forward
rolling P/S multiple
Source: CMIE and CARE Equity Research
01020304050
0.00
0.50
1.00
1.50
2.00
2.50
SANWARIA AGRO OILS LTD
9 www.careratings.com
EQUIGRADE
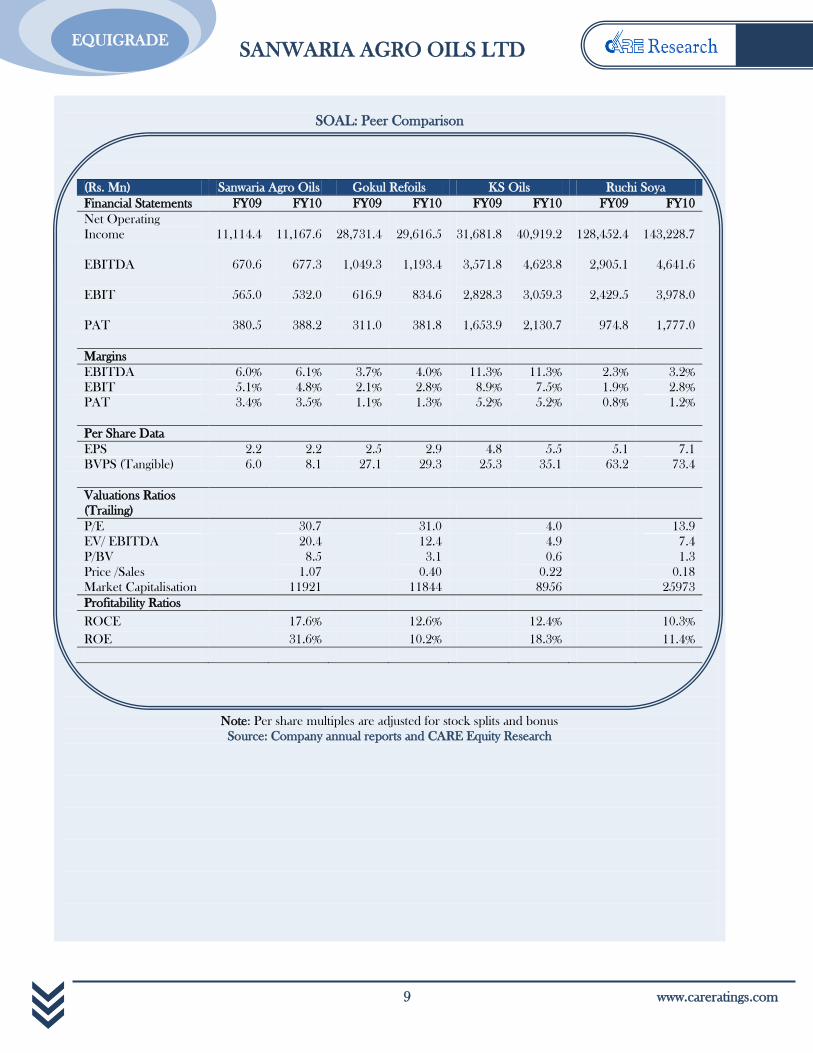
SOAL: Peer Comparison
(Rs. Mn) Sanwaria Agro Oils Gokul Refoils KS Oils Ruchi Soya
Financial Statements FY09 FY10 FY09 FY10 FY09 FY10 FY09 FY10
Net Operating
Income
11,114.4
11,167.6
28,731.4
29,616.5
31,681.8
40,919.2
128,452.4
143,228.7
EBITDA
670.6
677.3
1,049.3
1,193.4
3,571.8
4,623.8
2,905.1
4,641.6
EBIT
565.0
532.0
616.9
834.6
2,828.3
3,059.3
2,429.5
3,978.0
PAT
380.5
388.2
311.0
381.8
1,653.9
2,130.7
974.8
1,777.0
Margins
EBITDA 6.0% 6.1% 3.7% 4.0% 11.3% 11.3% 2.3% 3.2%
EBIT 5.1% 4.8% 2.1% 2.8% 8.9% 7.5% 1.9% 2.8%
PAT 3.4% 3.5% 1.1% 1.3% 5.2% 5.2% 0.8% 1.2%
Per Share Data
EPS 2.2 2.2 2.5 2.9 4.8 5.5 5.1 7.1
BVPS (Tangible) 6.0 8.1 27.1 29.3 25.3 35.1 63.2 73.4
Valuations Ratios
(Trailing)
P/E
30.7
31.0
4.0
13.9
EV/ EBITDA
20.4
12.4
4.9
7.4
P/BV
8.5
3.1
0.6
1.3
Price /Sales
1.07
0.40
0.22
0.18
Market Capitalisation
11921
11844
8956
25973
Profitability Ratios
ROCE 17.6% 12.6% 12.4% 10.3%
ROE 31.6% 10.2% 18.3% 11.4%
Note: Per share multiples are adjusted for stock splits and bonus
Source: Company annual reports and CARE Equity Research
SANWARIA AGRO OILS LTD
www.careratings.com 10
EQUIGRADE
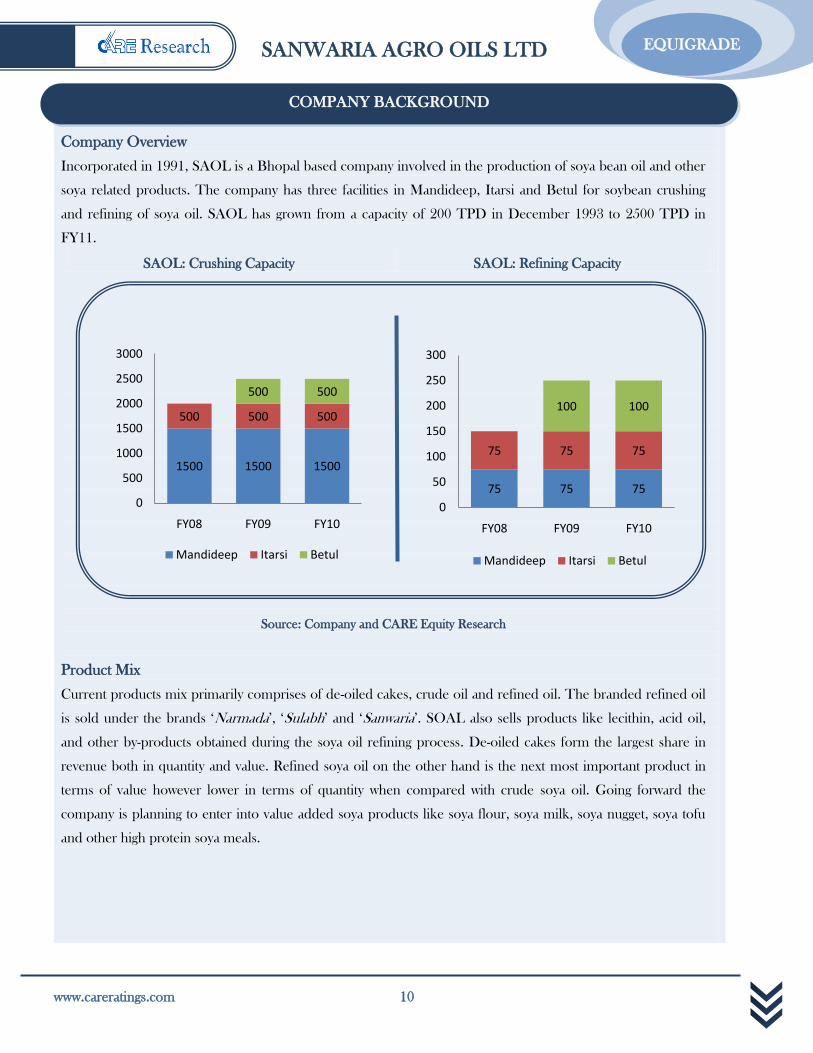
Company Overview
Incorporated in 1991, SAOL is a Bhopal based company involved in the production of soya bean oil and other
soya related products. The company has three facilities in Mandideep, Itarsi and Betul for soybean crushing
and refining of soya oil. SAOL has grown from a capacity of 200 TPD in December 1993 to 2500 TPD in
FY11.
SAOL: Crushing Capacity SAOL: Refining Capacity
Source: Company and CARE Equity Research
Product Mix
Current products mix primarily comprises of de-oiled cakes, crude oil and refined oil. The branded refined oil
is sold under the brands ‘Narmada’, ‘Sulabh’ and ‘Sanwaria’. SOAL also sells products like lecithin, acid oil,
and other by-products obtained during the soya oil refining process. De-oiled cakes form the largest share in
revenue both in quantity and value. Refined soya oil on the other hand is the next most important product in
terms of value however lower in terms of quantity when compared with crude soya oil. Going forward the
company is planning to enter into value added soya products like soya flour, soya milk, soya nugget, soya tofu
and other high protein soya meals.
COMPANY BACKGROUND
1500 1500 1500
500 500 500
500 500
0
500
1000
1500
2000
2500
3000
FY08 FY09 FY10
Mandideep Itarsi Betul
75 75 75
75 75 75
100 100
0
50
100
150
200
250
300
FY08 FY09 FY10
Mandideep Itarsi Betul
SANWARIA AGRO OILS LTD
11 www.careratings.com
EQUIGRADE
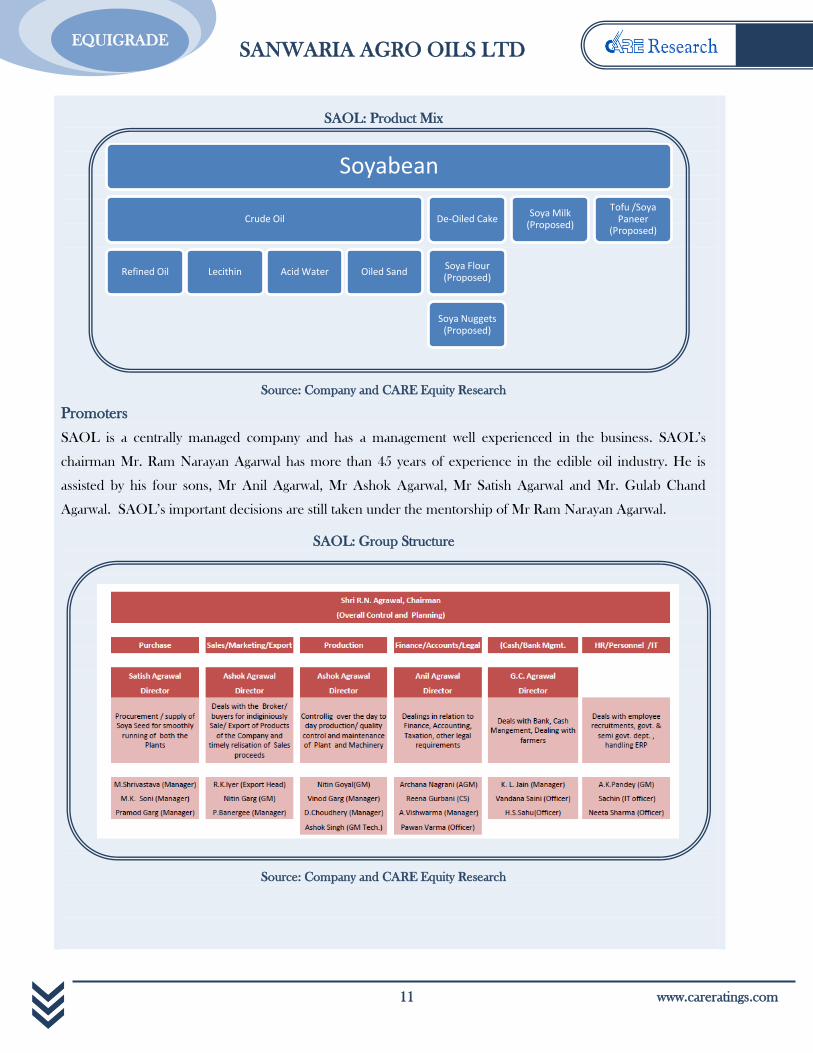
SAOL: Product Mix
Source: Company and CARE Equity Research
Promoters
SAOL is a centrally managed company and has a management well experienced in the business. SAOL’s
chairman Mr. Ram Narayan Agarwal has more than 45 years of experience in the edible oil industry. He is
assisted by his four sons, Mr Anil Agarwal, Mr Ashok Agarwal, Mr Satish Agarwal and Mr. Gulab Chand
Agarwal. SAOL’s important decisions are still taken under the mentorship of Mr Ram Narayan Agarwal.
SAOL: Group Structure
Source: Company and CARE Equity Research
Soyabean
Crude Oil
Refined Oil Lecithin Acid Water Oiled Sand
De-Oiled Cake
Soya Flour (Proposed)
Soya Nuggets (Proposed)
Soya Milk (Proposed)
Tofu /Soya Paneer
(Proposed)
SANWARIA AGRO OILS LTD
www.careratings.com 12
EQUIGRADE
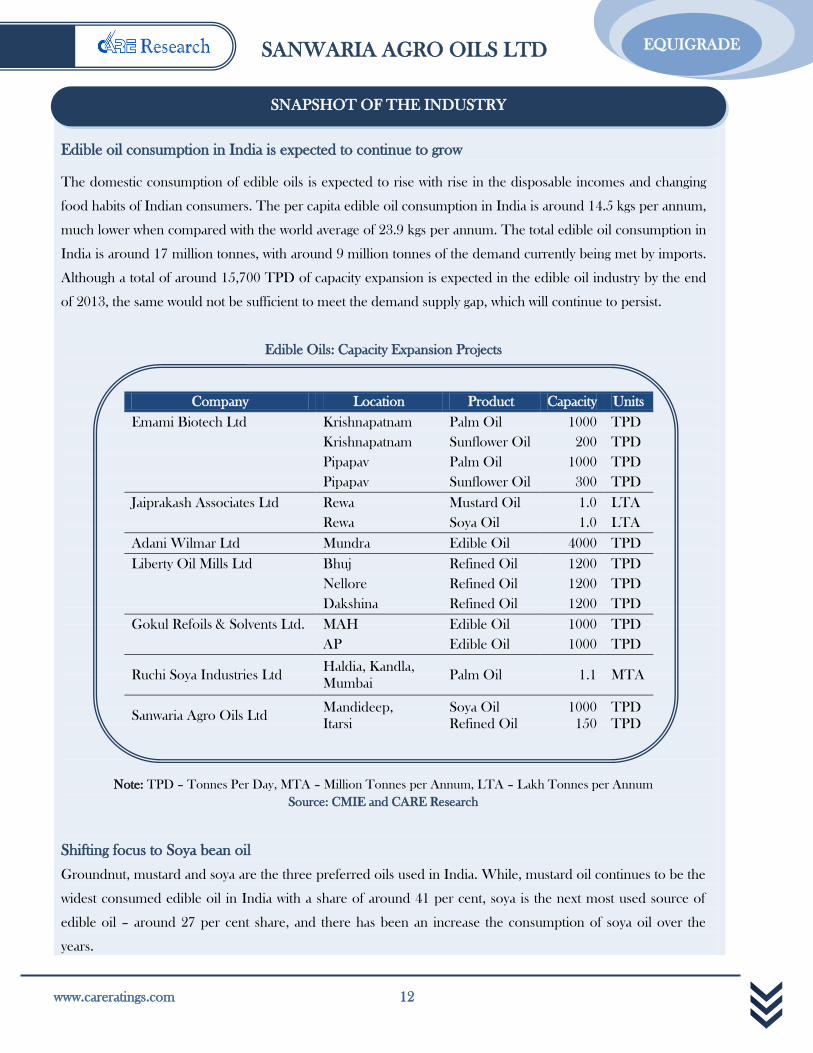
Edible oil consumption in India is expected to continue to grow
The domestic consumption of edible oils is expected to rise with rise in the disposable incomes and changing
food habits of Indian consumers. The per capita edible oil consumption in India is around 14.5 kgs per annum,
much lower when compared with the world average of 23.9 kgs per annum. The total edible oil consumption in
India is around 17 million tonnes, with around 9 million tonnes of the demand currently being met by imports.
Although a total of around 15,700 TPD of capacity expansion is expected in the edible oil industry by the end
of 2013, the same would not be sufficient to meet the demand supply gap, which will continue to persist.
Edible Oils: Capacity Expansion Projects
Note: TPD – Tonnes Per Day, MTA – Million Tonnes per Annum, LTA – Lakh Tonnes per Annum
Source: CMIE and CARE Research
Shifting focus to Soya bean oil
Groundnut, mustard and soya are the three preferred oils used in India. While, mustard oil continues to be the
widest consumed edible oil in India with a share of around 41 per cent, soya is the next most used source of
edible oil – around 27 per cent share, and there has been an increase the consumption of soya oil over the
years.
SNAPSHOT OF THE INDUSTRY
Company Location Product Capacity Units
Emami Biotech Ltd Krishnapatnam Palm Oil 1000 TPD
Krishnapatnam Sunflower Oil 200 TPD
Pipapav Palm Oil 1000 TPD
Pipapav Sunflower Oil 300 TPD
Jaiprakash Associates Ltd Rewa Mustard Oil 1.0 LTA
Rewa Soya Oil 1.0 LTA
Adani Wilmar Ltd Mundra Edible Oil 4000 TPD
Liberty Oil Mills Ltd Bhuj Refined Oil 1200 TPD
Nellore Refined Oil 1200 TPD
Dakshina Refined Oil 1200 TPD
Gokul Refoils & Solvents Ltd. MAH Edible Oil 1000 TPD
AP Edible Oil 1000 TPD
Ruchi Soya Industries Ltd Haldia, Kandla,
Mumbai Palm Oil 1.1 MTA
Sanwaria Agro Oils Ltd Mandideep,
Itarsi
Soya Oil
Refined Oil
1000
150
TPD
TPD
SANWARIA AGRO OILS LTD
13 www.careratings.com
EQUIGRADE
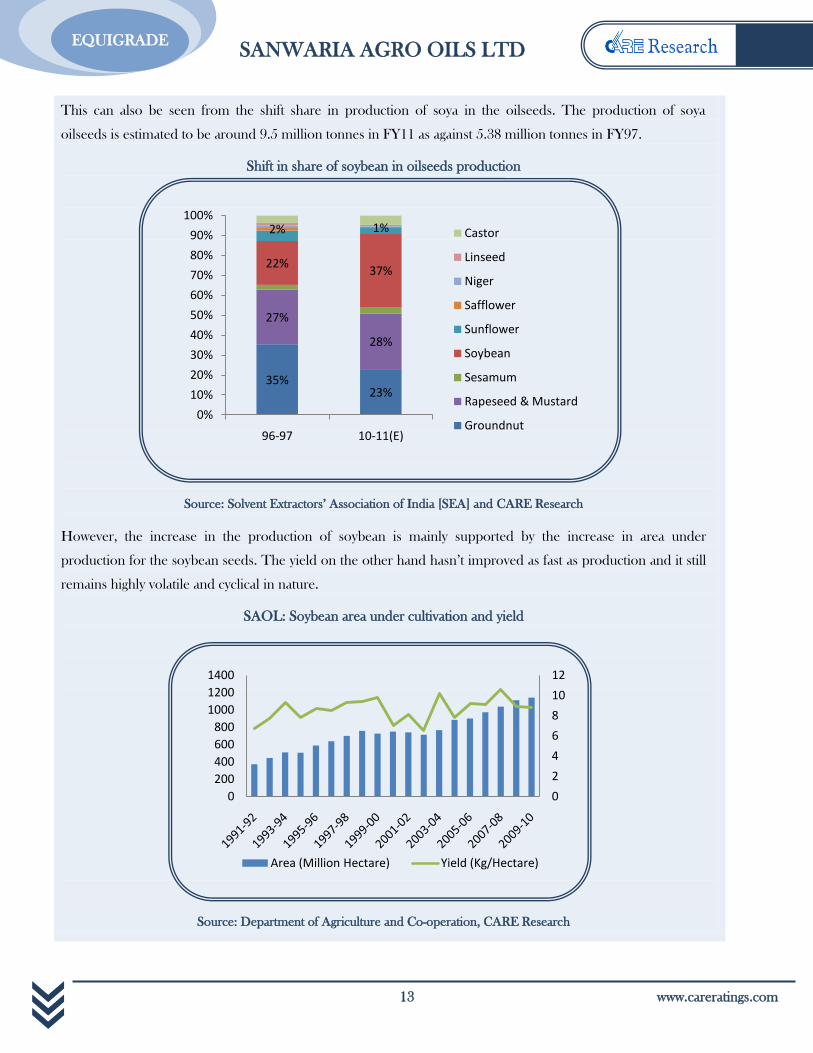
This can also be seen from the shift share in production of soya in the oilseeds. The production of soya
oilseeds is estimated to be around 9.5 million tonnes in FY11 as against 5.38 million tonnes in FY97.
Shift in share of soybean in oilseeds production
Source: Solvent Extractors’ Association of India [SEA] and CARE Research
However, the increase in the production of soybean is mainly supported by the increase in area under
production for the soybean seeds. The yield on the other hand hasn’t improved as fast as production and it still
remains highly volatile and cyclical in nature.
SAOL: Soybean area under cultivation and yield
Source: Department of Agriculture and Co-operation, CARE Research
0
2
4
6
8
10
12
0
200
400
600
800
1000
1200
1400
Area (Million Hectare) Yield (Kg/Hectare)
35%23%
27%
28%
22%37%
2% 1%
0%
10%
20%
30%
40%
50%
60%
70%
80%
90%
100%
96-97 10-11(E)
Castor
Linseed
Niger
Safflower
Sunflower
Soybean
Sesamum
Rapeseed & Mustard
Groundnut
SANWARIA AGRO OILS LTD
www.careratings.com 14
EQUIGRADE
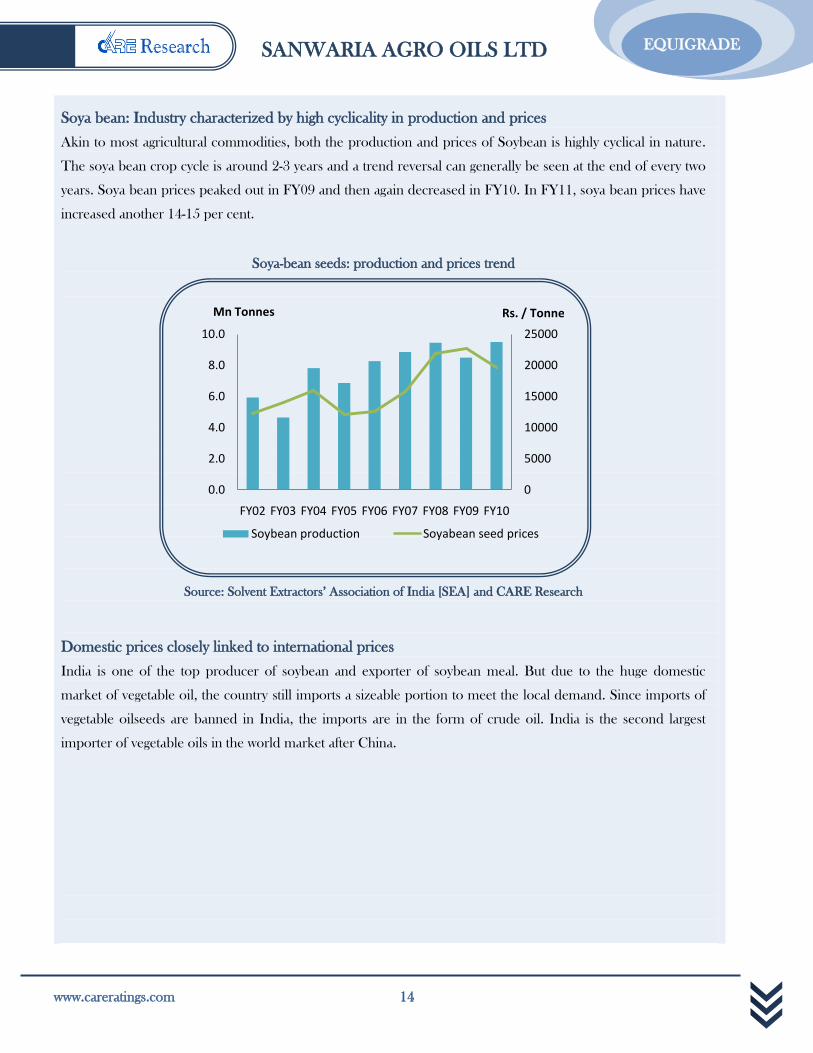
Soya bean: Industry characterized by high cyclicality in production and prices
Akin to most agricultural commodities, both the production and prices of Soybean is highly cyclical in nature.
The soya bean crop cycle is around 2-3 years and a trend reversal can generally be seen at the end of every two
years. Soya bean prices peaked out in FY09 and then again decreased in FY10. In FY11, soya bean prices have
increased another 14-15 per cent.
Soya-bean seeds: production and prices trend
Source: Solvent Extractors’ Association of India [SEA] and CARE Research
Domestic prices closely linked to international prices
India is one of the top producer of soybean and exporter of soybean meal. But due to the huge domestic
market of vegetable oil, the country still imports a sizeable portion to meet the local demand. Since imports of
vegetable oilseeds are banned in India, the imports are in the form of crude oil. India is the second largest
importer of vegetable oils in the world market after China.
0
5000
10000
15000
20000
25000
0.0
2.0
4.0
6.0
8.0
10.0
FY02 FY03 FY04 FY05 FY06 FY07 FY08 FY09 FY10
Rs. / TonneMn Tonnes
Soybean production Soyabean seed prices
SANWARIA AGRO OILS LTD
15 www.careratings.com
EQUIGRADE
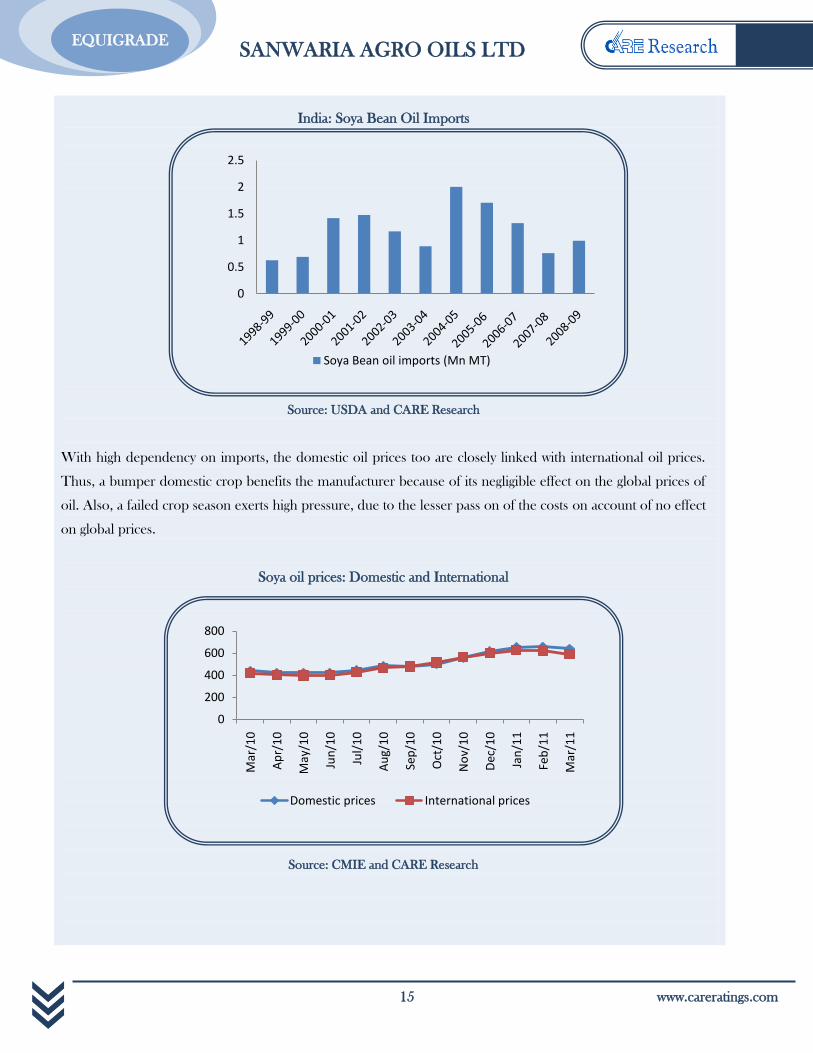
India: Soya Bean Oil Imports
Source: USDA and CARE Research
With high dependency on imports, the domestic oil prices too are closely linked with international oil prices.
Thus, a bumper domestic crop benefits the manufacturer because of its negligible effect on the global prices of
oil. Also, a failed crop season exerts high pressure, due to the lesser pass on of the costs on account of no effect
on global prices.
Soya oil prices: Domestic and International
Source: CMIE and CARE Research
0
0.5
1
1.5
2
2.5
Soya Bean oil imports (Mn MT)
0
200
400
600
800
Mar
/10
Ap
r/1
0
May
/10
Jun
/10
Jul/
10
Au
g/1
0
Sep
/10
Oct
/10
No
v/1
0
Dec
/10
Jan
/11
Feb
/11
Mar
/11
Domestic prices International prices
SANWARIA AGRO OILS LTD
www.careratings.com 16
EQUIGRADE
TVP: the road ahead
Textured Vegetable Protein or TVP as a product is fast picking up in India. TVP is made from the de-oiled
cake which is a left over after the oil is extracted from the soya seeds. The TVP trades around Rs 35,000 /tonne
making it almost one half of the price of the Soya Refined oil. In soya bean oil extraction process, around 18
per cent of the weight of the seeds is extracted as oil and remaining 82 per cent is processed for de-oiled cake.
Thus, the revenues from de-oiled cake and TVP are generally around 60 per cent of the total revenues of a
soya bean oil manufacturer. TVP is also a very high margin and profitable business for a soya bean oil
manufacturer. Most of the soya oil manufacturers are now foraying into TVP segment due to the high
profitability and its increasing consumption trend in India.
SANWARIA AGRO OILS LTD
17 www.careratings.com
EQUIGRADE
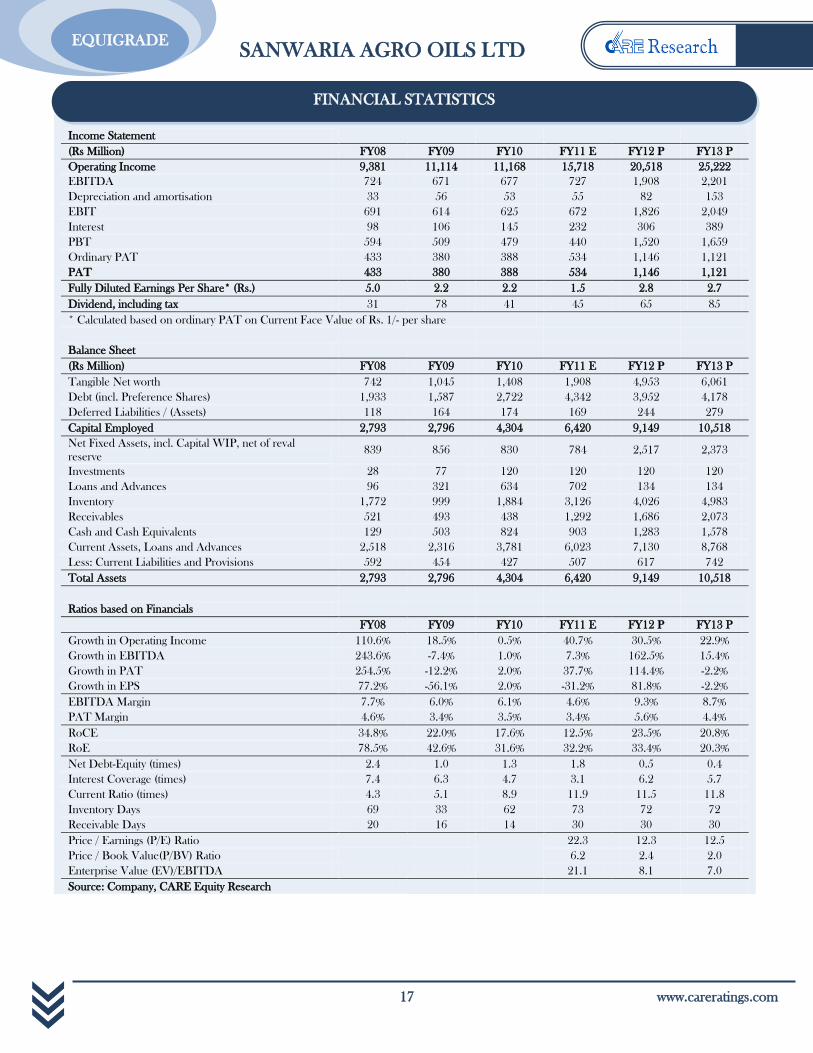
Income Statement
(Rs Million) FY08 FY09 FY10 FY11 E FY12 P FY13 P
Operating Income 9,381 11,114 11,168 15,718 20,518 25,222
EBITDA 724 671 677 727 1,908 2,201
Depreciation and amortisation 33 56 53 55 82 153
EBIT 691 614 625 672 1,826 2,049
Interest 98 106 145 232 306 389
PBT 594 509 479 440 1,520 1,659
Ordinary PAT 433 380 388 534 1,146 1,121
PAT 433 380 388 534 1,146 1,121
Fully Diluted Earnings Per Share* (Rs.) 5.0 2.2 2.2 1.5 2.8 2.7
Dividend, including tax 31 78 41 45 65 85
* Calculated based on ordinary PAT on Current Face Value of Rs. 1/- per share
Balance Sheet
(Rs Million) FY08 FY09 FY10 FY11 E FY12 P FY13 P
Tangible Net worth 742 1,045 1,408 1,908 4,953 6,061
Debt (incl. Preference Shares) 1,933 1,587 2,722 4,342 3,952 4,178
Deferred Liabilities / (Assets) 118 164 174 169 244 279
Capital Employed 2,793 2,796 4,304 6,420 9,149 10,518
Net Fixed Assets, incl. Capital WIP, net of reval
reserve 839 856 830 784 2,517 2,373
Investments 28 77 120 120 120 120
Loans and Advances 96 321 634 702 134 134
Inventory 1,772 999 1,884 3,126 4,026 4,983
Receivables 521 493 438 1,292 1,686 2,073
Cash and Cash Equivalents 129 503 824 903 1,283 1,578
Current Assets, Loans and Advances 2,518 2,316 3,781 6,023 7,130 8,768
Less: Current Liabilities and Provisions 592 454 427 507 617 742
Total Assets 2,793 2,796 4,304 6,420 9,149 10,518
Ratios based on Financials
FY08 FY09 FY10 FY11 E FY12 P FY13 P
Growth in Operating Income 110.6% 18.5% 0.5% 40.7% 30.5% 22.9%
Growth in EBITDA 243.6% -7.4% 1.0% 7.3% 162.5% 15.4%
Growth in PAT 254.5% -12.2% 2.0% 37.7% 114.4% -2.2%
Growth in EPS 77.2% -56.1% 2.0% -31.2% 81.8% -2.2%
EBITDA Margin 7.7% 6.0% 6.1% 4.6% 9.3% 8.7%
PAT Margin 4.6% 3.4% 3.5% 3.4% 5.6% 4.4%
RoCE 34.8% 22.0% 17.6% 12.5% 23.5% 20.8%
RoE 78.5% 42.6% 31.6% 32.2% 33.4% 20.3%
Net Debt-Equity (times) 2.4 1.0 1.3 1.8 0.5 0.4
Interest Coverage (times) 7.4 6.3 4.7 3.1 6.2 5.7
Current Ratio (times) 4.3 5.1 8.9 11.9 11.5 11.8
Inventory Days 69 33 62 73 72 72
Receivable Days 20 16 14 30 30 30
Price / Earnings (P/E) Ratio
22.3 12.3 12.5
Price / Book Value(P/BV) Ratio
6.2 2.4 2.0
Enterprise Value (EV)/EBITDA
21.1 8.1 7.0
Source: Company, CARE Equity Research
FINANCIAL STATISTICS
SANWARIA AGRO OILS LTD
www.careratings.com 18
EQUIGRADE
CARE Equigrade Grid (CEG)
Through CEG, CARE Equity Research addresses two critical factors considered by an investor while investing in a
particular company’s equity shares:
1. Fundamentals: Whether the company is fundamentally sound with respect to its business, its financial position, its
management and its prospects.
2. Valuation: What is the Current Intrinsic Value (CIV) of the stock and how it compares vis-a-vis its Current
Market Price (CMP)
These factors are answered assigning quantitative grades to both these parameters. CEG is the snapshot of
‘Fundamental Grade’ and ‘Valuation Grade’ assigned by CARE Equity Research.
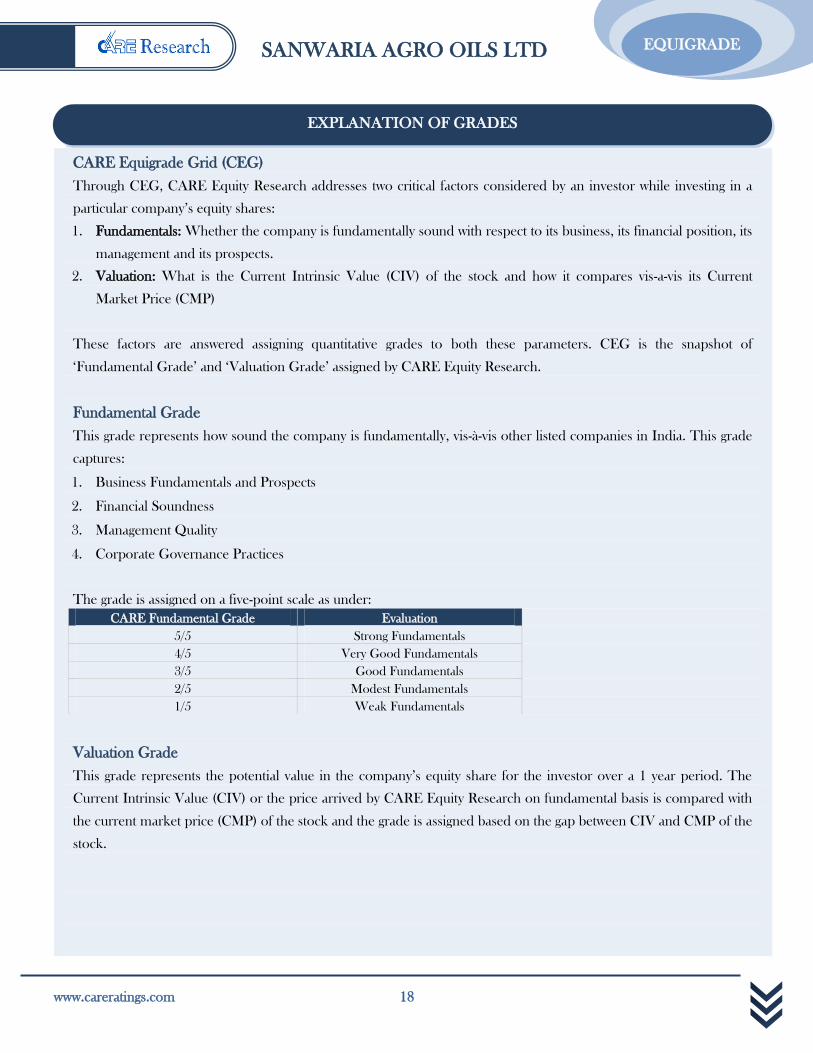
Fundamental Grade
This grade represents how sound the company is fundamentally, vis-à-vis other listed companies in India. This grade
captures:
1. Business Fundamentals and Prospects
2. Financial Soundness
3. Management Quality
4. Corporate Governance Practices
The grade is assigned on a five-point scale as under:
CARE Fundamental Grade Evaluation
5/5 Strong Fundamentals
4/5 Very Good Fundamentals
3/5 Good Fundamentals
2/5 Modest Fundamentals
1/5 Weak Fundamentals
Valuation Grade
This grade represents the potential value in the company’s equity share for the investor over a 1 year period. The
Current Intrinsic Value (CIV) or the price arrived by CARE Equity Research on fundamental basis is compared with
the current market price (CMP) of the stock and the grade is assigned based on the gap between CIV and CMP of the
stock.
EXPLANATION OF GRADES
SANWARIA AGRO OILS LTD
19 www.careratings.com
EQUIGRADE
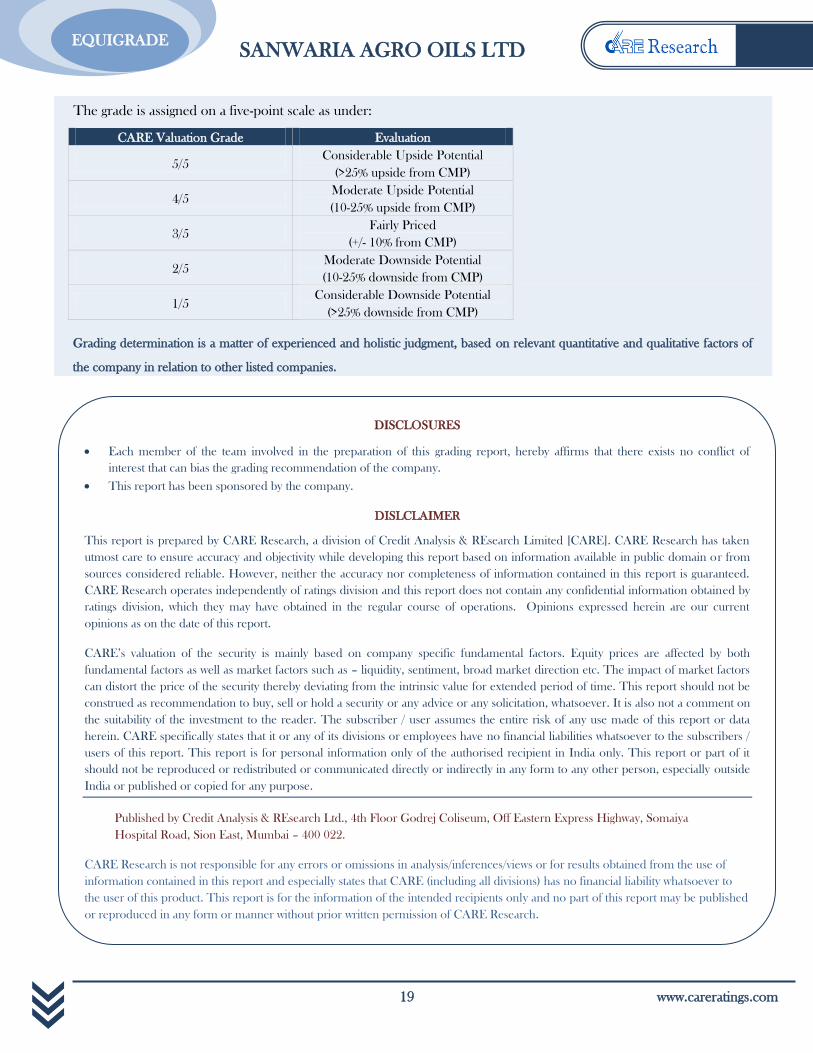
The grade is assigned on a five-point scale as under:
CARE Valuation Grade Evaluation
5/5 Considerable Upside Potential
(>25% upside from CMP)
4/5 Moderate Upside Potential
(10-25% upside from CMP)
3/5 Fairly Priced
(+/- 10% from CMP)
2/5 Moderate Downside Potential
(10-25% downside from CMP)
1/5 Considerable Downside Potential
(>25% downside from CMP)
Grading determination is a matter of experienced and holistic judgment, based on relevant quantitative and qualitative factors of
the company in relation to other listed companies.
DISCLOSURES
Each member of the team involved in the preparation of this grading report, hereby affirms that there exists no conflict of
interest that can bias the grading recommendation of the company.
This report has been sponsored by the company.
DISLCLAIMER
This report is prepared by CARE Research, a division of Credit Analysis & REsearch Limited [CARE]. CARE Research has taken
utmost care to ensure accuracy and objectivity while developing this report based on information available in public domain or from
sources considered reliable. However, neither the accuracy nor completeness of information contained in this report is guaranteed.
CARE Research operates independently of ratings division and this report does not contain any confidential information obtained by
ratings division, which they may have obtained in the regular course of operations. Opinions expressed herein are our current
opinions as on the date of this report.
CARE’s valuation of the security is mainly based on company specific fundamental factors. Equity prices are affected by both
fundamental factors as well as market factors such as – liquidity, sentiment, broad market direction etc. The impact of market factors
can distort the price of the security thereby deviating from the intrinsic value for extended period of time. This report should not be
construed as recommendation to buy, sell or hold a security or any advice or any solicitation, whatsoever. It is also not a comment on
the suitability of the investment to the reader. The subscriber / user assumes the entire risk of any use made of this report or data
herein. CARE specifically states that it or any of its divisions or employees have no financial liabilities whatsoever to the subscribers /
users of this report. This report is for personal information only of the authorised recipient in India only. This report or part of it
should not be reproduced or redistributed or communicated directly or indirectly in any form to any other person, especially outside
India or published or copied for any purpose.
Published by Credit Analysis & REsearch Ltd., 4th Floor Godrej Coliseum, Off Eastern Express Highway, Somaiya
Hospital Road, Sion East, Mumbai – 400 022.
CARE Research is not responsible for any errors or omissions in analysis/inferences/views or for results obtained from the use of
information contained in this report and especially states that CARE (including all divisions) has no financial liability whatsoever to
the user of this product. This report is for the information of the intended recipients only and no part of this report may be published
or reproduced in any form or manner without prior written permission of CARE Research.
SANWARIA AGRO OILS LTD
www.careratings.com 20
EQUIGRADE
Credit Analysis & REsearch Ltd. (CARE) is a full service rating company that offers a wide range of rating and grading services
across sectors. CARE has an unparallel depth of expertise. CARE Ratings methodologies are in line with the best international
practices.
CARE Research
CARE Research is an independent research division of CARE Ratings, a full service rating company. CARE Research is
involved in preparing detailed industry research reports with 5 year demand and 2 year profitability outlook on the industry
besides providing comprehensive trend analysis and the current state of the industry. CARE Research also offers research that
is customised to client requirements. CARE Research currently offers reports on more than 21 industries that include Cement,
Steel, Aluminium, Construction, Shipping, Ship-building, Commercial Vehicles, Two-Wheelers, Tyres, Auto Components,
Pipes, Natural Gas, Retail, Sugar, etc. CARE Research offers independent research of equities through its product
‘EQUIGRADE’. CARE Research now offers city specific grading of real estate projects through its product 'CARE Real Estate
Project Star Ratings’
CREDIT ANALYSIS & RESEARCH LTD
HEAD OFFICE |Mr. P. N. Satheeskumar | Cell: +91-9820416004 | Tel: +91-22-6754 3555 | E-mail:
4th Floor, Godrej Coliseum, Somaiya Hospital Road, Off Eastern Express Highway, Sion (East), Mumbai - 400 022 |
Tel: +91-022- 6754 3456 | E-mail: [email protected] | Fax: +91-022- 6754 3457
KOLKATA | Mr. Sukanta Nag | Cell: +91-98311 70075 | Tel: +91-33- 2283 1800/ 1803, 2280 8472 |
E- mail: [email protected] | 3rd Flr., Prasad Chambers (Shagun Mall Bldg), 10A, Shakespeare Sarani, Kolkata -700 071
CHENNAI | Mr. V Pradeep Kumar | Cell: +91 9840754521 | Tel: +91-44-2849 7812/2849 0811 | Fax: +91-44-2849 0876 |
Email: [email protected] | Unit No. O-509/C, Spencer Plaza, 5th Floor, No. 769, Anna Salai, Chennai - 600 002
AHMEDABAD | Mr. Mehul Pandya | Cell: +91-98242 56265 | Tel: +91-79-40265656 | Fax: +91-79-40265657 |
E-mail:[email protected] | 32, Titanium, Prahaladnagar Corporate Road, Satellite, Ahmedabad - 380 015.
NEW DELHI | Ms. Swati Agrawal | Cell: +91-98117 45677 | Tel: +91- 11- 2331 8701/ 2371 6199 |
E-mail: [email protected] | 3rd Floor, B -47, Inner Circle, Near Plaza Cinema, Connaught Place, New Delhi - 110 001.
BANGALORE | Mr. G. Sundara Vathanan | Cell: +91 98860 24430 | Tel:+91-80-2211 7140 |
E-mail: [email protected] | Unit No. 8, I floor, Commander's Place, No. 6, Raja Ram Mohan Roy Road,
(Opp. P F Office), Richmond Circle, Bangalore - 560 025.
HYDERABAD | Mr. Ashwini Kumar Jani | Cell: +91-91766 47599 | Tel: +91-40-40102030 |
E-mail: [email protected] | 401, Ashoka Scintilla | 3-6-520, Himayat Nagar | Hyderabad - 500 029
ABOUT CARE
![Supply Chain Management and Store Operation in Pantaloon Retail India Pvt[1]. Ltd Pantaloon](https://img.pdfslide.us/doc/110x75/55721004497959fc0b8ca3ea/supply-chain-management-and-store-operation-in-pantaloon-retail-india-pvt1-ltd-pantaloon.jpg)