Embed Size (px)
Citation preview

FUNDAMENTALS OF
RELIABILITY ANALYSIS

Risk in M-T-E system
Man
Technology Environment
measure
hazard
measure
ityunreliabil
measure
risk

Basic terms and concepts
Undesirable event is an event, which occurrence, in
the considered M-T-E system, could result in hazard
exposure for humans or property.
Failure is an undesirable event occurring in the M-T
sub-system.
The unit’s Failure is an event disabling physical or
agreed upon performance of specific functions.
Defect, fault, damage

Reliability
Reliability – ability of a unit to function properly during a
specified period of time without failure.
A M-T System
A man (e.g. operator)
A group of people
A technical object
An assembly of a technical object
A component of an object
…
UNIT
item

Reliability
characteristics in the unit under investigation
of the ability to achieve specified requirements
under given conditions in specified time
”Reliability is quality based on time”

State of the unit
functioning state, failure state
Functioning time -
Regenerating time -
Service life - trw
not functioning

Course of a unit operation process
non-reparable unit
Functioning time -
Service life - trw

Course of a unit operation process
reparable unit
Functioning time -
Regenerating time -
Service life - trw

RELIABILITY MEASURES
R(t) = P{T > t}
Examples of unit’s functioning time until failure
Reliability function
(survival probability)

Reliability function
R(t) = P{T > t}
Q(t) = 1 – R(t)
on
)(b1)(R̂
tt estimator of reliability function
no – sample size (number of all units)
b(t) – number of failed units until time t
Q(t) = P{T t}

Failure rate
Failure rate is the probability of failure in small time
interval (a unit of time) following the time t, assuming
that in time t the unit is functioning
functioning time
without failure
Failure rate expresses the proneness of the unit
to fail at time (age) t

Empirical failure rate

Failure rate
Conditional probability
)()(
)(
)(
)()(
)(
)()(
ttR
tf
tRt
tQttQ
tP
tttPtttP
tt
1
11
T
TTT
t
dssftQ0
)()(
when t 0
t
tQtf
d
)(d)(
Q(s)
Failures per unit time referred to remaining products

Typical failure rate
Failure intensity of a technical object (unit)
”Bath-tub shape”

Failure phases

Exponential distribution
Probability density curve for = const.
t
t
e
e
tR
tft
)(
)()(
;1
;
;1
ET
etf
etQ
etR
t
t
t

Failure rate
t
ττ
0)(d
etR
when = const t)( etR
)(ln)(
)(
)(
)(
)(
)(
)(
)()(
tRdt
d
tRdt
tdR
tRdt
tRd
tRdt
tdQ
tR
tft
1
111

Example
Failure rate of a gearbox is constant (the unit is not
ageing) and is 10-5 [1/h].
Service life of the gearbox 10 000 [h].
What is the probability of the gearbox functioning
without failure in:
• First 100 h
• Service life
• Last 100 h
0,999
0,9048
0,999
t)( etR
99900010100000010 ,)( ,, eetR

Estimator of failure rate
n(t) – sample size in time t
b(t,t+t) – number of units, that failed in period (t,t+t)
ttn
tttbt
),(̂
functioning time
without failure

A course of failure rate
Death intensity (fatality rate) for men (— 1978, --- 1994)
and women (— 1978, 1994) in Poland
Age (years)

Time-to-failure
T – random variable,
in reliability analysis time-to failure

MTTF & MTBF
Statistically expected lifetime (service life)
(mean service life)
00
)()( dttRdttftEΤ
ET is called Mean Time To Failure
for non-reparable units
for reparable units
ET is called Mean Time Between Failures

Reliability measures characteristic
for reparable units
Availability – important feature
of hazard counteraction systems
(e.g. rescue system)
Steady-state Availability A – probability that a unit
will be available (in functioning state) when required
ET i E – expected (mean) values for the state of functioning
and the state of failure
θT
T
EE
EA

Limiting availability
ii
ii
MTTRMTBF
MTBFA
For ith component (unit)
MTBF – Mean Time Between Failures
MTTR – Mean Time To Repair
ilityMaintainabtyRelaiabili
tyRelaiabilityAvailabili

MTTF = 12, = 0.083 [1/year]
0
0,1
0,2
0,3
0,4
0,5
0,6
0,7
0,8
0,9
1
0 5 10 15 20
R(t)
time (years)
12t
e
Exercise
It has been observed, that mean time of service for a device is 12 years. It is known that the failure rate for this device is constant.
Find the following:
reliability of the device in 5 years
time, when the reliability drops to 0,5
R(5) = 0.66
t (0.5) = 8.32 years

RELIABILITY STRUCTURE
Reliability structure defines dependence
of the unit’s reliability from reliability of its
components
Methods of reliability structure presentation:
• block diagrams
• fault trees
(Systems reliability models)

RELIABILITY BLOCK DIAGRAMS
Basic reliability structures:
series
parallel
„k-out-of-m”
redundancy

Series structure
T, Ti (i = 1, 2, ..., m)
Examples: ..., worker-lathe, group of people doing particular task, ...
m
i
t1
i )(R R(t)

Example of a series structure
Example:
5 identical light bulbs with ETi =100 h
ET = 100/5 = 20 h m
ET ET i
m
Fails when the first component fails

Parallel structure
m
i
t1
iQ Q(t) )(
if random variables Ti are independent

Example of a parallel structure
Example:
5 identical light bulbs with ETi =100 h
ET = 100(1+1/2+1/3+1/4+1/5) = 228 h
m ET ET
i
1 ...
4
1
3
1
2
1 1 m
Fails when all components fail

Structure with redundancy
unites in reserve
basic unit
Standby redundancy
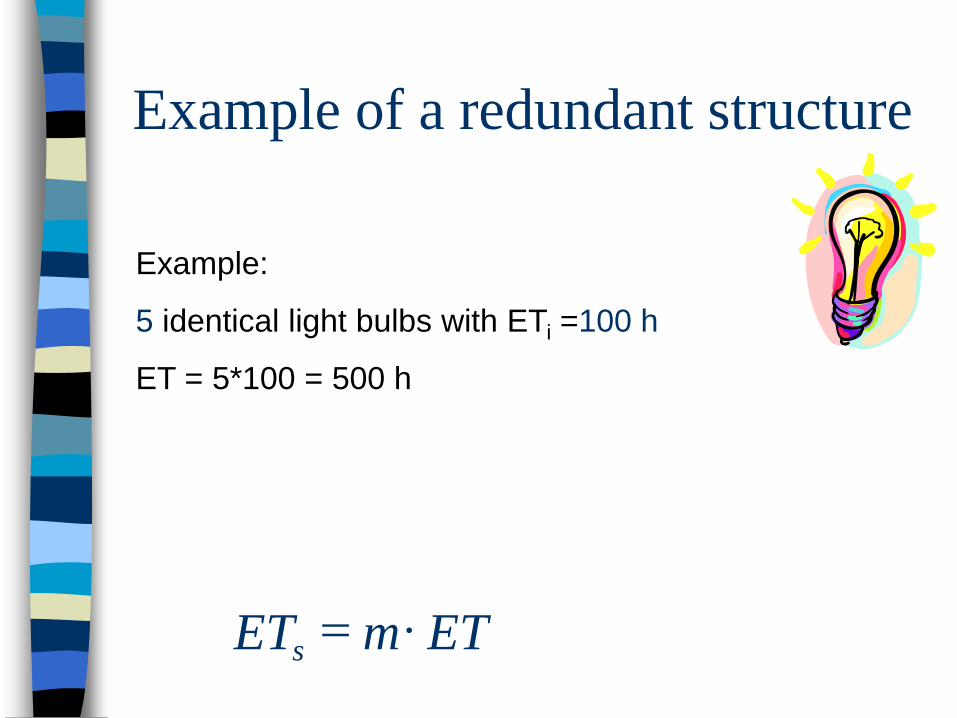
Example of a redundant structure
Example:
5 identical light bulbs with ETi =100 h
ET = 5*100 = 500 h
ET m ET s

Structure with redundancy
unites in reserve
basic unit
Active redundancy = parallel system
Reduced redundancy
Examples: ...; systems, where failures may cause considerable
damage (large chemical installations, nuclear plants, rescue systems)

Exercise
Reliability of an unmanned aerial vehicle (aircraft) have
to exceed 0.99 during the mission time of 10 hours.
What should be the mean time to failure (MTTF), if the
exponential distribution of T is assumed?
R(10) 0.99
ET =1/ 995 h

Exercise
Series reliability system is composed of identical
items. At time tk reliability of the items is R(tk)=0.96.
How many elements could be in the system, when
it is required that the system reliability is
Rs(tk)>=0.8?
m = ?
m = 5.47, m = 5

FUNDAMENTALS OF
RELIABILITY ANALYSIS
MODELLING

Modelling procedure
of an item reliability structure
1. Decomposition of the item
2. Determination of the item failure criterion
(definition of failure)
3. Selection of a reliability structure
assemblies
sub-assemblies
components
fragments of components
decom
positio
n d
epth
item

TREE METHODS
IN RISK ANALYSIS
To describe & analyse
unreliability
hazard
unreliability fault tree
hazard event tree
risk

Fault tree method
Fault tree – logical diagram which shows the relation
between item failure, i.e. a specific undesirable event in the
system, and failures of the components of the system
The most important symbols of events and gates:
a) ”or” gate, b) ”and” gate, c) basic (input) event, d) description of
event (”comment” rectangle), e) transfer symbol, f) undeveloped
event

AND gate logical product
an event A
The output event A occurs if all input events (faults) occur

OR gate logical sum
an event A
The output event A occurs if at least one of the input events
(faults) occurs
if then

Example
of a fault tree construction
chemical installation
1 – temperature sensor
2 – thermo regulator
3 – wire connection
Choice of the top event (undesirable event) A(k), which probability Q(k)(1) is to be evaluated
A(k) = (T > Tacc )
process tank
valve
heater

Example of a fault tree
upper temperature
limit exceeded
no
connection
(3)
no
contact
in junctions
with (1)
or (2)
broken
wire
heater
is not switched off
by the regulator
(2)
wrong reading
of the temperature
sensor (1)

The fault tree continued
the liquid
level too low reduced heat
transfer to sensor
deposit
on the
sensor
cooling by
the mounting
under-filling
of the tank dropping of
the liquid level
no
control wrong
functioning
of the filling
syst. leakage leakage
not
detected

Fault tree
description of the reliability structure
Advantages:
both graphical and verbal information
contains undesirable events, that can occur in
the system and its components
more detailed description of the system reliability

The fault tree method is applied in:
qualitative risk analysis, carried out to eliminate
causes of failures,
quantitative reliability evaluation and analysis,
evaluation and analysis of risk
likelihood of events
on the tree lowest level

Event tree method
Event tree – a diagram showing chronological chain
of events, important for the system functioning,
occurring after a chosen event (fault).
An event tree for
chemical installation

Hazard modelling using event trees
Example
k – number of the event tree sequences,
q(k) – probability of the v-th sequence occurrence

Example
An example of top
event probability
calculation
collapse
of a shop roof
roof overload collapse
due to
design
error
very
strong
wind
snow layer
too deep
human
error
abnormal
snowfall
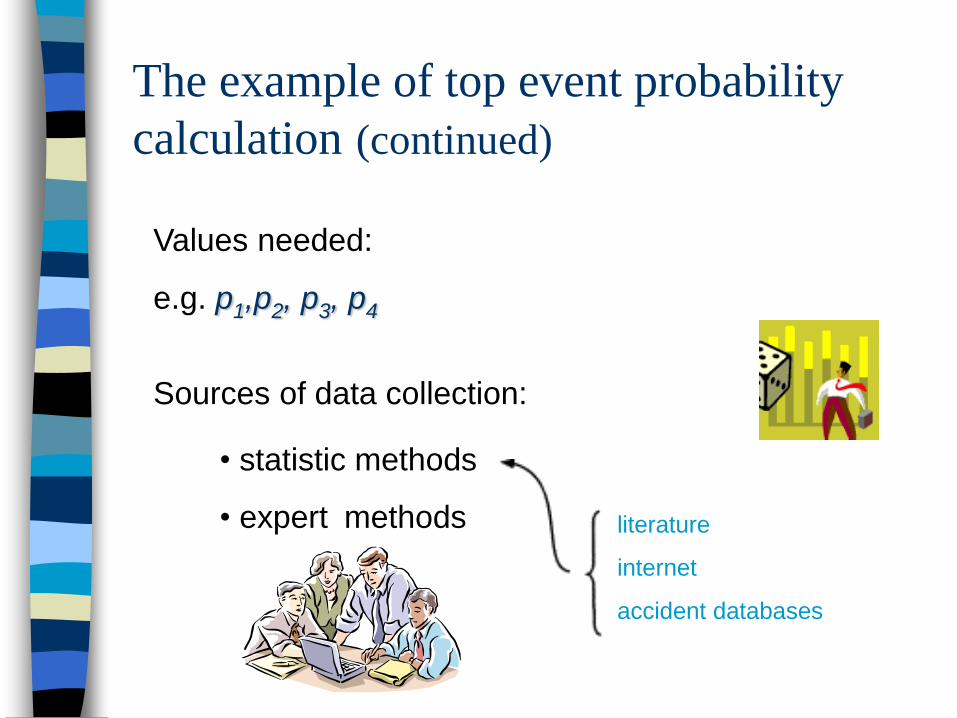
The example of top event probability
calculation (continued)
Values needed:
e.g. p1,p2, p3, p4
Sources of data collection:
• statistic methods
• expert methods literature
internet
accident databases

The example of top event probability
calculation (continued)
E.g.
p1 = 0.008 = 810-3 per 1 year
p2 = 0.10
p3 = 0.005 = 510-3 per 1 year
p4= 0.020 = 2010-3 per 1 year
Q(1) = p1 + p2p3 + p4 = 810-3 + 0,5 10-3 +2010-3 = 28.510-3

Use of tree methods
in risk modelling and analysis
Hazard
modelling
area
(event tree)
Reliability
modelling
area
(Fault trees)
primary
undesirable
event - PUE
(e.g. fire)
A(k)
human
error
human
error human
error

An example of tree method applied to
modelling and analysis of flood risk
risk evaluation
analysis of the influence
of modelled factors on the
system risk
a basis for decisions,
e.g.
about widening of
embankments
yes
yes
yes
yes
no
no
no
or
dam failure
operator
error
water level too high
water flow
exceeds
the limit
capacity
of
polders
to small
river embank-
ments
broken
ineffective
evacuation

METHODS FOR RELIABILITY
EVALUATION AND ANALYSIS
Methods based on reliability models may be used in
analysis of the following reliability systems:
undesirable events prevention
hazard counteraction
rescue
E.g. simulation of different alternative actions during
a rescue operation to evaluate their reliability etc.
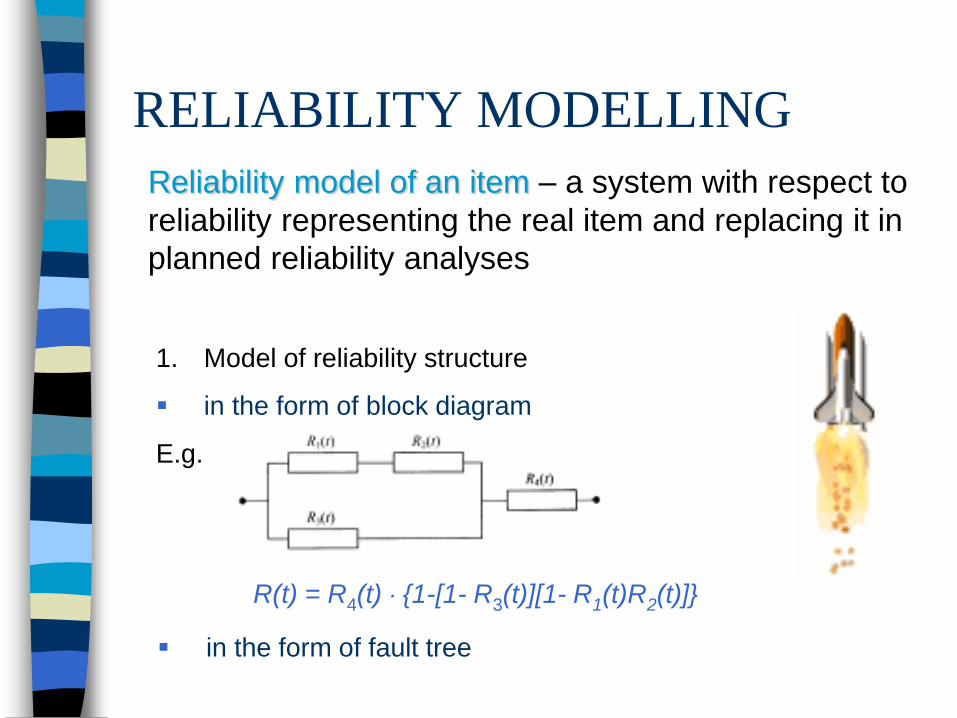
RELIABILITY MODELLING
Reliability model of an item – a system with respect to
reliability representing the real item and replacing it in
planned reliability analyses
1. Model of reliability structure
in the form of block diagram
E.g.
R(t) = R4(t) {1-[1- R3(t)][1- R1(t)R2(t)]}
in the form of fault tree
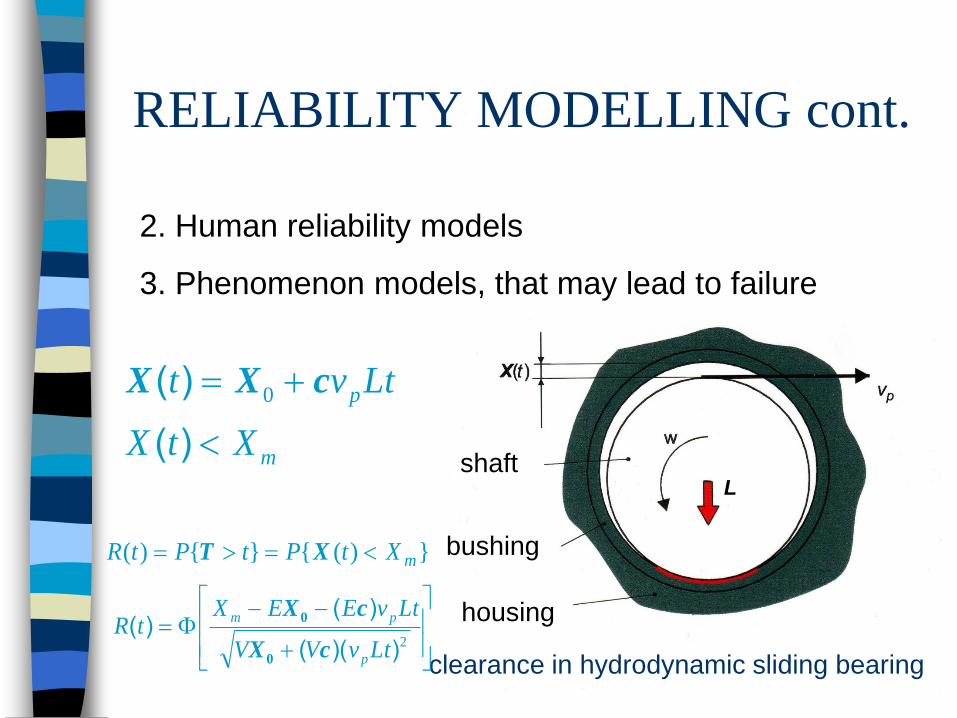
RELIABILITY MODELLING cont.
2. Human reliability models
3. Phenomenon models, that may lead to failure
clearance in hydrodynamic sliding bearing
shaft
housing
bushing
m
p
XtX
Ltvt
)(
)( cXX 0
})({}{)( mXtPtPtR XT
2))((
)()(
LtvVV
LtvEEXtR
p
pm
cX
cX
0
0
L

Sliding bearing shaft
housing
bushing
m
p
XtX
Ltvt
)(
)( 0 cXX

Methods based on models
Used mainly for analysis of the effects of different
factors on the modelled item reliability. Allows
evaluation of factors taken into account in the model.
They are more difficult then statistical or expert
methods
Could be used for reliability analysis of systems,
where hazards are big

METHODS FOR RELIABILITY
EVALUATION AND ANALYSIS
experimental theoretical
analytical
quantitative qualitative
simulation
reliability model
of an item

CHOICE OF THE RELIABILITY LEVEL
Cost-reliability dependence c
os
t
0
c(1) = Q(1) · Z(c)
Required reliability level
reliability

RELIABILITY LEVEL
Service life of home appliances with electric motors
appliance
service
life in
years
work
load in
1 year
in [h]
MTTF
in
hours
coffee grinder 10 5-10 200
lawn mover 10 20-50 500
washing machine 10 30-200 3000
cooling fan 5 10-600 3000

REPARABLE ITEMS
Repair strategies:
replacement/repair at failures
preventive maintenance
The aim of preventive maintenance:
to reduce the occurrence of the item failure

Periodical testing/replacement
The effect of preventive maintenance on item’s reliability
(availability)
Analysis of effectiveness
Optimisation of preventive maintenance strategy

FUNDAMENTALS OF
RELIABILITY ANALYSIS
FMEA

Failure mode and effect analysis
Basic principles for FMEA
FMEA is a simple analysis method to reveal possible
failures and to predict the failure effects on the system as
a whole.
The method is inductive; for each component of the
system we investigate what will happen if this component
fails. The method represents a systematic analysis of the
components of the system to identify all significant failure
modes and to see how important they are for the system
performance.
Only one component is considered at a time, the other
components are then assumed to function perfectly. FMEA
is not suitable for revealing critical combinations of
component failures.

FMEA table SYSTEM/EQUIPMENT: EXECUTED BY:
REF. DIAGRAM/DRAWING NO.: DATE:
Identifi- Function/ Failure mode Effect on Effect on Correc- Failure Failure Remarks
cation operational other units the system tive frequency effect
state in the system measures ranking
1 2 3 4 5 6 7 8 9
Identification (column 1). Here the specific component
is identified by a description and/or number. It is also
possible to refer to a system drawing or a functional
diagram.

FMEA table SYSTEM/EQUIPMENT: EXECUTED BY:
REF. DIAGRAM/DRAWING NO.: DATE:
Identifi- Function/ Failure mode Effect on Effect on Correc- Failure Failure Remarks
cation operational other units the system tive frequency effect
state in the system measures ranking
1 2 3 4 5 6 7 8 9
Function, operational state. The function of the
component, i.e. its working tasks in the system, is briefly
described.
The state of the component when the system is in
normal operation is described, e.g. whether it is in
continuous operation mode or in stand-by mode.

FMEA table SYSTEM/EQUIPMENT: EXECUTED BY:
REF. DIAGRAM/DRAWING NO.: DATE:
Identifi- Function/ Failure mode Effect on Effect on Correc- Failure Failure Remarks
cation operational other units the system tive frequency effect
state in the system measures ranking
1 2 3 4 5 6 7 8 9
Failure modes. All the possible ways the component can fail to
perform its function are listed under this column. Only the
failure modes that can be observed from "outside" are included.
The internal failure modes are to be considered as causes of
failure. These causes can possibly be listed under a separate
column. In some cases it will also be of interest to look at the
basic physical and chemical processes that can lead to failure
(failure mechanisms), such as corrosion. Often we also state
how the different failure modes of the component are detected,
and by whom.
Example: In a chemical process plant a specific valve is
considered as a component in the system. The function
of the valve is to open and close at demand. "The valve
does not open at demand" and "the valve does not
close at a demand" are relevant failure modes, as well
as "the valve opens when not intended" and "the
valve closes when not intended". However, "washer
bursts" is an example of the cause of a specific failure
mode.

FMEA table SYSTEM/EQUIPMENT: EXECUTED BY:
REF. DIAGRAM/DRAWING NO.: DATE:
Identifi- Function/ Failure mode Effect on Effect on Correc- Failure Failure Remarks
cation operational other units the system tive frequency effect
state in the system measures ranking
1 2 3 4 5 6 7 8 9
Effect on other units in the system. In those cases where the
specific failure mode affects other components in the system it
is stated in this column.
Emphasis should be given to identification of failure
propagation which does not follow the functional chains of the
functional diagrams.
For example: increased load on the remaining pillars that are
supporting a common load when a pillar collapses; vibration in
a pumping house may induce failure of the driving unit of the
pump, etc.

FMEA table SYSTEM/EQUIPMENT: EXECUTED BY:
REF. DIAGRAM/DRAWING NO.: DATE:
Identifi- Function/ Failure mode Effect on Effect on Correc- Failure Failure Remarks
cation operational other units the system tive frequency effect
state in the system measures ranking
1 2 3 4 5 6 7 8 9
Effect on system. In this column we describe how the system
is influenced by the specific failure mode.
The operational state of the system as a result of failure, is to
be stated, for example, whether the system is in the operational
state, changed to another operational mode, or not in an
operational state.

FMEA table SYSTEM/EQUIPMENT: EXECUTED BY:
REF. DIAGRAM/DRAWING NO.: DATE:
Identifi- Function/ Failure mode Effect on Effect on Correc- Failure Failure Remarks
cation operational other units the system tive frequency effect
state in the system measures ranking
1 2 3 4 5 6 7 8 9
Corrective measures. Here we describe what has been done
or what can be done to correct the failure, or possibly to reduce
the consequences of the failure. We may also list measures
that are aimed at reducing the probability that the failure will
occur.

FMEA table SYSTEM/EQUIPMENT: EXECUTED BY:
REF. DIAGRAM/DRAWING NO.: DATE:
Identifi- Function/ Failure mode Effect on Effect on Correc- Failure Failure Remarks
cation operational other units the system tive frequency effect
state in the system measures ranking
1 2 3 4 5 6 7 8 9
Failure frequency. Under this column we state the estimated
frequency (probability) for the specific failure mode and
consequence. Instead of presenting frequencies for all the
different failure modes, we may give a total frequency and
relative frequencies (in percentages) for the different failure
modes.

FMEA table SYSTEM/EQUIPMENT: EXECUTED BY:
REF. DIAGRAM/DRAWING NO.: DATE:
Identifi- Function/ Failure mode Effect on Effect on Correc- Failure Failure Remarks
cation operational other units the system tive frequency effect
state in the system measures ranking
1 2 3 4 5 6 7 8 9
Failure effect ranking. The failure is ranked according to its
effect, with respect to reliability and safety, the possibilities of
mitigating the failure, the length of repair time, production loss,
etc.
Exemplary failure effects:
Small: A failure that does not reduce the functional ability of the
system more than normally is accepted.
Significant: A failure that reduces the functional ability of the
system beyond the acceptable level, but the consequences can be
corrected and controlled.
Critical: A failure that reduces the functional ability of the system
beyond the acceptable level and which creates an unacceptable condition,
either operational or with respect to safety.

FMEA table SYSTEM/EQUIPMENT: EXECUTED BY:
REF. DIAGRAM/DRAWING NO.: DATE:
Identifi- Function/ Failure mode Effect on Effect on Correc- Failure Failure Remarks
cation operational other units the system tive frequency effect
state in the system measures ranking
1 2 3 4 5 6 7 8 9
Remarks. Here we state for example assumptions and
suppositions.

An example of FMEA
Storage tank
An open container for preliminary storage of
fluid for use in the production process.
The consumption of fluid in the process is not
constant, and the liquid level in the tank will
therefore vary.
Filling the tank is automatically controlled.

Storage tank
Level Switch High
Level Switch High High
1. No fluid supply
2. The fluid in the tank is drained
3. The liquid level may increase to
an abnormal height
4. The tank is over-filled
if not the valve V1 closes
Failure frequency ranking

SYSTEM/EQUIPMENT: Storage tank EXECUTED BY: TAV
REF. DIAGRAM/DRAWING.NO.: DATE: 08.08.90 PAGE: 1 OF: 2

Storage tank

SYSTEM/EQUIPMENT: Storage tank EXECUTED BY: TAV
REF. DIAGRAM/DRAWING.NO.: DATE: 08.08.90 PAGE: 2 OF: 2

FMECA
Failure Modes, Effects and Criticality Analysis
By comparing failure frequency (probability) and failure effect
(consequence) the criticality of the specific failure mode can be determined
Probability/frequency Consequence category Small Significant Critical
Very unlikely, Once per 1000 year or more infrequently
Unlikely, Once per 100 year Quite likely, Once per 10 year
Likely, Once per year
Frequently, Once per month or more frequently

Example o Design FMEA

FMEA CRITERIAS
CRITERIAS FOR PROBABILITY OF OCCURANCE (Po) Frequency Rating
It is most improbable that the defect appears. E.g. fool-proof construction < 1 / 100 000 1
Very low probability that the defect appears, similar construction without defect < 1 / 10 000 2 - 3
Low probability that the defect appears < 1 / 1 000 4 - 5
Certain probability that the defect appears < 1 / 100 6 - 7
High probability that the defect appears < 1 / 10 8 - 9
Very high probability that the defect appears < 1 / 1 10
CRITERIAS FOR SEVERITY (S) Rating
No accident hazard or effect to the product 1
No accident hazard or insignificant effect to the product, still intact function 2 - 3
Very low accident hazard or risk of interference of the function in the production 4 - 6
Accident hazard under special circumstances or problem with the function in the production 7 - 8
Serious risk for personal injury 9 - 10
CRITERIAS FOR PROBABILITY OF DETECTION (Pd) Rating
Defect which will be always noticed 1
Normal probability for detection (at c:a 75% intensity of defect) 2 - 3
Certain probablity for detection (at c:a 50% intensity of defect) 4 - 6
Low probability for detection - alt. No part of the control programme 7 - 8
It is improbable that the defect will be detected - can not be tested 9 - 10
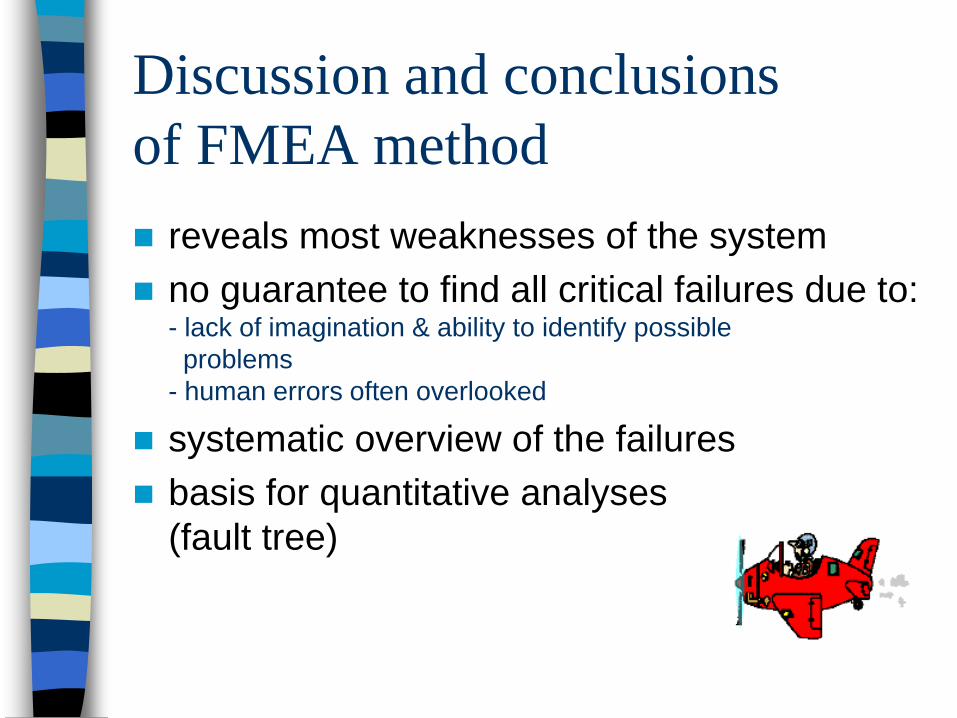
Discussion and conclusions
of FMEA method
reveals most weaknesses of the system
no guarantee to find all critical failures due to: - lack of imagination & ability to identify possible
problems
- human errors often overlooked
systematic overview of the failures
basis for quantitative analyses
(fault tree)

Discussion and conclusions
of FMEA method
unsuitable for analysing systems with
much redundancy
all components are analysed (including
failures of little or no consequence)
Sub-systems could be defined
Computer tools for execution of FMEA

Storage tank

Top event
”Over-filling of the tank”

Top event ”Undesired
stoppage of the fluid supply”
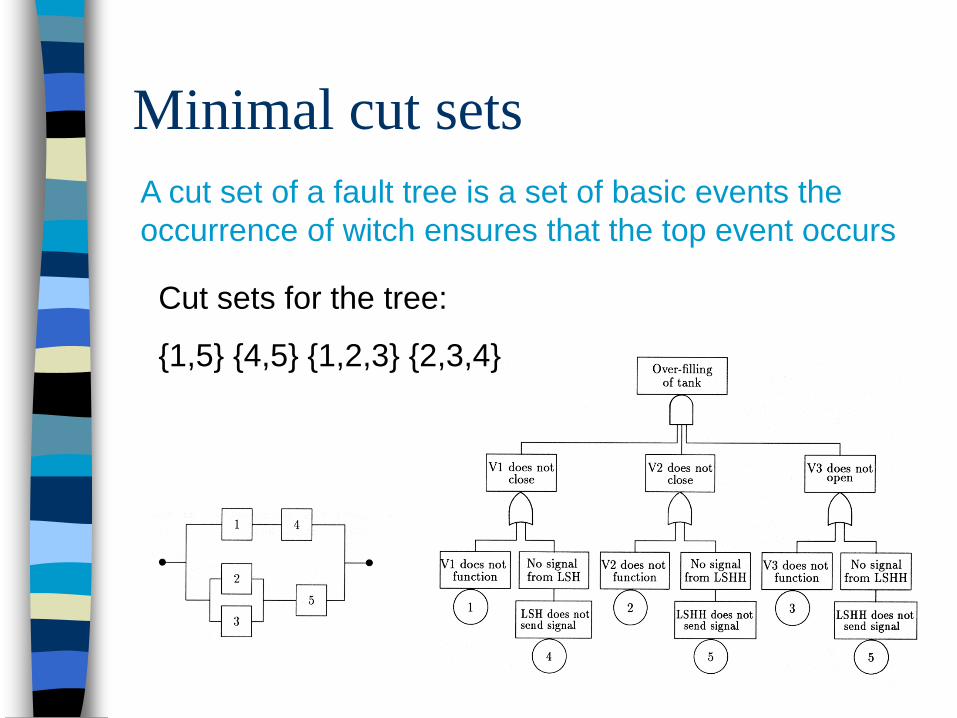
Minimal cut sets
A cut set of a fault tree is a set of basic events the
occurrence of witch ensures that the top event occurs
Cut sets for the tree:
{1,5} {4,5} {1,2,3} {2,3,4}

Quantitative analysis
of the fault tree
Probabilities of basic
events taken from
the tables
0.02x0.01+0.01x0.01+0.02x0.02x0.02+0.01x0.02x0.02 =
= 0.03 x 10-2 = 0.03%
1%
2%
1% 1%
2% 2%
Cut sets for the tree:
{1,5} {4,5} {1,2,3} {2,3,4}

Event tree analysis
(Cause consequence analysis)
Diagram of the tank example
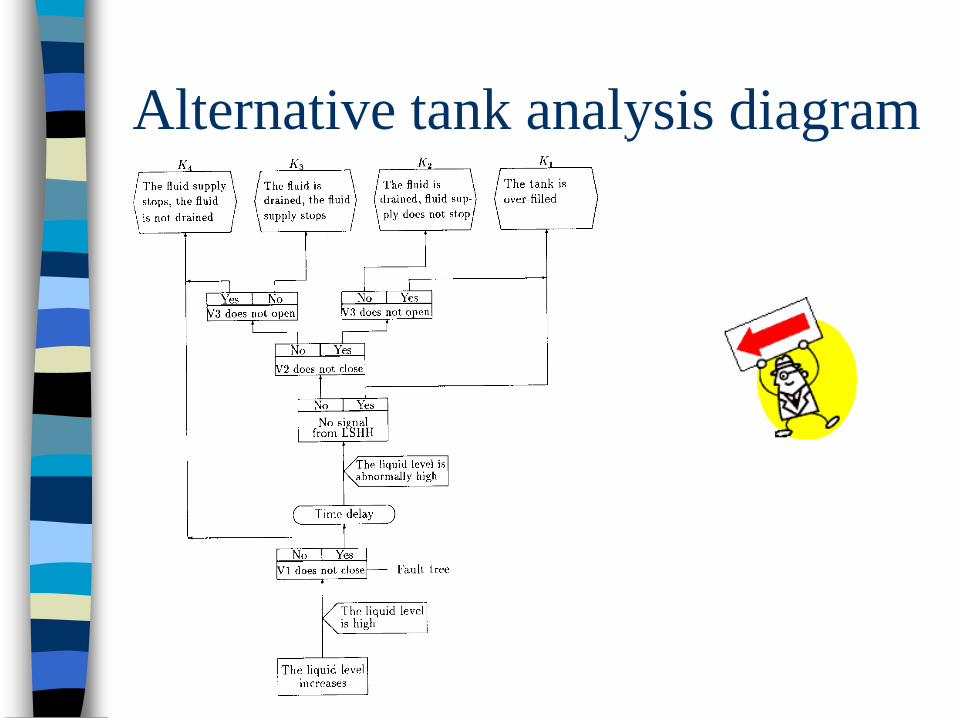
Alternative tank analysis diagram

The event
tree
event tree
with inserted
branching
probabilities
K1: 0.03 · (0.01+ 0.99 · 0.02 · 0.02) = 0.03%
K2: 0.03 · 0.99 · 0.02 · 0.98 = 0.06%
K3: 0.03 · 0.99 · 0.98 · 0.98 = 2.85%
K4: 0.97 + 0.03 · 0.99 · 0.98 · 0.02 =
97.06%