Embed Size (px)
Citation preview
i i le
i i l i l/ i i 2
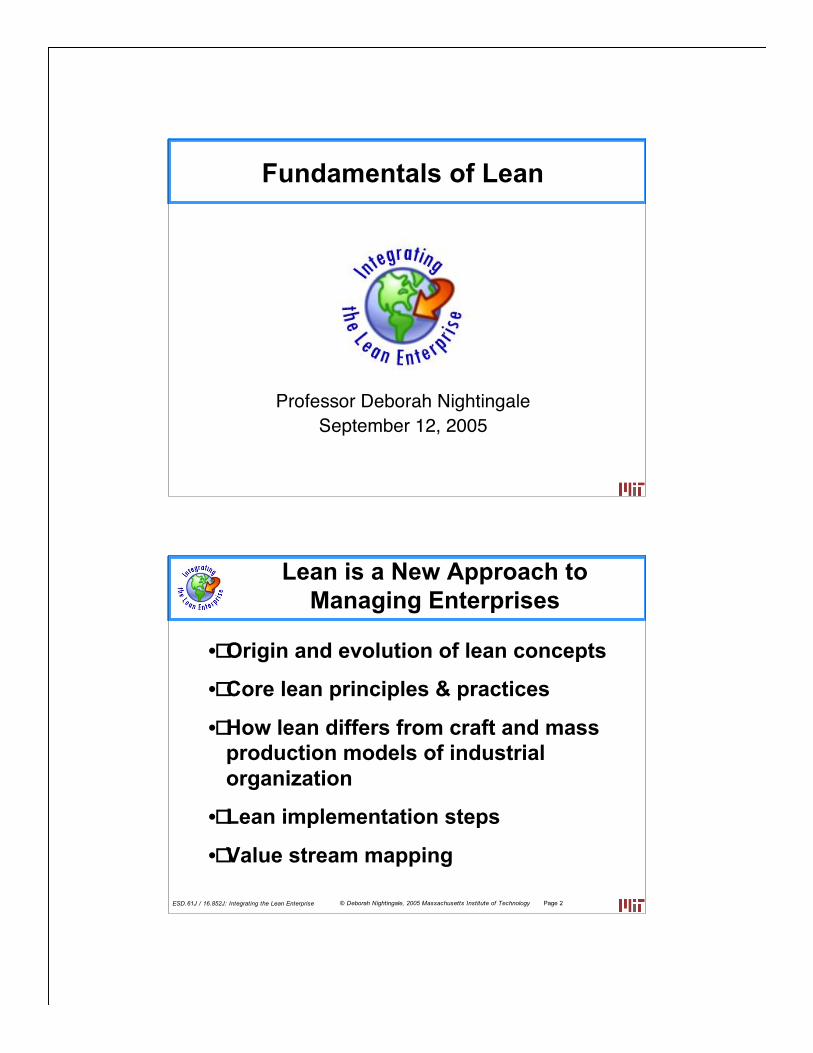
Lean is a New Approach to Managing Enterprises
•
•
•
•
•
Fundamentals of Lean
Professor Deborah N ght ngaSeptember 12, 2005
© Deborah N ght nga e, 2005 Massachusetts Inst tute of Techno ogy ESD.61J 16.852J: Integrat ng the Lean Enterpr se Page
Origin and evolution of lean concepts
Core lean principles & practices
How lean differs from craft and mass production models of industrial organization
Lean implementation steps
Value stream mapping
i i l i l/ i i 3
-
i i l i l/ i i 4
• • • •
•
• •
• • /
• •
•
• •
• •
• •
•
• • •
• •
• •
© Deborah N ght nga e, 2005 Massachusetts Inst tute of Techno ogy ESD.61J 16.852J: Integrat ng the Lean Enterpr se Page
Lean Enterprise Value: The Central Concept
Lean is a process of eliminating waste with the goal of creating value for enterprise stakeholders.
Lean Enterprise Value, Murman et al
© Deborah N ght nga e, 2005 Massachusetts Inst tute of Techno ogy ESD.61J 16.852J: Integrat ng the Lean Enterpr se Page
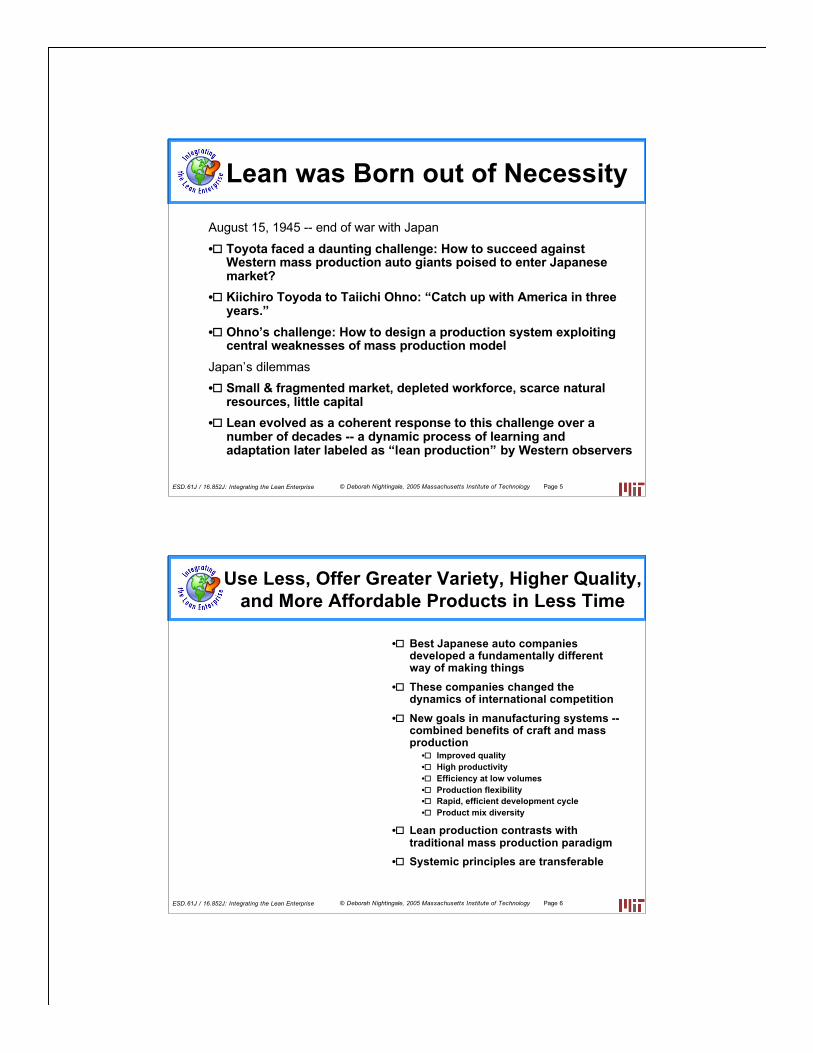
Lean Works Everywhere
Export licensing: 56 steps to 21 steps 52 handoffs to 5 handoffs Cycle time from 60 days to 30 days 50% 1st pass yield to >90% 1st pass yield
Payroll: Reduced non-value added steps by 50% 15 forms to 1 form Reduced signatures approvals by 25%
Recruiting: Cycle time from 14 days to 48 hours 50% reduction of paper resumes
Proposal: Cycle time from 30.6 days to 7 days
Program support: $3M savings
Interface management: Proposal, contract, billing, and collection steps Generated $21M additional cash
Engineering order release: Cycle time from 76 to 4 days Total queue time from 56 days to 60 minutes
Process definition: Work package completion cycle from 4 months to 3 weeks
Financial reporting: 13 weeks to 3 weeks
i i l i l/ i i 5
i
•
• “”
• ’
’ il•
•
“ ”
i i l i l/ i i 6
•
•
•
• • • • • •
•
•
© Deborah N ght nga e, 2005 Massachusetts Inst tute of Techno ogy ESD.61J 16.852J: Integrat ng the Lean Enterpr se Page
Lean was Born out of Necessity
August 15, 1945 -- end of war w th Japan
Toyota faced a daunting challenge: How to succeed against Western mass production auto giants poised to enter Japanese market? Kiichiro Toyoda to Taiichi Ohno: Catch up with America in three years.Ohno s challenge: How to design a production system exploiting central weaknesses of mass production model
Japan s d emmas Small & fragmented market, depleted workforce, scarce natural resources, little capital Lean evolved as a coherent response to this challenge over a number of decades -- a dynamic process of learning and adaptation later labeled as lean production by Western observers
© Deborah N ght nga e, 2005 Massachusetts Inst tute of Techno ogy ESD.61J 16.852J: Integrat ng the Lean Enterpr se Page
Use Less, Offer Greater Variety, Higher Quality, and More Affordable Products in Less Time
Best Japanese auto companies developed a fundamentally different way of making things These companies changed the dynamics of international competition New goals in manufacturing systems --combined benefits of craft and mass production
Improved quality High productivity Efficiency at low volumes Production flexibility Rapid, efficient development cycle Product mix diversity
Lean production contrasts with traditional mass production paradigm Systemic principles are transferable
i i l i l/ i i 7
Muda- Is a Japanese word for waste Waste- any activity that absorbs resources &
creates
Source ea n ng
i i l i l/ i i 8
• -
•
© Deborah N ght nga e, 2005 Massachusetts Inst tute of Techno ogy ESD.61J 16.852J: Integrat ng the Lean Enterpr se Page
What is Lean Thinking?
The removal of muda!
no value!
: L n Thi ki by Womack & Jones
© Deborah N ght nga e, 2005 Massachusetts Inst tute of Techno ogy ESD.61J 16.852J: Integrat ng the Lean Enterpr se Page
More Japanese Terms
Kaikaku radical improvement
Kaizen- continuous incremental improvement
i i l i l/ i i 9
•
•
• ’
• /
•
• ’
i i l i l/ i i
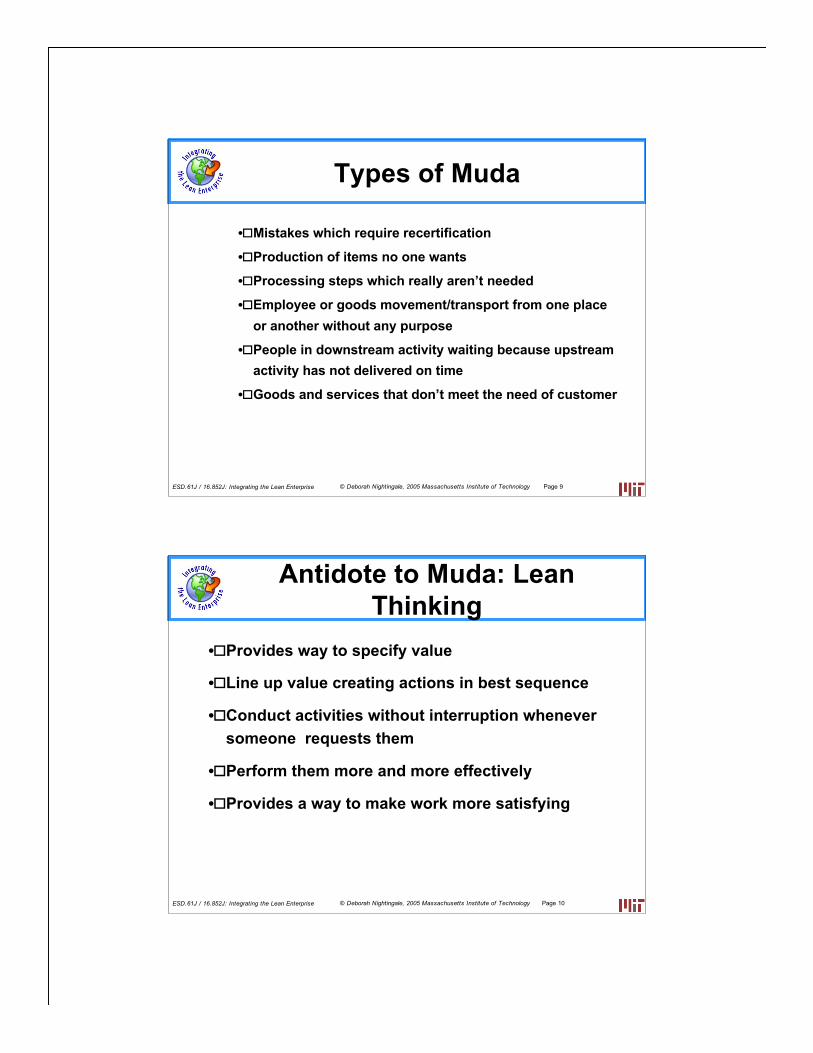
• Provides way to specify value
• Line up value creating actions in best sequence
• Conduct activities without interruption whenever someone requests them
• Perform them more and more effectively
• Provides a way to make work more satisfying
© Deborah N ght nga e, 2005 Massachusetts Inst tute of Techno ogy ESD.61J 16.852J: Integrat ng the Lean Enterpr se Page
Types of Muda
Mistakes which require recertification
Production of items no one wants
Processing steps which really aren t needed
Employee or goods movement transport from one place or another without any purpose
People in downstream activity waiting because upstream activity has not delivered on time
Goods and services that don t meet the need of customer
© Deborah N ght nga e, 2005 Massachusetts Inst tute of Techno ogy ESD.61J 16.852J: Integrat ng the Lean Enterpr se Page 10
Antidote to Muda: Lean Thinking
i i l i l/ i i
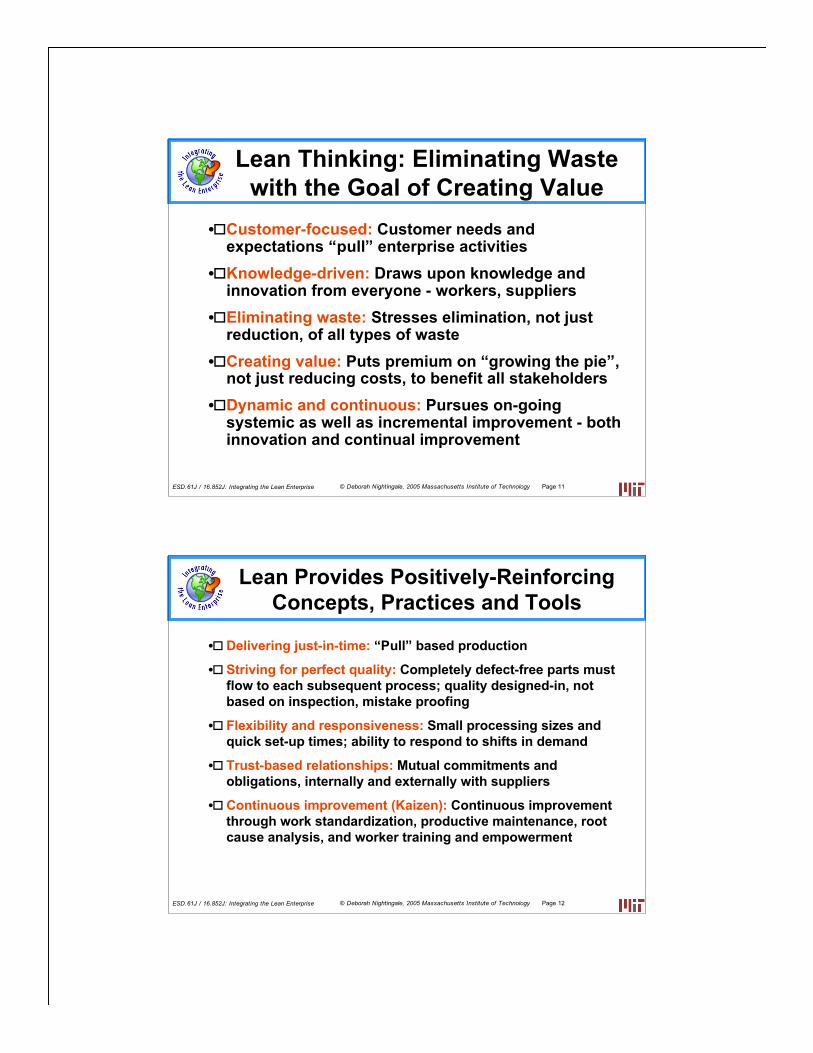
Lean Thinking: Eliminating Waste with the Goal of Creating Value
• Customer-focused: Customer needs and expectations “ ” enterprise activities
• Knowledge-driven: Draws upon knowledge andinnovation from everyone - workers, suppliers
• Eliminating waste: Stresses elimination, not justreduction, of all types of waste
• Creating value: Puts premium on “ ”, not just reducing costs, to benefit all stakeholders
• Dynamic and continuous: Pursues on-goingsystemic as well as incremental improvement - bothinnovation and continual improvement
i i l i l/ i i
• j “ ”
•
•
•
• ( ):
© Deborah N ght nga e, 2005 Massachusetts Inst tute of Techno ogy ESD.61J 16.852J: Integrat ng the Lean Enterpr se Page 11
pull
growing the pie
© Deborah N ght nga e, 2005 Massachusetts Inst tute of Techno ogy ESD.61J 16.852J: Integrat ng the Lean Enterpr se Page 12
Lean Provides Positively-Reinforcing Concepts, Practices and Tools
Delivering ust-in-time: Pull based production
Striving for perfect quality: Completely defect-free parts must flow to each subsequent process; quality designed-in, not based on inspection, mistake proofing
Flexibility and responsiveness: Small processing sizes and quick set-up times; ability to respond to shifts in demand
Trust-based relationships: Mutual commitments and obligations, internally and externally with suppliers
Continuous improvement Kaizen Continuous improvement through work standardization, productive maintenance, root cause analysis, and worker training and empowerment
i i l i l/ i i
i i l i l/ i i
iel i i ( i ).
•
•
• “ ”
• ’s “ ” j
•
© Deborah N ght nga e, 2005 Massachusetts Inst tute of Techno ogy ESD.61J 16.852J: Integrat ng the Lean Enterpr se Page 13
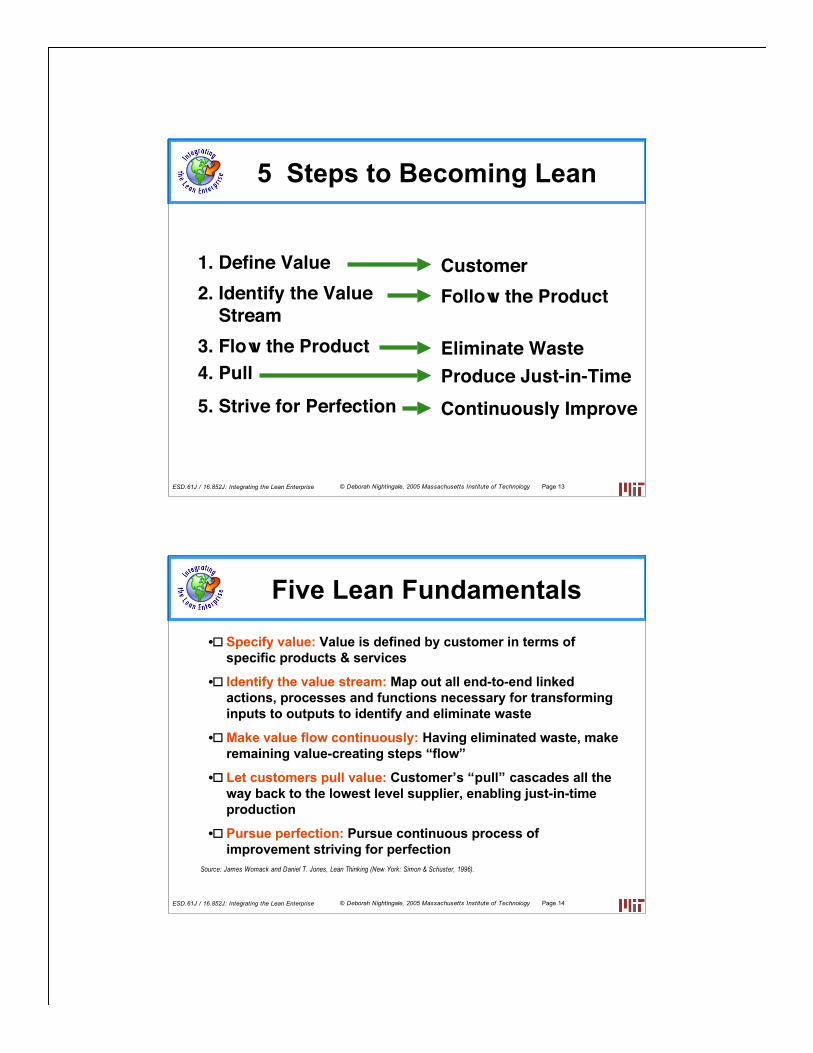
1. Define Value 2. Identify the Value
Stream 3. Flow the Product 4. Pull 5. Strive for Perfection
Customer Follow the Product
Eliminate Waste Produce Just-in-Time Continuously Improve
5 Steps to Becoming Lean
© Deborah N ght nga e, 2005 Massachusetts Inst tute of Techno ogy ESD.61J 16.852J: Integrat ng the Lean Enterpr se Page 14
Source: James Womack and Dan T. Jones, Lean Th nk ng New York: S mon & Schuster, 1996
Five Lean Fundamentals
Specify value: Value is defined by customer in terms of specific products & services
Identify the value stream: Map out all end-to-end linked actions, processes and functions necessary for transforming inputs to outputs to identify and eliminate waste
Make value flow continuously: Having eliminated waste, make remaining value-creating steps flow
Let customers pull value: Customer pull cascades all the way back to the lowest level supplier, enabling ust-in-time production
Pursue perfection: Pursue continuous process of improvement striving for perfection
© Deborah Nightingale, 2005 Massachusetts Institute of TechnologyESD.61J / 16.852J: Integrating the Lean Enterprise Page 15
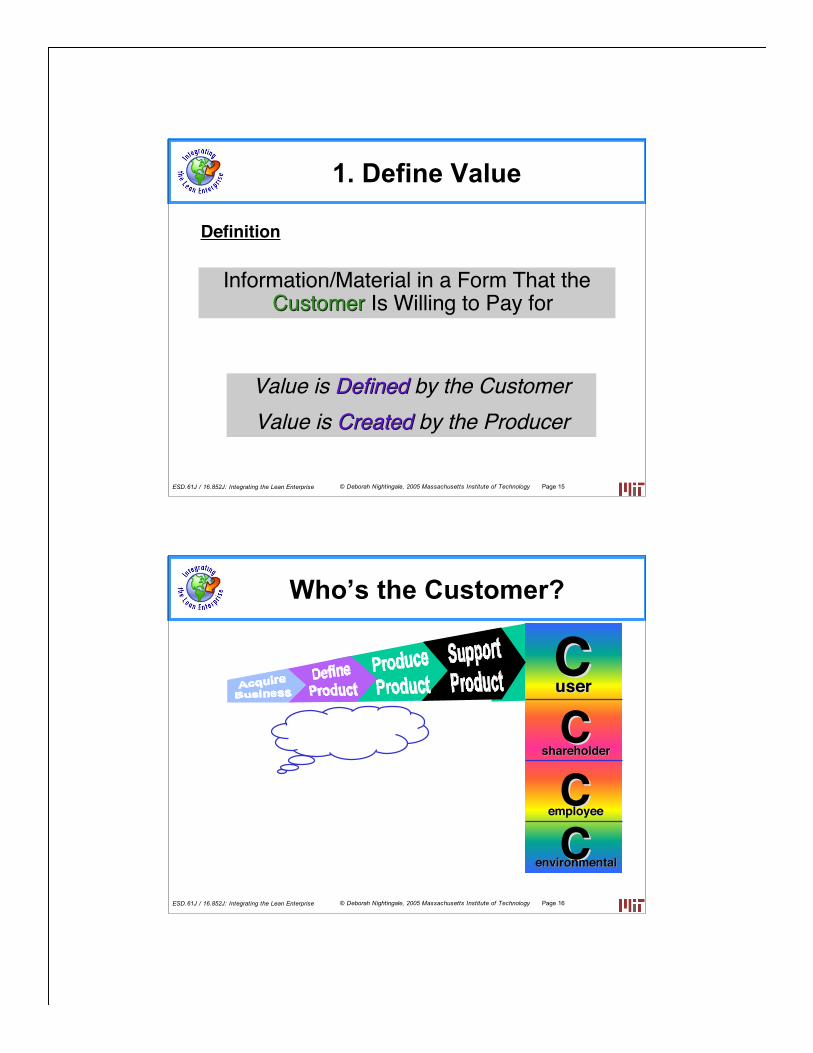
Definition
Information/Material in a Form That theCustomerCustomer Is Willing to Pay for
Value is DefinedDefined by the CustomerValue is CreatedCreated by the Producer
1. Define Value
© Deborah Nightingale, 2005 Massachusetts Institute of TechnologyESD.61J / 16.852J: Integrating the Lean Enterprise Page 16
CC user user
CCshareholdershareholder
CCenvironmentalenvironmental
CCemployeeemployee
Who’s the Customer?
i i l i l/ i i
C U S T O M E R
’
© Deborah N ght nga e, 2005 Massachusetts Inst tute of Techno ogy ESD.61J 16.852J: Integrat ng the Lean Enterpr se Page 17
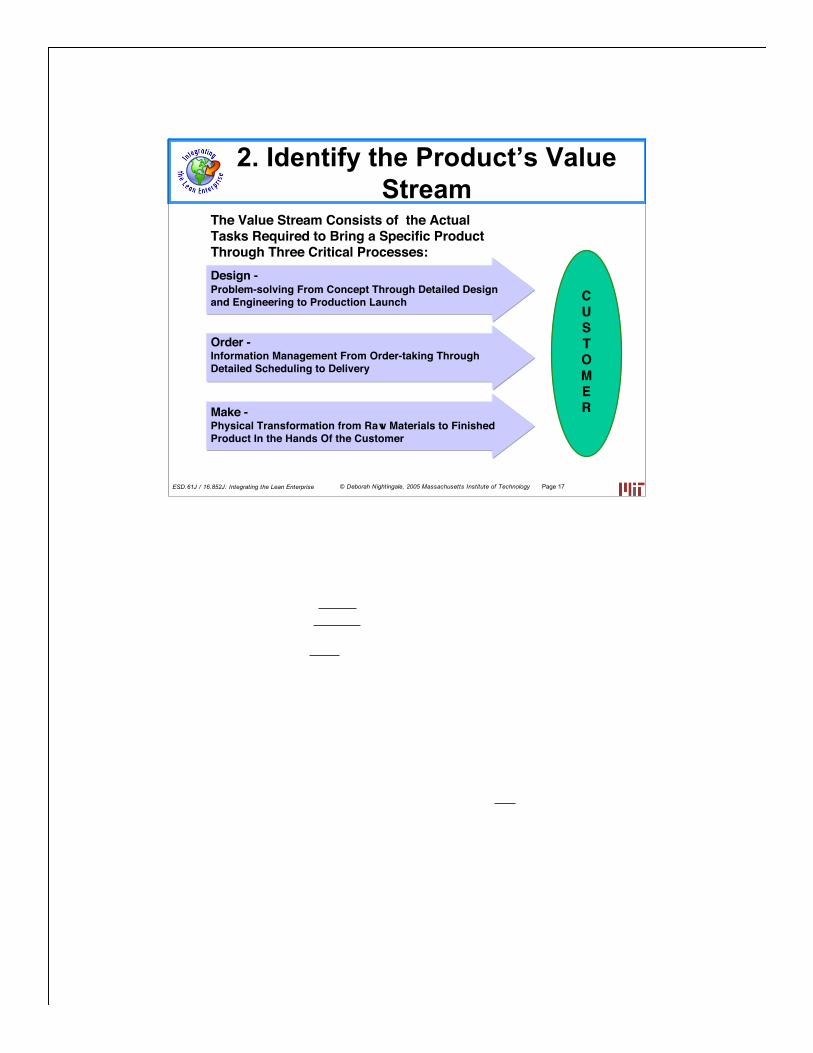
The Value Stream Consists of the Actual Tasks Required to Bring a Specific Product Through Three Critical Processes: Design -Problem-solving From Concept Through Detailed Design and Engineering to Production Launch
Order -Information Management From Order-taking Through Detailed Scheduling to Delivery
Make -Physical Transformation from Raw Materials to Finished Product In the Hands Of the Customer
2. Identify the Product s Value Stream
i i l i l/ i i
l ivi i ii i / ial
i ili ltii i i
li
i i l i l/ i i
ivil
© Deborah N ght nga e, 2005 Massachusetts Inst tute of Techno ogy ESD.61J 16.852J: Integrat ng the Lean Enterpr se Page 19
What Is a Value-Added Activity?
A va ue-added act ty s any act on that transforms nformat on mater
nto a capab ty for our u mate customer at the r ght t me and the r ght
qua ty.
Definition
© Deborah N ght nga e, 2005 Massachusetts Inst tute of Techno ogy ESD.61J 16.852J: Integrat ng the Lean Enterpr se Page 20
Definition
Any Act ty That Consumes Resources Yet Adds No Va ue
Waste
© Deborah Nightingale, 2005 Massachusetts Institute of TechnologyESD.61J / 16.852J: Integrating the Lean Enterprise Page 21
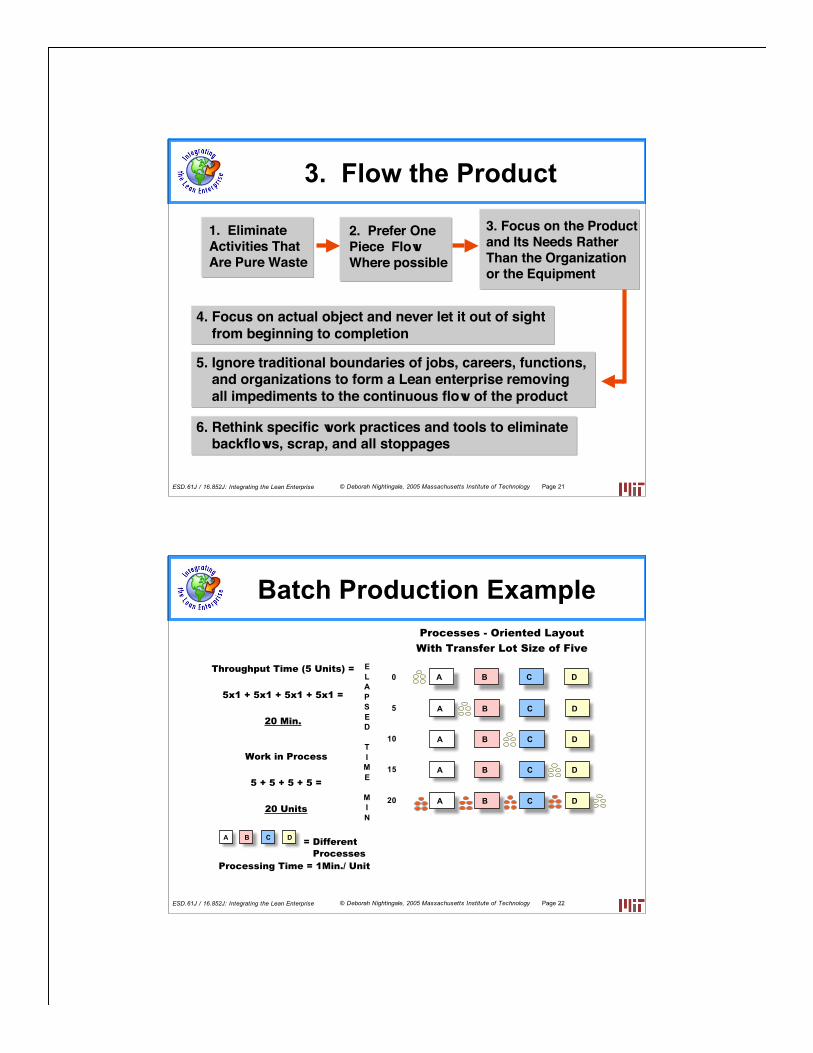
2. Prefer One Piece Flow Where possible
3. Focus on the Product and Its Needs Rather Than the Organization or the Equipment
1. Eliminate Activities That Are Pure Waste
4. Focus on actual object and never let it out of sight from beginning to completion
5. Ignore traditional boundaries of jobs, careers, functions, and organizations to form a Lean enterprise removing all impediments to the continuous flow of the product
6. Rethink specific work practices and tools to eliminate backflows, scrap, and all stoppages
3. Flow the Product
© Deborah Nightingale, 2005 Massachusetts Institute of TechnologyESD.61J / 16.852J: Integrating the Lean Enterprise Page 22
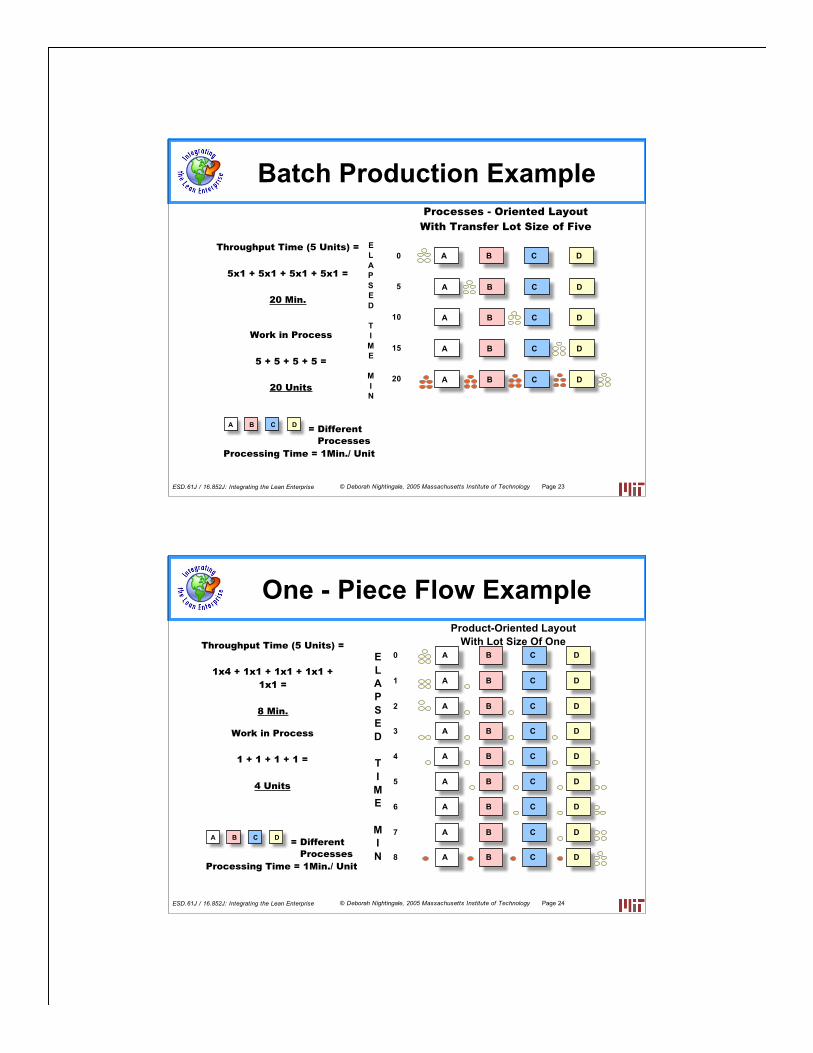
Batch Production Example
A B C D = Different Processes
Processing Time = 1Min./ Unit
0 A B C D E L A P S E D
T I
M E
M I N
Processes - Oriented Layout
With Transfer Lot Size of Five
5 A B C D
10 A B C D
15 A B C D
20 A BB C D
Throughput Time (5 Units) =
5x1 + 5x1 + 5x1 + 5x1 =
20 Min.
Work in Process
5 + 5 + 5 + 5 =
20 Units
© Deborah Nightingale, 2005 Massachusetts Institute of TechnologyESD.61J / 16.852J: Integrating the Lean Enterprise Page 23
Batch Production Example
A B C D = Different Processes
Processing Time = 1Min./ Unit
0 A B C D E L A P S E D
T I
M E
M I N
Processes - Oriented Layout
With Transfer Lot Size of Five
5 A B C D
10 A B C D
15 A B C D
20 A BB C D
Throughput Time (5 Units) =
5x1 + 5x1 + 5x1 + 5x1 =
20 Min.
Work in Process
5 + 5 + 5 + 5 =
20 Units
© Deborah Nightingale, 2005 Massachusetts Institute of TechnologyESD.61J / 16.852J: Integrating the Lean Enterprise Page 24
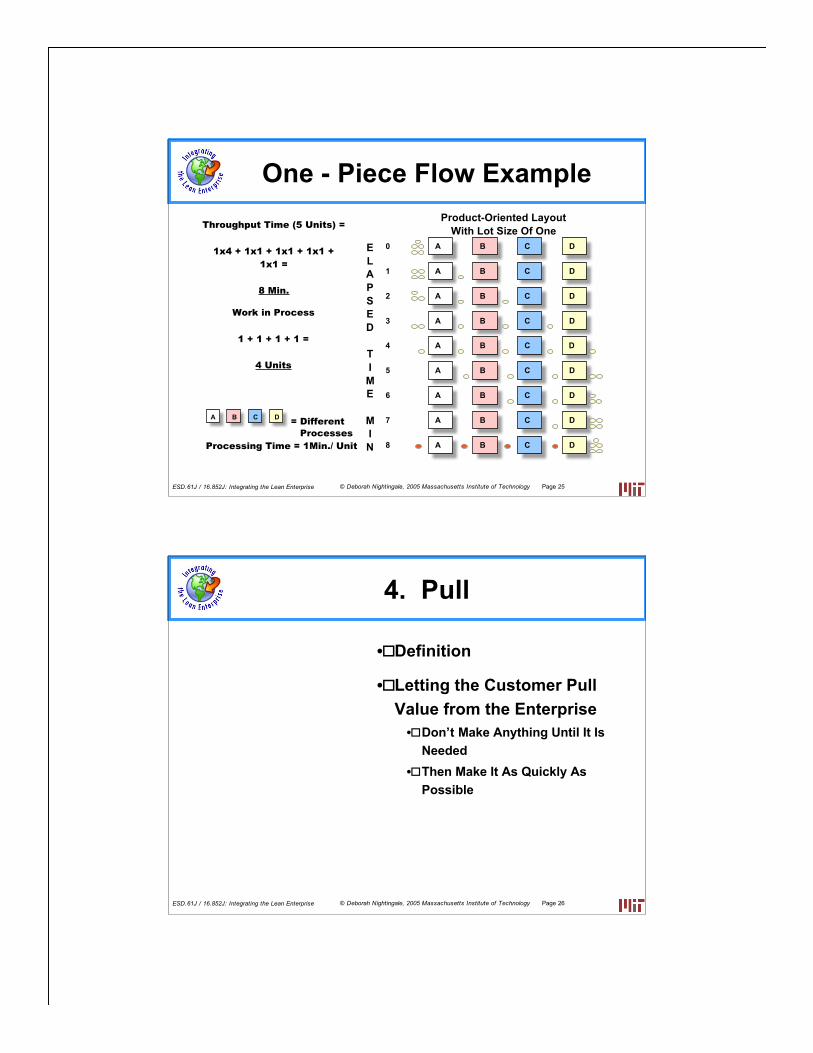
A B C D = Different
Processes Processing Time = 1Min./ Unit
Throughput Time (5 Units) =
1x4 + 1x1 + 1x1 + 1x1 + 1x1 =
8 Min.
Work in Process
1 + 1 + 1 + 1 =
4 Units
A B C D1
A B C D2
A B C D3
A B C D4
A B C D5
A B C D0
Product-Oriented Layout With Lot Size Of One
E L A P S E D
T I M E
M I N
6 A B C D
7 A B C D
8 A B C D
One - Piece Flow Example
i i l i l/ i i
A B C D
/
A B C D1
A B C D2
A B C D3
A B C D4
A B C D5
A B C D0E L A P S E D
T I M E
M I N
6 A B C D
7 A B C D
8 A B C D
i i l i l/ i i
•
•
• ’
•
© Deborah N ght nga e, 2005 Massachusetts Inst tute of Techno ogy ESD.61J 16.852J: Integrat ng the Lean Enterpr se Page 25
= Different Processes
Processing Time = 1Min. Unit
Throughput Time (5 Units) =
1x4 + 1x1 + 1x1 + 1x1 + 1x1 =
8 Min.
Work in Process
1 + 1 + 1 + 1 =
4 Units
Product-Oriented Layout With Lot Size Of One
One - Piece Flow Example
© Deborah N ght nga e, 2005 Massachusetts Inst tute of Techno ogy ESD.61J 16.852J: Integrat ng the Lean Enterpr se Page 26
4. Pull
Definition
Letting the Customer Pull Value from the Enterprise
Don t Make Anything Until It Is Needed Then Make It As Quickly As Possible
i i l i l/ i i
•
•
•
•
i i l i l/ i i
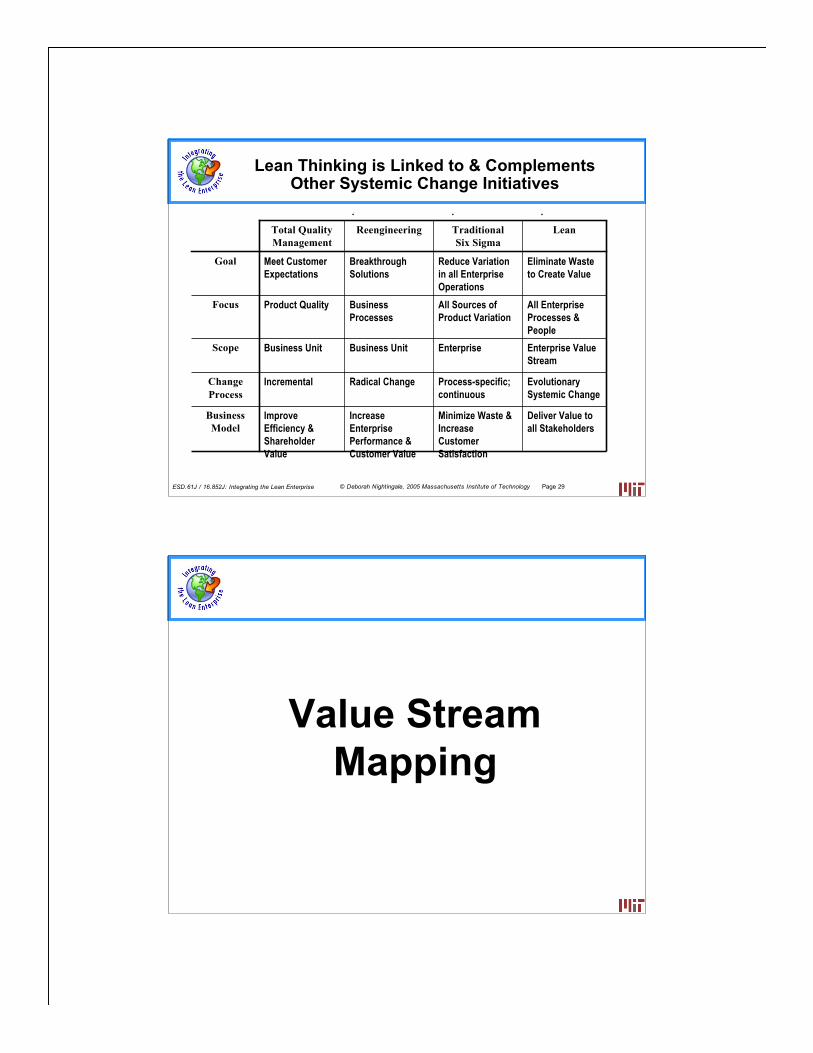
FOCUS CRAFT MASS
PRODUCTION
LEAN
THINKING
Focus Task Product Customer
Operations Single items Batch and queue Synchronized flow and pull
Overall aim Mastery of craft
Reduce cost and increase efficiency
Reduce waste and add value
Quality Integration (part of craft)
Inspection (a second stage, after production)
Prevention (built in by design & methods)
Business strategy
Customization Economies of scale and automation
Flexibility and adaptability
Improvement Master-driven continuous improvement
Expert-driven periodic improvement
Workforce-driven continuous improvement
Source ea erospac nitiative
© Deborah N ght nga e, 2005 Massachusetts Inst tute of Techno ogy ESD.61J 16.852J: Integrat ng the Lean Enterpr se Page 27
5. Strive for Perfection
Continuous radical and incremental improvement
Continuous Banishment of muda
Pursue Perfection, Not the Competition There Is No End to the Process of Reducing Efforts, Space, Costs and Mistakes
© Deborah N ght nga e, 2005 Massachusetts Inst tute of Techno ogy ESD.61J 16.852J: Integrat ng the Lean Enterpr se Page 28
Lean Thinking Differs Sharply from Craft and Mass Production in Important Ways
: L n A e I
i i l i l/ i i
liall l
MinimiI
i i
Ii
l
Ii
ll
l ii
ifii
i lI l
iii iti it
All
le
l i i
ili
Elimil
i ii ll i
il ii
Value Stream Mapping
© Deborah N ght nga e, 2005 Massachusetts Inst tute of Techno ogy ESD.61J 16.852J: Integrat ng the Lean Enterpr se Page 29
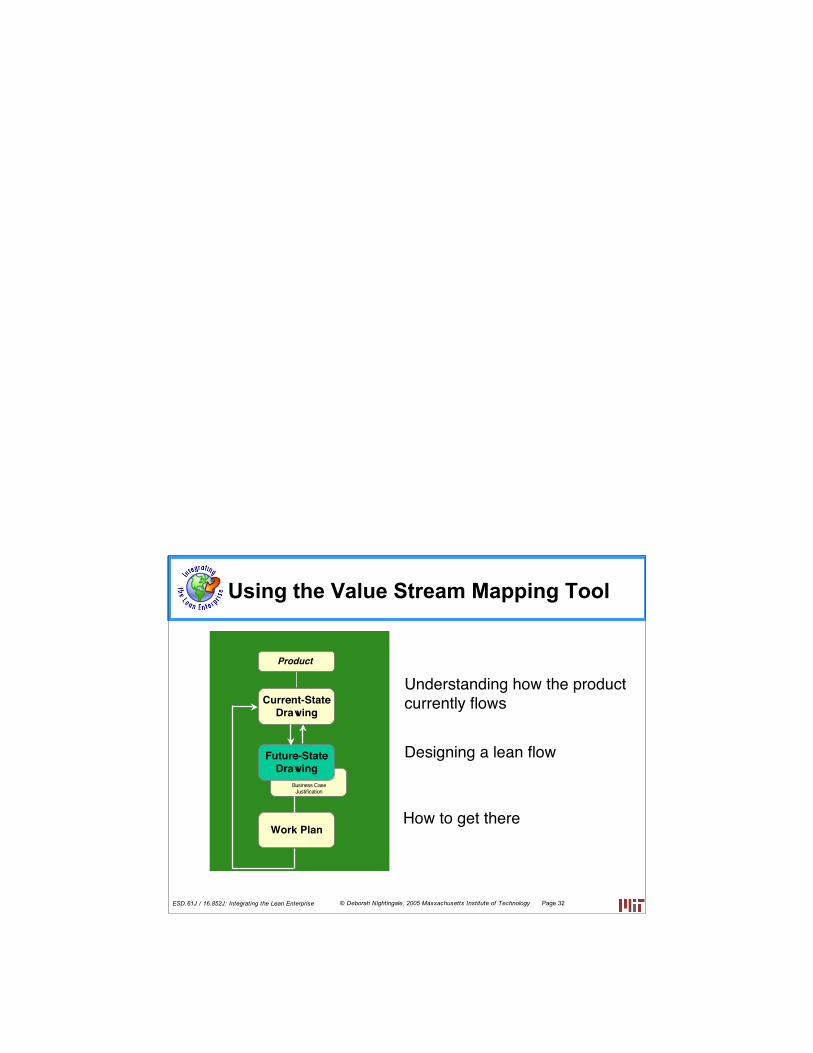
Lean Thinking is Linked to & Complements Other Systemic Change Initiatives
De ver Value to Stakeho ders
ze Waste & ncrease
Customer Sat sfact on
ncrease Enterpr se Performance & Customer Va ue
mprove Eff ciency & Shareho der Va ue
Business Model
Evo ut onary System c Change
Process-spec c; cont nuous
Rad ca Change ncrementaChange Process
Enterpr se Value Stream
Enterpr se Bus ness UnBus ness UnScope
Enterprise Processes & Peop
Al Sources of Product Var at on
Bus ness Processes
Product Qua ty Focus
nate Waste to Create Va ue
Reduce Var at on n a Enterpr se
Operat ons
Breakthrough So ut ons
Meet Customer Expectat ons
Goal
Lean Traditional Six Sigma
Reengineering Total Quality Management
i i l i l/ i i
Product
ii i
Understanding how the productcurrently flows
Designing a lean flow
How to get there
© Deborah N ght nga e, 2005 Massachusetts Inst tute of Techno ogy ESD.61J 16.852J: Integrat ng the Lean Enterpr se Page 32
Current-State Drawing
Future-State Drawing
Work Plan
Bus ness Case Just ficat on
Using the Value Stream Mapping Tool
i i l i l/ i i
• ’
• • • • • •
i i l i l/ i i
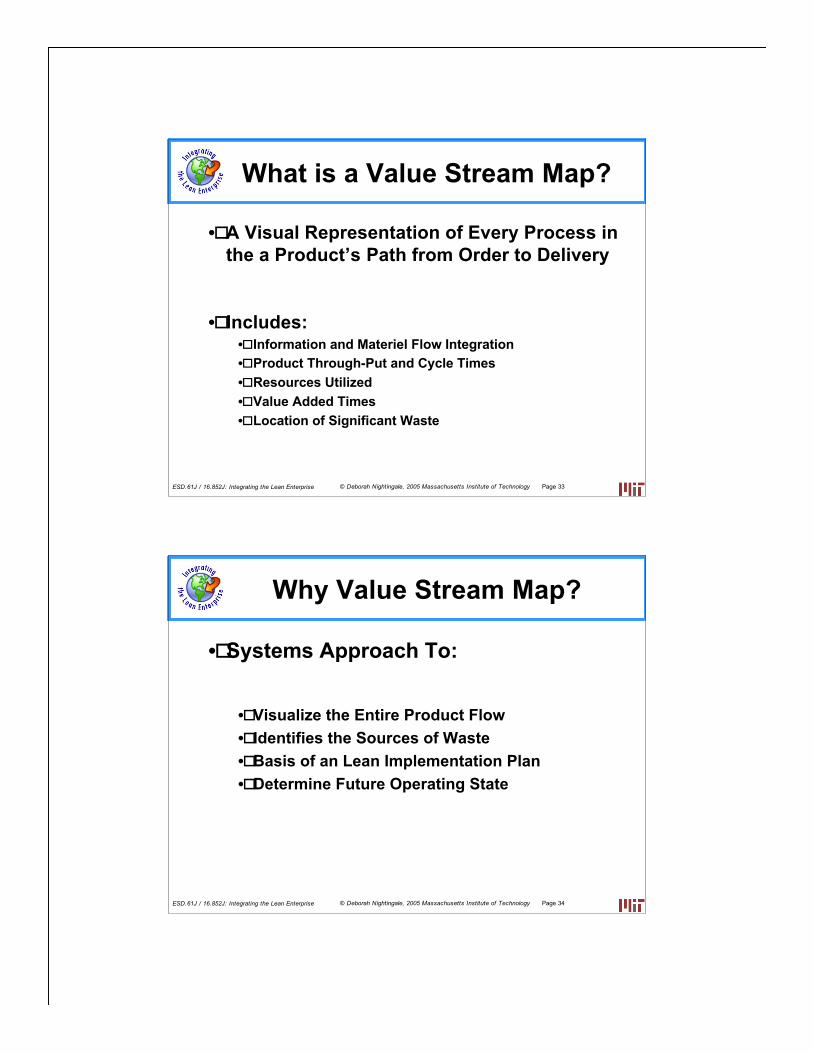
•
• Visualize the Entire Product Flow • Identifies the Sources of Waste • Basis of an Lean Implementation Plan • Determine Future Operating State
© Deborah N ght nga e, 2005 Massachusetts Inst tute of Techno ogy ESD.61J 16.852J: Integrat ng the Lean Enterpr se Page 33
What is a Value Stream Map?
A Visual Representation of Every Process in the a Product s Path from Order to Delivery
Includes: Information and Materiel Flow Integration Product Through-Put and Cycle Times Resources Utilized Value Added Times Location of Significant Waste
© Deborah N ght nga e, 2005 Massachusetts Inst tute of Techno ogy ESD.61J 16.852J: Integrat ng the Lean Enterpr se Page 34
Why Value Stream Map?
Systems Approach To:
i i l i l/ i i
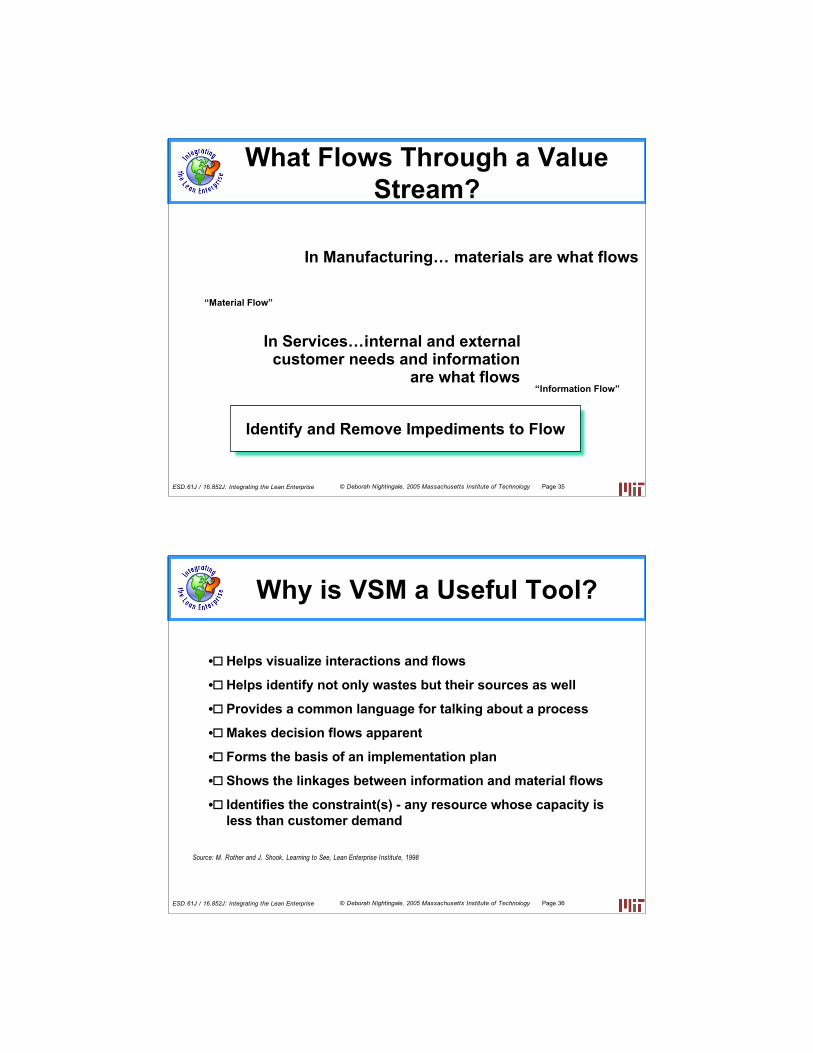
“ ”
Identify and Remove Impediments to Flow
In Manufacturing… materials are what flows
In Services…customer needs and information
are what flows “ ”
© Deborah N ght nga e, 2005 Massachusetts Inst tute of Techno ogy ESD.61J 16.852J: Integrat ng the Lean Enterpr se Page 35
Material Flow
internal and external
Information Flow
What Flows Through a Value Stream?
i i l i l/ i i
•
•
•
•
•
•
• (s)
i i I i
© Deborah N ght nga e, 2005 Massachusetts Inst tute of Techno ogy ESD.61J 16.852J: Integrat ng the Lean Enterpr se Page 36
Why is VSM a Useful Tool?
Helps visualize interactions and flows
Helps identify not only wastes but their sources as well
Provides a common language for talking about a process
Makes decision flows apparent
Forms the basis of an implementation plan
Shows the linkages between information and material flows
Identifies the constraint - any resource whose capacity is less than customer demand
Source: M. Rother and J. Shook, Learn ng to See, Lean Enterpr se nst tute, 1998
i i l i l/ i i
“ ” •
•
“ ”
• •
“ ” “ ”
i i l i l/ i i
•
•
•
•
© Deborah N ght nga e, 2005 Massachusetts Inst tute of Techno ogy ESD.61J 16.852J: Integrat ng the Lean Enterpr se Page 37
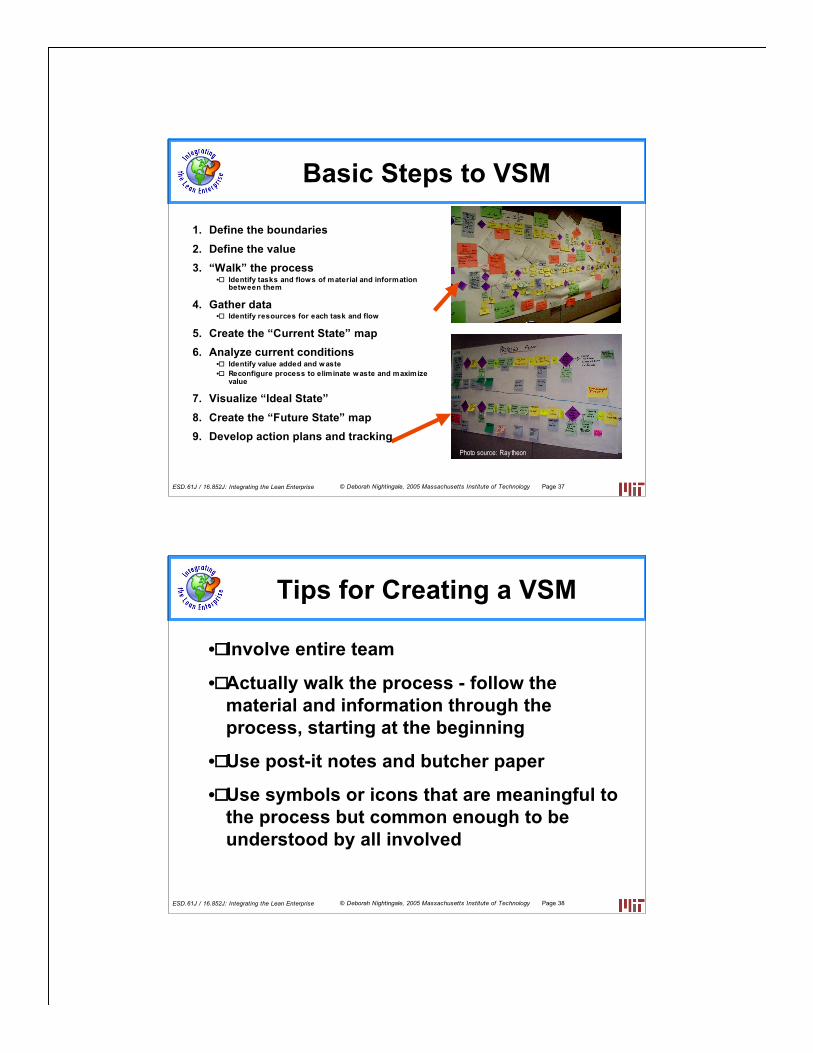
Basic Steps to VSM
1. Define the boundaries 2. Define the value 3. Walk the process
Identify tasks and flow s of m aterial and inform ation betw een them
4. Gather data Identify resources for each task and flow
5. Create the Current State map 6. Analyze current conditions
Identify value added and w aste Reconfigure process to elim inate w aste and m axim ize value
7. Visualize Ideal State8. Create the Future State map 9. Develop action plans and tracking
Photo source: Ray theon
© Deborah N ght nga e, 2005 Massachusetts Inst tute of Techno ogy ESD.61J 16.852J: Integrat ng the Lean Enterpr se Page 38
Tips for Creating a VSM
Involve entire team
Actually walk the process - follow the material and information through the process, starting at the beginning
Use post-it notes and butcher paper
Use symbols or icons that are meaningful to the process but common enough to be understood by all involved
i i l i l/ i i
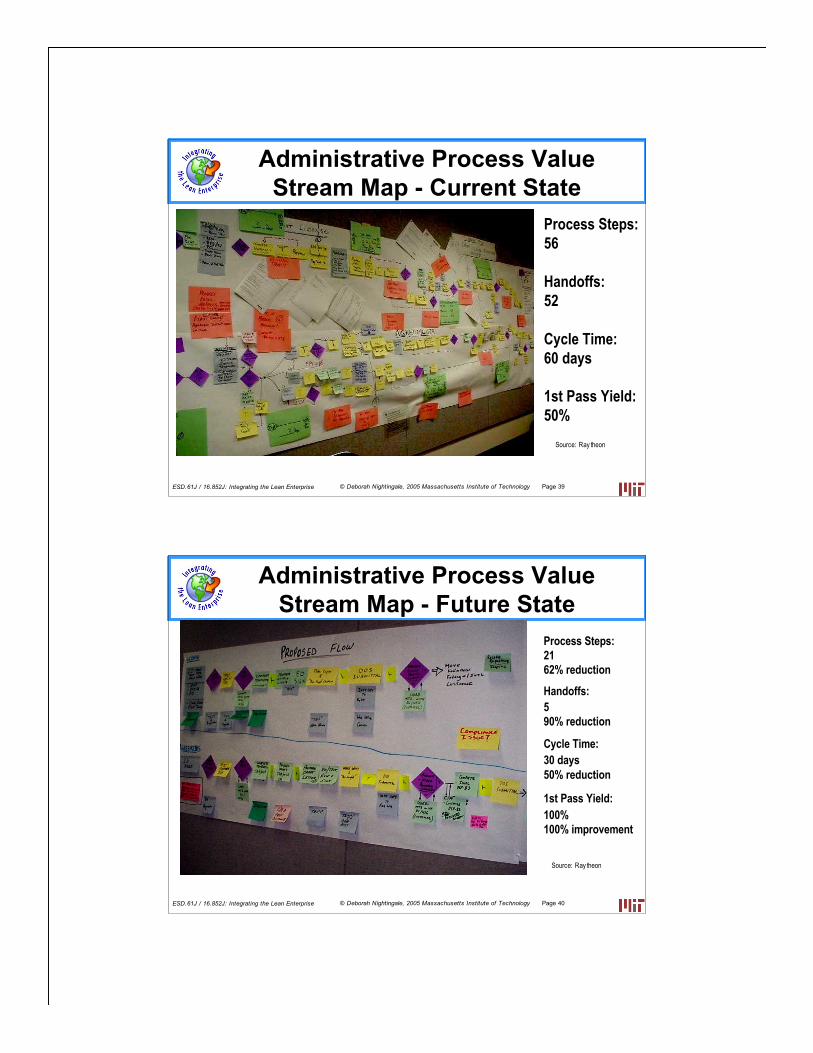
Administrative Process Value Stream Map - Current State
Process Steps: 56
Handoffs: 52
Cycle Time: 60 days
1st Pass Yield: 50%
i i l i l/ i i
Administrative Process Value Stream Map - Future State
i
5 i
l i
i
iel
i
© Deborah N ght nga e, 2005 Massachusetts Inst tute of Techno ogy ESD.61J 16.852J: Integrat ng the Lean Enterpr se Page 39
Source: Ray theon
© Deborah N ght nga e, 2005 Massachusetts Inst tute of Techno ogy ESD.61J 16.852J: Integrat ng the Lean Enterpr se Page 40
Process Steps: 21 62% reduct on
Handoffs:
90% reduct on
Cyc e T me: 30 days 50% reduct on
1st Pass Y d: 100% 100% mprovement
Source: Ray theon
© Deborah Nightingale, 2005 Massachusetts Institute of TechnologyESD.61J / 16.852J: Integrating the Lean Enterprise Page 41
Learn by Doing!Learn by Doing!
ThisThis
ProcessProcess
Works!!Works!!
Follow the Process
Keys for Success with VSM
• Remember that value stream mapping & analysis is a process
• Avoid short-cuts…the steps are important!
• Remind yourself and your team to be disciplined
"We can skip this step" "We already know how we
want to make this" "Let's not worry about that
for now"
© Deborah Nightingale, 2005 Massachusetts Institute of TechnologyESD.61J / 16.852J: Integrating the Lean Enterprise Page 42
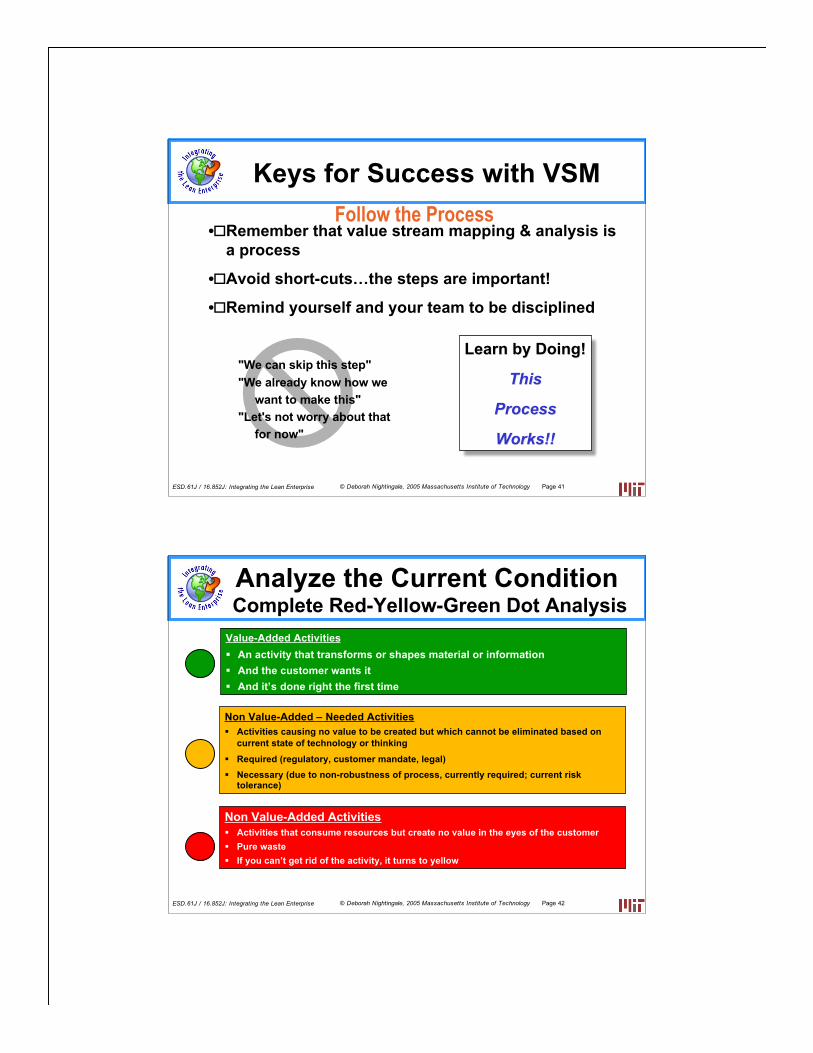
Value-Added Activities An activity that transforms or shapes material or information And the customer wants it And it’s done right the first time
Non Value-Added – Needed Activities Activities causing no value to be created but which cannot be eliminated based on
current state of technology or thinking Required (regulatory, customer mandate, legal) Necessary (due to non-robustness of process, currently required; current risk
tolerance)
Non Value-Added Activities Activities that consume resources but create no value in the eyes of the customer Pure waste If you can’t get rid of the activity, it turns to yellow
Analyze the Current Condition Complete Red-Yellow-Green Dot Analysis
i i l i l/ i i
•
•
•
•
•
•
•
© Deborah N ght nga e, 2005 Massachusetts Inst tute of Techno ogy ESD.61J 16.852J: Integrat ng the Lean Enterpr se Page 43
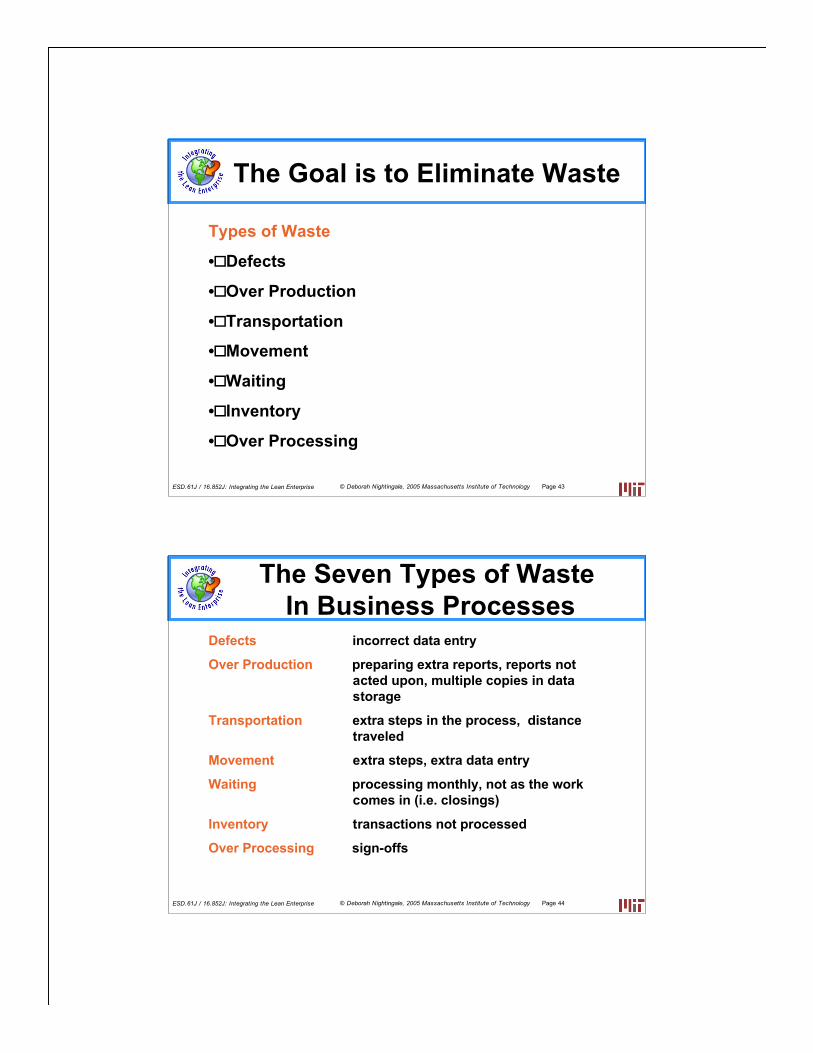
The Goal is to Eliminate Waste
Types of Waste
Defects
Over Production
Transportation
Movement
Waiting
Inventory
Over Processing
i i l i l/ i i
( )
© Deborah N ght nga e, 2005 Massachusetts Inst tute of Techno ogy ESD.61J 16.852J: Integrat ng the Lean Enterpr se Page 44
The Seven Types of Waste In Business Processes
Defects incorrect data entry
Over Production preparing extra reports, reports not acted upon, multiple copies in data storage
Transportation extra steps in the process, distance traveled
Movement extra steps, extra data entry
Waiting processing monthly, not as the work comes in i.e. closings
Inventory transactions not processed
Over Processing sign-offs
•
()
•
• •
• /
• • • / •
•
• ’
•
• •
• • •
•
• • • (
) • •
•
• •
( )
•
/
•
• (
)
( )
i
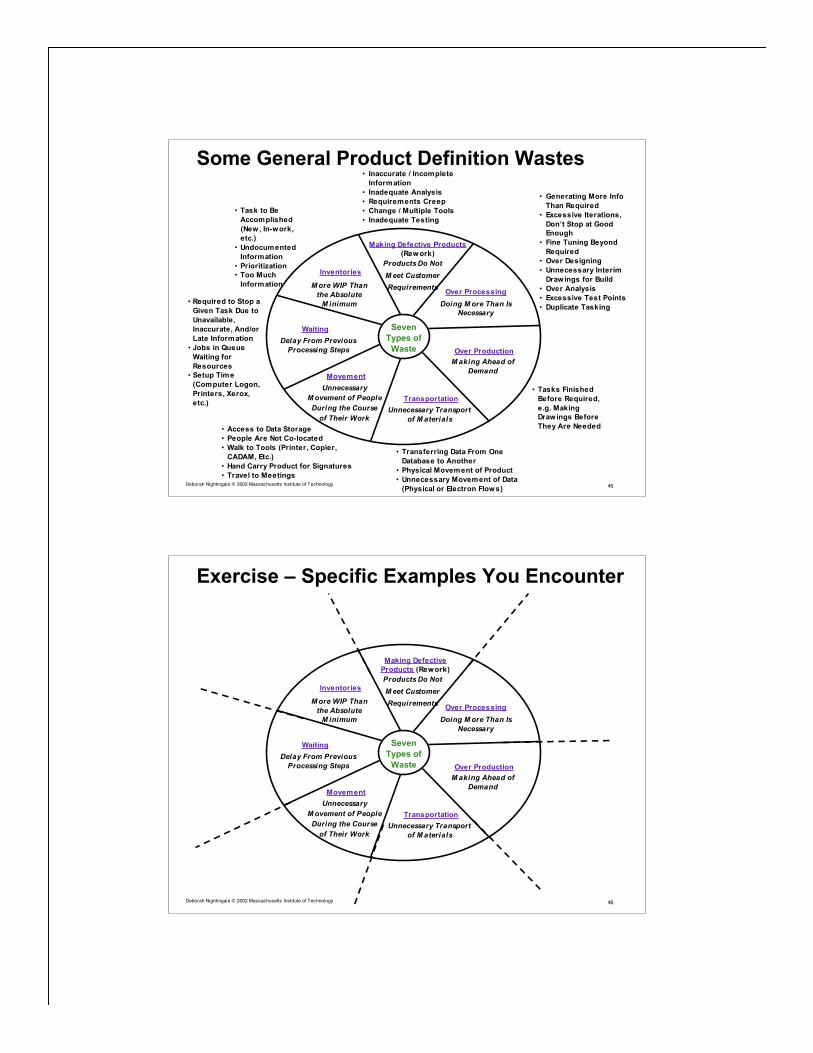
Some General Product Definition Wastes
Task to Be Accomplished New , In-w ork,
etc.Undocumented Information Prioritization Too Much Information
Inaccurate Incomplete Information Inadequate Analysis Requirements Creep Change Multiple Tools Inadequate Testing
Generating More Info Than Required Excessive Iterations, Don t Stop at Good Enough Fine Tuning Beyond Required Over Designing Unnecessary Interim Draw ings for Build Over Analysis Excessive Test Points Duplicate Tasking
Tasks Finished Before Required, e.g. Making Draw ings Before They Are Needed Access to Data Storage
People Are Not Co-located Walk to Tools Printer, Copier, CADAM, Etc.Hand Carry Product for Signatures Travel to Meetings
Transferring Data From One Database to Another Physical Movement of Product Unnecessary Movement of Data Physical or Electron Flow s
Required to Stop a Given Task Due to Unavailable, Inaccurate, And or Late Information Jobs in Queue Waiting for Resources Setup Time Computer Logon,
Printers, Xerox, etc.
Seven Types of
Waste M aking Ahead of
Demand
Delay From Previous Processing Steps
Unnecessary Transport of M aterials
Doing M ore Than Is Necessary
M ore WIP Than the Absolute
M inimum
Unnecessary M ovement of People
During the Course of Their Work
Products Do Not M eet Customer Requirements
Making Defective Products Rew ork
Inventories
Waiting
Movement
Transportation
Over Processing
Over Production
Deborah N ghtingale © 2002 Massachusetts Institute of Technology 45
–
( )
i
Exercise Specific Examples You Encounter
Seven Types of
Waste M aking Ahead of
Demand
Delay From Previous Processing Steps
Unnecessary Transport of M aterials
Doing M ore Than Is Necessary
M ore WIP Than the Absolute
M inimum
Unnecessary M ovement of People
During the Course of Their Work
Products Do Not M eet Customer Requirements
Making Defective Products Rew ork
Inventories
Waiting
Movement
Transportation
Over Processing
Over Production
Deborah N ghtingale © 2002 Massachusetts Institute of Technology 46