Embed Size (px)
Citation preview
Fundamentals of investing: Why invest?D. Scott PhillipsWells Fargo Advisors, LLC
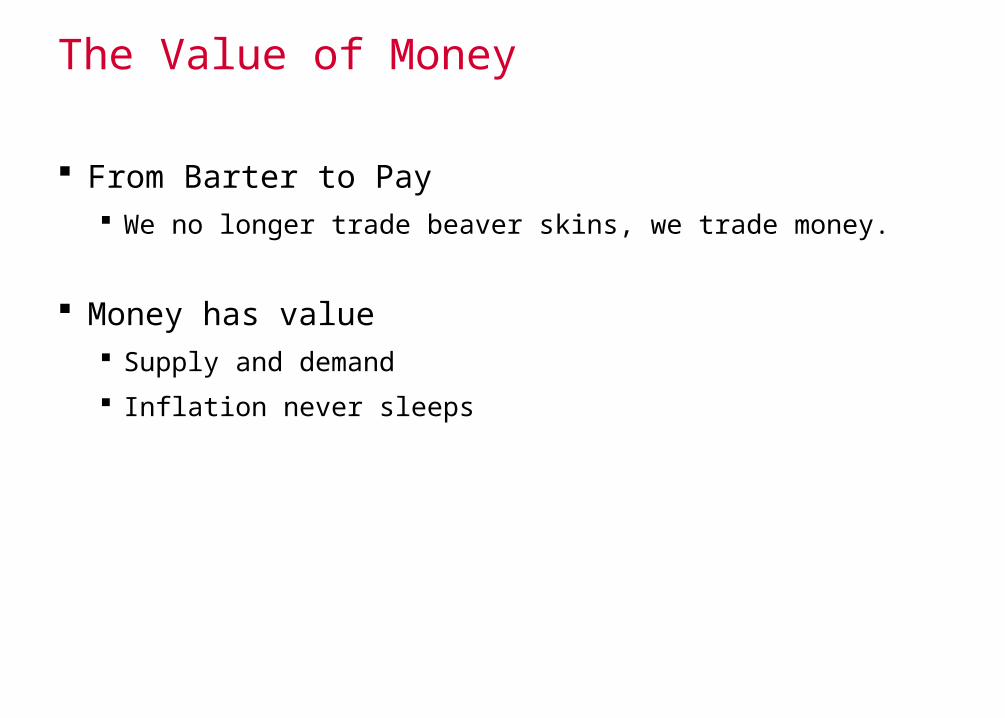
The Value of Money
From Barter to Pay We no longer trade beaver skins, we trade money.
Money has value Supply and demand
Inflation never sleeps
Philosophy of money
Spend
Loan
Own
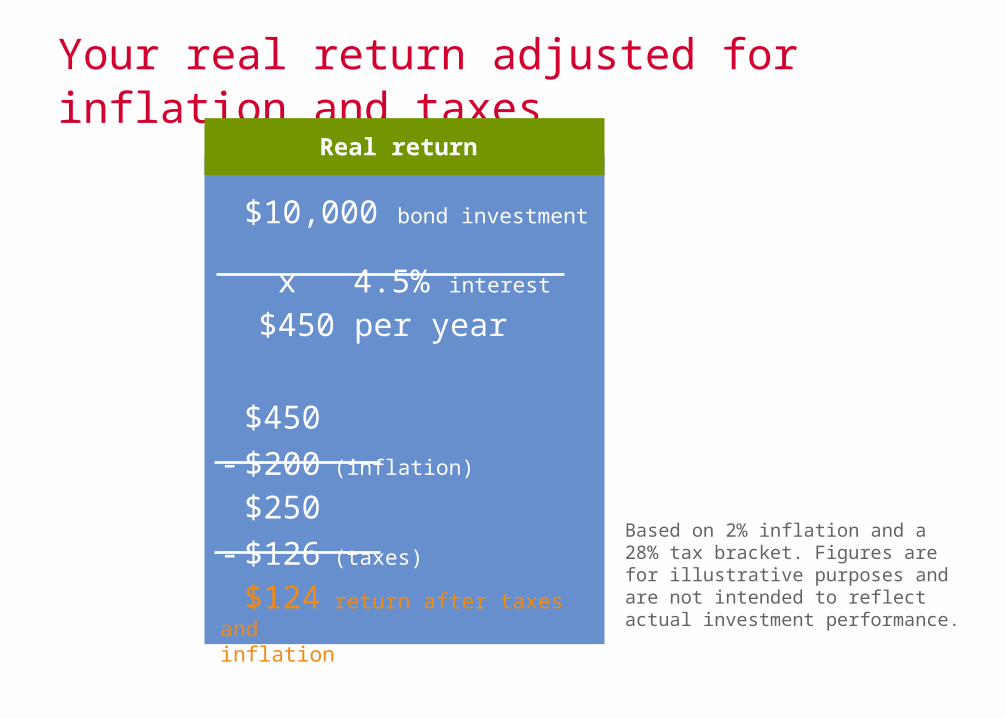
Based on 2% inflation and a 28% tax bracket. Figures are for illustrative purposes and are not intended to reflect actual investment performance.
Your real return adjusted for inflation and taxes
Taxable
$10,000 bond investment
x 4.5% interest
$450 per year
$450- $200 (inflation)
$250 - $126 (taxes)
$124 return after taxes and inflation
Real return
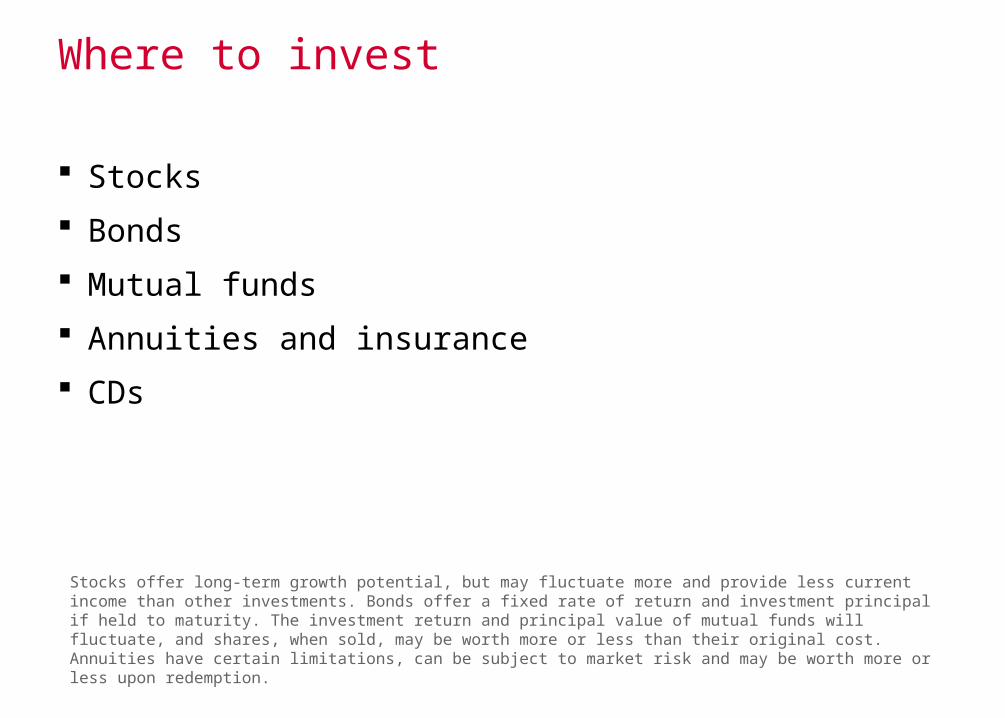
Where to invest
Stocks
Bonds
Mutual funds
Annuities and insurance
CDs
Stocks offer long-term growth potential, but may fluctuate more and provide less current income than other investments. Bonds offer a fixed rate of return and investment principal if held to maturity. The investment return and principal value of mutual funds will fluctuate, and shares, when sold, may be worth more or less than their original cost. Annuities have certain limitations, can be subject to market risk and may be worth more or less upon redemption.
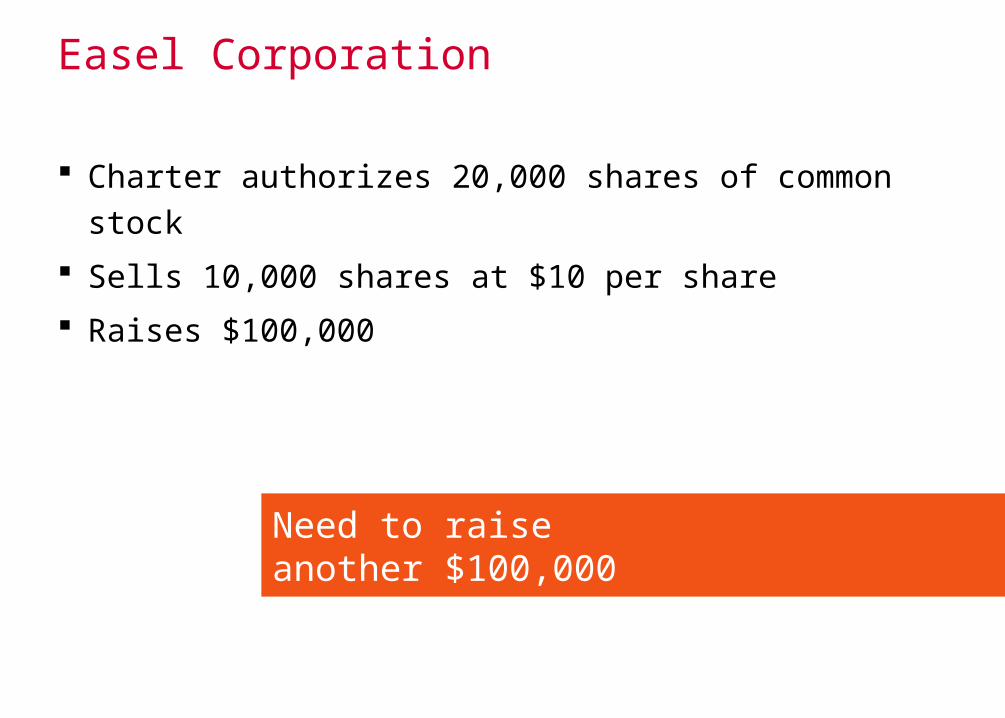
Easel Corporation
Charter authorizes 20,000 shares of common stock
Sells 10,000 shares at $10 per share
Raises $100,000
Need to raiseanother $100,000
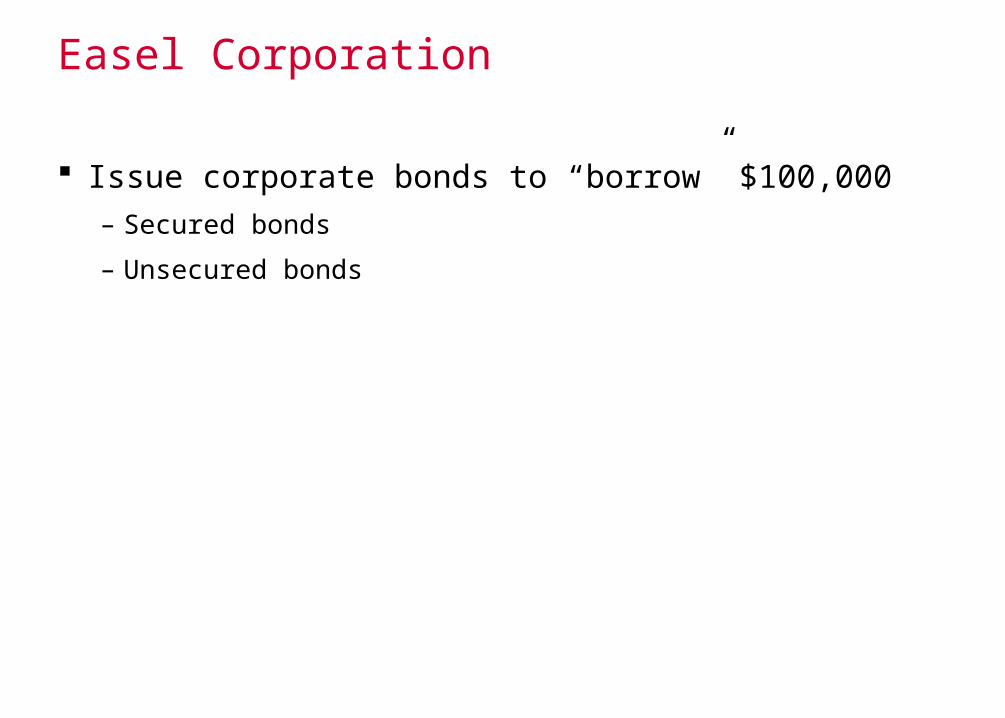
Easel Corporation
Issue corporate bonds to “borrow” $100,000– Secured bonds
– Unsecured bonds

Interest versus dividends
Interest: Rent– Bonds
– CDs
Dividends: Profits– Stocks
– Stock mutual funds
*Dividends are not guaranteed. A company can reduce or eliminate a dividend at any time.

Tracking a listed stock trade
Client places order
Financial Advisor enters order
Order is received on exchange floor

Tracking a listed stock trade
Floor broker executes order
Execution report is generated. Electronic tape shows “Z2s40.38”
Confirmation is printed and mailed to client
Client places order
Financial Advisor enters order
Order is received on exchange floor

Three-day settlement rule
Keep money on deposit with brokerage firm
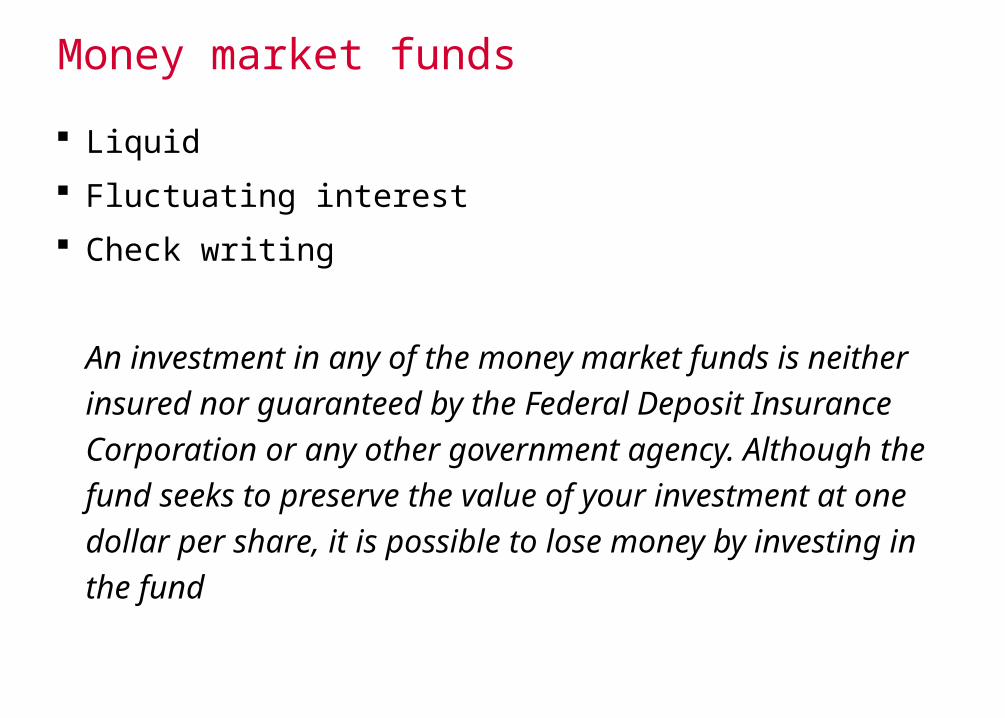
Money market funds
Liquid
Fluctuating interest
Check writing
An investment in any of the money market funds is neither insured nor guaranteed by the Federal Deposit Insurance Corporation or any other government agency. Although the fund seeks to preserve the value of your investment at one dollar per share, it is possible to lose money by investing in the fund
Asset allocation
The blending of stocks, bonds and cash in your portfolio

Simple interest
$1,000 x 1.05$1,050
$1,000 x 1.05$1,050
Year 2
$1,000 x 1.05$1,050
Year 1 Year 3
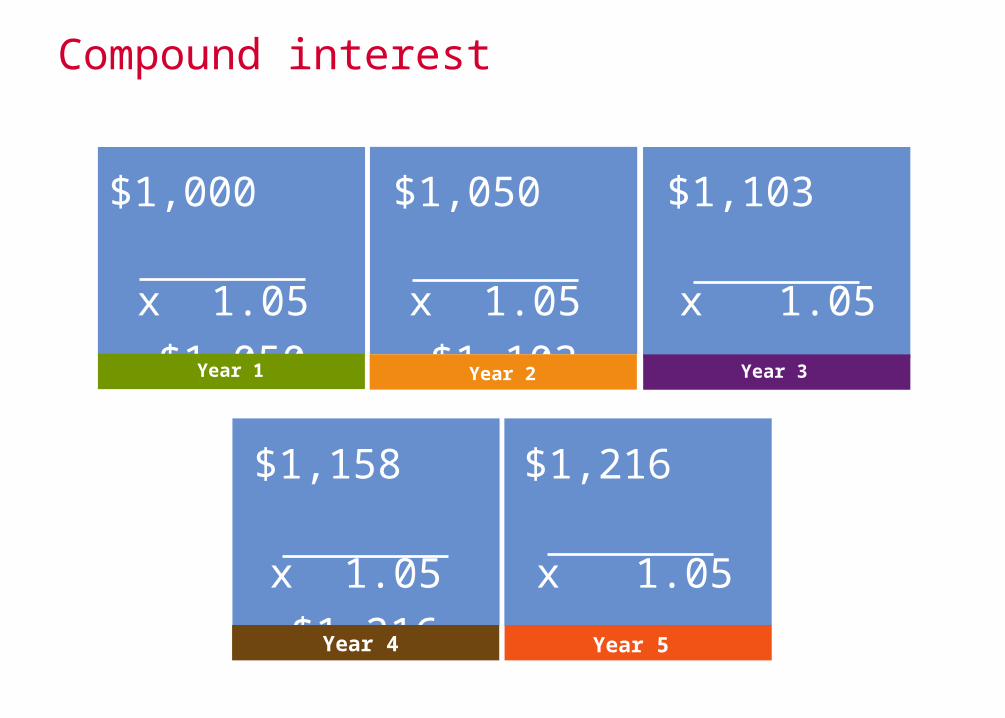
Compound interest
$1,050 x 1.05$1,103
$1,103 x 1.05 $1,158
$1,000 x 1.05$1,050
Year 1 Year 2 Year 3
$1,158 x 1.05$1,216
$1,216 x 1.05$1,277
Year 4 Year 5
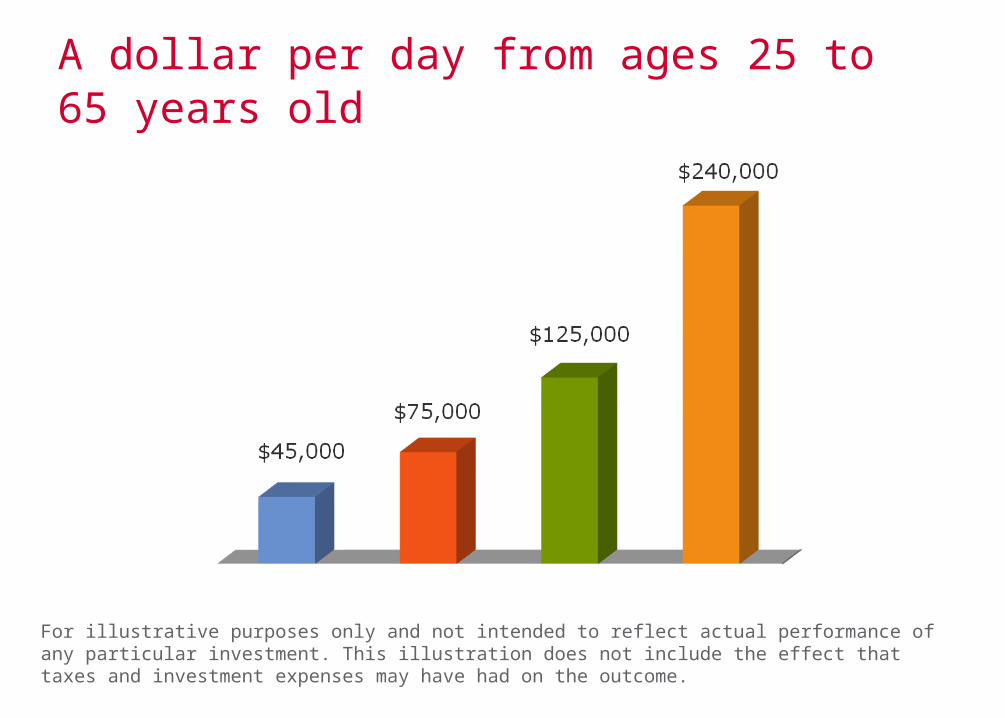
For illustrative purposes only and not intended to reflect actual performance of any particular investment. This illustration does not include the effect that taxes and investment expenses may have had on the outcome.
A dollar per day from ages 25 to 65 years old
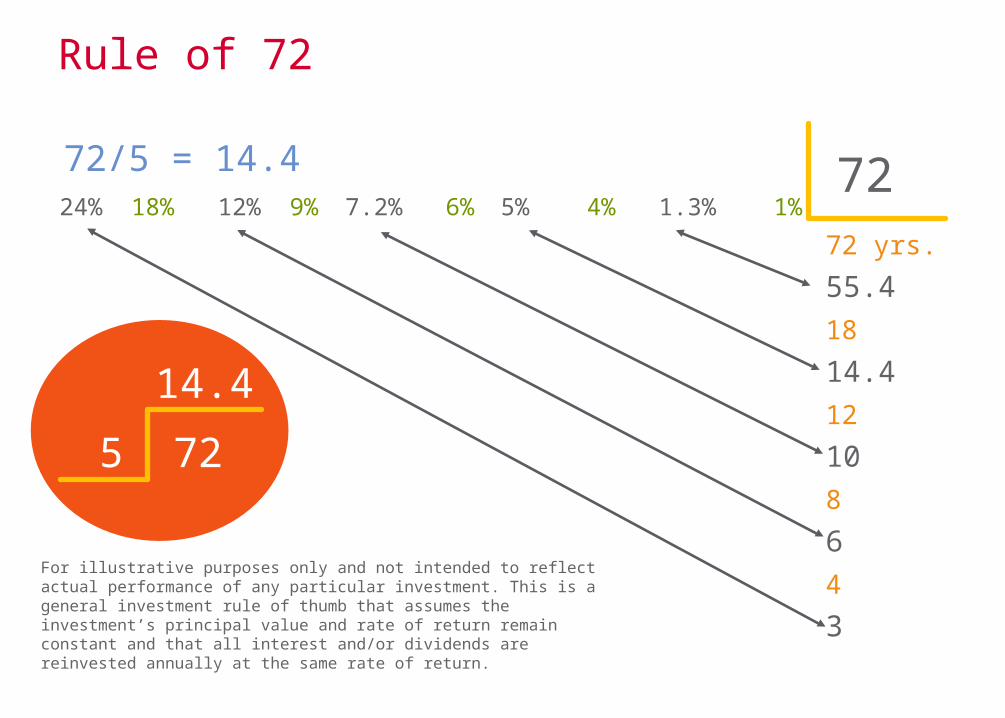
72/5 = 14.4 72
For illustrative purposes only and not intended to reflect actual performance of any particular investment. This is a general investment rule of thumb that assumes the investment’s principal value and rate of return remain constant and that all interest and/or dividends are reinvested annually at the same rate of return.
Rule of 72
72 yrs.
55.418
14.412
108
64
3
24% 18% 12% 9% 7.2% 6% 5% 4% 1.3% 1%
14.4
5 72
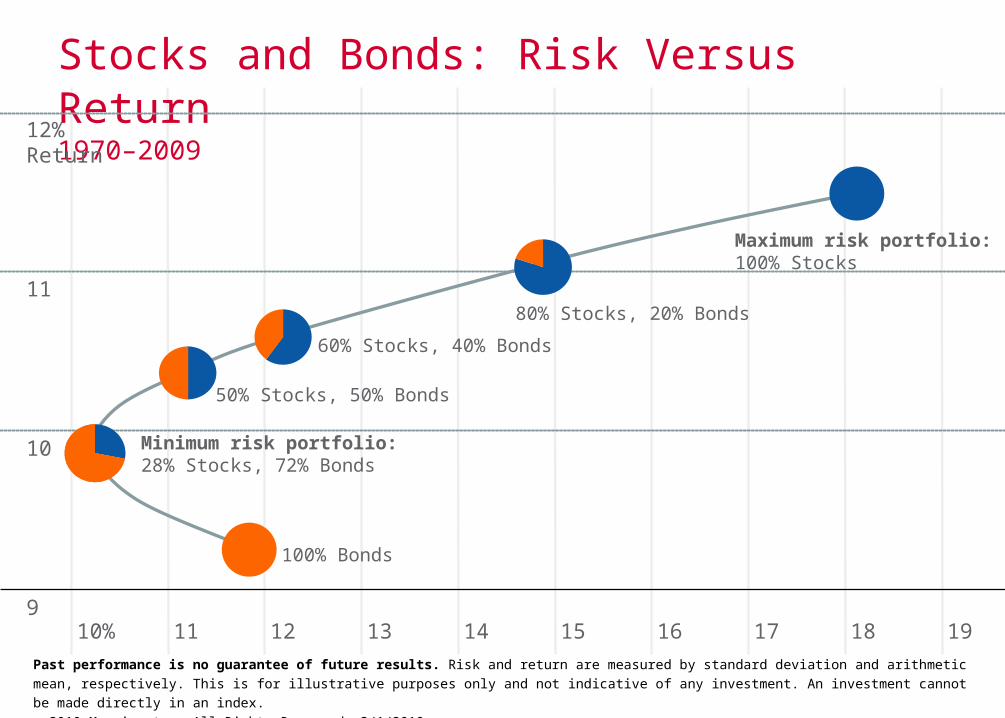
Stocks and Bonds: Risk Versus Return1970–2009
Past performance is no guarantee of future results. Risk and return are measured by standard deviation and arithmetic mean, respectively. This is for illustrative purposes only and not indicative of any investment. An investment cannot be made directly in an index. © 2010 Morningstar. All Rights Reserved. 3/1/2010
12% Return
11
10
9
Maximum risk portfolio:100% Stocks
60% Stocks, 40% Bonds
50% Stocks, 50% Bonds
100% Bonds
Minimum risk portfolio:28% Stocks, 72% Bonds
11 12 13 14 15 16 1917 1810%
80% Stocks, 20% Bonds
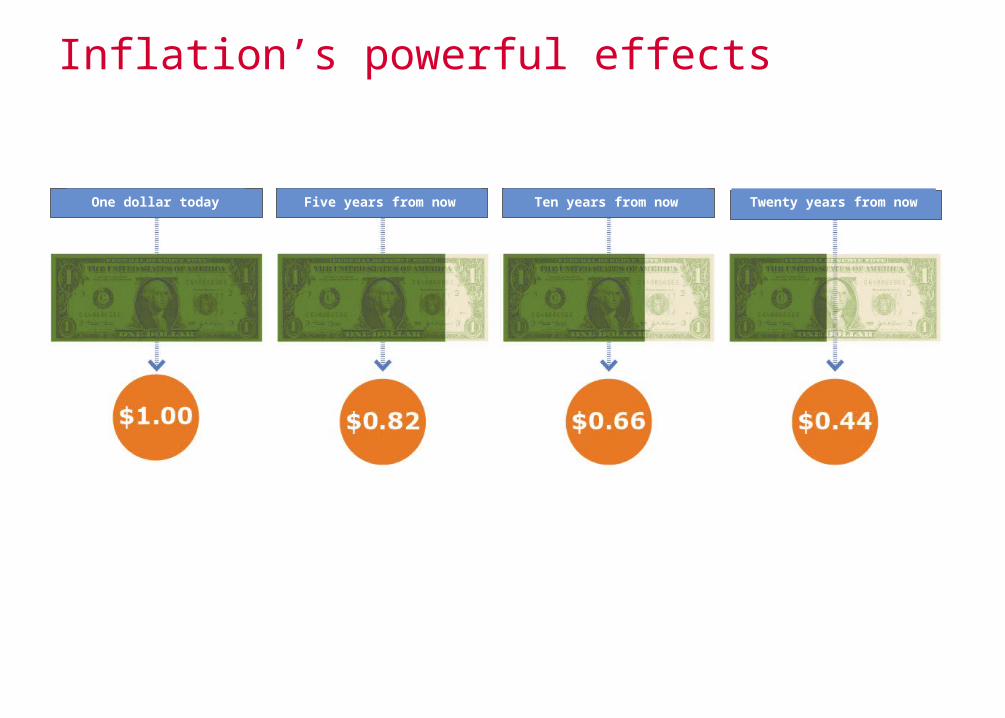
Inflation’s powerful effects
Source: Consumer Price Index
One dollar today Five years from now Ten years from now Twenty years from now
Why invest in stocks?
Inflation hedge
Growth potential
May issue dividends
Total-return potential
Facts about stock ownership
Stock investors own shares of a company
Almost half (47%) of all U.S. households own individual stocks*
There are a number of ways to invest in stocks: Individually
Mutual funds
Defined portfolios
Variable annuities
Private money managers
*Source: “Equity and Bond Ownership in America, 2008”. Investment Company Institute and the Securities Industry and Financial Markets Association survey, 2008.
Dividends
Portion of company’s profits paid to shareholders
Income investors choose companies with consistent dividend payments
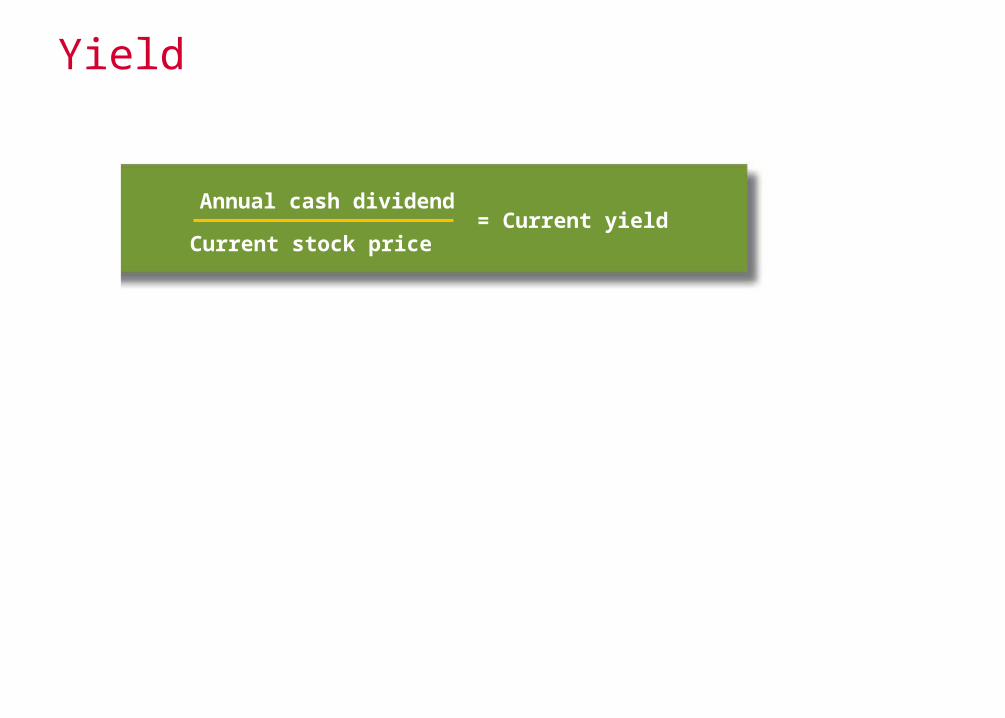
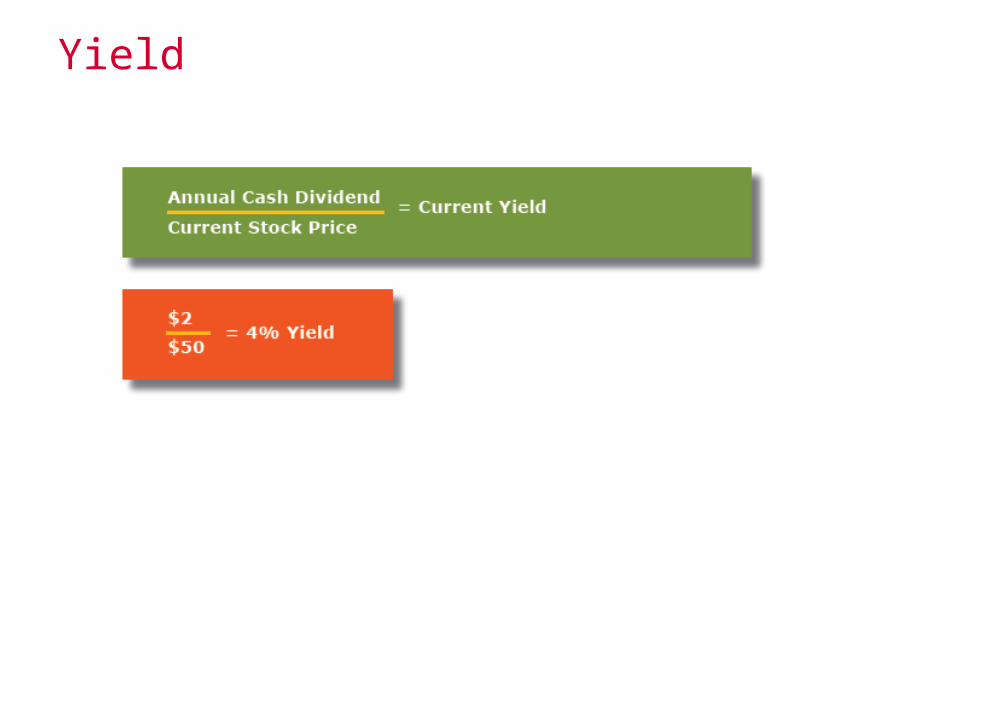
Yield
= Current yieldAnnual cash dividend
Current stock price
Yield
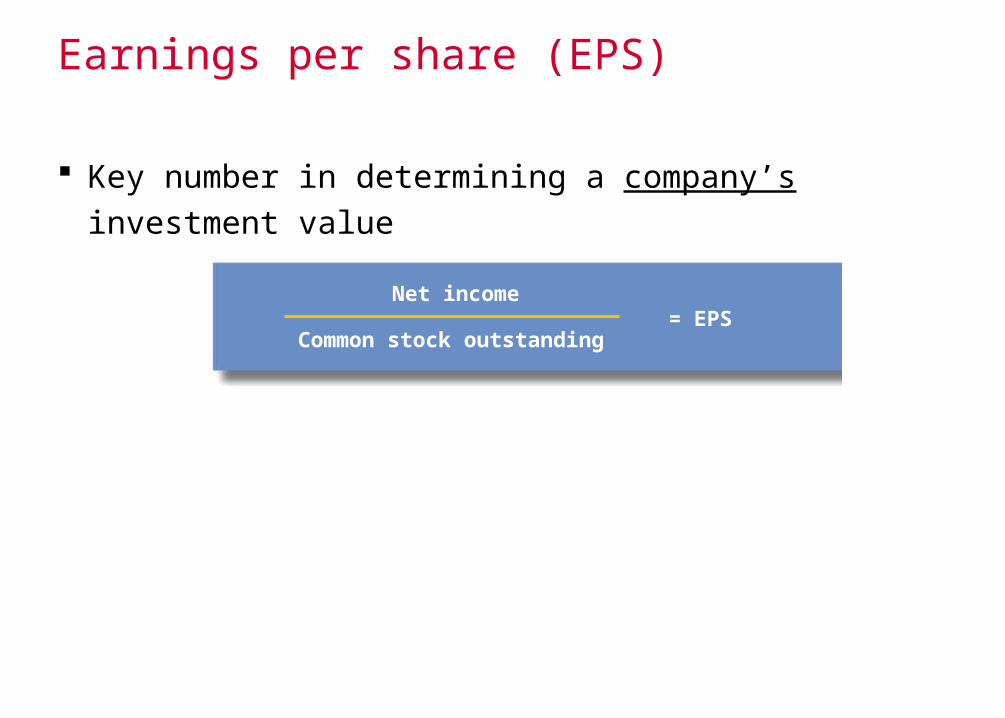
Earnings per share (EPS)
Key number in determining a company’s investment value
= EPSNet income
Common stock outstanding
Payout ratio
Important number for income investors
Dividend-to-EPS ratio
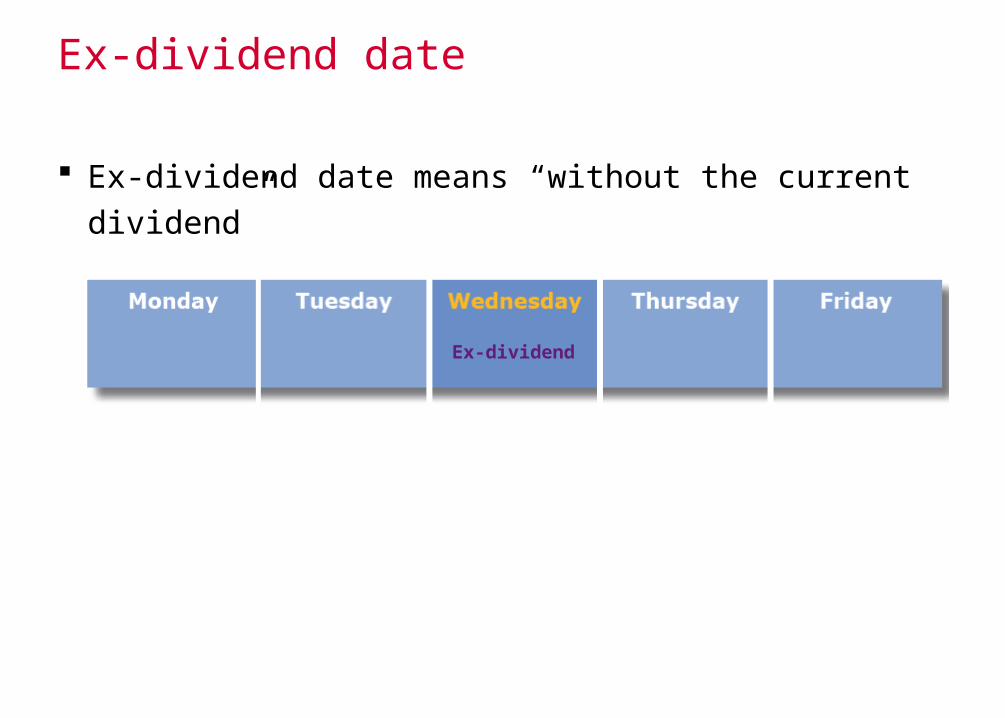
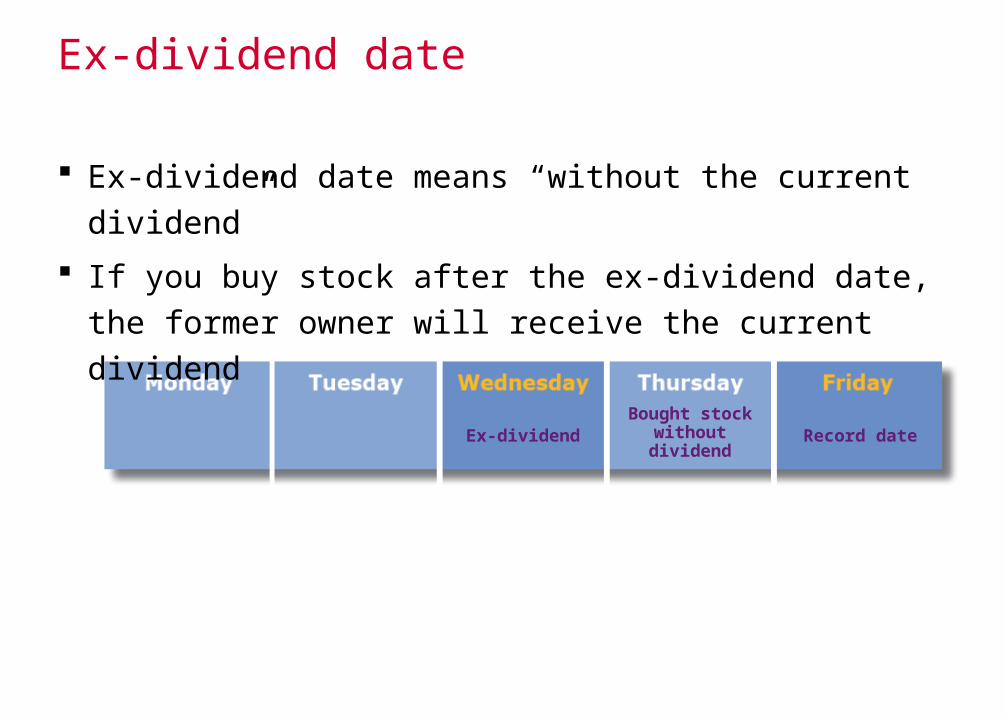
Ex-dividend date
Ex-dividend date means “without the current dividend”
Ex-dividend
Ex-dividend date
Ex-dividend date means “without the current dividend”
If you buy stock after the ex-dividend date, the former owner will receive the current dividend
Ex-dividendBought stock
without dividend
Record date

Stock split
Before split: 100 shares at $100 = $10,000
After 4-for-1 split: 400 shares at $25 = $10,000
How to invest in stocks
Establish goals
Establish your risk tolerance
Determine what to buy
Bonds
You are a lender to the company
You earn interest on the money you lend
Bonds
Were first issued in coupon form

Bonds
Were first issued in coupon form
Moved toward issuing bonds registered with the owner’s name on certificate

Bonds
Were first issued in coupon form
Moved toward issuing bonds registered with the owner’s name on certificate
Finally, issued in book-entry form
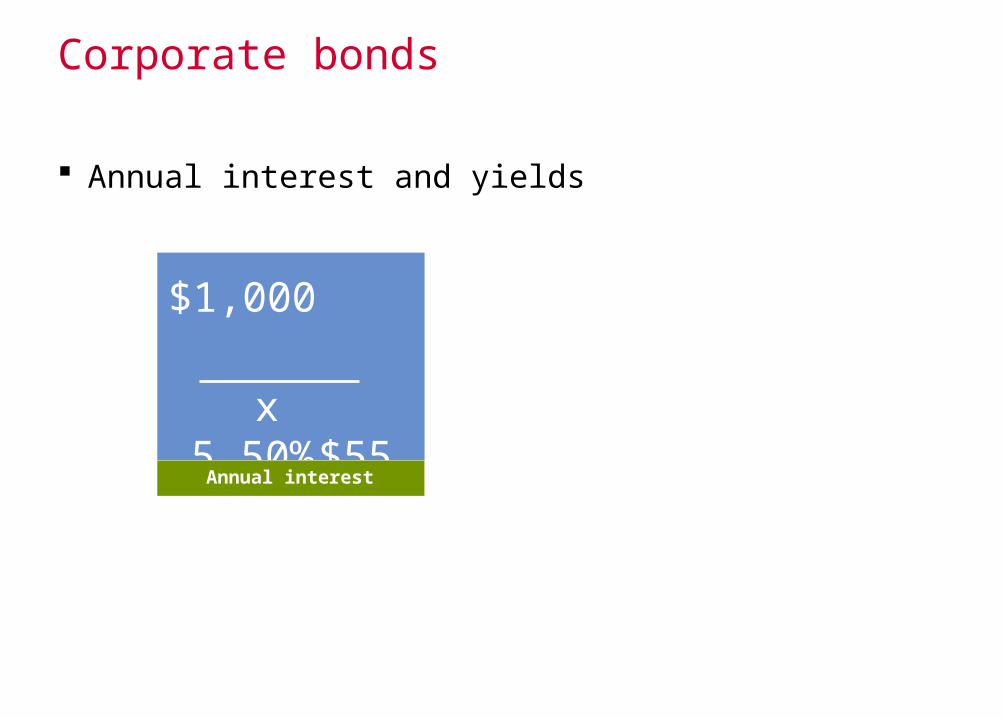
Corporate bonds
Annual interest and yields
Annual interest
$1,000 x 5.50%
$55
Annual interest
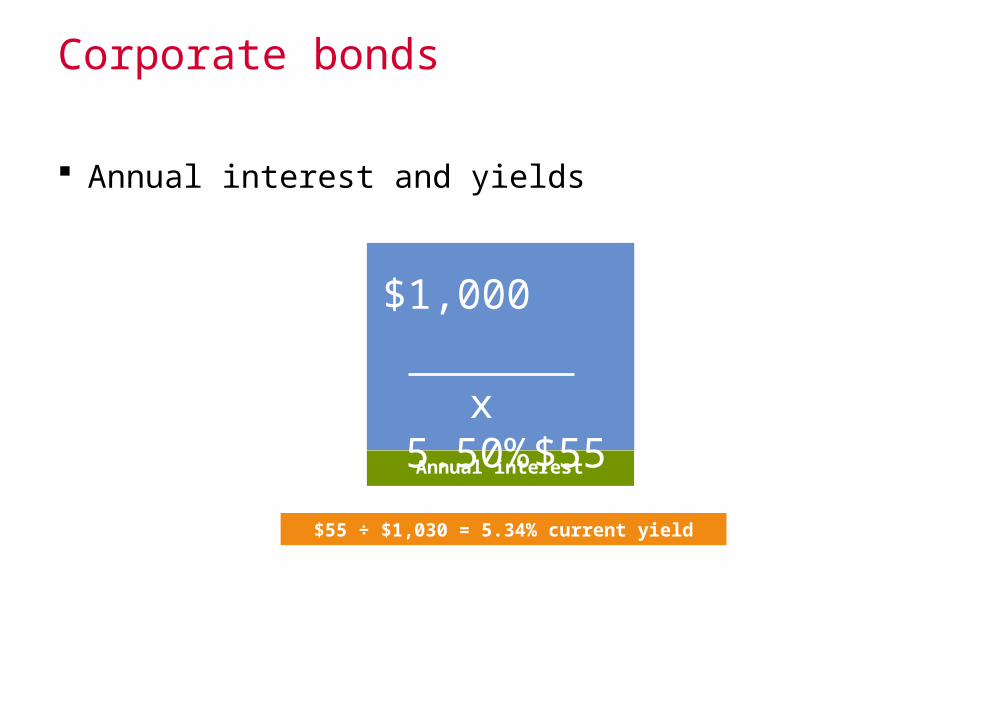
Corporate bonds
Annual interest and yields
$55 ÷ $1,030 = 5.34% current yield
$1,050
Annual interest
$1,000 x 5.50%
$55
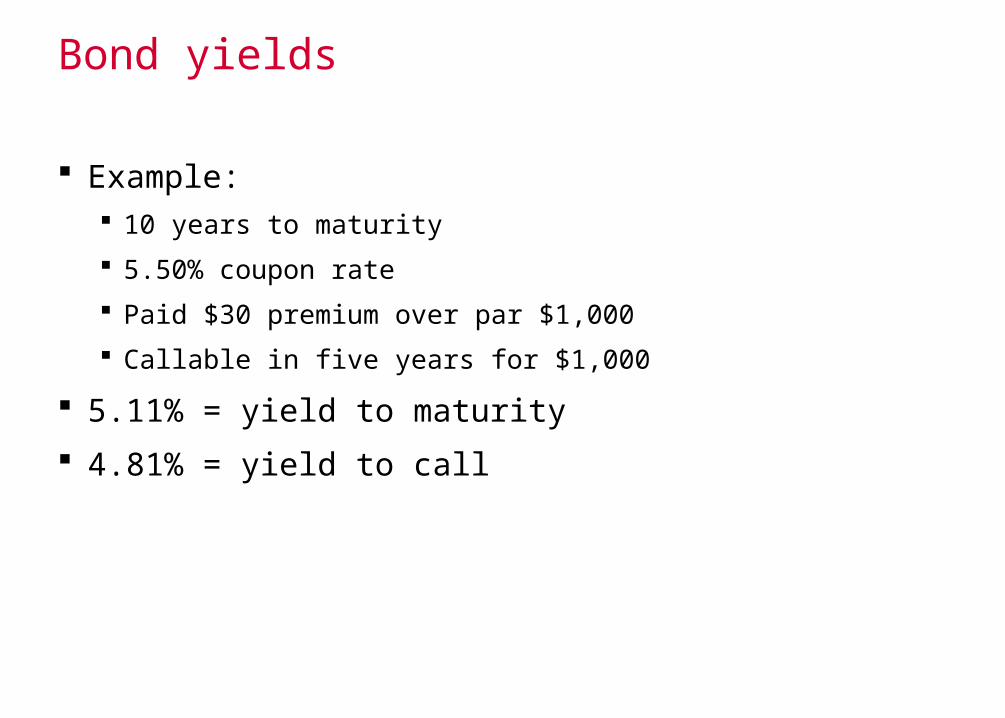
Bond yields
Example: 10 years to maturity
5.50% coupon rate
Paid $30 premium over par $1,000
Callable in five years for $1,000
5.11% = yield to maturity
4.81% = yield to call
Government bonds
$5,000 and $10,000 denominations
Guaranteed by the U.S. government as to timely payment of interest and principal
State-tax-free
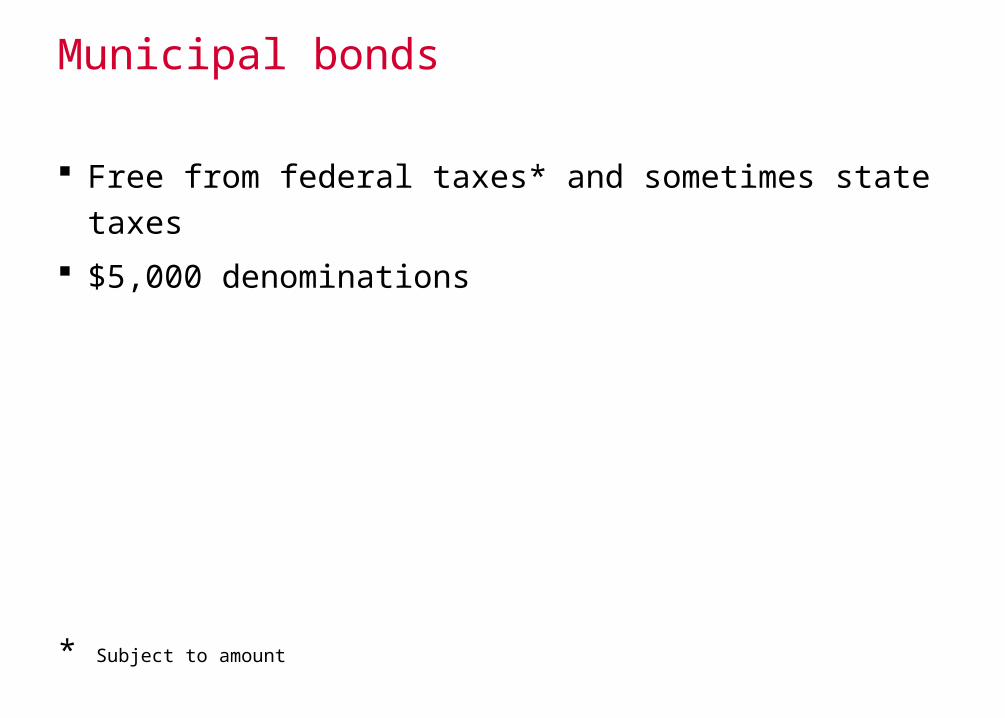
Municipal bonds
Free from federal taxes* and sometimes state taxes
$5,000 denominations
* Subject to amount
Municipal bonds
General obligation
Revenue

Taxable investment vs. municipal bonds
$10,000 x 4.5%
$450 interest
x 28% $126 taxes
$ 450 - 126 $324 after taxes
Taxable

Taxable investment vs. municipal bonds
$10,000 x 3.5%
$350 interest
x 28% $98 taxes
$ 350 - 0 $350 after taxes
Municipal
$10,000 x 4.5%
$450 interest
x 28% $126 taxes
$ 450 - 126 $324 after taxes
Taxable
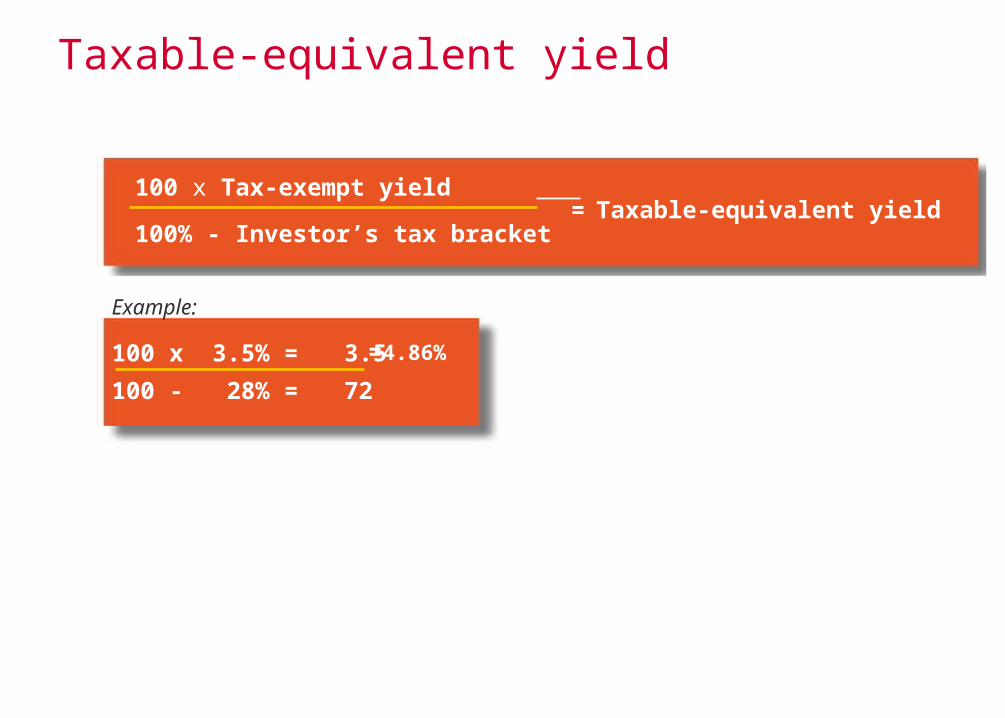
Taxable-equivalent yield
100 x Tax-exempt yield
100% - Investor’s tax bracket = Taxable-equivalent yield
Example:
100 x 3.5% = 3.5
100 - 28% = 72
=4.86%
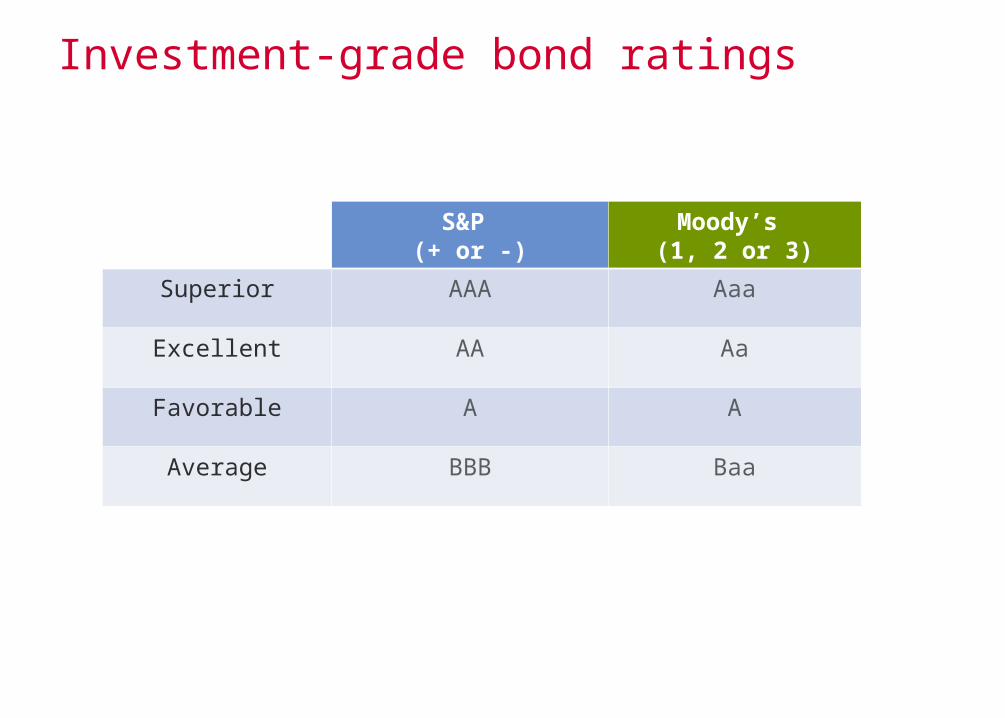
Investment-grade bond ratings
S&P (+ or -)
Moody’s (1, 2 or 3)
Superior AAA Aaa
Excellent AA Aa
Favorable A A
Average BBB Baa
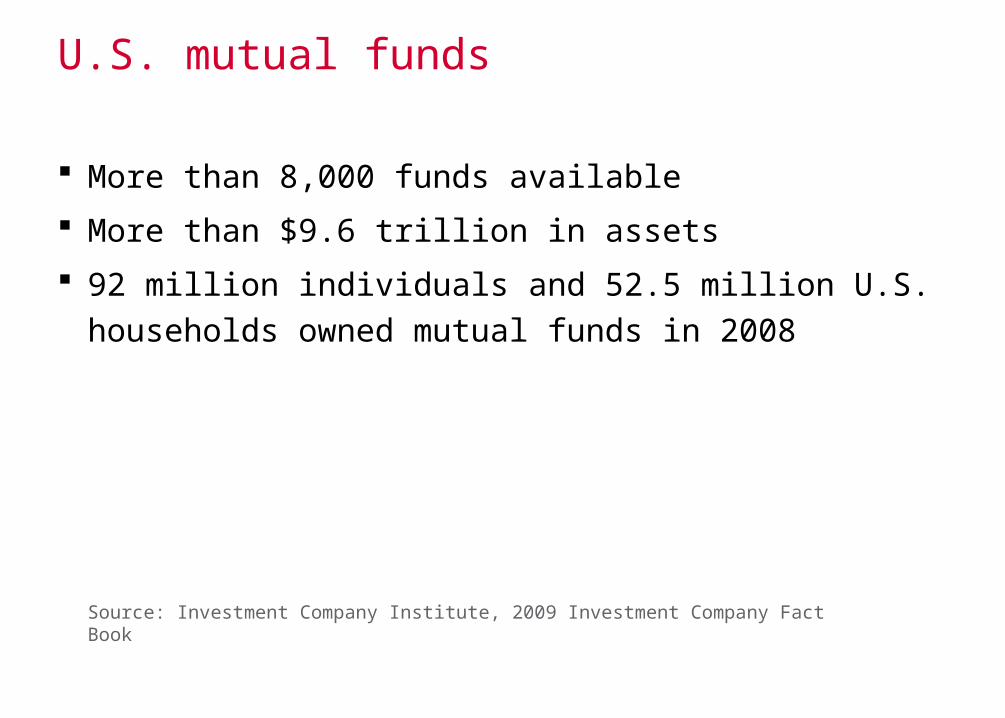
U.S. mutual funds
More than 8,000 funds available
More than $9.6 trillion in assets
92 million individuals and 52.5 million U.S. households owned mutual funds in 2008
Source: Investment Company Institute, 2009 Investment Company Fact Book

Mutual fund benefits
Professional management
Diversification
Pooled money
Liquidity
Did you know?
Mutual funds cannot hold money
Mutual funds cannot hold securities

Mutual fund pricing
Front-end load
Back-end load
No load
All funds have management fees
Fund families
Exchange privilege
Include funds managed to suit various investment risk and return objectives Growth
Income
Conservative
Aggressive
Taxation of mutual funds
Dividends — taxed as they occur
Trading profits — taxed as they occur

Exchange-traded funds (ETFs)
Index fund
Track one specific index
Buy/sell like stocks
Price set by underlying index
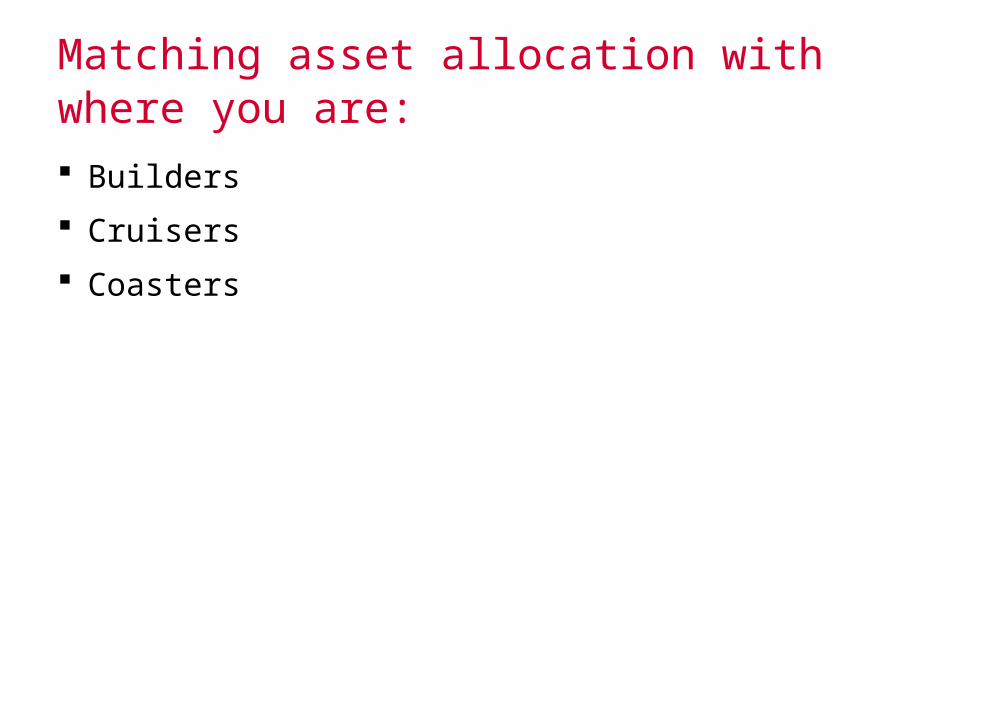
Matching asset allocation with where you are: Builders
Cruisers
Coasters
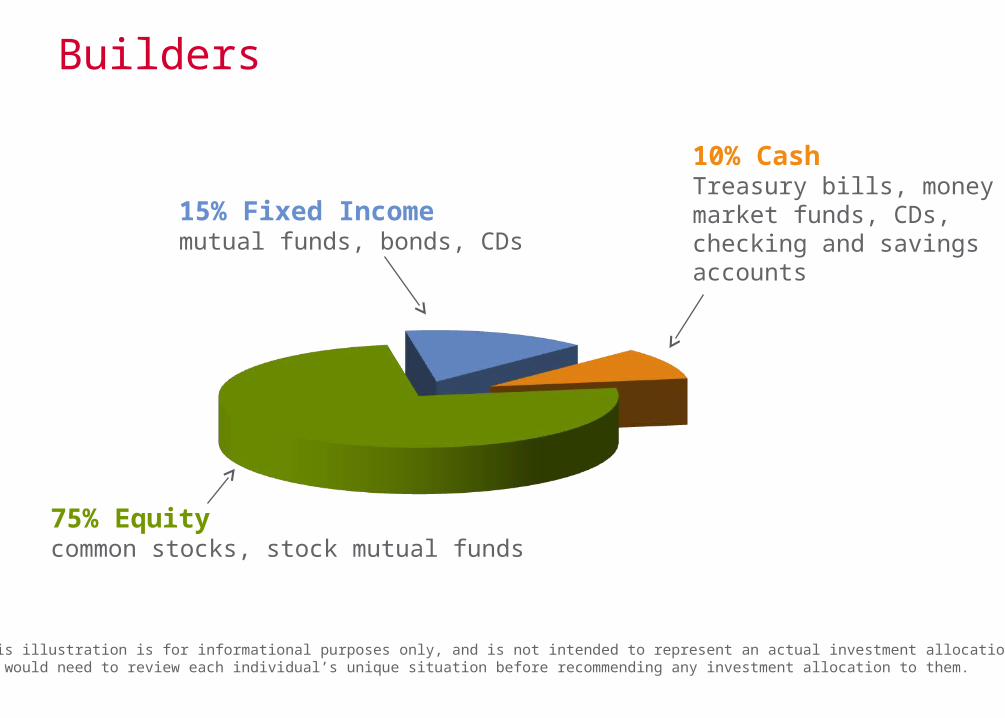
Builders
75% Equitycommon stocks, stock mutual funds
10% CashTreasury bills, money market funds, CDs, checking and savings accounts
15% Fixed Incomemutual funds, bonds, CDs
This illustration is for informational purposes only, and is not intended to represent an actual investment allocation. We would need to review each individual’s unique situation before recommending any investment allocation to them.
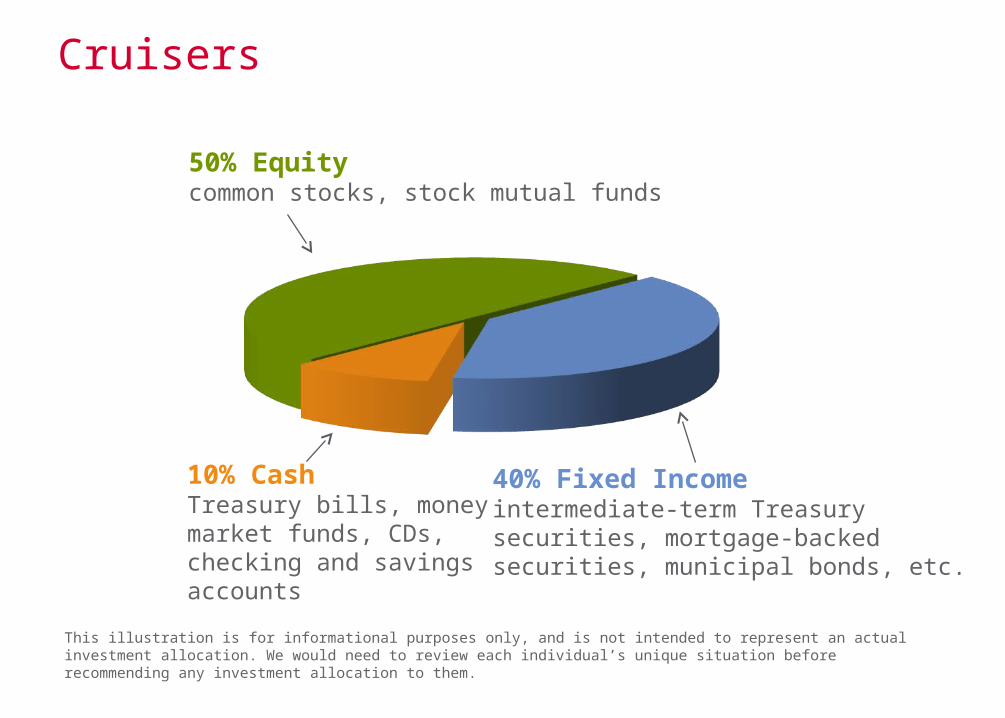
Cruisers
40% Fixed Incomeintermediate-term Treasurysecurities, mortgage-backed securities, municipal bonds, etc.
50% Equitycommon stocks, stock mutual funds
10% CashTreasury bills, money market funds, CDs, checking and savings accounts
This illustration is for informational purposes only, and is not intended to represent an actual investment allocation. We would need to review each individual’s unique situation before recommending any investment allocation to them.
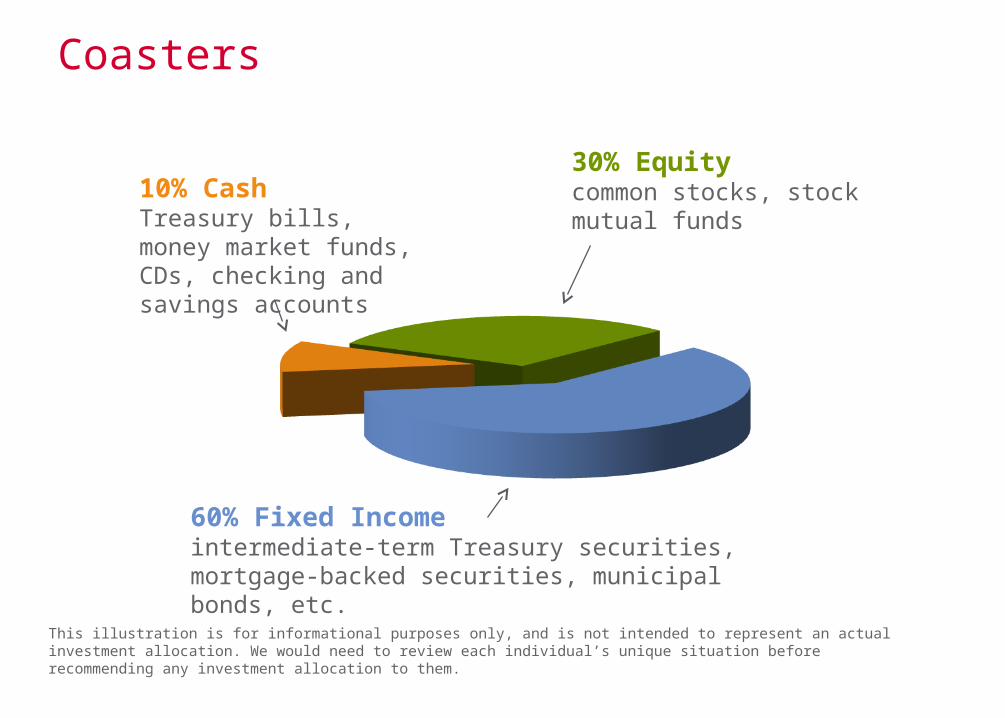
Coasters
60% Fixed Incomeintermediate-term Treasury securities, mortgage-backed securities, municipal bonds, etc.
30% Equitycommon stocks, stock mutual funds
10% CashTreasury bills, money market funds, CDs, checking and savings accounts
This illustration is for informational purposes only, and is not intended to represent an actual investment allocation. We would need to review each individual’s unique situation before recommending any investment allocation to them.
5656
©2010 Wells Fargo Advisors, LLC. All rights reserved. 0410-2337A [25326-v12] e6757 4/10
Wells Fargo Advisors is the trade name used by two separate, registered broker-dealers: Wells Fargo Advisors, LLC and Wells Fargo Advisors Financial Network, LLC, Members SIPC, non-bank affiliates of Wells Fargo & Company.
Insurance products are offered through nonbank insurance agency affiliates of Wells Fargo & Company and are underwritten by unaffiliated insurance companies.
Securities and Insurance Products:
Not Insured by FDIC or any Federal Government Agency
May Lose ValueNot a Deposit of or Guaranteed by a
Bank or Any Bank Affiliate