Embed Size (px)
Citation preview
Fundamental Investigation of Saturated Flow Through Porous Media with
Macropores
by
Yumao Jin
A thesis submitted to the Graduate Faculty of
Auburn University
in partial fulfillment of the
requirements for the Degree of
Master of Science
Auburn, Alabama
May 7, 2012
Keywords: Macropore, Hydraulic Conductivity
Copyright 2011 by Yumao Jin
Approved by
Dr. Navin Kumar C. Twarakavi, Chair, Assistant Professor of Agronomy and Soils
Dr. T. Prabhakar Clement, Professor and Arthur H. Feagin Chair of Civil Engineering
Dr. Joey Shaw, Professor of Agronomy and Soils
Dr. Francisco J. Arriaga, Affiliate Associate Professor of Agronomy and Soils

ii
Abstract
Among the foremost issues in the area of hydrological sciences is the estimation
of infiltration fluxes and the associated contaminant exchange from the near-surface to
the ground water table. While the simplest and traditional conceptualization of
infiltration is that of a uniform, downward-advancing wetting front in a homogeneous
medium, field observations indicate that it is highly nonuniform. Macropores are
ubiquitously found in the subsurface and have a significant impact on hydrological
processes. The presence of macropores leads to preferential water flow through both
unsaturated and saturated soils, which are difficult to predict. In the first part, the effect
of macropore density and connectivity on water flow in porous media was studied by
comparing the hydraulic conductivity of different distributions of artificial macropores.
The effective hydraulic conductivity was measured by constant head method, and the
artificial macropores are prepared with stainless steel mesh reinforcements used in co-
axial cables. The result shows that as macropores become increasingly discontinuous,
the hydraulic conductivity approaches the value of no-macropore media. Also, the extent
of effects of macropore connectivity on the hydraulic conductivity decreases with
coarser media. Since the velocity in macropores could be large in certain cases, we have
also investigated the validity of Darcy‘s Law under high Reynolds number conditions.
Ergun equation is one of the most common empirical formulations that used to model
porous media flow in high Reynolds number systems. In this study, we have formulated

iii
a new form of Ergun equation, identified as the inverted Ergun (IE) equation, which is
more appropriate for modeling hydrological problems. The validity of the IE equation
has been tested by using various forms of error analyses and also by using experimental
datasets. The results show that IE equation is a useful alternative for modeling high
velocity flows in porous media systems.

iv
Acknowledgments
I would like to sincerely thank my advisor, Dr. Navin Kumar C. Twarakavi. His
continuous support, encouragement and valuable suggestions played a vital role in the
achievement of this research. I would like to extend my thanks to my advisory
committee members: Dr. Prabhakar Clement, Dr. Joey Shaw and Dr. Francisco Arriaga
for their participation in my thesis committee. I would also like to thank Dr. Laurent
Bahaminyakamwe for his support and help in setting up my experiments.
I take immense pleasure in thanking my family members for believing in me and
standing beside me at every step till today. Special thanks to Gerald, Robert and fellow
graduate students for their aid, support and friendship. Finally, I would like to thank all
my friends for their unwavering support and timely help.

v
Table of Contents
Abstract ............................................................................................................................. ii
Acknowledgments ............................................................................................................ iv
List of Tables ................................................................................................................... vii
List of Figures ................................................................................................................ viii
List of Abbreviations .......................................................................................................... x
I. Literature Review ............................................................................................................ 1
Introduction ............................................................................................................ 1
Macropore Type and Physical Characteristics ....................................................... 2
Chemical and Biological Characteristics of Macropores ....................................... 3
Water Flow in Macropores ..................................................................................... 4
Dynamics of Macropores ....................................................................................... 9
Studies of Macropores ............................................................................................ 9
Macropore Modeling ............................................................................................ 12
Fluid Flow Through Porous Medium ................................................................... 14
II. Macropore Density and Connectivity Effects on Hydraulic Conductivity .................. 17
Introduction .......................................................................................................... 17
Materials and Methods ......................................................................................... 18
Results and Discussion ......................................................................................... 27
Summary and Conclusions ................................................................................... 37

vi
III. On the application of Darcy‘s Law in subsurface Flow Regimes ............................. 38
Introduction .......................................................................................................... 38
Theoretical Studies ............................................................................................... 43
Experimental Method ........................................................................................... 52
Analysis of Experimental Results ........................................................................ 56
Summary and Conclusions ................................................................................... 61
IV. Recommendation for Future Work ........................................................................... 62
References ....................................................................................................................... 63

vii
List of Tables
Table 3.1.Properties of porous media used and a summary of the related experiment
performed to develop gradient-specific discharge data for this study .......... 53
Table 3.2.Estimated values of Ergun and inverted Ergun coefficients for the porous
medium used in the experimental study. ........................................................ 60

viii
List of Figures
Figure 1.1. Schematic diagram illustrating the water potential attained at the soil
surface under different infiltration rates, Q, and the generation of non-
equilibrium flow in macropores ...................................................................... 8
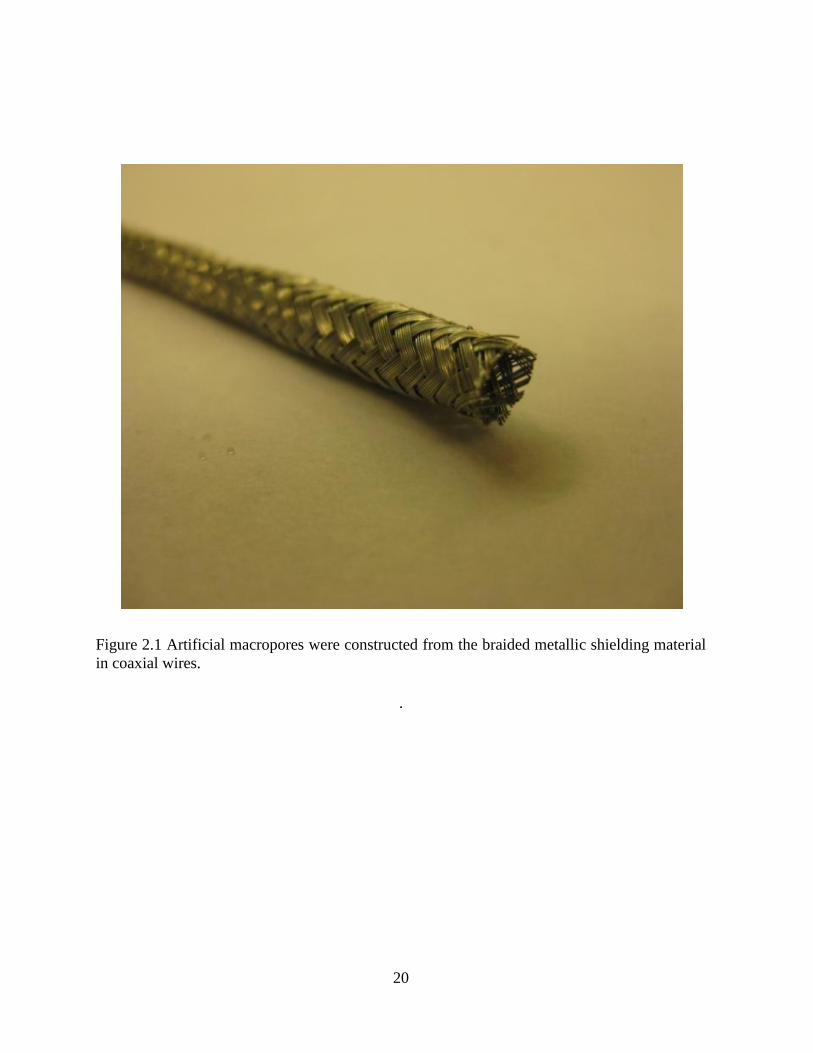
Figure 2.1. Artificial macropores were constructed from the braided metallic shielding
material in coaxial wires. .............................................................................. 20
Figure 2.2. Schematic of the experimental setup to estimate hydraulic conductivity
using constant head method. The column is connected to a Mariotte bottle
filled with degassed deionized water. ........................................................... 23
Figure 2.3. Schematic showing macropore distribution (connectivity) in the column for
the 2.97% (D1) macropore system ................................................................ 24
Figure 2.4. Schematic showing macropore distribution (connectivity) in the column for
the 5.87% (D2) macropore system ................................................................. 26
Figure 2.5. The relationship between hydraulic conductivity (cm/min) and the number
of macropores for the 2.97% macropore system .......................................... 29
Figure 2.6. The relationship between hydraulic conductivity (cm/min) and the number
of macropores for the 5.87% macropore system .......................................... 30
Figure 2.7. An example of a macropore configuration that was used in MODFLOW
simulation to estimate the effective hydraulic conductivity in porous media
at a density of 2.97% with best inter-macropore connectivity (C1). .............. 33
Figure 2.8. Relationship between hydraulic conductivity of macropore domain used in
simulation and the difference between the simulated and experimentally-
estimated effective saturated hydraulic conductivity for a macropore density
of 2.97%. ........................................................................................................ 35
Figure 3.1.Schematic of specific discharge vs gradient relationship (Bear 1972) ........... 41
Figure 3.2 An illustration of the gradient-specific discharge relationships as estimated
by the Ergun (solid symbols) and inverted Ergun Equations (IE, open
symbols) (assuming constants, A=180 and B=1.80 and porosity of 0.40).
Plot (a) shows the curves for average grain diameters of 0.08(square),

ix
0.10(triangle) and 0.15 cm (circle).Plot (b) shows the curves for average
grain diameters of 0.03 (circle) and 0.05 (triangle) ......................................... 46
Figure 3.3 Variation of maximum hydraulic gradient as a function of mean grain size
diameter (cm) at various porosity (cm3/cm
3) (assuming constants, A=180
and B=1.80) . .................................................................................................. 47
Figure 3.4 Contour of the maximum Reynolds number (
B
Ad
4
)1(811Re
)
as a function of the relative error (ε) and system parameter A/B. ................. 51
Figure3.5(a) Experimental setup for estimating specific discharge-gradient
relationships. Soil was packed in to the bottom 30cm of a long graduated
glass cylinder of 3.64 cm diameter under saturated conditions. .................... 54
Figure3.5(b)Picture of experimental setup for estimating specific discharge-gradient
relationships. Soil was packed in to the bottom 30cm of a long graduated
glass cylinder of 3.64 cm diameter under saturated conditions.. ................... 55
Figure 3.6 The relationship between the hydraulic gradient and the specific discharge
for all glassbeads. ........................................................................................... 57
Figure 3.7 The relationship between the hydraulic gradient and the specific discharge
for all silica sand. ........................................................................................... 58

x
List of Abbreviations
ADE Advection Dispersion Equation
ARS Agriculture Research Service
CDE Convection–Dispersion Equation
REV Representative Elementary Volume
Eqn Equation
Ksat Saturated Hydraulic conductivity

1
I. Literature Review
Introduction
Macropores are large, continuous voids in soil and include structural, shrink-swell, and
tillage fractures, old root channels, and soil fauna burrows (Radcliffe D. E. 2008). The
macropores in soils are very important in controlling the movement of water under both
saturated and unsaturated conditions. Beven and Germann (1981) noted that water will move
through large voids under saturated conditions, and that they may greatly influence the
saturated hydraulic conductivity of soils, even though they may contribute only a very small
amount to the total porosity of a soil. For unsaturated soil, the presence of macropores leads to
variation in water flow that is not described well by a Darcy approach to flow through porous
media. Macropores are readily visible and are often continuous for distances of at least several
meters in both vertical and lateral directions.
There are standard definitions and classfications of macropore based on pore size.
Luxmoore (1981) suggested that the equivalent pore diameter range of macropore is longer
than 1000 μm. Beven and Germann (1981) considered that only the pores greater than 3000 μm
in diameter can be defined as macropores. However, Marshall (1959) estimated the equivalent
diameter of a macropore is above 30 μm. Luxmoore (1981) conducted a literature review and
noted that non-capillary porosity has also been used to distinguish large pores from small pores.
Nelson and Baver (1940) estimated non-capillary porosity for several materials as the pore
volume that became water filled above approximately -3 Pa pressure. Marshall (1959)
expressed an updated viewpoint that equated non-capillary porosity with macroporosity. They
define macroporosity as the pore volume that becomes water filled at pressures above -10 kPa.

2
However, Ranken (1984) suggested it should be above -1.0 kPa, and Bullock and Thomasson
(1979) believed it should be above -5.9 kPa.
Brewer (1964) proposed the following pore equivalent diameter (μm) classes: coarse
macropores, > 5000 μm; medium macropores, 2000 μm to 5000 μm; fine macroproes, 1000 μm
to 5000 μm; very fine macropores, 75 μm to 1000 μm. Reeves (1980) developed a different
classification: enlarged macro-fissures of equivalent diameter should be in the range of 1000
μm to 20000 μm; macro-fissures should be in the range of 200 μm to 2000 μm. Russell (1973)
adopted a somewhat different classification, the diameter of coarse macropores should be
greater than 200 μm; medium, 20 μm to 200 μm; fine, 2 μm to 20 μm; and very fine < 2 μm.
However, Bouma et al (1989a) pointed out that size is less important than pore continuity;
small pores with a diameter of 40 μm can conduct considerable quantities of water if they are
continuous throughout a soil sample, which implies that the conductivity also plays an
important role in the definition of macropores.
Macropore type and physical characteristics
Beven and Germann (1981) suggested that on the basis of morphology, macropores
may be grouped as the following:
1. Biopores: Pores formed by the soil fauna and soil flora. They are primarily tubular
in shape, but the size may extend from less than 1 mm to over 50 mm in diameter. Biopores are
concentrated close to the soil surface. Perret et al. (1999) investigated the geometry of
macropore networks consisting of cylindrical biopores larger than 1 mm in diameter in an
uncultivated sandy loam soil under grass. They identified more than 13000 such branching
networks per m3 of soil, which corresponds to a total macroporosity of between 2% to 4%. The
networks had a geometric mean volume of 50 mm3
and a tortuosity between 1.2 and 1.3, and

3
their modal length was 40 mm (cited by Jarvis 2007). Shipitalo and Butt (1999) reported that
the tortuosity of channels produced by deep-burrowing earthworms is 1.1 to 1.2. In contrast,
since endogeic earthworm species feed and burrow only within the topsoil, they produce
temporary burrows that are more randomly oriented, shorter, more tortuous, and branched
(Capowiez et al., 2001; Je gou et al., 2001), and which therefore may have more limited effects
on water flow and solute transport (Ela et al., 1991).
Biopores are also commonly formed by plant roots, which also constitute important
pathways for non-equilibrium flow and transport. For example, Tippkotter (1983) reported
interconnected networks of tubular pores 0.1–0.6 mm in diameter, with a similar morphology
to that of living root systems at more than 1-m depth in a loess soil. Edwards et al. (1988)
counted more than 14,000 cylindrical macropores larger than 0.4 mm in diameter per m2 in an
untilled silt loam soil cropped with maize. Of these, 80% were less than 1-mm in diameter and
were presumed to be channels created by decayed roots.
2. Pores created by cracks and fissure. These macropors are formed either by shrinkage
resulting from dessication of clay soils (e.g.,Blake et al., 1973; Lewis, 1977) or by chemical
weathering of bedrock materials (e.g., Reeves, 1980). Chertkov and Ravina (1999) reported
that the tortuosity of crack networks in clayey soils ranged from 1.2 to 2.0.
3. Natural soil pipes. Natural soil pipes may form because of the erosive action of
subsurface flows, where the forces imposed on individual soil particles caused by the flow
exceed the structural competence of the soils (e.g., Zaslavsky and Kassif, 1965).
Chemical and Biological characteristics of macropores
Apart from physical characteristics such as size, continuity and surface area, the
biological and chemical properties of macropores are very different to those of the bulk soil

4
(Jarvis, N.J. 2007). Roots are often preferentially close to macropores, and often in direct
contact with the macropore wall, which means water and air do not have long distances to
travel to the roots if they enter the soil through the macropores. Thus, macropores are close to
the zone of maximum organic matter cycling, microbiological activity, and hence, nutrient
availability (Stewart et al., 1999). Accelerated degradation of organic contaminants has been
found in artificial macropores, which was attributed to favorable conditions for biofilm
development, and improved aeration and supply of substrates (Pivetz & Steenhuis, 1995;
Pivetz et al., 1996, cited by Jarvis). Bundt et al. (2001b) stained preferential flow paths in a
forest soil with a food dye and sampled soil materials from preferential flow paths to evaluate
microbial biomasses and microbial community structures. They found that the preferential flow
paths are more exposed to drying and wetting than the soil matrix, which allows better nutrient
and substrate supply than the soil matrix. Favorable living conditions in preferential flow paths
are reflected by significantly larger microbial biomasses.
Water flow in Macropores
Lawes et al. (1882) noted that “… in a heavy soil, channel drainage will in most cases
precede general drainage, a portion of the water escaping by the open channels before the
body of the soil has become saturated; this will especially be the case if the rain fell rapidly,
and water accumulates on the surface”. Hendrickx and Flury (2001) defined preferential flow
as ―all phenomena where water and solutes move along certain pathways, while bypassing a
fraction of the porous matrix‖. Bouma (1981) mentioned that preferential flow in saturated soil
involves rapid displacement of water from macropores (hydrohynamic dispersion). In
unsaturated soil, flow into air-filled macropores (short-circuiting) occurs, which is followed by
lateral absorption.

5
Since there are a number of different causes of preferential flow, each process has a
separate term. For instance, macropore flow is used to indicate preferential flow in continuous
root channels, earthworm burrows, fissures, or cracks within well-structured and mostly fine-
textured soils. Flow paths can vary in type from individual pores to a highly connected pore
network and pore geometries that range from cylindrical to slabs, and dimensions may vary
from capillary size to larger (Gerke. H.H 2006). Under both saturated and unsaturated
conditions, water can move downslope through macropores very rapidly (of the order of a
meter per hour, Beven & Germann, 1982). Mosley (1982) recorded mean macropore flow
velocities ranged from 0 to 0.0098 ms-1
. Newson and Harrison (1978) conducted tracer
experiment in a natural pipe, and found that macropore flow mean velocity ranged from 0.06 to
0.2 ms-1
.
Beven and Germann (1982) noted that macropore flow results when vertical flow rates
in macropores are more rapid than the lateral equilibration of matrix water pressure.. Classical
theory of water flow (Richards‘ equation) and solute transport (ADE) is based on the
assumption that unique values of soil water pressure and solute concentration can be defined
for a representative elementary volume (REV). Physical non-equilibrium occurs in the soil
unsaturated zone when heterogeneities result in the generation of lateral differences (non-
uniformity) either in water pressures or solute concentrations, or both, during vertical flow and
transport, which invalidates the REV concept (Jarvis, N. J 2007).
Jarvis (2007) discussed the causes and consequences of ‗non-equilibrium‘ water flow
and solute transport in large structural pores or macropores, He pointed out that macropore size,
continuity and the presence of impermeable linings and coatings that restrict lateral mass
exchange were able to initiate rapid non-equilibrium flow. Jarvis also explained that water flow

6
in soil pores is driven by gravity, capillarity, viscous forces and inertial forces; the same forces
that operate on all pores in soil no matter their sizes, so in this respect macropore flow does not
differ from matrix flow. However, when gravity dominates the driving force, the velocities in
macropores may become very large, and the acceleration term in momentum balance may not
always be negligible, an assumption which is implicit in the derivation of Darcy's law and the
Richards' equation. This can be illustrated by calculating the Reynolds number as a function of
pore diameter, assuming fully saturated laminar flow in straight-sided cylindrical macropores
in accordance with Hagen–Poiseuille‘s law. The Reynolds number (a dimensionless parameter)
for porous media flow is typically expressed as [1.1].
Re=(ρvd30)/µ
where ρ is the density of water (units of mass per volume), v is the specific discharge
(not the pore velocity — with units of length per time), d30 is a representative grain diameter
for the porous media (often taken as the 30% passing size from a grain size analysis using
sieves with units of length), and μ is the fluid viscosity (Todd, 1959).
The Reynolds number, which is a measure of the ratio of inertial to viscous forces,
exceeds unity and therefore invalidates Darcy‘s law (Childs, 1969) at pore diameters larger
than 0.15 mm. Darcy's law is only valid for slow, viscous flow; apparently, most groundwater
flow falls in this category. Typically, any flow with a Reynolds number less than one is clearly
laminar, and it would be valid to apply Darcy's law. Furthermore, experimental tests have
shown that flow regimes with Reynolds numbers up to 10 may still be Darcian.
Logsdon (1993) determined that the Reynolds numbers were larger than 1000 for flow
through a partially saturated artificial macropore 6-mm in diameter open to a supply of free
water at the soil surface. Mori et al. (1999a, cited by Jarvis N. J. 2007) reported Reynolds

7
numbers varied between 50 and 80 for flow in natural soil macropores under ponded
infiltration, which suggested that the flow regime could be transitional to turbulent.
Jarvis (2007) explained non-uniform flow during infiltration by using a soil block
containing macropores. In the initial dry state (point A, See Figure 1.1), the matrix hydraulic
conductivity dominates the flow, and the macropore hydraulic conductivity is negligible. The
water entry pressure of smaller macropores is reached at pressure potential B and non-
equilibrium begins to develop, but the additional contribution of these pores is not dramatic.
The pressure potential, at C, is only slightly larger than at B or A, but the hydraulic
conductivity is orders of magnitude larger since large vertically continuous macropores begin
to conduct water. The soil now wets up in a markedly non-uniform manner with water flowing
rapidly in macropores, far ahead of the matrix wetting front.

8
Figure 1.1. Schematic diagram illustrating the water potential attained at the soil surface under
different infiltration rates, Q, and the generation of non-equilibrium flow in macropores (Jarvis
N. J. 2007).

9
Dynamics of Macropores
Changes in the soil-plant-animal community and in external conditions, such as the
pattern of weather, will affect the balance between constructive and destructive processes
(Beven and Germann 1982). Moreover, longer-term climatic changes, long-term ecological
changes and land use affect the macropore system through its effect on the soil-plant-animal
community. Land use plays an important role in the development of macroporosity. For
instance, the number of earthworm channels in the surface layer of a tilled soil is much less
than in a comparable untilled area (Ehlers,W., 1975). Soil macroporosity and the proportion of
rainfall moving through preferential flow paths often increases with the adoption of
conservation tillage, which contributes to a reduction in surface runoff (Shipitalo et al., 2000).
Green and Askew (1965) reported that macropores created by ants may last several
hundreds of years. Beven and Germann (1982) reported that macropores formed from tree
roots may last at least 50-100 years in a soil containing about 30% clay. The effective lifetime
of macropores may be assumed to increase with stability of the soil structure, which is in itself
a function of soil texture, mineralogy, and the composition of organic matter.
Studies of macropores
Beven and Germann (1982) mentioned that there are two types of large voids in soil:
voids that are hydrologically effective in terms of channeling flow (macropores), and those that
are not. Any experimental technique used to determine soil macroporosity should differentiate
them.
Jarvis (2007) suggested that soil and crop management practices strongly modify soil
structure and therefore affect the extent of non-equilibrium flow and transport in macropores.
Edwards et al. (1992) compared water flows measured from large diameter earthworm burrows

10
(Lumbricus terrestris L.) in paired fields under no-till maize and grassland, and found that 60%
less macropore flow occurred at the grassland site during one growing season. Booltink and
Bouma (1981) conducted an experiment in two large undisturbed soil monoliths using
breakthrough curves, and noted that large and well-connected macropores are able to transmit
water and tracer more rapidly than small, tortuous, and less well-connected macropores.
Macropore flow has a significant influence on the leaching of agrochemicals. Shipitalo
et al (2000) reported that if a heavy, intense storm occurs shortly after surface application of an
agricultural chemical to soils with well-developed macroporosity, the water transmitted to the
subsoil by the macropores may contain significant amounts of applied chemical, regardless of
the affinity of the chemical for the soil. This amount can be reduced by an order of magnitude
or more with the passage of time, or if lighter intensity precipitation precedes the first major
leaching event. They explained that solutes normally strongly adsorbed by the soil are subject
to leaching in macropores in the first few storms after application. Jarvis (2007) mentioned that
the impact of macropore flow on leaching depends strongly on the properties of the chemical
under consideration, particularly its sorption characteristics, the nature of any biological
transformations, and whether the solute is surface-applied or indigenous to the soil (White,
1985a; Elliott & Coleman, 1988; Jarvis, 1998).
FOCUS (2001) reported that macropore flow effects on pesticide leaching are typically
less than 1% of the applied dose, but losses of between 1 and 5% can occur. In some
hydrogeological formations, such as clayey glacial tills, or fractured chalk and limestone, non-
equilibrium transport in fissures can be continuous to great depth, and can be a dominant
mechanism for pesticide transport towards important underlying drinking water aquifers
(Jørgensen et al., 1998; Haria et al., 2003; Stenemo et al., 2005; Roulier et al., 2006). However,

11
Jarvis (2007) noticed that in many loamy and clayey soils prone to macropore flow, the deeper
subsoil below the rooting depth is much less permeable due to the absence of structure-forming
processes, so that most excess water is routed to surface water via field drainage systems rather
than to groundwater.
The occurrence of macropore flow dramatically increases the leaching of otherwise
―non-leachable‖ (i.e. strongly sorbed or fast degrading) compounds, although it will have less
effect on highly mobile or persistent compounds (Larsson & Jarvis, 2000). In field experiments,
leaching losses of phosphorus in macropore flow to subsurface drainage systems have been
reported to range from 0.2 to 5 kg ha-1
year-1
in loamy and clayey soils, with particle bound
transport accounting for 10 to 75% of the total (e.g. Heckrath et al., 1995; Ule n & Persson,
1999; Hooda et al., 1999; Addiscott et al., 2000). Priebe and Blackmer (1989) conducted an
experiment to evaluate the possibility that preferential movement of water through soil
macropores was an important factor in losses of surface-applied urea and nitrate from Iowa
soils. Their studies showed that large nitrate losses occur due to macropore flow following
fertilizer application. Camobreco et al. (1996) demonstrated that preferential flow plays a
crucial role in transporting metals through a soil profile, as illustrated by the fact that the
homogenized matrix flow columns adsorbed all applied metals while the undisturbed
preferential flow columns allowed some of the metals to pass. Gjettermann et al. (2004)
conducted an experiment to investigate the effect of macropore flow (i.e., film and pulse flow)
on the interaction of solutes with macropore walls. They studied orthophosphate (P) transport
and sorption in artificial macropores, and found that P concentration in macropores decrease
much more during film flow than during pulse flow.

12
Macropore Modeling
Gerke (2006) mentioned that in heterogeneous structured soils, water, dissolved
substances, suspended particles, and colloids may under certain conditions bypass most of the
soil porous matrix thereby creating non-equilirium conditions in pressure heads, and solute
concentration gradients between preferential flow paths and the soil matrix. The discussion of
modeling of macropores is actually the study of preferential flows, which severely limits the
applicability of standard models for flow and transport that are mostly based on the Richards‘
equation and the convection-dispersion equation (CDE). Beven (1991) reported that during
wetting, part of the moisture front can propagate quickly to significant depths, and water and
solutes may move to far greater depths much faster than predicted with the Richards‘ equation
using area-averaged moisture contents and pressure heads. Another important characteristic of
preferential (non-uniform) flow is its non-equilibrium nature. Even for uniform flow conditions,
most of the water and its dissolved solutes generally move through the largest continuous pores
that are filled with water at a particular tension. This is reflected in the shape of the highly non-
linear hydraulic conductivity function, which typically shows dramatic increases with
increasing water contents, particularly as the larger pores become conductive. While conditions
at or close to equilibrium exist between the different types of pores in a soil during uniform
flow, this is generally not the case during preferential flow (Šimůnek et al., 2003).
Preferential flow in structured media (both macroporous soils and fractured rocks) can
be described using a variety of dual-porosity, dual-permeability, multi-porosity, and multi-
permeability models. Dual-porosity and dual-permeability models assume that the porous
medium consists of two interacting regions, one associated with the inter-aggregate, macropore,
or fracture system, and one comprising micropores (or intra-aggregate pores) inside soil

13
aggregates or the rock matrix (Pruess and Wang, 1987; Gerke and van Genuchten, 1993a; Gwo
et al., 1995; Jarvis, 1998, cited by Šimůnek et al., 2003).
Process-based models for flow and transport in granular (or single-porosity) media are
generally based on the Richards‘ equation for variably saturated water flow and the
convection–dispersion equation (CDE) for solute transport,
=
where K is the hydraulic conductivity, ψ is the pressure head, z is the elevation above a
vertical datum, θ is the water content, and t is the time.
Gerke and Genuchten (1993) noted that a one-dimensional dual-porosity model has
been developed for the purpose of studying variably saturated water flow and solute transport
in structured soils or fractured rocks. This model involves two components at the macroscopic
level: a macropore or fracture pore system and a less permeable matrix pore system. Central to
the dual-porosity approach is the assumption that the medium can be separated into two
distinct pore systems. Water flow in both the matrix and in fracture pore (macropore) is
assumed to be mobile, and is described with the Richards‘ equation, and solute transport is
described with the CDE (Gerke and Genuchten 1993). Dykhuizen (1987) postulated that the
dual-porosity medium is a superposition of these two systems over the same volume. While
dual-porosity models assume that water in the matrix is stagnant, dual-permeability models
allow for water flow in the matrix as well.
Ahuja et al (1993) used the USDA-ARS Root Zone Water Quality Model to study
macropore flow and transport in a silty clay loam soil, which is based on a two-domain (soil
matrix and macropore) approach. They found that the macropore size had very little effect on

14
macropore flow and transport, but the smallest pores retarded the downward chemical
movement by wall adsorption slightly more than the largest size pores.
Fluid Flow through Porous Medium
Henry Darcy connected the fountains of the city of Dijon in France with homogeneous
sand filters in 1856. Darcy concluded that the rate of water flow Q (volume per unit time) is: (a)
proportional to the constant cross-section area A of the sand filter, (b) proportional to hydraulic
head (h1-h2) and (c) inversely proportional to the length L. When combined, these conclusions
provide Darcy‘s Law:
Q=KA(h1-h2)/L
where the coefficient of proportionality K is called hydraulic conductivity, and (h1-h2)
is the difference in hydraulic head across the filter of length L. As the hydraulic head defines
(in terms of head of water) the sum of pressure and potential energies of the fluid per unit
weight, (h1-h2)/L is interpreted as the hydraulic gradient. Denoting this gradient by J and
defining the specific discharge, q, as discharge per unit cross-sectional area normal to the
direction of flow (q=Q/A), we obtain:
q=KJ; J= (h1-h2) / L
Darcy‘s equation is analogous to the electrical and heat flow equations, in which the
proportionality factors are termed "electrical conductivity" and "thermal conductivity",
respectively.
Hydraulic conductivity (K) is a scalar (dimensions L/T) that expresses the ease with
which a fluid is transported through a porous matrix. It is, therefore, a coefficient that depends
on both matrix and fluid properties. The relevant fluid properties are density (ρ), and viscosity
(μ), or, in the combined form, kinematic viscosity (ν). The relevant solid matrix properties are
15
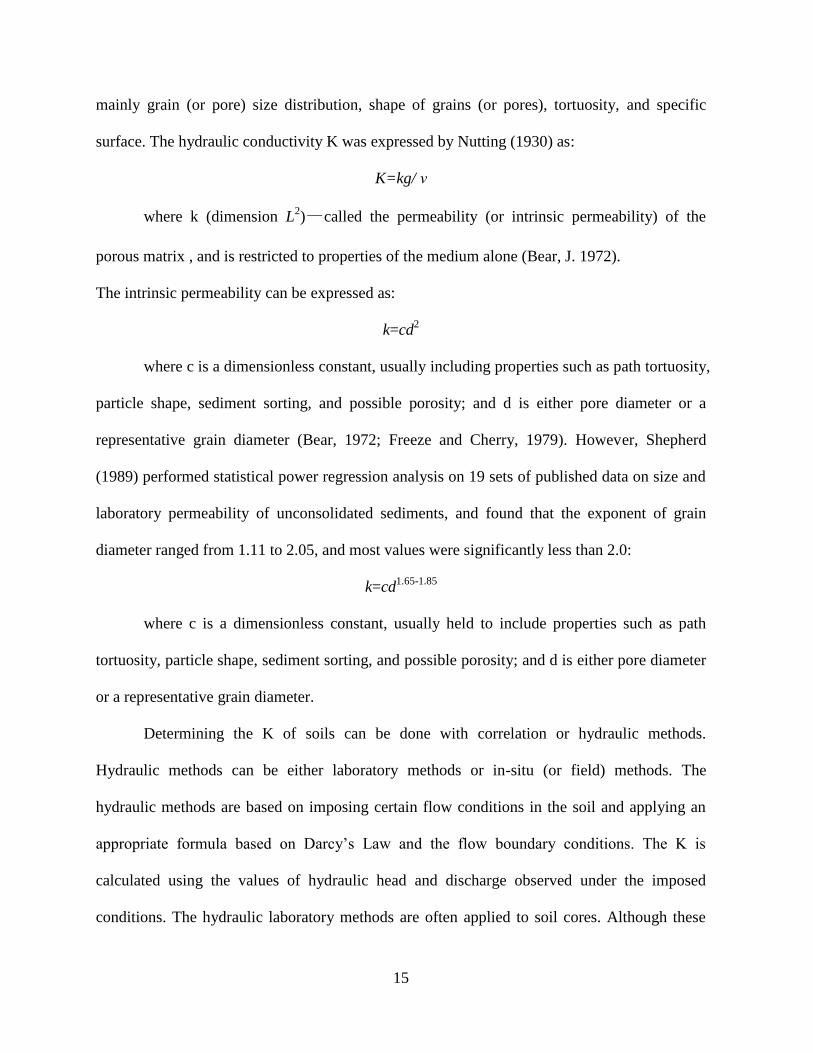
mainly grain (or pore) size distribution, shape of grains (or pores), tortuosity, and specific
surface. The hydraulic conductivity K was expressed by Nutting (1930) as:
K=kg/ ν
where k (dimension L2)—called the permeability (or intrinsic permeability) of the
porous matrix , and is restricted to properties of the medium alone (Bear, J. 1972).
The intrinsic permeability can be expressed as:
k=cd2
where c is a dimensionless constant, usually including properties such as path tortuosity,
particle shape, sediment sorting, and possible porosity; and d is either pore diameter or a
representative grain diameter (Bear, 1972; Freeze and Cherry, 1979). However, Shepherd
(1989) performed statistical power regression analysis on 19 sets of published data on size and
laboratory permeability of unconsolidated sediments, and found that the exponent of grain
diameter ranged from 1.11 to 2.05, and most values were significantly less than 2.0:
k=cd1.65-1.85
where c is a dimensionless constant, usually held to include properties such as path
tortuosity, particle shape, sediment sorting, and possible porosity; and d is either pore diameter
or a representative grain diameter.
Determining the K of soils can be done with correlation or hydraulic methods.
Hydraulic methods can be either laboratory methods or in-situ (or field) methods. The
hydraulic methods are based on imposing certain flow conditions in the soil and applying an
appropriate formula based on Darcy‘s Law and the flow boundary conditions. The K is
calculated using the values of hydraulic head and discharge observed under the imposed
conditions. The hydraulic laboratory methods are often applied to soil cores. Although these

16
methods are more laborious than correlation methods, they are still relatively fast and cheap,
and they eliminate the uncertainty associated with relating soil properties to K (H.P.Ritzema,
1994).

17
II. Macropore Density and Connectivity Effects on Hydraulic Conductivity
Introduction
Macropore flow in soil has important consequences on ground water quantity and
quality since water and pollutants can be transported through macropores rapidly. Water flow
and solute movement through macropores can be affected by the density of the macropores,
size of macropores, the presence of clay coatings, biological activity, the vertical flow rates,
and the extent of ‗direct connectivity‘ between the macropores and the surface (Javis 2007).
Macropores can be defined and classified according to their size. Luxmoore (1981)
conducted a literature review and noted that non-capillary porosity has also been used to
distinguish large pores form small pores, and suggested that if the diameter of pores are wider
than 1000 μm, we can call them macropores. However, there are many other definitions of the
macropore based on their size. For instance, Beven and Germann (1981) defined macropores as
those pores with a diameter greater than 3000 μm. Marshall (1959) estimated the equivalent
diameter of macropore to be above 30 μm. We can see that the definition of the macropore
based on their sizes is not well defined. In a literature review, Jarvis (2007) discussed the
causes and consequences of ‗non-equilibrium‘ water flow and solute transport in large
structural pores or macropores, and pointed out that the large size, continuity and presence of
impermeable linings and coatings that restrict lateral mass exchange can cause rapid non-
equilibrium flow in macropores. Jarvis (2007) also explained that water flow in soil pores is
driven by gravity, capillarity, viscous forces and inertial forces, which are the same forces that
operate in all soil pores no matter their size, thus in this respect macropore flow does not differ
from matrix flow. However, when gravity dominates the driving force, the velocities in

18
macropores can become very large, and the acceleration term for the momentum balance may
not always be negligible, an assumption for Darcy's law and Richards' equation.
What constitutes a macropore cannot be defined purely based on the size of the
macropore. Instead, the dynamics of the flow in macroporous soils determines if the soil is
―Macroporous‖. In other words, one needs to consider the macropore density and inter-
macropore connectivity relative to the type of porous media before determining if the soil is
macroporous. For example, an elaborate macropore network may have minimal effect on water
flow and solute transport in a coarse sand as opposed to a single continuous macropore in a
clayey soil. In order to better understand the definition of macropores, we use artificial
macropore structures of different density and connectivities to study their effect on the
effective hydraulic conductivity of the porous media. Note that one could also look at solute
transport aspects to study macropore effects, which is a subject of future research. For the
purposes of this research, we compare the effective hydraulic conductivity of the Macroporous
porous media with that of the bulk matrix to draw conclusions on macropore effects on water
flow.
Materials and Methods
Materials
Three different sizes of glass-beads, with diameters of 0.5mm (fine glass beads, FGB),
1.15mm (medium glass beads, MGB), 1.9mm (large glass beads, LGB) and two different
Ottawa silica sands of average grain diameter 0.29 mm (No. 40-60 sand) and 1.1mm (No. 12-
20 sand) were used. All the glass-beads and silica sand were washed repeatedly with 1.0
mol/L HCl, 1.0 mol/L NaOH and deionized water to ensure clean porous media for our
experiments.

19
Dual-permeability models are commonly used to represent the flow in macroporous
soils. In dual-permeability models, the flow in soils is conceptualized as two separate flow
domains interacting with each other. The interaction is represented using a transfer coefficient.
If dual-permeability models are to be used, one needs to incorporate values for the hydraulic
conductivity of the matrix and the macropores. While the hydraulic conductivity of the bulk
matrix can be estimated using traditional approaches, estimating the hydraulic conductivity of
the macropores is not straight forward. We estimated the hydraulic conductivities of the
macropore domain for different porous media under conditions of varying inter-macropore
connectivity and densities using MODFLOW, which is the U.S. Geological Survey modular
finite-difference flow model.
The glass-bead material formed the bulk matrix in to which macropore structures were
added. Artificial macropores were made by using stainless steel mesh reinforcement used in
co-axial cables (Figure 2.1). These stainless steel mesh reinforcements are good proxies for
macropores because: (a) they have a fixed diameter throughout and are made of very porous
walls with same sizes of pores. (b) the stainless steel mesh reinforcements allow for free
movement of water through their walls and at the same time, resist collapse of the bulk matrix
around it. The diameter of the artificial macropores used in our study was 0.3 mm. Through our
experiments, we used deionized and degassed water in order to maintain saturated conditions
during the setup and experimental process.
20
Figure 2.1 Artificial macropores were constructed from the braided metallic shielding material
in coaxial wires.
.

21
Experiment Setup
We used a constant head to measure the saturated hydraulic conductivity of the porous
matrix with macropores. In this experiment, a 2.64 cm diameter by 38.2 cm long glass column
was used to measure the effective hydraulic conductivities of different porous matrices and
macropore combination. Because the grains of the porous media are nearly spherical, the
porosity of the column was assumed to be 0.4. The column was uniformly packed with porous
media under wet conditions to ensure there was no air in the column. The schematic of the
setup is shown in Figure 2.2. The saturated column was connected to a water tank, water was
allowed to flow vertically from the bottom to top at a constant head of 3-cm of water. The
volume of water that passed through the column over a period of time, t, was measured. Re-
arranging Darcy‘s law and solving for Ks, we obtain eqn. [2.1]
-----------------------
[2.1]
where is the effective saturated hydraulic conductivity of the porous media, V is the
volume of water that flows through the sample of cross-sectional area A during time t and (H2-
H1) is the hydraulic head difference imposed across the sample of length L.
Experimental Procedure
The macroporosity (or macropore density) of a porous media can be calculated using
following equations:
Macroporosity
--------[2.2]
Vmic=n*(V-Vmac) --------[2.3]

22
where Vmac refers to the volume of macropores, Vmic is the volume of the matrix
without the macropore, V is the volume of the column and n is the porosity of the medium. We
used reference value as 0.4 here. Macroporosity refers to the relative fraction of pores that can
be classified as macropores in the porous media. For each porous media, the following
macropore densities (or macroporosities) were considered: 2.97% (hereby, called D1) and 5.87%
(hereby, called D2).

23
Figure 2.2. Schematic of the experimental setup to estimate hydraulic conductivity using
constant head method. The column is connected to a Mariotte bottle filled with degassed de-
ionized water.

24
Figure 2.3. Schematic showing macropore distribution (connctivity) in the column for the 2.97%
(D1) macropore system.

25
For macropore density of D1, we created different inter-macropore connectivities by
allocating the macroporosity in to 1, 2, 4, 8 and 16 equally- sized artificial macropores (Figure
2.3). These inter-macropore connectivities are referred to as C1, C2, C3, C4 and C5,
respectively. As the number of artificial macropores increased for a given macropore density,
the macropores become more discontinuous.
Similarly, for a macropore density of 5.87% (D2), we created different inter-macropore
connectivities by allocating the macroporosity in to 2, 4, 8, 16 and 32 equally- sized artificial
macropores (Figure 2.4). Note that the macropore density of D2 (5.87%) is nearly double the
macropore density of D1 (2.97%). Therefore, these inter-macropore connectivities are also
referred as C1, C2, C3, C4 and C5 respectively because the lengths of each macropore for a
given connectivity is same for both macropore densities.

26
Figure 2.4. Schematic showing macropore distribution (connectivity) in the column for the
5.87% (D2) macropore system.

27
For a given porous media, the experiment was started without any macropores, and the
hydraulic conductivity of the matrix was measured. The experiment was repeated to ensure the
saturated hydraulic conductivity for the matrix was constant under conditions of repeated
packing. For any given macropore density (D1 or D2) and inter-macropore connectivity (C1,
C2, C3, C4, C5), artificial macropores were packed in to the column along with the bulk
porous media such that the different inter-macropore connectivities were established (Figure
2.3 & 2.4). The column was packed randomly such that no macropore was open to the column
boundaries and at the same time each of the macropores was separated from others. It was
important to ensure that the macropores were not open to the ends of column because surface
macropores and buried macropores are subject to different dynamics of flow. The column was
also wet-packed to ensure air-tight conditions in the soil column and hydraulic conductivity
was measured using the procedure described earlier. After the effective hydraulic conductivity
was measured, the soil column with the artificial macropores was unpacked and subsequently,
repacked with the same macropore density and connectivity, and a new effective hydraulic
conductivity was measured.
Results and Discussion
Experiment study
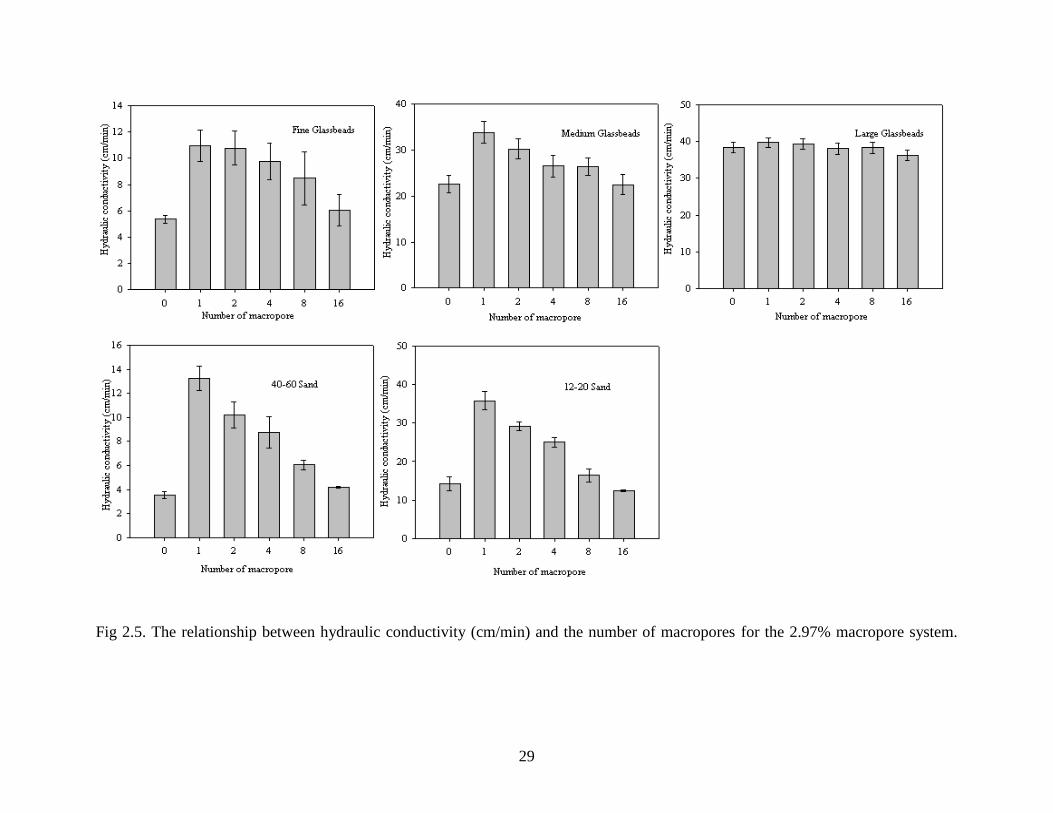
For two types of macropore systems (Figure 2.5 and Figure 2.6), we observed similar
effects of inter-macropore connectivity on hydraulic conductivity. As the macropores were
made more discontinuous for a given macropore density, we found that the effective hydraulic
conductivity of the porous media converged from a high value to the hydraulic conductivity of
the bulk matrix. This change is especially significant for fine glassbeads, medium glassbeads,
40-60 sand and 12-20 sand. The 40-60 sand, which is the finest porous media we studied,

28
showed the most significant change. For macroporosity of 2.97%, the hydraulic conductivity of
40-60 sand increased from 3.52 cm/min (no-macropore condition) to 13.11 cm/min (highest
inter-macropore connectivity). Similarly, for macropore density of 5.87%, the hydraulic
conductivity of 40-60 sand changed from 3.52 cm/min to 18.14 cm/min in conditions of
highest inter-macropore connectivity. It is also interesting to note that for conditions of least
inter-macropore connectivity, the effective hydraulic conductivity of the porous media is very
similar to the conductivity of the bulk matrix. This implies that from the perspective of
hydraulics, the definition of what constitutes a macropore would depend on the connectivity of
the macropores. In other words, one needs to carefully consider both physical (size) and
morphological (arrangement) aspects to determine the influence of macropores in soils.
29
Fig 2.5. The relationship between hydraulic conductivity (cm/min) and the number of macropores for the 2.97% macropore system.

30
Fig 2.6. The relationship between hydraulic conductivity (cm/min) and the number of macropores for the 5.87% macropore system.

31
Comparing different porous media, it was observed that macropore connectivity has
different effects on hydraulic conductivity that is based on the size of porous media. The effects
of macroporosity are best observed when the size of the porous media is smallest. For example,
in large glass bead media with a macroporosity of 2.97%, the hydraulic conductivity of the pure
matrix without macropores is 38.36 cm/min while with macropores of highest connectivity (C1)
is 39.70 cm/min. The extent of effects of macropore connectivity on the hydraulic conductivity
decreases with coarser media, which implicate the properties of the porous medium also play a
role on macropores effects. However, interplay between the definition of macropore (based on
its size) and the effect of that macropore on soil hydraulic properties needs further analysis.
Numerical Modeling Study
For the bulk matrix, we used the saturated hydraulic conductivity from the experiments
conducted for the non-macroporous condition. Assuming that Darcian-based flow concepts can
be used to represent flow in matrix and the macropores (as used in dual-permeability models),
we tried to estimate the hydraulic conductivity in the macropore domain that shows the best fit
between the experimental and simulated effective saturated hydraulic conductivity of the porous
media.
For a given macropore density and inter-macropore connectivity, the hydraulic
conductivity in the macropore domain was estimated as follows: (a) artificially construct several
macropore configurations using MATLAB, (b) using different possibilities of hydraulic
conductivity in the macropore domain and experimentally measured value for the matrix,
estimate the effective hydraulic conductivity by simulating constant-head method in
MODFLOW. The MODFLOW domain used to represent the soil column used in the experiment
was developed by dividing the diameter of the column in x and y directions in to 120 equally

32
spaced grids and the length of the column in to 180 equally spaced grids. We constructed several
different macropore configurations (~10) using MATLAB for a given macropore density and
inter-macropore connectivity in a porous media. Figure 2.7 shows an example of a macropore
configuration generated for a macropore density of D1 (2.97%) and inter-macropore connectivity
of (C1).

33
Fig 2.7. An example of a macropore configuration that was used in MODFLOW simulation to
estimate the effective hydraulic conductivity in porous media at a macropore density of 2.97%
with the best inter-macropore connectivity (C1).

34
Figure 2.8 shows the difference between the mean effective hydraulic conductivity that
was measured experimentally and through MODFLOW simulations for a macropore density of
2.97% and inter-macropore connectivities considered in this study, in different porous media.
Here, C1 represents the best connectivity of the macropore distribution in the column, and C5
represents the poorest connectivity of macropore distribution in the column. From C1 to C5, it
can be observed that the macropores become more and more discontinuous. Figure 2.8 shows
that for fine glassbeads and medium glassbeads, when the macroporosity is 2.97% the hydraulic
conductivity of the macropore domain is around 850 cm/min, the simulation effective hydraulic
conductivity of the column matches the experiment hydraulic conductivity of the column best
(i.e. the experimental K minus simulated K approaches zero). For 40-60 Sand and 12-20 Sand,
the hydraulic conductivity of the macropore domain is around 1700 cm/min, the simulation
effective hydraulic conductivity of the column matches the experiment hydraulic conductivity of
the column best.

35
Figure 2.8. Relationship between hydraulic conductivity of macropore domain used in a MODFLOW simulation and the difference
between the simulated and experimentally-estimated effective saturated hydraulic conductivity for a macropore density of 2.97%.

36
Summary and Conclusions
Macropores are very common in most soils and create preferential pathways for solute
transport in the subsurface, which might reduce the availability of water and nutrients to plants,
and cause accelerated transport of pollutants. Although many studies have been conducted to
characterize the impact of macropore effects on saturated solute transport, applicability of the
results from these studies is hampered by the fact that the structure of macropores in the field is
often not known a priori. In this experimental investigation, we used artificial macropores to
study the effects of macropore density and connectivity on the effective saturated hydraulic
conductivity of porous media. The effective hydraulic conductivity of the porous media for
different macropore distributions was analyzed using steady state water flow simulations. The
results show that as macropores become discontinuous, the hydraulic conductivity approaches
the value of no-macropore media. Also, the extent of effects of macropore connectivity on the
hydraulic conductivity decrease when the porous media size was increased.

37
III. On understanding the Applicability of Darcy’s Law Under High Velocity Conditions
Introduction
Water flow in porous media is traditionally modeled using Darcy‘s law described
mathematically as shown in equation [3.1]:
Kiq
kgK
Where q is the flow rate per unit cross-section, also called as the specific discharge of water flow
(L3/L
2/T), K is the hydraulic conductivity of the porous media (L/T), i is the hydraulic gradient
driving the flow, and g is the acceleration due to gravity (L/T2). The hydraulic conductivity is
related to the kinematic viscosity of the fluid, (L2/T) and intrinsic permeability of the porous
media, k (L2) which describes the ability of the media to conduct flow (Equation 3.1b).
The linear relationship between the specific discharge and the gradient, as described by
Darcy‘s law, has been found to be valid only under certain flow conditions (e.g., Dullien, 1992;
Bear, 1988). Dullien (1992) best described the rationale behind Darcy‘s law as follows:
“The porous medium is imagined to be subdivided in to a network of small blocks, and
Darcy’s law is applied to each block. The size of each block must be small enough to
approximate q, k, i and with constant values within each block; but the size of each block must
be large enough for Darcy’s law in its macroscopic form to apply in the block.”
It is clear that Darcy‘s law is a close approximation of a complex set of physical process,
but not a mathematical representation of the underlying processes. Previous researchers have
described that the conditions under which the rationale described above is valid occurs under

38
laminar conditions (Bear, 1988). In fact, a linear approximation between gradient and the
discharge is not uncommon in laminar flow in other regimes such as pipe flow. A laminar
condition under which Darcy‘s law is valid can been defined mathematically using the Reynolds
number (Re, dimensionless). For a porous medium, Reynolds number has been commonly
estimated using the equation [3.2]:
qDRe
where D is a characteristic length (L). This characteristic length is assumed often as the
mean grain diameter. Although others have defined the characteristic length as other estimates of
the grain size distribution, we use the mean grain diameter in this study.
The phenomenological nature of Darcy‘s law needs to be considered when applying the
same in porous media applications. In the words of Freeze and Cherry (1979),
“Darcy's law is an empirical law. It rests only on experimental evidences”.
Given the fact that Darcy‘s law has been ascribed to be an experimentally-derived than a
fundamental law, defining the limitations of its use in porous media system is a worthy effort.
For example, the threshold value (as represented by the highest Reynolds number) where
Darcy‘s law may not be violated is not very clearly described. It is however, hypothesized to be
dependent on the relative effects of viscous force and inertial forces in the porous media. It is
commonly accepted that flow in porous media can be distinguished in to three zones (see Figure
3.1). The first zone, called as Darcian zone, corresponds to flow rates where the Darcy‘s law is a
valid model. In this zone, viscous forces are dominant over the inertial forces in driving the flow.
The upper limit of this zone is not clear and commonly assumed to be somewhere between
Reynolds number of 1 and 10. The third zone corresponds to very high Reynolds numbers where

39
the flow is turbulent. Lindquist (1930) suggested that the hydraulic gradient in the third zone is
linearly related to the Reynolds number (or quadratic with respect to specific discharge). Inertial
force dominates viscous forces leading to turbulent flows. The second zone is transitional in
nature and lies between the first and third zones. In most practical situations involving flow in
porous media, one may not expect to exceed Reynolds number of more than 10 with a majority
of them not exceeding Reynolds numbers of 1 (Firdaouss et al., 1997). Hence, our interest lies in
characterizing flow in the Darcian zone and transition zones.

40
Figure 3.1. Schematic of specific discharge vs gradient relationship (Bear 1972).

41
In an effort to mathematically represent the transition of flow in porous media from
Darcian regime in to the transition zone and beyond, several authors have proposed non-linear
extensions of Darcy‘s law (Dullien, 1992; Firdaouss et al., 1997 etc.). Most of these non-linear
variations of Darcy‘s law resemble a quadratic form as shown in equation [3.3].
2qqi
The constant, α represents the linearity of flow in the porous media (inversely
proportional to the hydraulic conductivity) and β represents the non-linearity that is induced in
the transition zone. Probably, the best known equation of this form is the Ergun Equation (Ergun,
1952). Using the Ergun equation, the values of constants α and β can be estimated from the
properties of porous media as shown below:
23
2)1(
Dg
A
Dg
B3
)1(
where is the porosity, A and B are constants assumed to be 180 and 1.8 (or 4.0) for
most media and D is the average diameter of the particles in the porous media that is
representative of the characteristics length. MacDonald et al. (1979) tested the Ergun equation
for an extensive set of porous media and found that the Ergun equation can make reasonable
predictions for flow dynamics in the porous media systems.
While equations such as the Ergun‘s equation can describe non-linear effects of flow in
porous media across the Darcian, transition and turbulent zones, a number of drawbacks can be

42
observed from the standpoint of making hydrological predictions using this equation. The model
does not lead it to formulation of governing equations in porous media that exhibit non-darcian
characteristics. Hydrogeologists are used to representing discharge as a function of hydraulic
gradient unlike chemical engineers who are more interested in estimating gradient as a function
of specific discharge. As a consequence, formulations such as Equation [3.3] are biased towards
representing the turbulence in flow through porous media as they are developed mostly by
chemical scientists. On the other hand, hydrogeologists focus on the Darcian and transition zones.
We believe that one can develop better intuitive equations that lend themselves better to
modeling flow through porous media in the Darcian and transition zones. The objective of this
paper is two-fold: (a) to understand the limitations of Darcy‘s law as a function of porous media
and (b) to develop a intuitive equation for describing the non-linear effects on flow through
porous media that is better suited for modeling hydrogeological system.
Theoretical Analysis
Derivation of the Inverted Ergun Equation
The Ergun equation, as shown in equation [3.3], describes the relationship between the
hydraulic gradient and the specific discharge. Rewriting equation [3.3], we get
2
2
2
2
22
22
44qq
iqq
i
2
22
42
iq
Simplifying further, we get

43
11
4
242
2
1
2
2
1
2
2
iq
iq
In mathematics, a Taylor series is a representation of a function as an infinite sum of terms that
are calculated from the values of the function's derivatives at a single point (Abramowitz and
Irene 1970). One of the Taylor series expansions is as follow:
Under conditions of 14
2
i,
Equation [3.6] can be simplified using Taylor‘s series expansion up to the cubic term as follows:
6
33
4
22
2
2
1
2
64
16
116
8
14
2
1
211
4
2
iiiiq
3
5
22
32 iii
iq
32 iiiq
where η=
1, λ=
3
and χ=
5
2
2
.The derived equation, hereby called as the Inverted
Ergun (IE) equation, represents the discharge-hydraulic gradient relationships beyond the
Darcian zone. The IE equation can be visualized as comprising of a linear component ( i ) that is
Darcian in nature and two non-linear terms ( 32 ii ) that models the flow transition away from

44
the Darcian zone. It may be observed that the IE equation is more intuitive than the Ergun
equation. Another advantage of the IE equation is that it preserves the use of all the parameters
used in the Ergun equation and does not introduce any new parameters of its own. Thus, the
equation can be readily applied using parameter information available in the literature.
Validity of the Inverted Ergun’s Equation
For equation [3.9] to be valid, equation [3.7] has to be satisfied. It is possible to estimate
the maximum hydraulic gradient iie until which the IE equation is valid. The limiting gradient iie
is defined from eqn 3.7 as iie= 2 4 and substituting the values of α and β from eqn. 3.4 a&b ,
we get
332
3222
4
)1(
4 DBg
Aii ieie
In equation [3.10], the hydraulic gradient up to which Equation [3.9] is valid (iie) is
shown to be a function of the mean grain size diameter of the porous media and the porosity.
Figure 3.2 shows hydraulic gradient-specific discharge relationships estimated using Ergun and
Inverted Ergun equations for a variety of average grain sizes. Figure 3.3 shows variation of iie as
a function of porosity and average grain sizes diameter. The values of iie for the different grain
sizes shown in Figure 3.3 are rarely encountered in practical hydrological application and
therefore, one could conclude that IE should be adequate for practical applications.

45
Figure 3.2. An illustration of the gradient-specific discharge relationships as estimated by the
Ergun (solid symbols) and Inverted Ergun Equations (IE, open symbols) (assuming constants,
A=180 and B=1.80 and porosity of 0.40). Plot (a) shows the curves for average grain diameters
of 0.08(square), 0.10(triangle) and 0.15 cm (circle). Plot (b) shows the curves for average grain
diameters of 0.03(circle) and 0.05(triangle).

46
Average Grain Diameter, D (cm)
0.00 0.02 0.04 0.06 0.08 0.10 0.12 0.14 0.16 0.18 0.20
Va
lid H
ydra
ulic
Gra
die
nt, iie
(cm
/cm
)
0.01
0.1
1
10
100
1000
10000
=0.35
=0.40
=0.45
Figure 3.3. Variation of maximum hydraulic gradient as a function of mean grain size diameter
(cm) at various porosities, (cm3/cm
3) values (assuming constants, A=180 and B=1.80 and using
the inverted Ergun equation).

47
Defining the Upper Limit for the Validity of Darcy’s Law
It has long been recognized that the upper limit of velocity until which Darcy‘s law is
valid is unclear (Bear 1988). Although a Reynolds number of 1-10 has been suggested to be the
upper limit, this range is too wide to be used. Also, for subsurface hydrology application, it
would be more intuitive to express this upper limit as a function of hydraulic gradient and porous
media. Specific discharge-hydraulic gradient relationships are essentially non-linear across all
values of hydraulic gradient. This is especially the case for coarser soils. We propose that the
gradients (or Reynolds number) up to which Darcy‘s law is valid should be statistically defined
rather than on a purely physical basis. This is largely due to the fact that a physical approach to
estimating the upper limits of validity for Darcy‘s law would attempt to linearize a phenomenon
which is essentially non-linear. We propose that the hydraulic gradient up to which Darcy‘s law
is valid should depend on the maximum error that one is willing to accept in the resulting
estimates of specific discharge.
Mathematically, deviations from Darcy‘s law at larger hydraulic gradients are observed
because of significant contributions from the non-linear component of the inverted Ergun‘s
equation as compared to its linear component. Therefore, as long as the non-linear components
does not exceed by a certain percentage compared to the linear component of the equation,
Darcy‘s law can be assumed to be valid. If ε is the acceptable fractional error which is a ratio of
the non-linear terms in the IE equation (quadratic and cubic terms) and the linear term, as
defined as below:
i
ii )( 32
Let us define id is the limiting gradient at which eqn. 3.11 (a) be statisfied as

48
32 ii
i=
The above equation can be arranged as:
4
8112
23
5
22
3
d
ddd i
iii
where id is the maximum hydraulic gradient up to which Darcy‘s law may be considered
to be valid. It may be observed that id has a very similar mathematical form as iie. Combining
equations [3.10] and [3.11], we get
811
4
)1(811
332
322
DBg
Aii ied
Therefore, the maximum hydraulic gradient up to which Darcy‘s Law is not violated will
always be less than the hydraulic gradient up to which the Inverted Ergun‘s equation. Equation
[3.12] proves that the IE equation can adequately represent the flow in porous media for Darcian
(0<i< id) and transition zones (id <i< iie) that one typically observes in ground water flow
regimes. For a given porous media, the maximum Reynolds number (Red) at which the Darcy‘s
law is not valid can be calculated as follows:
4
811)
4
811(
)(Re
D
DDiDq dd
d

49
B
Ad
4
)1(811Re
Figure 3.4 shows the variation in Red as a function of A/B and the acceptable error. It is
interesting to note that Reynolds number up to which Darcy‘s law is valid is truly dependent only
on the porosity of the porous media (or the bulk density of the porous media). Strikingly,
MacDonald (1979) in his extensive review of available literature data suggested that deviations
from Darcy‘s law seem to become noticeable in the range of Red/ )1( ~1-10.

50
20
20
30
40
50
10
10
Acceptable Error,
0.02 0.04 0.06 0.08 0.10
A/B
(-)
20
30
40
50
60
70
80
90
100
Figure 3.4. Contour of the maximum Reynolds number (
B
Ad
4
)1(811Re
) as a
function of the relative error (ε) and the system parameter A/B.

51
Experimental Method
MacDonald et al. (1979) provides a comprehensive review of experimental data available
in the literature that describes flow dynamics in porous media. Although extensive data is
available that show hydraulic gradient-specific discharge relationships for a variety of porous
media, they were collected with an intention to characterize the turbulent zone. However, for
subsurface hydrology applications, it is necessary to gather/ develop datasets that focus on the
Darcian and transition zones and characterize the transition between the two zones. Due to lack
of such datasets, we designed new set of experiments to develop hydraulic gradient-specific
discharge relationships for a variety of glass beads and sands. Table 3.1 lists the properties of the
porous media used in our experiments. The experimental setup was based on the ‗constant head‘
approach for estimating hydraulic conductivity. Figure 3.5 shows a schematic of the experiment.
Soil was packed in to the bottom 30 cm of a long graduated glass cylinder of 3.64 cm diameter
under saturated conditions. Degassed water was used at all times to ensure complete saturation of
the column. The bottom of the soil column was connected to a stationary outlet where flow rates
were measured. The outlet was elevated such that the soil column remains saturated under static
conditions. A peristaltic pump (Master flex) was used to continuously pump water in to the
column and head at the top of the soil column was controlled using a movable outlet that was
connected to the glass cylinder just above the soil column. By moving the outlet using a pulley
mechanism, head at the top of soil column was fixed at various desired values. The head
measurements were directly read on the cylinder to avoid any measurement errors. All inflow
and outflow waters were delivered through a reservoir that re-circulated the degassed water to
ensure a closed system.

52
Name G1 G2 G3 S1 S2 S3
Type of porous media Glassbeads Glassbeads Glassbeads Sand Sand Sand
Average grain diameter (cm) 0.19 0.15 0.05 0.11 0.06 0.03
Particle density (g/cm3) 2.47 2.49 2.49 2.63 2.62 2.76
Porosity 1 0.36 0.37 0.33 0.34 0.33 0.36
Number of Data points 34 30 45 43 51 45
Range of Re 0 0-15.6 0-6.25 0-14.46 0-11.8 0-4.2
Range of Hydraulic gradients 0-1.81 0-1.94 0-9.29 0-4.39 0-6.42 0-12.64
Range of specific discharge 0-1.31 0-1.38 0-0.66 0.1.31 0-1.39 0-0.96
Table3.1 Properties of porous media used and a summary of the related experiment performed to develop gradient-specific discharge
data for this study. G1 is Large Glassbeads, G2 is Medium Glassbeads, G3 is Fine Glassbeads, S1 is No. 12-20 Sand, S2 is No.20-40
Sand and S3 is No.40-60 Sand.
1. Calculated from measured bulk density (Gravimetric method (SSSA, 2002b) and particle density (Liquid displacement method
(SSSA, 2002b)).

53
Figure 3.5(a) Experimental setup for estimating specific discharge-gradient relationships. Soil
was packed in to the bottom 30cm of a long graduated glass cylinder of 3.64 cm diameter under
saturated conditions.

54
Figure 3.5(b) Pictures of experimental setup for estimating specific discharge-gradient
relationships. Soil was packed in to the bottom 30cm of a long graduated glass cylinder of 3.64
cm diameter under saturated conditions

55
Analysis of Experimental Results
Experimental data was collected for the porous media under consideration using the setup
explained in the previous section. Figure 3.6 and 3.7 shows the relationships between specific
discharge and hydraulic gradient for glass beads and sands respectively. One may clearly notice
a quadratic nature in these relationships. On preliminary examination, it is conceivable that there
exists a gradient for at least some of these porous media where the quadratic nature of the
specific discharge-hydraulic gradient may violate Darcy‘s law.

56
Figure 3.6. Experimental data for measured hydraulic gradient and the specific discharge for all
three glassbeads. G1 is Large Glassbeads, G2 is Medium Glassbeads, and G3 is Fine Glassbeads.

57
Figure 3.7 Experimental data for measured hydraulic gradient and the specific discharge for all
three silica sands. , S1 is No. 12-20 Sand, S2 is No.20-40 Sand and S3 is No.40-60 Sand.

58
Using the data obtained from the experiments for different porous media, we analyzed the
effectiveness of the following: (a) Coefficients in the Ergun equation by directly curve-fitting the
dataset, (b) Coefficients from Ergun coefficients obtained in (a), (c) Coefficients estimated by
directly curve-fitting the dataset (IEc). We observed that the IE equation coefficients estimated
using curve-fitting and using Ergun coefficients were similar in magnitude. Hence, we reported
only the IE coefficients estimated through curve fitting. Table 3.2 lists the Ergun and IE
coefficients estimated through curve-fitting. One may notice that the non-linear coefficients tend
to get smaller as the porous media is more coarser. Table 3.2 also reports the gradients up to
which the IE equation and the Darcy‘s equation is valid for these porous media.

59
Type of porous media G1 G2 G3 S1 S2 S3
α (sec/cm) 0.31 0.95 11.47 0.85 1.61 11.47
β (sec2/cm
2) 0.23 0.11 0.57 0.35 0.48 1.27
η (-) 3.27 1.05 0.09 1.17 0.62 0.09
λ(-) -8.13 -0.13 0.001 -0.56 -0.11 0.003
χ (-) 40.41 0.03 0.002 0.53 0.04 0.002
iie 0.10 1.98 57.34 0.52 1.36 25.80
id ( for ε=0.1) 0.04 0.79 22.94 0.21 0.54 10.32
Estimated the Value of A 155.08 148.30 175.40 165.30 193.40 184.30
Estimated the Value of B 4.00 1.80 1.80 3.90 5.60 2.20
Table 3.2 Estimated values of Ergun and inverted Ergun coefficients for the porous medium used
in the experimental study. α represents the linearity of flow in the porous media.
Notes:
G1 is Large Glassbeads, G2 is Medium Glassbeads, G3 is Fine Glassbeads, S1 is No. 12-20 Sand,
S2 is No.20-40 Sand and S3 is No.40-60 Sand.
β represents the non-linearity that is induced in the transition zone.
η=
1, λ=
3
and χ=
5
2
2
.
iie is the maximum hydraulic gradient until which the IE equation is valid.
id is the maximum hydraulic gradient up to which Darcy‘s law may be considered to be valid.
A and B are porous media properties.

60
We have developed and showed the applicability of an equation to determine the upper
limit for the validity of Darcy‘s equation.
From the coefficients estimated for IE equation, we inverse-estimated the values of
parameters A and B for these porous media. We observed that estimates of A and B are
estimated to be in the range of 140-200 and 1-6 respectively. These are also the suggested range
for these parameters in the literature (Dullien, 1992).
Summary and Conclusions
Darcy‘s Law is not an exact mathematical representation for porous media flow, instead
it is an empirical approximation of the underlying physical processes. The threshold value of
hydraulic gradient above which the Darcy‘s law may be violated was investigated. By
modifying the Ergun equation, a new expression has been suggested that can represent the
discharge-hydraulic gradient relationship beyond the Darcian zone. Using this equation an
estimate of maximum hydraulic gradient up to which Darcy‘s Law is not violated has been
calculated. It was interesting to observe that the validity of the Darcy‘s law depends purely on
the porosity and this theoretical finding is consistent with empirical observations made in the
past. For example, MacDonald (1979) reviewed all available literature data and suggested that
deviations from Darcy‘s law would be noticeable when Red/ )1( ~1-10. Our theoretical model
also yielded similar constrains for the validity of Darcy‘s Law.

61
IV. Recommendations for Future Work
Biopores in soils can have a well structured pattern and can spread quite extensively
throughout the subsurface. The size, distribution, continuity, depth as well as hydraulic
characteristics of biopores can vary as a function of hydrological conditions as well as behavioral
characteristics of the burrowing animal. A number of burrowing animals create macropores in
soils for different depths and connectivities, which is much more complicated than the structure
created by artificial macropores in lab. Biopores created by burrowing animals and invertebrates
have significant influence on hydrological process. It is recommended that future investigations
should combine the results of this effort with the knowledge of other disciplines such as
entomology to better characterize various types of realistic biopores expected to be present in
natural systems. This would help us develop a better understand of the impacts of biopores on
water storage, solute transport in porous media systems. Such a fundamental understanding will
help us better describe large-scale hydrological processes such as infiltration and runoff .

62
References
Abramowitz Milton; Stegun Irene A. 1970. Handbook of Mathematical Functions with Formulas,
Graphs, and Mathematical Tables, New York: Dover Publications, Ninth printing.
Addiscott, T.M., Brockie, D., Catt, J.A., Christian, D.G., Harris, G.L., Howse, K.R. et al. 2000.
Phosphate losses through field drains in a heavy cultivated soil. Journal of Environmental
Quality, 29, 522–532.
Ahuja, L.R. 1993. Characteristics of macropore transport studied with the ARS Root Zone Water
Quality Model. Transactions of ASAE. 36:369–380.
Bear, J. 1972. Dynamics of Fluids in Porous Media. American Elsevier Publishing Company,
New York.
Beven, K., 1991. Modeling preferential flow: an uncertain future? In: Gish, T.J., Shirmohannadi,
A. (Eds.), Preferential Flow, American Society of Agricultural Engineers, St Joseph, MI, pp.
1–11.
Beven, K., and P. Germann, 1982, Macropores and water flow in soils, Water Resource
Reserach. 18, 1311-1325.
Blake, G., Schlichting, E. and Zimme rman, U,1973. Water recharge in a soil with shrinkage
cracks. Soil Science Society of American Journal. In Proc., 37: 669-672.
Bouma, J.,1981. Soil morphology and preferential flow a long ma cropores. Agricultural Water
Management. 3:235-250.
Brewer, R., 1964. Fabric and Mineral Analysis of Soils, John Wiley, New York.
Bullock, P. and Thomasson,A.J., 1979. Rothamsted studies of soil structure. II. Measurement
and characterization of macroporosity by image analysis and comparison with data from
water retention measurements. Journal of Soil Science, 30: 391--413.
Bundt, M., Widmer, F., Pesaro, M., Zeyer, J. & Blaser, P. 2001b. Preferential flow paths:
biological ‗hot spots‘ in soils. Soil Biology and Biochemistry, 33, 729–738.
Camobreco, V.J., Richards, B.K., Steenhuis, T.S., Peverly, J.H. & McBride, M.B. 1996.
Movement of heavy metals through undisturbed and homogenized soil columns. Soil Science,
161, 740–750.
Capowiez, Y., Monestiez, P. & Belzunces, L. 2001. Burrow systems made by Aporrectodea
nocturna and Allolobophora chlorotica in artificial cores: morphological differences and
effects of interspecific interactions. Applied Soil Ecology, 16, 109–12.

63
Chertkov, V.Y. & Ravina, I. 1999. Tortuosity of crack networks in swelling clay soils. Soil
Science Society of America Journal, 63, 1523–1530.
Childs, E.C. 1969. An Introduction to the Physical Basis of Soil Water Phenomena. J. Wiley &
Sons, London.
David E. Radcliffe. 2008, Water and Solute Movement, 1048-1050, CRC Press.
Dullien, F.A.L., 1992. Porous Media, Fluid Transport and Pore Structure, Academic Press, San
Diego.
Dykhuizen, R. C., 1987, Transport of solutes through unsaturated fractured media, Water
Research, 21, 1531-1539.
Edwards, W.M., Shipitalo, M.J., Traina, S.J., Edwards, C.A. & Owens, L.B. 1992. Role of
Lumbricus terrestris (L.) burrows on quality of infiltrating water. Soil Biology and
Biochemistry, 24, 1555–1561.
Edwards, W.M., Norton, L.D. & Redmond, C.E. 1988. Characterizing macropores that affect
infiltration into nontilled soil. Soil Science Society of America Journal, 52, 483–487.
Ehlers, W., 1975. Observation on earthworm channels and infiltration on tilled and untilled loess
soil. Soil Science, 119: 242--249.
Ela, S.D., Gupta, S.C., Rawls, W.J. & Moncrief, J.F. 1991. Role of earthworm macropores
formed by Aporrectodea tuberculata on preferential flow of water through a Typic Hapludoll.
In: Preferential Flow (eds T.J. Gish & A. Shirmohammadi), pp. 68–76. Proceedings of the
National Symposium, December 1991. American Society of Agricultural Engineers, Chicago.
Elliott, E.T. & Coleman, D.C. 1988. Let the soil work for us. Ecological Bulletins, 39, 23–32.
Ergun, S. 1952, Fluid flow through packed columns. Chemical Engineering Progress, 48, 89-94.
FOCUS 2001.FOCUS Surface Water Scenarios in the EU Evaluation Process Under 91/414/EEC.
Report of the FOCUS Working Group on Surface Water Scenarios, EC Document Reference
SANCO/4802/2001- rev.2.
Freeze, R.A. and J. A. Cherry. 1979. Groundwater. Prentice-Hall, Inc., Englewood Cliffs, NJ.
604 pp.
Gerke, H.H. 2006. Preferential flow descriptions for structured soils. Journal of Plant Nutrition
and Soil Science, 169, 382–400.
Gerke, H.H. & van Genuchten, M.T. 1993. A dual-porosity model for simulating the preferential
movement of water and solutes in structured porous media. Water Resources Research, 29,
305–319.

64
Gjettermann, B., Hansen, H.-C.B., Jensen, H.E. & Hansen, S. 2004. Transport of phosphate
through artificial macropores during film and pulse flow. Journal of Environmental Quality,
33, 2263–2271.
Green, R.D. and Askew, G.P., 1965. Observations on the biological development of macropores
in soils of Romney Marsh. J. Soil Science, 16: 342--349.
Gwo, J.P., Jardine, P.M., Wilson, G.V., Yeh, G.T., 1995. A multiple-pore-region concept to
modeling mass transfer in subsurface media. Journal of Hydrology. 164, 217–237.
Haria, A.H., Hodnett, M.G. & Johnson, A.C. 2003. Mechanisms of groundwater recharge and
pesticide penetration to a chalk aquifer in southern England. Journal of Hydrology, 275, 122–
137.
Heckrath, G., Brookes, P.C., Poulton, P.R. & Goulding, K.W.T. 1995. Phosphorus leaching from
soils containing different phosphorus concentrations in the Broadbalk experiment. Journal of
Environmental Quality, 24, 904–910.
Hendrickx, J.M.H., Flury, M., 2001. Uniform and preferential flow, mechanisms in the vadose
zone, Conceptual Models of Flow and Transport in the Fractured Vadose Zone, National
Research Council, National Academy Press, Washington, DC, pp. 149–187.
Hooda, P.S., Moynagh, M., Svoboda, I.F., Edwards, A.C., Anderson, H.A. & Sym, G. 1999.
Phosphorus loss in drainflow from intensively managed grassland soils. Journal of
Environmental Quality. 28, 1235–1242.
Jarvis, N.J. 1998. Modelling the impact of preferential flow on non-point source pollution. In:
Physical Non-Equilibrium in Soils: Modeling and Application (eds H.H. Selim & L. Ma), pp.
195–221. Ann Arbor Press, Chelsea, Michigan.
Jarvis, N.J. 2007. A review of non-equilibrium water flow and solute transport in soil
macropores: principles, controlling factors, and consequences for water quality. European
Journal of Soil Science. 58, 523–546.
Je gou, D., Capowiez, Y. & Cluzeau, D. 2001. Interactions between earthworm species in
artificial soil cores assessed through the 3D reconstruction of the burrow systems. Geoderma,
102, 123–13
Jørgensen, P.R., McKay, L.D. & Spliid, N.Z.H. 1998. Evaluation of chloride and pesticide
transport in a fractured clayey till using large undisturbed columns and numerical modeling.
Water Resources Research. 34, 539–553.
Larsson, M.H. & Jarvis, N.J. 2000. Quantifying interactions between compound properties and
macropore flow effects on pesticide leaching. Pest Management Science. 56, 133–141.

65
Lawes, J.B., Gilbert, J.H. & Warington, R.1882. On the Amount and Composition of the Rain
and Drainage Waters Collected at Rothamsted. William Clowes & Sons, London.
Lewis, D.T., 1977 Subgroup designation of three Udolls in southeastern Nebraska, Soil Science
Society of American Journal. 41, 940-945.
Logsdon, S., McCoy, E.L., Allmaras, R.R., Linden, D.R., 1993. Macropore characterization by
indirect methods. Soil Science. 155, 316–324
Luxmoore, R.J., Micao-,1981, meso-and macroporosity of soil, Soil Science Society of
American Journal. 45,671.
McDonald, I., 1981. A revised model for the estimation of protein degradability in the rumen.
Journal of Agricultural Scienc (Camb.) 96, 251±252.
Marshall, T.J. 1959. Relations between water and soil. Tech. comm. 50. Commonwealth
Agricultural Bureau, Farnham Royal, UK.
Mori, Y., Iwama, K., Maruyama, T. & Mitsuno, T. 1999a. Discriminating the influence of soil
texture and management-induced changes in macropore flow using soft X-rays. Soil Science.
164, 467–482.
Mosely, M.P., 1982. Subsurface flow velocities through selected forest soils, South Island, New
Zealand. Journal of Hydrology. 55, 65–92.
Newson, M.D., and Harrison, J.G., 1978. Channe l studies in the Plynlimon experimental
catchments. Institute of Hydrology, Wallingford, Oxon. Rep. No. 47, 61pp.
Nelson, W. R., and Baver, L. D. Movement of water through soils in relation to the nature of the
pores. Soil Science Society of America. In Proc. 5: 60-76. 1940.
Nutting, P.G., 1930. Physical analysis of oil sands, American Association of Petroleum
Geologists Bull. 14, 1337-1349.
Omoti, U. and Wild, A., 1979. Use of fluorescent dyes to mark the pathways of solute movement
through soils under leaching conditions, 2. Field experiments. Soil Science. 128: 98-10
Perret, J.S., Prasher, S.O., Kantzas, A. & Langford, C. 1999. Threedimensional quantification of
macropore networks in undisturbed soil cores. Soil Science Society of America Journal, 63,
1530–1543.
Pivetz, B.E. & Steenhuis, T.S. 1995. Soil matrix and macropore biodegradation of 2,4-D. Journal
of Environmental Quality, 24, 564–570.

66
Pivetz, B.E., Kelsey, J.W., Steenhuis, T.S. & Alexander, M. 1996. A procedure to calculate
biodegradation during preferential flow through heterogeneous soil columns. Soil Science
Society of America Journal, 60, 381–388.
Priebe, D.L. & Blackmer, A.M. 1989. Preferential movement of oxygen- 18-labeled water and
nitrogen-15-labeled urea through macropores in a Nicollet soil. Journal of Environmental
Quality, 18, 66–72.
Pruess, K., Wang, J.S.Y., 1987. Numerical modeling of isothermal and non-isothermal flow in
unsaturated fractured rock—a review. In: Evans, D.D., Nicholson, T.J. (Eds.), Flow and
Transport through Unsaturated Fractured Rock, Geophysics Monograph, vol. 42. American
Geophysical Union, Washington, DC, pp. 11–22.
Ranken, D. W. 1974, Hydrologic properties of soil and subsoil on a steep, forested slope, M.S.
thesis, Oregon State University, Corvallis.
Reeves, M.J., 1979, Recharege of the English chalk, A possible meachanism, Engineering
Geology, 14(4).
Ritzema HP. 1994. Drainage Principles and Applications. ILRI: The Netherlands.
Roulier, S., Baran, N., Mouvet, C., Stenemo, F., Morvan, X., Albrechtsen, H.-J. et al. 2006.
Controls on atrazine leaching through a soilunsaturated fractured limestone sequence at Bre
villes, France. Journal of Contaminant Hydrology, 84, 81–105.
Russell, E. W. 1973. Soil conditions and plant growth. 10th ed. Longman, London.
Shepherd RG (1989) Correlations of permeability and grain size. Ground Water 27:633–63.
Shipitalo, M.J. & Butt, K.R. 1999. Occupancy and geometrical properties of Lumbricus terrestris
L. burrows affecting infiltration. Pedobiologia, 43, 782–794.
Shipitalo, M.J., Dick, W.A., Edwards, W.M., 2000. Conservation tillage and macropore factors
that affect water movement and the fate of chemicals. Soil Tillage Research. 53, 167–183.
Šimůnek, J., N.J. Jarvis, M.h . van Genuchten, and A. Gärdenäs. 2003. Review and comparison
of models for describing non-equilibrium and preferential flow and transport in the vadose
zone. Journal of Hydrology. 272:14–35.
Soil Science Society of America (SSSA). 2002b. Field Water Capacity. Section 3.3.3.2 in SSSA
Book Series:5 Methods of Soil Analysis Part 4- Physical Methods, J. H. Dane and C. Topp,
eds., Soil Science Society of America, Madison,WI.
Stenemo, F., Jørgensen, P. & Jarvis, N.J. 2005. Linking a one-dimensional pesticide fate model
to a three-dimensional groundwater model to simulate pollution risks of shallow and deep
groundwater underlying fractured till. Journal of Contaminant Hydrology, 79, 89–106.

67
Stewart, J.B., Moran, C.J. & Wood, J.T. 1999. Macropore sheath: quantification of plant root and
soil macropore association. Plant and Soil, 211, 59–67.
Thomasson, A.J. 1978. Towards an objective classification of soil structure. J. Soil Sci. 29:38–46.
Tippkotter, R. 1983. Morphology spatial arrangement and origin of macropores in some
Hapludalfs, West Germany. Geoderma, 29, 355–371.
Todd, D.K. 1959. Groundwater hydrology, Wiley and Sons, New York.
Ule n, B. & Persson, K. 1999. Field-scale phosphorus losses from a drained clay soil in Sweden.
Hydrological Processes, 13, 2801–2812.
White, R.E. 1985a. The influence of macropores on the transport of dissolved and suspended
matter through soil. Advances in Soil Science, 3, 95–120.
Wildenschild, D., K.H. Jensen, K. Villholth, and T.H. Illangasekare. 1994. A laboratory analysis
of the effect of macropores on solute transport. Ground Water. 32:381–389.
Zaslavsky, D., and G. Kasiff, Theoretical formulation of pipling mechanism in cohesive soils,
Geotechnique, 15 (3), 305-316,1965.
.