Embed Size (px)
Citation preview

Fundamental Analysis: Tata Consultancy
Services Limited (TCS)
May 15, 2020
─
Ayan Banerjee Roll No. 16EC8020
Stock Market and Investment Management (MS842) Assignment Part-I

IT Services
99%
Sales of IT Equipme
nt & Software Licenses
1%
Sales Breakdown by Activity
Company Background and Product/Services Tata Consultancy Services Limited (TCS) is the largest Indian multinational information
technology (IT) service and consulting company, and is headquartered in Mumbai, Maharashtra,
India. It is a subsidiary of Tata Group and operates in 149 locations across 46 countries.
TCS is the largest Indian company by market capitalization. Tata consultancy services is now
placed among the most valuable IT services brands worldwide. It is the world's largest IT services
provider. In 2018, it is ranked 11th on the Fortune India 500 list. In April 2018, TCS became the
first Indian IT company to reach $100 billion market capitalization (this makes it a large cap
company), and second Indian company ever (after Reliance Industries achieved it in 2007) after
its market capitalization stood at ₹6,79,332.81 crores ($102.6 billion) on the BSE (formerly
Bombay Stock Exchange).
Sales Break up Net sales breakdown by activity –
IT services (98.7%): consulting and engineering services, solutions and systems
integration, management applications development, outsourcing services, etc.;
Sale of IT equipment and software licenses (1.3%)
Net sales break down by market –
Bank-financial services insurance (BFSI) (30.5%)
Retail and consumer packaged goods (15.2%)
Communication and media (7.0%)
Manufacturing industry (9.9%)
Life sciences and healthcare (8.3%)
Technology and services (8.6%) and,
Others (20.5%).
Net sales are distributed geographically as follows –
India (5.7%),
Americas (52.3%),
Europe (30.6%) and,
Others (11.4%).

BFSI30%
Retail & CFG15%
Manufacturing
Industry10%
Communication & Media
7%
Life Sciences
and Healthcar
e8%
Technology &
Services9%
Others21%
SALES BREAKUP (BY VERTICALS)
Shareholding Pattern Sl No. Name No. of
Shareholders
Equities %
1 Promoter & Promoter Group 5 2,70,35,42,000 72.05%
1.1 Tata Sons Private Limited 1 2,70,24,50,947 72.02%
1.2 Tata Investment Corporation Limited 1 10,36,269 0.03%
1.3 Tata Steel Limited 1 46,798 0.00%
1.4 Tata Industries Limited 1 7,220 0.00%
1.5 The Tata Power Company Limited 1 766 0.00%
2 Institutions 1477 89,09,31,476 23.74%
2.1 Mutual Funds/UTI 41 9,56,98,803 2.55%
2.2 Alternate Investment Funds 24 18,20,360 0.05%
2.3 Foreign Portfolio Investors 1346 59,06,21,054 15.74%
2.4 Financial Institutions/ Banks 21 18,49,839 0.05%
2.5 Insurance Companies 45 20,09,41,420 5.36%
2.5.1 Life Insurance Corporation of India 1 15,75,32,346 4.20%
3 Central Govt./State Govt.(s)/President
of India
7 24,20,388 0.06%
4 Non-institutions 8,57,336 15,54,90,842 4.14%
4.1 Individuals 853942 13,14,89,806 3.50%
4.2 Others 3394 2,40,01,036 0.64%
As of March 31, 2020
Source: TCS Quarterly Report
Americas52%
Europe31%
India6%
RoW11%
SALES BREAKUP (BY GEOGRAPHY)
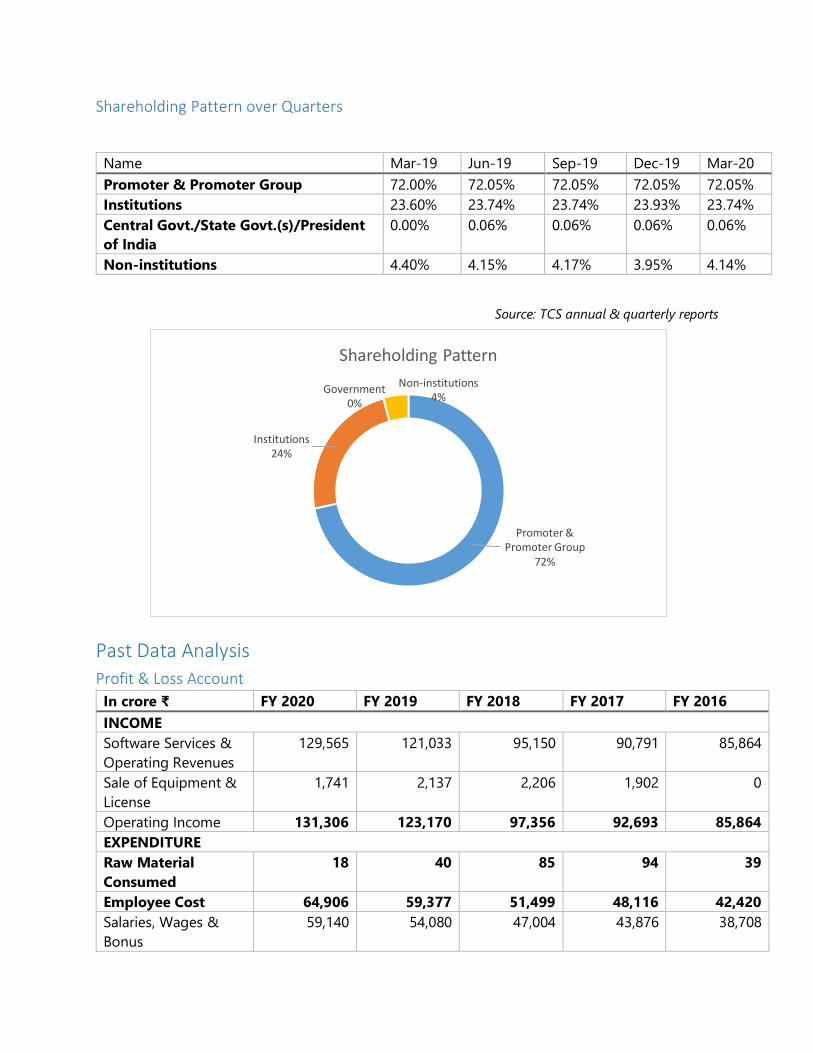
Shareholding Pattern over Quarters
Source: TCS annual & quarterly reports
Past Data Analysis
Profit & Loss Account
In crore ₹ FY 2020 FY 2019 FY 2018 FY 2017 FY 2016
INCOME
Software Services &
Operating Revenues
129,565 121,033 95,150 90,791 85,864
Sale of Equipment &
License
1,741 2,137 2,206 1,902 0
Operating Income 131,306 123,170 97,356 92,693 85,864
EXPENDITURE
Raw Material
Consumed
18 40 85 94 39
Employee Cost 64,906 59,377 51,499 48,116 42,420
Salaries, Wages &
Bonus
59,140 54,080 47,004 43,876 38,708
Name Mar-19 Jun-19 Sep-19 Dec-19 Mar-20
Promoter & Promoter Group 72.00% 72.05% 72.05% 72.05% 72.05%
Institutions 23.60% 23.74% 23.74% 23.93% 23.74%
Central Govt./State Govt.(s)/President
of India
0.00% 0.06% 0.06% 0.06% 0.06%
Non-institutions 4.40% 4.15% 4.17% 3.95% 4.14%
Promoter & Promoter Group
72%
Institutions24%
Government0%
Non-institutions4%
Shareholding Pattern

Contributions to EPF
& Pension Funds
4,020 3,665 3,165 2,984 2,710
Wheeling &
Transmission Charges
Recoverable
1,746 1,632 1,330 1,256 1,002
Cost of Software
Development &
License Cost
1,596 1,963 1,920 1,664 1,691
General &
Administration
Expenses
25,144 23,363 12,872 12,841 12,013
Other Operating
Expenses
2,307 3,463 3,174 2,890 2,646
Total Expenditure 93,953 88,206 69,551 65,604 58,810
Operating Profit
(excluding other
income)
37,353 34,964 27,805 27,089 27,054
Other Income 8,082 7,627 5,803 4,568 3,757
Total Revenue
(including other
income)
139,388 130,797 103,159 97,261 89,621
Earnings before
Interest,
Depreciation, Tax &
Amortization
(EBITDA)
45,435 42,591 33,608 31,657 30,811
Interest 743 170 30 16 13
Profit Before Tax &
Depreciation
44,692 42,421 33,578 31,641 30,798
Depreciation 2,701 1,716 1,647 1,575 1,459
Profit Before Tax
(PBT)
41,991 40,705 31,931 30,066 29,339
Total Tax Expenses 8,731 10,640 6,690 6,413 6,264
Profit After Tax
(PAT)
33,260 30,065 25,241 23,653 23,075
No of Shares 375,23,84,706 378,97,49,350 192,45,92,806 197,04,27,941 197,04,27,941
Weighted average
number of equity
shares
375,23,84,706 378,97,49,350 384,91,85,612 394,08,55,882 394,08,55,882
EPS (in ₹) 88.64 79.34 65.57 60.02 58.56
Share Price (end of
Year)
1,823.05 1,956.12 1,372.97 1,127.59 1,124.61
Source: TCS Annual & Quarterly Reports

Revenue, EBITDA, PAT (in crore ₹) and EBITDA Margin Trend (in %)
EPS Trend (in ₹)
139388130797
10315997261
89621
45435 4259133608 31657 3081133260 30065
25241 23653 23075
32.6 32.56 32.58 32.55
34.38
20
22
24
26
28
30
32
34
36
38
40
0
20000
40000
60000
80000
100000
120000
140000
160000
FY 2020 FY 2019 FY 2018 FY 2017 FY 2016
Total Revenue EBITDA PAT EBITDA Margin Trend
88.64
79.34
65.5760.02 58.56
0
10
20
30
40
50
60
70
80
90
100
FY 2020 FY 2019 FY 2018 FY 2017 FY 2016
EPS (in Rs.)
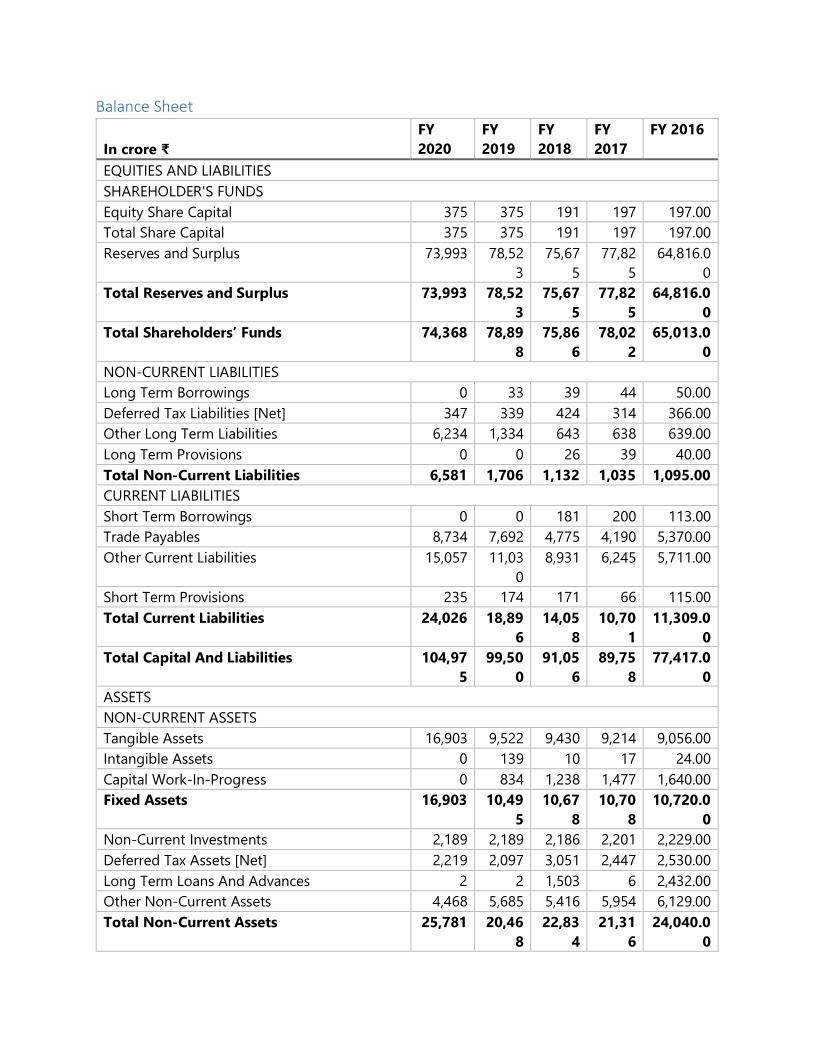
Balance Sheet
In crore ₹
FY
2020
FY
2019
FY
2018
FY
2017
FY 2016
EQUITIES AND LIABILITIES
SHAREHOLDER'S FUNDS
Equity Share Capital 375 375 191 197 197.00
Total Share Capital 375 375 191 197 197.00
Reserves and Surplus 73,993 78,52
3
75,67
5
77,82
5
64,816.0
0
Total Reserves and Surplus 73,993 78,52
3
75,67
5
77,82
5
64,816.0
0
Total Shareholders’ Funds 74,368 78,89
8
75,86
6
78,02
2
65,013.0
0
NON-CURRENT LIABILITIES
Long Term Borrowings 0 33 39 44 50.00
Deferred Tax Liabilities [Net] 347 339 424 314 366.00
Other Long Term Liabilities 6,234 1,334 643 638 639.00
Long Term Provisions 0 0 26 39 40.00
Total Non-Current Liabilities 6,581 1,706 1,132 1,035 1,095.00
CURRENT LIABILITIES
Short Term Borrowings 0 0 181 200 113.00
Trade Payables 8,734 7,692 4,775 4,190 5,370.00
Other Current Liabilities 15,057 11,03
0
8,931 6,245 5,711.00
Short Term Provisions 235 174 171 66 115.00
Total Current Liabilities 24,026 18,89
6
14,05
8
10,70
1
11,309.0
0
Total Capital And Liabilities 104,97
5
99,50
0
91,05
6
89,75
8
77,417.0
0
ASSETS
NON-CURRENT ASSETS
Tangible Assets 16,903 9,522 9,430 9,214 9,056.00
Intangible Assets 0 139 10 17 24.00
Capital Work-In-Progress 0 834 1,238 1,477 1,640.00
Fixed Assets 16,903 10,49
5
10,67
8
10,70
8
10,720.0
0
Non-Current Investments 2,189 2,189 2,186 2,201 2,229.00
Deferred Tax Assets [Net] 2,219 2,097 3,051 2,447 2,530.00
Long Term Loans And Advances 2 2 1,503 6 2,432.00
Other Non-Current Assets 4,468 5,685 5,416 5,954 6,129.00
Total Non-Current Assets 25,781 20,46
8
22,83
4
21,31
6
24,040.0
0

CURRENT ASSETS
Current Investments 25,686 28,28
0
35,07
3
40,72
9
21,930.0
0
Inventories 5 10 25 21 9.00
Trade Receivables 28,660 24,02
9
18,88
2
16,58
2
19,058.0
0
Cash And Cash Equivalents 4,824 8,900 3,487 1,316 4,806.00
Short Term Loans And Advances 7,270 7,018 2,793 2,704 2,523.00
Other Current Assets 12,749 10,79
5
7,962 7,090 5,051.00
Total Current Assets 79,194 79,03
2
68,22
2
68,44
2
53,377.0
0
Total Assets 104,97
5
99,50
0
91,05
6
89,75
8
77,417.0
0
OTHER ADDITIONAL INFORMATION
CONTINGENT LIABILITIES, COMMITMENTS
Contingent Liabilities 0 4,721 13,94
9
16,25
9
19,695.4
2
CIF VALUE OF IMPORTS
Raw Materials 0 0 0 0 27.66
Stores, Spares And Loose Tools 0 0 0 0 0.31
Trade/Other Goods 0 0 768 561 0.00
Capital Goods 0 0 0 0 474.13
EXPENDITURE IN FOREIGN EXCHANGE
Expenditure In Foreign Currency 0 0 33,01
4
31,55
3
29,554.5
3
REMITTANCES IN FOREIGN CURRENCIES FOR DIVIDENDS
Dividend Remittance In Foreign Currency - - - - 1,366.16
EARNINGS IN FOREIGN EXCHANGE
FOB Value Of Goods - - - - 81,193.8
5
Other Earnings - - 92,25
8
86,37
0
690.88
BONUS DETAILS
Bonus Equity Share Capital - 343 151 156 155.90
NON-CURRENT INVESTMENTS
Non-Current Investments Quoted Market
Value
- - - - -
Non-Current Investments Unquoted Book
Value
- 2,189 2,186 2,201 2,228.28
CURRENT INVESTMENTS

Ratio Analysis
FY
2020
FY
2019
FY
2018
FY
2017
FY
2016
Unit
Ratios - Financial Performance
Employee Cost / Total Revenue 46.56 45.40 49.92 49.47 47.33 %
Raw Material Consumed / Total
Revenue
0.01 0.03 0.08 0.10 0.04 %
Cost of Software Development &
License Cost / Total Revenue
1.15 1.50 1.86 1.71 1.89 %
General & Administration
Expenses / Total Revenue
18.04 17.86 12.48 13.20 13.40 %
Other Operating Cost / Total
Revenue
1.66 2.65 3.08 2.97 2.95 %
Total Cost / Total Revenue 67.40 67.44 67.42 67.45 65.62 %
EBITDA / Total Revenue 32.60 32.56 32.58 32.55 34.38 %
PBT / Total Revenue 30.13 31.12 30.95 30.91 32.74 %
PAT / Total Revenue 23.86 22.99 24.47 24.32 25.75 %
Ratios - Growth
Total Revenue 6.57 26.79 6.06 8.52 14.83 %
EBITDA 6.68 26.73 6.16 2.75 20.85 %
PAT 10.63 19.11 6.71 2.50 19.83 %
Ratios - Per Share
EPS - adjusted for Bonus 88.64 79.34 65.57 60.02 58.56 ₹
P/E Ratio (end of year) 20.57 24.65 20.94 18.79 19.20 Times
DPS 73.00 30.00 50.00 47.00 43.50 ₹
DPS - adjusted for Bonus 73.00 30.00 25.00 23.50 21.75 ₹
Source: TCS Annual & Quarterly Reports
Current Investments Quoted Market Value - 28,21
8
25,97
2
21,99
9
20,253.6
5
Current Investments Unquoted Book Value - 2,252 9,101 18,73
0
1,675.44

Industry Prospects and Critical Success Factor TCS’s main business is providing services to IT various companies of industries like banking,
manufacturing, retail etc. The following table gives a trend of previous years:
Vertical (%) FY 2020 FY 2019 YoY CC
Growth
Banking, Financial Services and Insurance 30.5 31.1 5.2
Retail and CPG 15.2 15.4 5.5
Manufacturing 7 6.9 9.8
Life Sciences & Healthcare 9.9 9.9 7.3
Technology & Services 8.3 7.5 16.8
Regional Markets & Others 8.6 8.8 5
Others 20.5 20.4 7.5
Source: TCS annual & quarterly reports
Clearly, the company’s business depends on various business’ performance. The other
businesses prosper, TCS will get new clients and it will prosper as well.
- Data not available
Source: TCS annual & quarterly reports
From the table above it may be observed that clients $100M+ up by 5; $50M+ up by 6; $20M+
up by 25; $10M+ up by 20 & $5M+ up by 33 from FY 2019 to FY 2020. More high valued clients
help to boost revenue of the company.
Economic Variables factors affecting the company Global Economy & Effect of COVID-19
Geography (%) FY 2020 FY 2019 YoY CC Growth
Americas
North America 50.4 51.0 4.3
Latin America 1.9 2.0 5.8
Europe
UK 15.9 15.6 10.4
Continental Europe 14.7 14.1 14.6
Clients Contribution FY 2020 FY 2019 FY
2018
FY 2017 FY 2016
US$ 1m+ Clients 1072 1008 - - -
US$ 5m+ Clients 565 532 - - -
US$ 10m+ Clients 391 371 - - -
US$ 20m+ Clients 240 215 - - -
US$ 50m+ Clients 105 99 97 84 73
US$ 100m+ Clients 49 44 38 35 37

India 5.7 5.7 6.8
Asia Pacific 9.3 9.5 6.2
MEA 2.1 2.1 6.5
Total 100 100 7.1
Source: TCS annual & quarterly reports
TCS primarily gets revenue from Americas and Europe and thus the revenue is dependent on the
performance of the businesses in these regions. Due to recent COVID-19 pandemic, the GDP
growth will be -5.9% and -7.1% in the United States and Europe respectively. This negative
growth is much lower than the expected growth. This will hamper the revenue growth of the
company. However, the economy is expected to recover in 2021 with expected GDP growth of
4.7% and 4.8% of the United States and Europe respectively.
The BFSI sector has been severely impacted given their secure business model in nature, and
thus it is very hard to switch to 100% remote model.
Life Sciences and Communications are relatively the lesser impacted. But there are also pockets
of weakness. For example, in Life Sciences, the cancellation of elective surgery is having quite a
lot of impact on many sub-segments like medical devices and even certain specialty hospitals
and facilities like that. However, they are the most resilient and likely to remain the most in the
near-term in this current crisis.
Impact on communications and media is a mixed bag. While there are strong demand drivers
with this whole shift to a digital operating model and which will be a long-term shift and will
continue to benefit all forms of capacity providers. But, on the media side, there is significant
impact. Cancellation of large sporting events, Olympics and other sporting events, is having
significant subscription as well as advertising revenue impact. Closure of amusement parks and
other such facilities is also having a lot of impact. Closure of studios and the lack of new content
will have downstream impact. So, Communications and Media is a more mixed one.
Given that travel, transportation and hospitality sub-vertical has been severely impacted, the
resulting impact on retail will also be severe.
Manufacturing industry is also impacted severely due to closure of manufacturing plant and in
most cases they cannot be done in remote.
The impact in those verticals will also impact the revenue of the company.

New Customers
This section can be divided into 2 subsections – new clients and organizations using software
built by TCS.
New Clients
As shown in a previous table TCS has added 64 new clients to its portfolio. TCS has also seen
an all-time high order book of $8.9 billion in Q4. This will partially help compensate the
revenue loss due to the COVID-19.
At the same time, TCS continues to add new clients in FY 2021, for example Israel’s first fully
digital bank and leading Amway’s IT infrastructure transformation.
New Software
New software like WaferWise™ for semiconductor industry will help boost the company’s
revenue.
At the same time, already published software continue to be adopted by various
organizations around the world, for example cognitive automation software Ignio™ has seen
11 new wins and 13 go live, financial software BaNCS™ has seen 9 new wins, the Quartz
Blockchain Solution had 3 new wins. In the Algo retailing space, the company had 1 go live
each for Optumer™ and OmniStore™. In Life Sciences, Advanced Drug Development suite
had 3 go lives. Lastly, TCSHOBS™, SaaS platform for communication service providers had 2
new wins and 1 go live.
Tax
Indian statutory tax rate for TCS is 34.94%. The tax rate is expected to stay same for the coming
years.
FY 2020 FY 2019
Profit before taxes (PBT) 41,991 40,705
Indian statutory tax rate 34.94% 34.94%
Expected income tax expense 14,673 14,224
Tax effect of adjustments to reconcile expected income tax
expense to reported income tax expense
Tax holidays (4,856) (4,735)
Income exempt from tax (14) (21)
Undistributed earnings in branches (15) 299
Tax on income at different rates (300) (403)
Tax pertaining to prior years (877) 1,271
Other (net) 120 5
Total income tax expense 8,731 10,640
Total income tax expense / PBT (%) 20.79% 26.14%

Source: TCS Annual Report
Assumptions We assume that the economy will recover after Q2 and will have a positive GDP growth
in the United States and Europe.
The company has no expansion plan as of 2020 Q4, so low fixed asset growth rate is
assumed.
Employee cost is expected to go down in the coming years as an effect of various
measures taken by the company.
Rest of the assumptions have been stated in the following table.
Projected Income Statement FY 2020 FY 2021E FY
2022E
FY
2023E
INCOME
Total Revenue 139,388 144,964 156,561 172,217
EXPENDITURE
Raw Material Consumed 18 14 16 17
Employee Cost 64,906 66,683 70,452 75,775
Cost of Software Development & License Cost 1,596 1,740 1,566 1,722
General & Administration Expenses 25,144 26,093 28,181 30,999
Other Operating Expenses 2,307 2,464 2,662 2,928
Total Expenditure 93,953 96,995 102,876 111,441
Earnings before Interest, Depreciation, Tax
& Amortization (EBITDA) 45,435 47,968 53,685 60,775
Interest 743 1,033 1,343 1,611
Profit Before Tax & Depreciation 44,692 46,935 52,342 59,164
Depreciation 2,701 3,046 3,229 3,422
Profit Before Tax (PBT) 41,991 43,890 49,113 55,741
Total Tax Expenses 8,731 9,217 10,314 11,706
Profit After Tax (PAT) 33,260 34,673 38,799 44,036
EPS (in Rs.) 88.64 92.41 103.41 117.37
ASSUMPTIONS
Total Revenue Growth (%) 6.57 4 8 10
Raw Material Consumed / Total Revenue (%) 0.01 0.01 0.01 0.01
Employee Cost / Total Revenue (%) 46.56 46.00 45.00 44.00
Cost of Software Development & License Cost
/ Total Revenue (%) 1.15 1.20 1.00 1.00
General & Administration Expenses / Total
Revenue (%) 18.04 18.00 18.00 18.00
Other Operating Expenses / Total Revenue (%) 1.66 1.70 1.70 1.70
Fixed Asset Growth Rate (%) 61.06 6.00 6.00 6.00

Total Fixed Asset 16,903 17,917 18,992 20,132
Depreciation / Total Fixed Asset (%) 15.98 17.00 17.00 17.00
Effective Tax Rate (%) 20.79 21.00 21.00 21.00
Liabilities Growth Rate (%) 49.00 35.00 30.00 20.00
Total Liabilities 30607 41319.45 53715.29 64458.34
Interest / Total Liabilities (%) 2.43 2.50 2.50 2.50
Target Price Assuming total no. of equities of shares to be constant in coming 3 years, i.e., around 375.2
crores:
Projected EPS can be calculated as:
Projected EPS = Profit After Tax / Total no. of equities of shares.
So, Target Price = Projected EPS * PE Ratio
FY 2020 FY 2021E FY 2022E FY 2023E
Projected EPS 88.64 92.41 103.41 117.37
PE Ratio 20.57 20.25 20.00 20.00
Target Price 1823.05 1871.33 2068.19 2347.32
Growth (%) 2.65 10.52 13.50
Valuation Market Cap
(Cr. ₹) 713,253.28 P/E 21.46 Book Value (₹) 198.19
Dividend (%) 7300 Market Lot 1 Industry P/E 18.55
EPS (TTM) 88.64 P/C 19.85 Price/Book 9.59
Dividend
Yield.(%) 3.84
Face Value
(RS) 1
Deliverables
(%) 35.31
As of May 14, 2020
FY 2020 FY 2021E FY 2022E FY 2023E
P/E Ratio 88.64 92.41 103.41 117.37
Capitalization (in crore ₹) 678,612 696,583 769,865 873,766
Capitalization / Revenue 4.87 4.81 4.92 5.07
EBITDA / Revenue (%) 32.60 33.09 34.29 35.29
The profit in near term is low, however in long-term if one holds the company’s share, she can
make a significant amount of profit. Thus, we rate this company’s share as HOLD.