Embed Size (px)
DESCRIPTION
Fundamental analysis of stock mini project
Citation preview
RESEARCH
METHODOLOGY
1
OBJECTIVE OF THE STUDY:
Primary :
To do fundamental analysis and calculate intrinsic value of Public Sector
Enterprises which are represented in NIFTY 50. Here PSEs is considered to
be that companies where Government of India is having more than 50% stake
and no other government is taken into consideration.
Secondary :
1. Analyzing historical performance.
2. Estimating growth prospect of various companies.
3. Understanding Discounted Cash Flow model and its usage.
4. To learn about linkages between share values, earnings, and expected
return on capital.
SCOPE:
The analysis is based on main activities i.e. operating activities of the company
and other activities are ignored. Assumptions are based on recent annual reports, past
performance, current trends in that sector and statistics of RBI. We have considered only
PSEs that are represented in NIFTY 50 and our assumptions are limited to those
companies only and not all PSEs or any other companies.
RESEARCH DESIGN:
Research design selected for this project is descriptive.
2
DATA COLLECTION METHOD:
Data for our objective was collected through companies’ website i.e. secondary
data and various other websites to know the current scenario.
TARGET:
Public Sector Enterprises of India representing in NIFTY 50. Here PSEs is those
companies where Government of India is having more than 50% stake and not any other
government.
SAMPLING TECHNIQUE:
Convenience sampling.
SAMPLE SIZE:
6 companies (basically there are 7 companies but we have ignored PowerGrid
from our estimation because just two years have passed for the company going public so
it is difficult to estimate and make assumptions based on it).
BENEFICIARY:
1. Investors in stock market.
2. Students pursuing professional courses like MBA, CFA, CFM and
likewise.
3. Financial Institutions and Mutual Funds.
4. Ministry of Finance for disinvestment policy.
3

LIMITATIONS:
1. Intrinsic values are based on operating income only and no other inflows
are considered.
2. Project is restricted to PSEs representing NIFTY 50 and not all PSEs.
3. No company visits are possible so assumptions are based on secondary
data, current scenario and statistics of RBI.
4
Introduction to
INDIAN EQUITY
MARKET
5

The Indian Equity Market has mainly two indices i.e. NIFTY and SENSEX. The
equity market of India is one of the oldest in the Asia region. India had an active stock
market for about 150 years that played a significant role in developing risk markets as
also promoting enterprise and supporting the growth of various industries. India has been
one of the best performers in the world economy in recent years, but rapidly rising
inflation and the complexities of running the world’s biggest democracy are proving
challenging.
STRUCTURE OF EQUITY MARKET:
The Indian market of equities is transacted on the basis of two major stock
exchanges, National Stock Exchange of India Ltd. (NSE) and The Bombay Stock
Exchange (BSE). In terms of market capitalization, there are over 2500 companies in the
BSE chart list with the Reliance Industries Limited at the top. The SENSEX at present is
ranging between the level of 15000-17000 providing a profitable business to all those
who had been investing in the Indian Equity Market. There are about 23 stock exchanges
in India which regulates the market trends of different stocks.
Generally the bigger companies are listed with the NSE and the BSE, but there is
Over the Counter Exchange of India (OTCEI), which lists the medium and small sized
companies. SEBI is the body who governs and supervises the functioning of the stock
markets in India.
Stock markets became intensely technology and process driven, giving little
scope for manual intervention that has been the source of market abuse in the past.
Electronic trading, digital certification, straight through processing, electronic contract
notes, online broking have emerged as major trends in technology. Risk management
became robust reducing the recurrence of payment defaults. Product expansion took
place in a speedy manner. Stock exchange reforms brought in professional management
separating conflicts of interest between brokers as owners of the exchanges and
traders/dealers.
6

GROWTH OF INDIAN EQUITY MARKET:
The last decade has been exceptionally good for the stock markets in India. In the
back of wide ranging reforms in regulation and market practice as also the growing
participation of foreign institutional investment, stock markets in India have showed
phenomenal growth in the early 1990s. The stock market capitalization in mid-2007 is
nearly the same size as that of the gross domestic product as compared to about 25
percent of the latter in the early 2000s. Investor base continued to grow from domestic
and international markets. The value of share trading witnessed a sharp jump too. Foreign
Institutional Investment in Indian stock markets showed continuous rise reaching about
USD10 billion in each of these years between FY04 to FY06.
Indian equity markets now offer, in addition to trading in equities, opportunities
in trading of derivatives in futures and options in index and stocks. ETFs are showing
gradual growth. Within five years of introduction of derivatives, Indian stock markets
now are ranked first in stock futures and fourth in index futures. Indian stock markets are
transaction intensive and thus rank among the top five markets in this regard.
7
INTRODUCTION
OF COMPANIES
8
The main challenge before any country is to move ahead with rapid expansion as
well as development. This challenge seems to be an opportunity for any government and
they play an important role in any economy to bring its country to the top of the world.
The basis for selecting companies for our project i.e. equity valuation is those
Public Sector Enterprises (PSEs) representing in NIFTY 50. There are total 246 PSEs
(mentioned in Appendix II) which were owned or having majority stake by central
government and out of that 7 companies are in NIFTY 50. Those companies are:
Bharat Heavy Electricals Ltd. (BHEL)
Bharat Petroleum Corporation Ltd. (BPCL)
Gas Authority of India Ltd. (GAIL)
National Thermal Power Corporation Ltd. (NTPC)
Oil and Natural Gas Corporation Ltd. (ONGC)
Power Grid Corporation of India Ltd. (PowerGrid)
Steel Authority of India Ltd. (SAIL)
We have valued six companies out of seven mentioned above. In all that
PowerGrid is not being valued because just two years have passed going public. So we
are unable to predict its future growth prospect based on their two years data as well as
we were unable to assume its revenue growth rate, depreciation, change in working
capital, change in capital expenditure and weighted average cost of capital. This is the
main reason why we go with remaining six companies to go ahead with our project and
all six companies’ snapshots and brief history is mentioned in next page.
9
1. BHEL
BHEL is the largest engineering and manufacturing enterprise in India in the
energy related/infrastructure sector. BHEL was established more than four decades ago
ushering in the indigenous heavy electrical equipment in India. BHEL has built over the
years, a robust domestic market position by becoming the largest supplier of power plant
equipment in India, and by developing strong market presence in select segments of the
Industrial sector and the Railways. Currently, 80% of the Nuclear power generated in the
country is through BHEL sets. For the third consecutive year, BHEL’s performance was
recognized by the prestigious publication “Forbes Asia”, which featured BHEL in its
fourth annual 'Fabulous 50' list of the best of Asia-Pacific's publicly-traded companies.
The company has been earning profits continuously since 1971-72 and paying dividends
since 1976-77.
VISION:
A world-class engineering enterprise committed to enhancing stakeholder value.
MISSION:
To be an Indian multinational engineering enterprise providing total business
solutions through quality products, systems and services in the fields of energy, industry,
transportation, infrastructure and other potential areas.
BHEL manufactures over 180 products under 30 major product groups and caters
to core sectors of the Indian Economy viz., Power Generation & Transmission, Industry,
Transportation, Telecommunication, Renewable Energy, etc. The wide network of
BHEL's 14 manufacturing divisions, four Power Sector regional centers, over 100 project
sites, eight service centers and 18 regional offices, enables the Company to promptly
serve its customers and provide them with suitable products, systems and services --
efficiently and at competitive prices. The high level of quality & reliability of its products
is due to the emphasis on design, engineering and manufacturing to international
10
standards by acquiring and adapting some of the best technologies from leading
companies in the world, together with technologies developed in its own R&D centers.
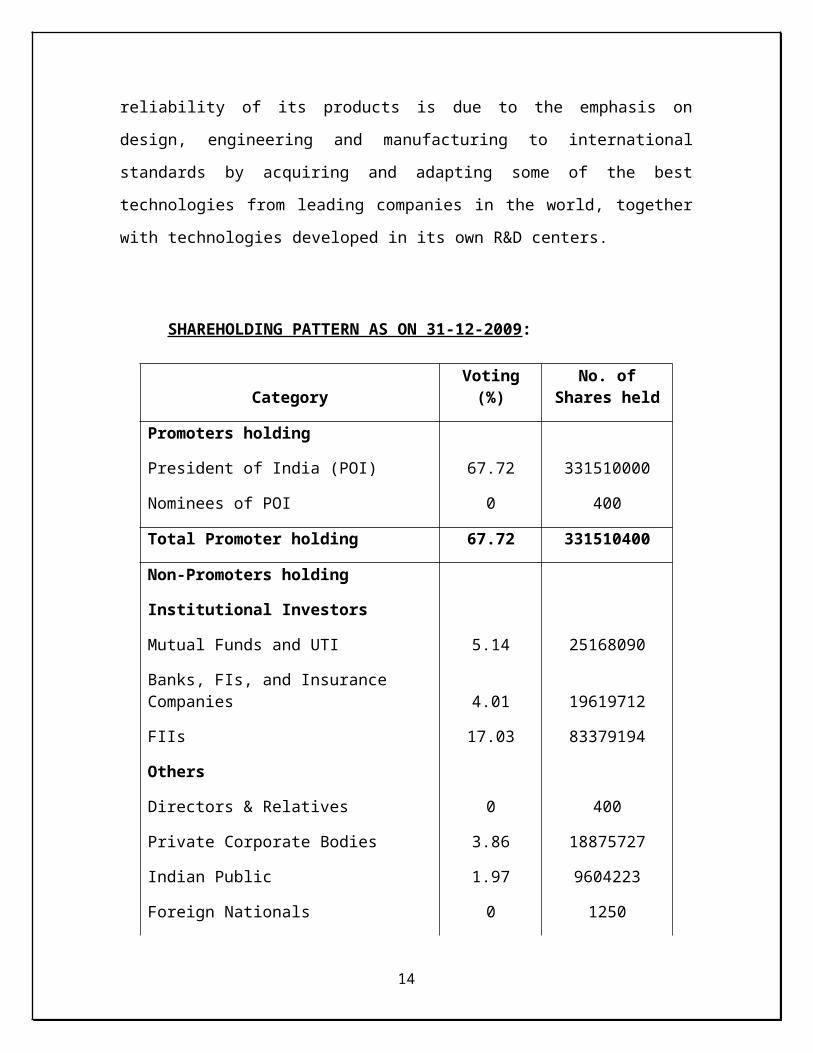
SHAREHOLDING PATTERN AS ON 31-12-2009:
Category Voting (%)No. of Shares
held
Promoters holding
President of India (POI) 67.72 331510000
Nominees of POI 0 400
Total Promoter holding 67.72 331510400
Non-Promoters holding
Institutional Investors
Mutual Funds and UTI 5.14 25168090
Banks, FIs, and Insurance Companies 4.01 19619712
FIIs 17.03 83379194
Others
Directors & Relatives 0 400
Private Corporate Bodies 3.86 18875727
Indian Public 1.97 9604223
Foreign Nationals 0 1250
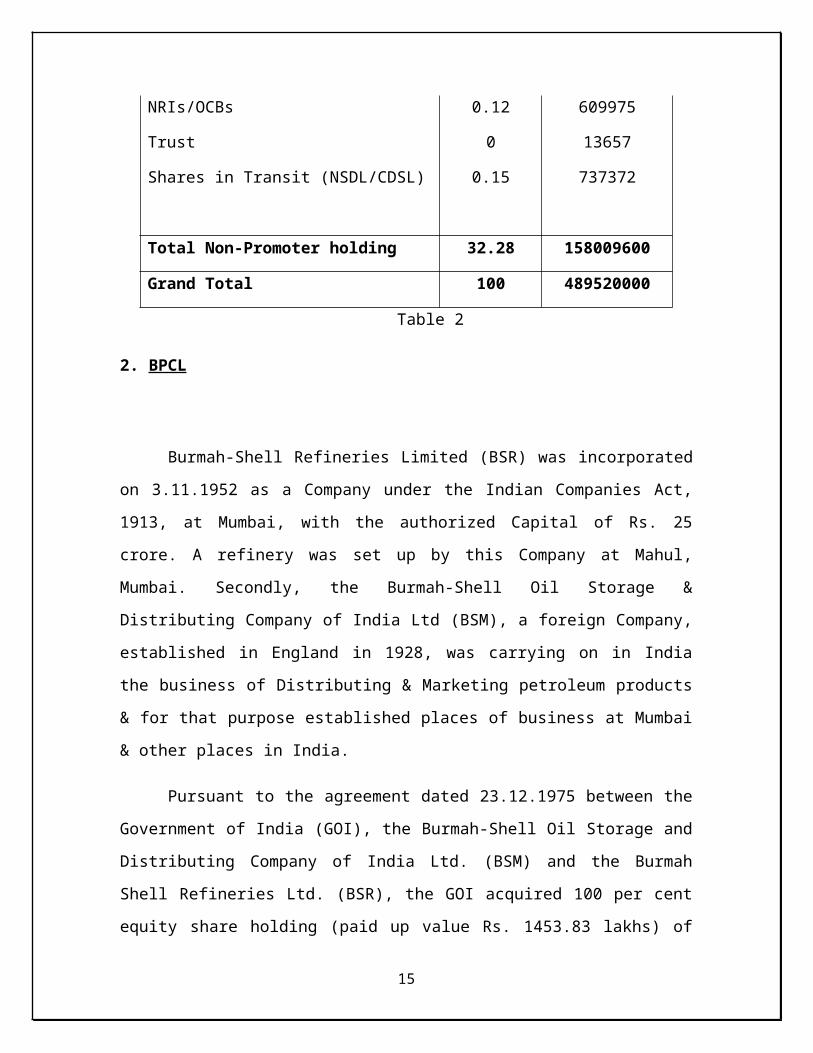
NRIs/OCBs 0.12 609975
Trust 0 13657
Shares in Transit (NSDL/CDSL) 0.15 737372
Total Non-Promoter holding 32.28 158009600
Grand Total 100 489520000
Table 2
11

2. BPCL
Burmah-Shell Refineries Limited (BSR) was incorporated on 3.11.1952 as a
Company under the Indian Companies Act, 1913, at Mumbai, with the authorized Capital
of Rs. 25 crore. A refinery was set up by this Company at Mahul, Mumbai. Secondly, the
Burmah-Shell Oil Storage & Distributing Company of India Ltd (BSM), a foreign
Company, established in England in 1928, was carrying on in India the business of
Distributing & Marketing petroleum products & for that purpose established places of
business at Mumbai & other places in India.
Pursuant to the agreement dated 23.12.1975 between the Government of India
(GOI), the Burmah-Shell Oil Storage and Distributing Company of India Ltd. (BSM) and
the Burmah Shell Refineries Ltd. (BSR), the GOI acquired 100 per cent equity share
holding (paid up value Rs. 1453.83 lakhs) of BSR on 24.01.1976, for a consideration of
Rs. 925 lakh. Simultaneously, through The Burmah Shell acquisition of Undertakings in
India Act, 1976, the GOI also acquired the right, title and interest and liabilities of BSM
in relation to its undertakings in India for a consideration of Rs. 2775 lakhs and by
notification dated 24.1.76, vested the same in BSR without any specific consideration
payable by BSR. The name of BSR was changed to Bharat Refineries Limited (BRL) and
subsequently to Bharat Petroleum Corporation Limited.
VISION:
Setting our sights on achieving excellence, we benchmark ourselves against the
highest global standards, forging ahead with enthusiasm and commitment.
MISSION:
Our focus on sustainable development remains unabated, with social
responsibility, healthy, safety, security and environmental care as our corporate goals.
12
We have redoubled our efforts to seek fresh avenues in our quest for renewable energies
creating a brighter future for generations to come.
SHAREHOLDING PATTERN AS ON 31-12-2009:
Category Voting (%)
Government of India 54.93
LIC 10.9
BPCL Trust for Investment in shares 9.33
Banks/FIs/Mutual Funds 8.81
FIIs 8.39
Private Corporate Bodies 2.83
Government of Kerala 0.86
UTI 0.8
NRIs/Overseas Corporate Bodies 0.08
Others 3.07
Grand Total 100
Table 3
13
3. GAIL
GAIL (India) Ltd. (erstwhile Gas Authority of India Ltd), India's principal gas
transmission and marketing company, was set up by the Government of India in August
1984 to create gas sector infrastructure for sustained development of the natural gas
sector in the country. The 2800-km Hazira-Vijaipur-Jagdishpur (HVJ) pipeline became
operational in 1991. During 1991-93, three LPG plants were constructed and some
regional pipelines acquired, enabling GAIL to begin its regional gas distribution in
various parts of India. GAIL began its city gas distribution in Delhi in 1997 by setting up
nine CNG stations, catering to the city's vast public transport fleet. In 1999, GAIL set up
northern India's only petrochemical plant at Patan.
GAIL became the first Infrastructure Provider Category II Licensee and signed
the country's first Service Level Agreement for leasing bandwidth in the Delhi-Vijaipur
sector in 2001, through its telecom business GAILTEL. In 2001, GAIL commissioned
world's longest and India's first Cross Country LPG Transmission Pipeline from
Jamnagar to Loni.
GAIL today has reached new milestones with its strategic diversification into
Petrochemicals, Telecom and Liquid Hydrocarbons besides gas infrastructure. The
company has also extended its presence in Power, Liquefied Natural Gas re-gasification,
City Gas Distribution and Exploration & Production through equity and joint ventures
participations.Incorporating the new-found energy into its corporate identity, Gas
Authority of India was renamed GAIL (India) Limited on November 22, 2002
VISION:
Be the leading company in natural gas and beyond, with global focus, committed
to customer care, valuation creation for all stakeholders and environment responsibility.
MISSION:
To accelerate and optimize the effective and economic use of natural gas and its
fractions to the benefit of national economy.
14
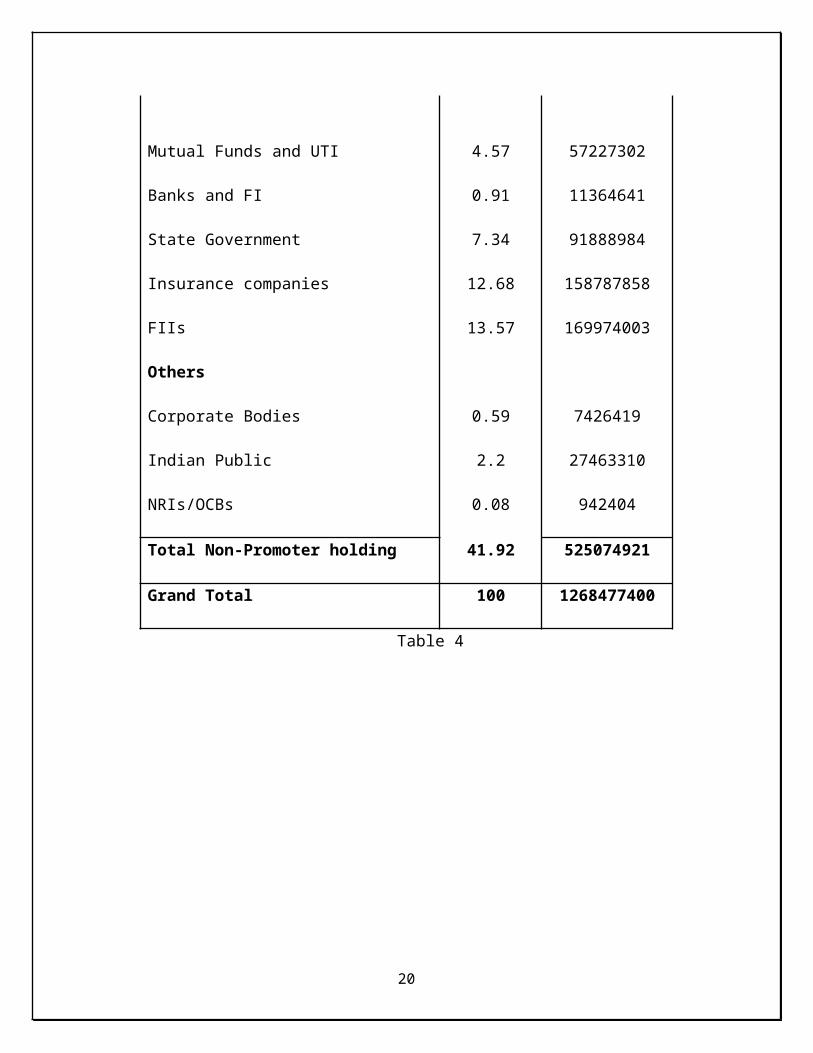
SHAREHOLDING PATTERN AS ON 31-12-2009:
Category Voting (%)
No. of Shares
held
Promoters holding
Government of India (GOI) 58.08 727405675
Total Promoter holding 58.08 727405675
Public holding
Institutional Investors
Mutual Funds and UTI 4.57 57227302
Banks and FI 0.91 11364641
State Government 7.34 91888984
Insurance companies 12.68 158787858
FIIs 13.57 169974003
Others
Corporate Bodies 0.59 7426419
Indian Public 2.2 27463310
NRIs/OCBs 0.08 942404
Total Non-Promoter holding 41.92 525074921
Grand Total 100 1268477400
Table 4
15

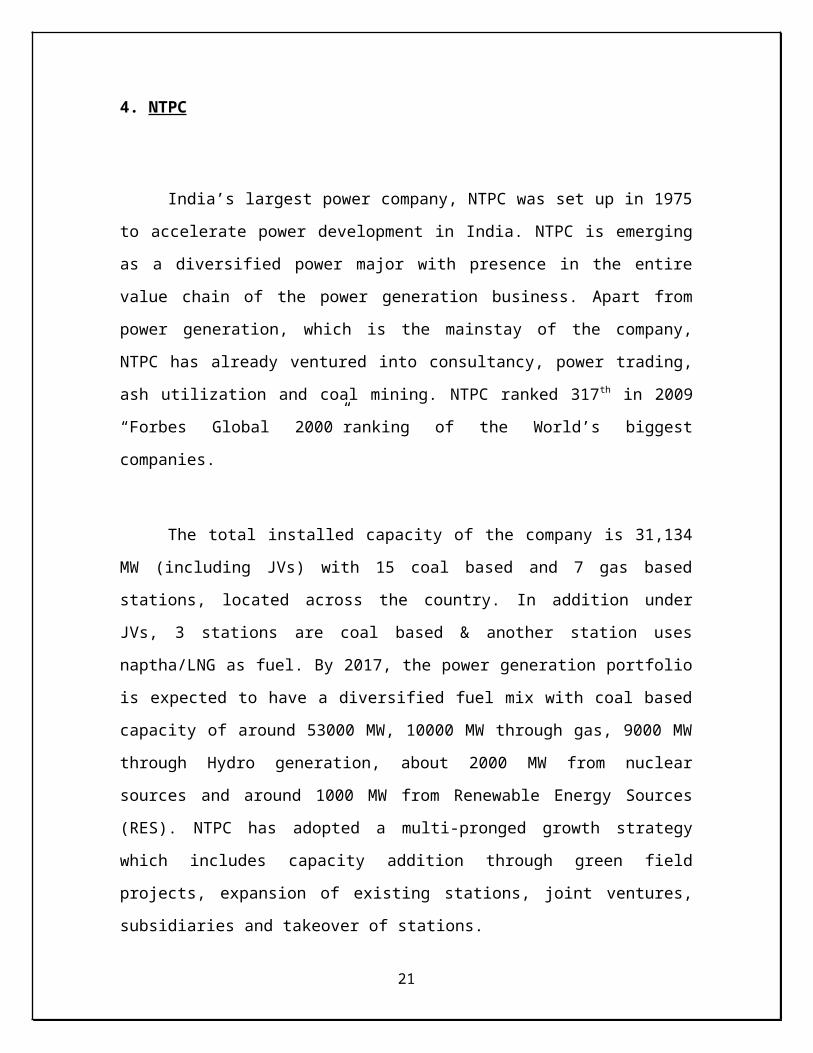
4. NTPC
India’s largest power company, NTPC was set up in 1975 to accelerate power
development in India. NTPC is emerging as a diversified power major with presence in
the entire value chain of the power generation business. Apart from power generation,
which is the mainstay of the company, NTPC has already ventured into consultancy,
power trading, ash utilization and coal mining. NTPC ranked 317 th in 2009 “Forbes
Global 2000”ranking of the World’s biggest companies.
The total installed capacity of the company is 31,134 MW (including JVs) with
15 coal based and 7 gas based stations, located across the country. In addition under JVs,
3 stations are coal based & another station uses naptha/LNG as fuel. By 2017, the power
generation portfolio is expected to have a diversified fuel mix with coal based capacity of
around 53000 MW, 10000 MW through gas, 9000 MW through Hydro generation, about
2000 MW from nuclear sources and around 1000 MW from Renewable Energy Sources
(RES). NTPC has adopted a multi-pronged growth strategy which includes capacity
addition through green field projects, expansion of existing stations, joint ventures,
subsidiaries and takeover of stations.
NTPC has been operating its plants at high efficiency levels. Although the
company has 18.79% of the total national capacity it contributes 28.60% of total power
generation due to its focus on high efficiency.
VISION:
A world-class integrated power major, powering India’s growth, with increasing
global presence.
16

MISSION:
Develop and provide reliable power, related products and services at competitive
prices, integrating multiple energy sources with innovative and eco-friendly technologies
and contribute to society.
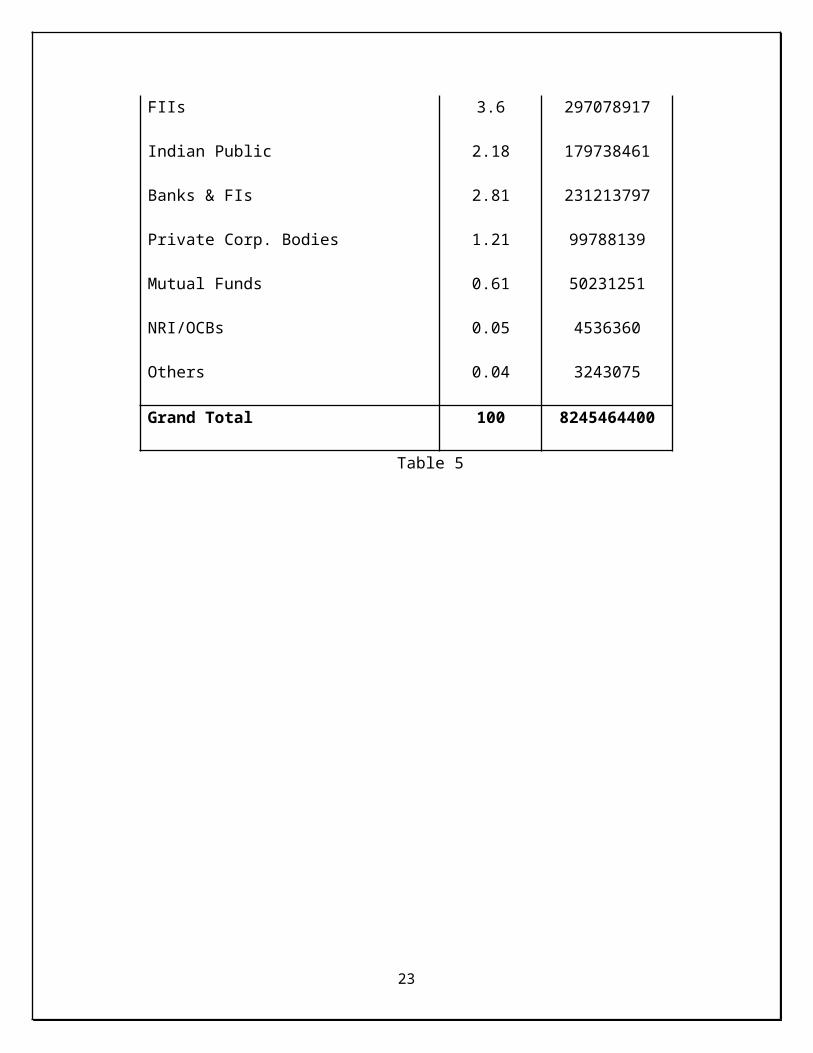
SHAREHOLDING PATTERN AS ON 31-12-2009:
Category Voting (%)
No. of Shares
held
Government of India 89.5 7379634400
FIIs 3.6 297078917
Indian Public 2.18 179738461
Banks & FIs 2.81 231213797
Private Corp. Bodies 1.21 99788139
Mutual Funds 0.61 50231251
NRI/OCBs 0.05 4536360
Others 0.04 3243075
Grand Total 100 8245464400
Table 5
17
5. ONGC
In 1955, Government of India decided to develop the oil and natural gas resources
in the various regions of the country as part of the Public Sector development. In April
1956, the Government of India adopted the Industrial Policy Resolution, which placed
mineral oil industry among the schedule 'A' industries, the future development of which
was to be the sole and exclusive responsibility of the state. Soon, after the formation of
the Oil and Natural Gas Directorate, it became apparent that it would not be possible for
the Directorate with its limited financial and administrative powers as subordinate office
of the Government, to function efficiently. So in August, 1956, the Directorate was raised
to the status of a commission with enhanced powers, although it continued to be under
the government. In October 1959, the Commission was converted into a statutory body
by an act of the Indian Parliament, which enhanced powers of the commission further.
The main functions of the Oil and Natural Gas Commission subject to the provisions of
the Act, were "to plan, promote, organize and implement programs for development of
Petroleum Resources and the production and sale of petroleum and petroleum products
produced by it, and to perform such other functions as the Central Government may,
from time to time, assign to it ". The act further outlined the activities and steps to be
taken by ONGC in fulfilling its mandate.
The liberalized economic policy, adopted by the Government of India in July
1991, sought to deregulate and de-license the core sectors (including petroleum sector)
with partial disinvestments of government equity in Public Sector Undertakings and other
measures. As a consequence thereof, ONGC was re-organized as a limited Company
under the Company's Act, 1956 in February 1994.
In the year 2002-03, after taking over MRPL from the A V Birla Group, ONGC
diversified into the downstream sector. ONGC will soon be entering into the retailing
18

business. ONGC has also entered the global field through its subsidiary, ONGC Videsh
Ltd. (OVL). ONGC has made major investments in Vietnam, Sakhalin and Sudan and
earned its first hydrocarbon revenue from its investment in Vietnam.
VISION:
To be world class Oil & Natural Gas Company integrated in energy business with
dominant Indian leadership and global presence.
MISSION:
Achieving excellence by leveraging competitive advantages in R&D and
technology with involved people. Imbibe high standards of business ethics and
organizational values. Strive for customer delight through quality products and services.
19
SHAREHOLDING PATTERN AS ON 31-12-2009:
Category Voting (%)
No. of Shares
held
President of India (POI) 74.14 1,585,740,673
Banks, FIs, and Insurance Companies 4.91 105,054,973
FIIs 5.43 116,097,133
Mutual Funds & UTI 1.72 36,656,577
NRIs 0.04 816,829
Bodies Corporate
Government Companies 10.09 215,881,124
Others 1.9 40,590,974
Employees 0.1 22,43,606
Public 1.67 35,790,641
Grand Total 100 2,138,872,530
Table 6
20
6. SAIL
Steel Authority of India Limited (SAIL) is the leading steel-making company in
India. It is a fully integrated iron and steel maker, producing both basic and special steels
for domestic construction, engineering, power, railway, automotive and defense
industries and for sale in export markets.
Ranked amongst the top ten public sector companies in India in terms of turnover,
SAIL manufactures and sells a broad range of steel products, including hot and cold
rolled sheets and coils, galvanized sheets, electrical sheets, structural, railway products,
plates, bars and rods, stainless steel and other alloy steels. SAIL produces iron and steel
at five integrated plants and three special steel plants, located principally in the eastern
and central regions of India and situated close to domestic sources of raw materials,
including the Company's iron ore, limestone and dolomite mines. The company has the
distinction of being India’s second largest producer of iron ore and of having the
country’s second largest mines network. This gives SAIL a competitive edge in terms of
captive availability of iron ore, limestone, and dolomite which are inputs for steel
making.
SAIL's wide ranges of long and flat steel products are much in demand in the
domestic as well as the international market. This vital responsibility is carried out by
SAIL's own Central Marketing Organization (CMO) that transacts business through its
network of 37 Branch Sales Offices spread across the four regions, 25
Departmental Warehouses, 42 Consignment Agents and 27 Customer Contact Offices.
CMO’s domestic marketing effort is supplemented by its ever widening network of rural
dealers who meet the demands of the smallest customers in the remotest corners of the
country. With the total number of dealers over 2000, SAIL's wide marketing spread
ensures availability of quality steel in virtually all the districts of the country.
21

VISION:
To be a respected world-class corporation and the leader in Indian steel business
in quality, productivity, profitability, and customer satisfaction.
MISSION:
We create and nurture a culture that supports flexibility, learning and is proactive
to change. We value the opportunity and responsibility to make a meaningful difference
in people’s lives.
22
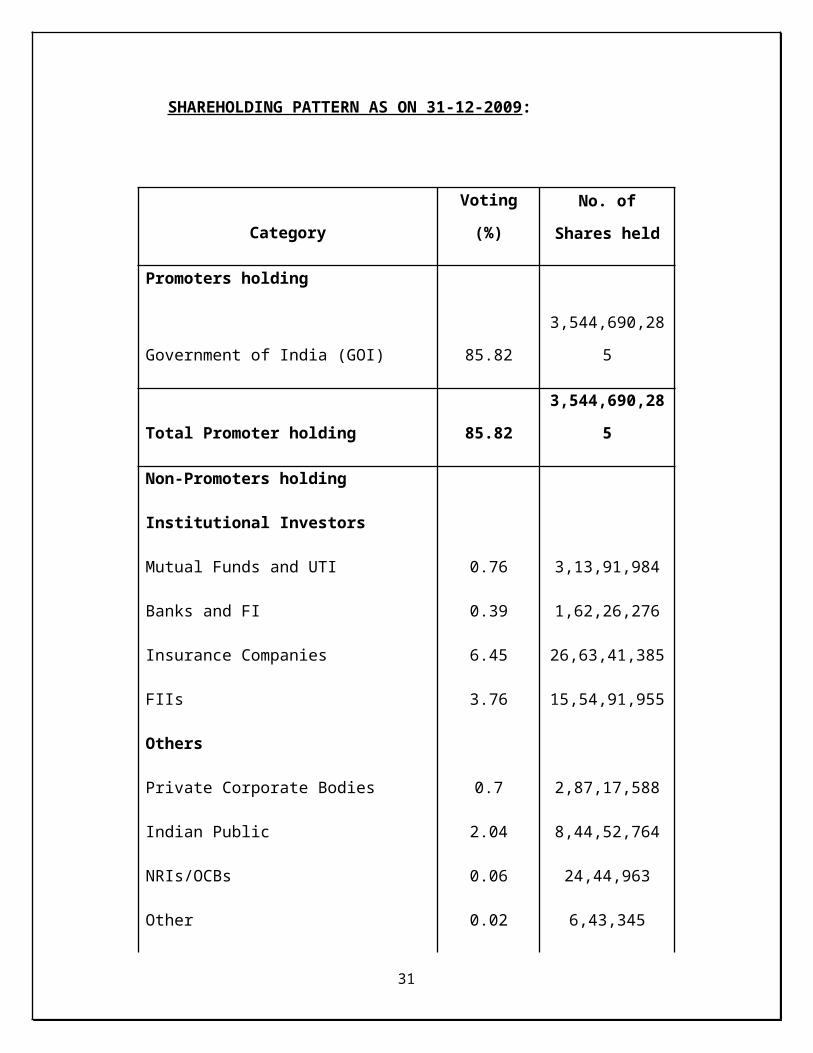
SHAREHOLDING PATTERN AS ON 31-12-2009:
Category Voting (%)
No. of Shares
held
Promoters holding
Government of India (GOI) 85.82 3,544,690,285
Total Promoter holding 85.82 3,544,690,285
Non-Promoters holding
Institutional Investors
Mutual Funds and UTI 0.76 3,13,91,984
Banks and FI 0.39 1,62,26,276
Insurance Companies 6.45 26,63,41,385
FIIs 3.76 15,54,91,955
Others
Private Corporate Bodies 0.7 2,87,17,588
Indian Public 2.04 8,44,52,764
NRIs/OCBs 0.06 24,44,963
Other 0.02 6,43,345
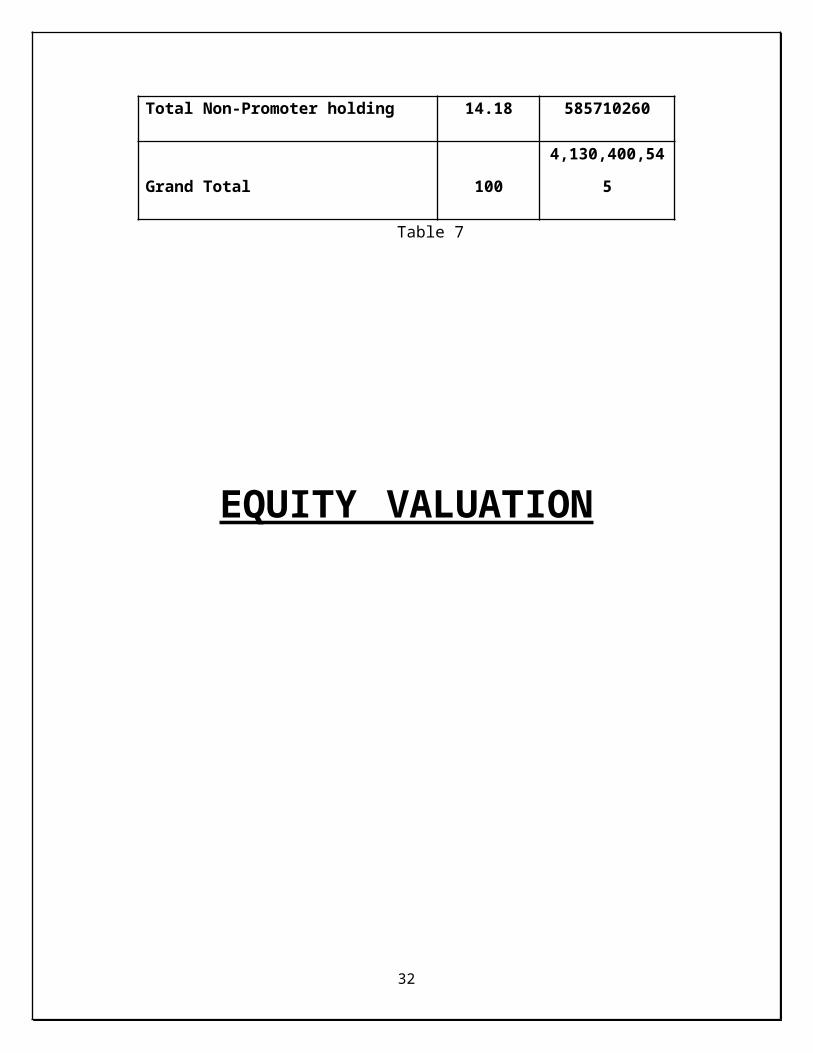
Total Non-Promoter holding 14.18 585710260
Grand Total 100 4,130,400,545
Table 7
23

EQUITY VALUATION
24
“Every asset has a value; we just don’t know what it is,” states Professor
Damodaran. Thus valuation is the first step toward intelligent investing. Valuation of a
firm or an equity as a going concern is the basis for any investment exercise.
Knowing what an asset is worth and what determines that value is a pre-requisite
for intelligent decision making - in choosing investments for a portfolio, in deciding on
the appropriate price to pay or receive in a takeover and in making investment, financing
and dividend choices when running a business. Without original value, one is set floating
in a sea of random short-term price movements and gut feelings.
It is important for the Finance Manager in particular and other manager in general
to understand the process and method of valuing equity or a firm. The valuation of equity
is dependent on the basic financial concepts of Time Value of Money, Risk and Return
and Future Cash Flow.
VALUATION
The term “valuation” implies the task of estimating the worth/value of an asset, a
security or a business. The price an investor or a firm (buyer) is willing to pay to
purchase a specific asset/security would be related to this value.
EQUITY VALUATION
An equity valuation takes several financial indicators into account; these include
both tangible and intangible assets, and provide prospective investors, creditors or
shareholders with an accurate perspective of the true value of a company at any given
time.
Equity valuations are conducted to measure the value of a company given its
current assets and position in the market. These data points are valuable for shareholders
25
and prospective investors who want to find out if the company is performing well, and
what to expect with their stocks or investments in the near future.
Valuation methods based on the equity of a company typically include a thorough
analysis of cash accounts, as well as a forecast or projection of future dividends, future
earnings (revenue) and the distribution of dividends.
FEATURES OF EQUITY VALUATION
Following are the features of Equity Valuation;
Equity Valuation is a highly specialized process.
Like other assets in finance, the value of a stock is the Present Value of its Cash
Flow’s.
The total equity of a company is the sum of both tangible assets and intangible
qualities. Tangible assets include working capital, cash, and inventory and
shareholder equity. Intangible qualities, or intangible "assets," may include brand
potential, trademarks and stock valuations.
The valuation may also take the firm's enterprise value (EV) into account; this is
calculated by combining the net debt per share with the price per share.
Performance indicators include the price/earnings ratio, dividend yield, and the
Earnings Before Interest, Depreciation and Amortization (EBIDA).
Any company under consideration for sale needs proficient, objective valuation,
whether its stock is privately owned by one individual or publicly traded on one
or more of the major exchanges or in the over the counter market.
26

Stocks are typically valued as perpetual securities as corporations potentially have
an infinite life, and thus can pay dividends forever.
NEED OF EQUITY VALUATION
There are several reasons, for which we need Equity Valuation
Initial Public Offer
Merger and Demerger
Purchase/sale of equity stake by joint venture partners
Liquidation
Acquisition and takeover
Disinvestment, etc.
THE ROLE OF EQUITY VALUATION
Valuation is useful in a wide range of tasks. The role it plays, however, is
different in different arenas. The following section lays out the relevance of valuation in
portfolio management, in acquisition analysis and in corporate finance.
PORTFOLIO MANAGEMENT
The role that valuation plays in portfolio management is determined in large part
by the investment philosophy of the investor. Valuation plays a minimal role in portfolio
management for a passive investor, (Passive investors, feel that simply investing in a
market index fund may produce potentially higher long-term results.) whereas it plays a
larger role for an active investor. (Activist investors take positions in firms that have a
27

reputation for poor management and then use their equity holdings to push for change in
the way the company is run. Their focus is not so much on what the company is worth
today but what its value would be if it were managed well. )
Among security selectors, valuation plays a central role in portfolio management
for fundamental analysts, and a peripheral role for technical analysts.
VALUATION IN ACQUISITION ANALYSIS
Valuation should play a central part of acquisition analysis. The bidding firm or
individual has to decide on a fair value for the target firm before making a bid, and the
target firm has to determine a reasonable value for itself before deciding to accept or
reject the offer.
VALUATION IN CORPORATE FINANCE
There is a role for valuation at every stage of a firm’s life cycle. For small private
businesses thinking about expanding, valuation plays a key role when they approach
venture capital and private equity investors for more capital.
VALUATION FOR LEGAL AND TAX PURPOSES
Though it may seem, most valuations, especially of private companies, are done
for legal or tax reasons. A partnership has to be valued, whenever a new partner is taken
on or an old one retires, and businesses that are jointly owned have to be valued when the
owners decide to break up or businesses have to be valued for tax purposes when the
owner dies. While the principles of valuation may not be different when valuing a
business for legal proceedings, the objective often becomes providing a valuation that the
court will accept rather than the “right” valuation.
28
BENEFITS OF EQUITY VALUATION
A thorough analysis of tangible and intangible assets allows prospective
investors, shareholders and financial managers of a company to obtain critical
performance data about the company's business operations.
When an investor attempts to determine the worth of her shares based on the
fundamentals, it helps her make informed decisions about what stocks to buy or
sell.
Valuation compares the benefits of a future investment decision with its cost.
The equity valuation method takes several types of data into account, and can be
used as part of a prediction model to determine the economic future of the
company.
The valuation also provides some indication of the level of risk involved in
investing in the company.
The determination of right value of equity is essential to maintain a long term
success of investment.
29

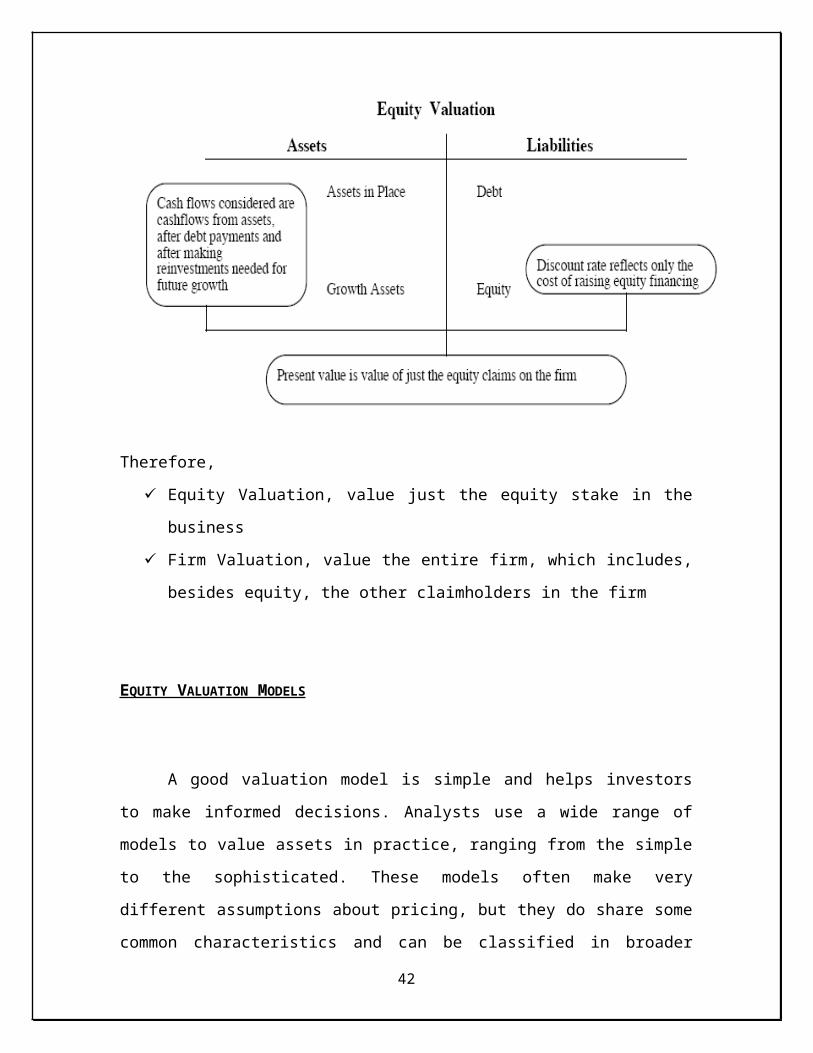
EQUITY VALUATION VERSUS FIRM VALUATION
The value of the entire business, with both assets-in-place and growth assets; this
is often termed as enterprise valuation.
The second way is to just value the equity stake in the business, and this is called equity
valuation.
30
Therefore,
Equity Valuation, value just the equity stake in the business
Firm Valuation, value the entire firm, which includes, besides equity, the other
claimholders in the firm
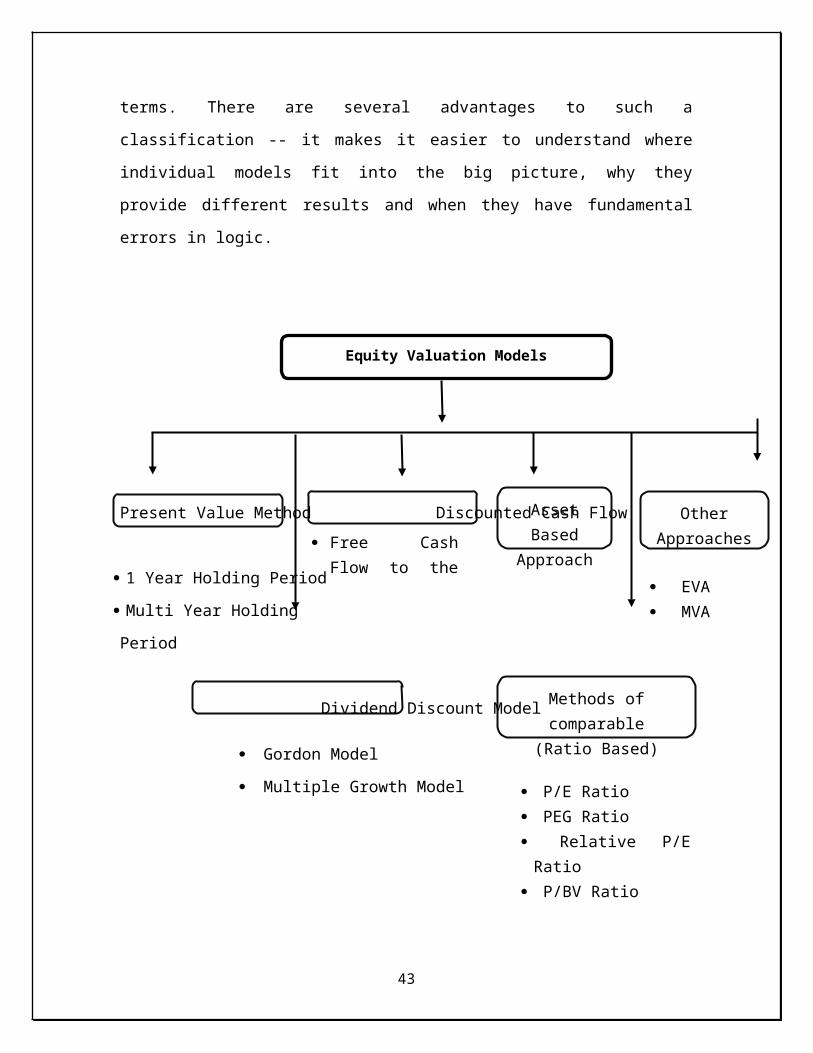
EQUITY VALUATION MODELS
A good valuation model is simple and helps investors to make informed
decisions. Analysts use a wide range of models to value assets in practice, ranging from
the simple to the sophisticated. These models often make very different assumptions
about pricing, but they do share some common characteristics and can be classified in
broader terms. There are several advantages to such a classification -- it makes it easier to
understand where individual models fit into the big picture, why they provide different
results and when they have fundamental errors in logic.
31
Free Cash Flow to the Equity
Asset Based
Approach
Methods of comparable
(Ratio Based)
Present Value Method Discounted Cash Flow
1 Year Holding Period
Multi Year Holding
Period
Dividend Discount Model
Gordon Model
Multiple Growth Model
1. PRESENT VALUE METHOD :
The valuation model used to estimate the intrinsic value of a share is the present
value model. The intrinsic value of a share is the present value of all future amounts to be
received of the ownership of that share, computed at an appropriate discount rate. The
major receipts that come from the ownership of a share are the annual dividends and the
sale proceeds of the share at the end of holding period. These are to be discounted to find
their present value using a discount rate that is the rate of return required by the investor,
taking into consideration the risk involved and the investor’s other investment
opportunities.
32
Equity Valuation Models
EVA MVA
OtherApproaches
P/E Ratio PEG Ratio Relative P/E Ratio P/BV Ratio P/Sales ratio
The investment decision of the fundamental analyst to buy or sell a share is based
on the comparison between the intrinsic value of a share and its current market price. If
the market price is lower than the intrinsic value then such a share is bought and is
perceived to be under priced. If the market price is higher than the intrinsic value then
such a share would be considered as overpriced and is sold.
Following are two methods in Present Value Method,
A. ONE YEAR HOLDING PERIOD :
It is easy to start valuation with one year holding period assumption. Here an
investor intends to purchase a share now, hold it for one year and sell it off at the end of
one year. In this case the investor would be expected to receive an amount of dividend as
well as the selling price after one year.
B. MULTIPLE YEAR HOLDING PERIOD :
An investor may hold a share for a certain number of years and sell it off at the
end of his holding period. In this case he would receive annual dividends each year and
the sale price of the share at the end of the holding period.
DRAWBACK OF THE PRESENT VALUE METHOD :
Probably the biggest drawback in the previous two models was that we had to
predict a selling price.
The buyer of the stock, when we sell it, will presumably go through a similar
procedure to value the stock – in other words the buyer will be using future
dividends to value the stock.
The selling price of the stock should thus be the value of all future dividends.
33
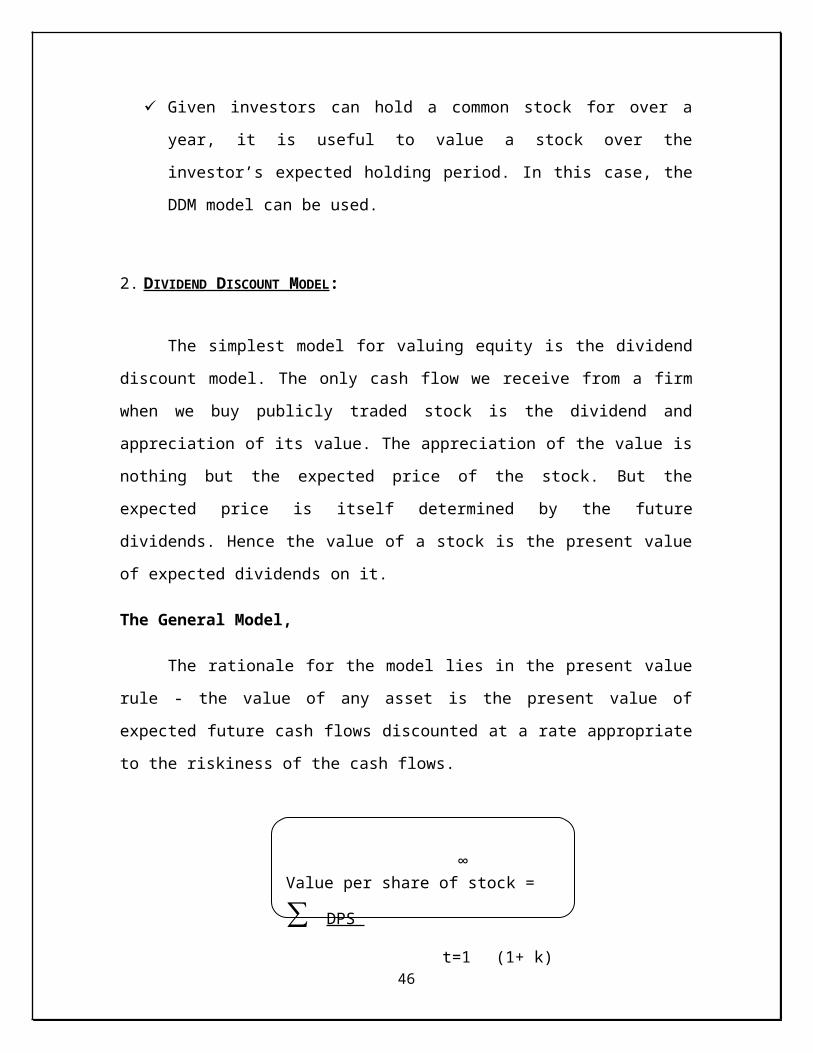
Given investors can hold a common stock for over a year, it is useful to value a
stock over the investor’s expected holding period. In this case, the DDM model
can be used.
2. DIVIDEND DISCOUNT MODEL :
The simplest model for valuing equity is the dividend discount model. The only
cash flow we receive from a firm when we buy publicly traded stock is the dividend and
appreciation of its value. The appreciation of the value is nothing but the expected price
of the stock. But the expected price is itself determined by the future dividends. Hence
the value of a stock is the present value of expected dividends on it.
The General Model,
The rationale for the model lies in the present value rule - the value of any asset is
the present value of expected future cash flows discounted at a rate appropriate to the
riskiness of the cash flows.
There are two basic inputs to the model - expected dividends and the rate of
return. To obtain the expected dividends, we make assumptions about expected future
growth rates in earnings and payout ratios .To know more about DDM model first we
have to understand growth periods i.e. High growth period, transition period and stable
growth period.
34
∞
Value per share of stock = ∑ DPS t=1
(1+ k)
A. GORDON MODEL :
Gordon Model also known as Constant Growth Model. The Gordon growth
model can be used to value a firm that is in 'steady state' with dividends growing at a rate
that can be sustained forever. The Gordon growth model is best suited for firms growing
at a rate comparable to or lower than the nominal growth in the economy and which have
well established dividend payout policies that they intend to continue into the future. The
dividend payout of the firm has to be consistent with the assumption of stability, since
stable firms generally pay substantial dividends.
According to the model, the value of the stock is given by,
Where,
35
Value of the Stock = DPS (1+g) r-g
DPS = Expected Dividends Per Share during next period
r = Required rate of return for equity investors
g = Growth rate in dividends forever
DRAWBACK OF THE GORDON METHOD :
The use of this model is restricted to firms that are growing at a stable rate. The
assumption that the growth rate in dividends has to be constant over time is a
difficult assumption to meet, especially given the volatility of earnings.
Assumed growth rate may be incorrect.
The growth rate is equal to the required rate of return, then the value of the stock
approaches infinity. If the growth rate is higher then the required rate of return,
then the value of the stock becomes negative. A firm cannot grow in the long-
term at a rate in the economy.
The false assumption is that investors will hold shares for infinite period of time.
B. MULTIPLE GROWTH MODEL :
The constant growth assumption may not be realistic in many situations. The
growth in dividends may be at varying rates. A typical situation for many companies may
be that a period of extraordinary growth (either good or bad) will prevail for a certain
number of years after which growth will change to a level at which it is expected to
continue indefinitely. This situation can be represented by a Multiple Growth Model also
known as - two stage growth model.
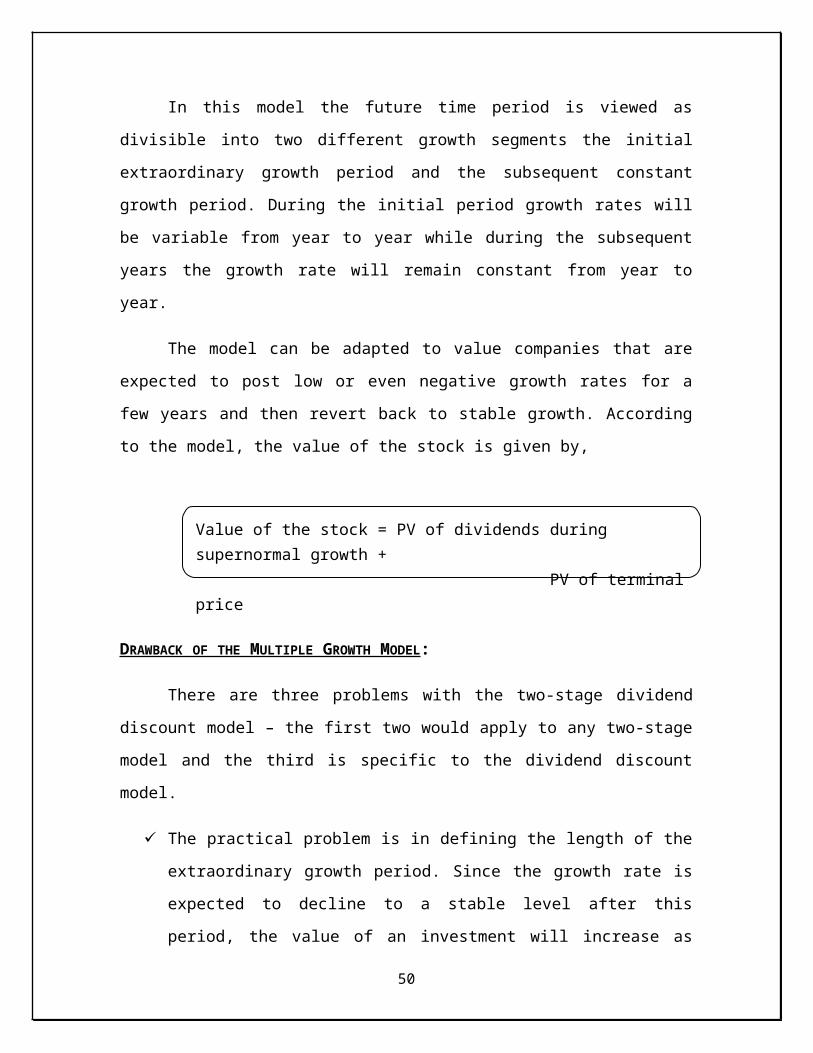
In this model the future time period is viewed as divisible into two different
growth segments the initial extraordinary growth period and the subsequent constant
growth period. During the initial period growth rates will be variable from year to year
while during the subsequent years the growth rate will remain constant from year to year.
36
The model can be adapted to value companies that are expected to post low or
even negative growth rates for a few years and then revert back to stable growth.
According to the model, the value of the stock is given by,
DRAWBACK OF THE MULTIPLE GROWTH MODEL :
There are three problems with the two-stage dividend discount model – the first
two would apply to any two-stage model and the third is specific to the dividend discount
model.
The practical problem is in defining the length of the extraordinary growth period.
Since the growth rate is expected to decline to a stable level after this period, the
value of an investment will increase as this period is made longer. It is difficult in
practice to convert these qualitative considerations into a specific time period.
The second problem with this model lies in the assumption that the growth rate is
high during the initial period and is transformed overnight to a lower stable rate at
the end of the period. While these sudden transformations in growth can happen,
it is much more realistic to assume that the shift from high growth to stable
growth happens gradually over time.
The focus on dividends in this model can lead to skewed estimates of value for
firms that are not paying out what they can afford in dividends. In particular, we
will under estimate the value of firms that accumulate cash and pay out too little
in dividends.
37
Value of the stock = PV of dividends during supernormal growth + PV of terminal price
3. DISCOUNTED CASH FLOW :
The discounted cash flow (or DCF) approach describes a method of valuing a
project, company, or asset using the concepts of the time value of money. A
valuation method used to estimate the attractiveness of an investment opportunity.
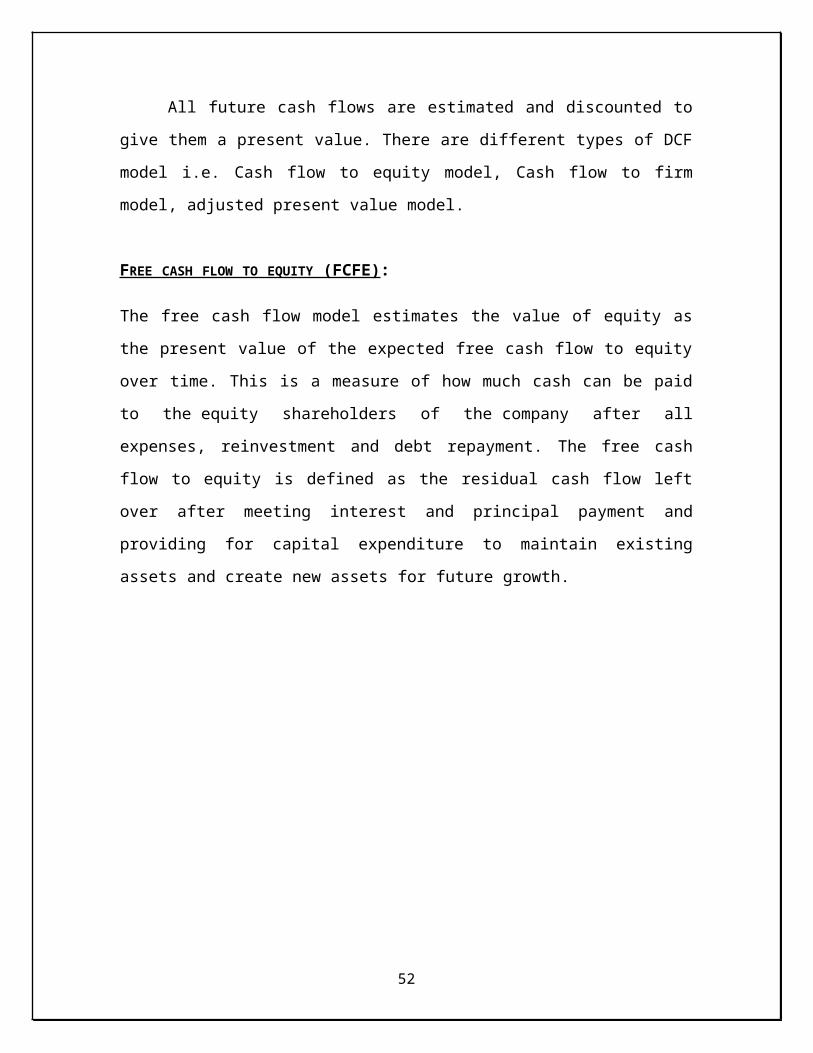
All future cash flows are estimated and discounted to give them a present value.
There are different types of DCF model i.e. Cash flow to equity model, Cash flow to firm
model, adjusted present value model.
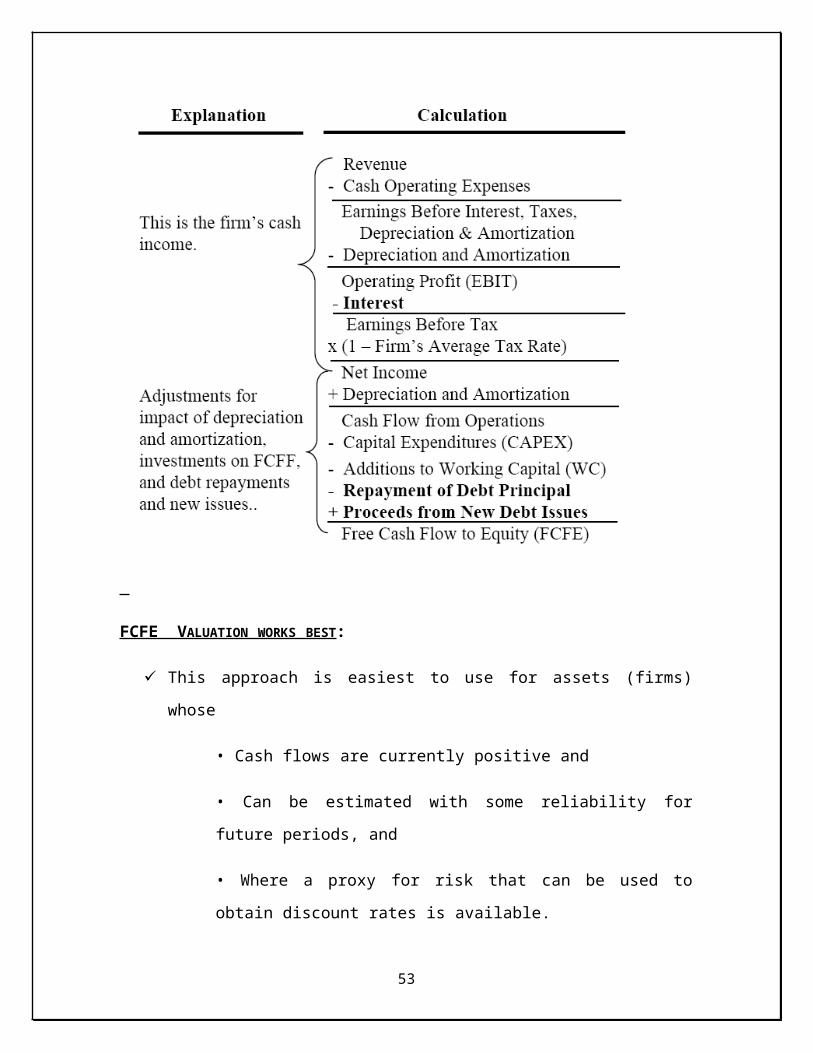
FREE CASH FLOW TO EQUITY (FCFE) :
The free cash flow model estimates the value of equity as the present value of the
expected free cash flow to equity over time. This is a measure of how much cash can be
paid to the equity shareholders of the company after all expenses, reinvestment and debt
repayment. The free cash flow to equity is defined as the residual cash flow left over after
meeting interest and principal payment and providing for capital expenditure to maintain
existing assets and create new assets for future growth.
38
FCFE VALUATION WORKS BEST :
This approach is easiest to use for assets (firms) whose
• Cash flows are currently positive and
• Can be estimated with some reliability for future periods, and
• Where a proxy for risk that can be used to obtain discount rates is
available.
It works best for investors who either
• Have a long time horizon, allowing the market time to correct its
valuation mistakes and for price to revert to “true” value or
39

• Are capable of providing the catalyst needed to move price to value, as
would be the case if you were an activist investor or a potential acquirer of
the whole firm
DRAWBACKS OF FCFE MODEL :
Since it is an attempt to estimate intrinsic value, it requires far more inputs and
information than other valuation approaches.
These inputs and information are not only noisy (and difficult to estimate), but
can be manipulated by the savvy analyst to provide the conclusion he or she
wants.
FCFE VALUATION MODELS :
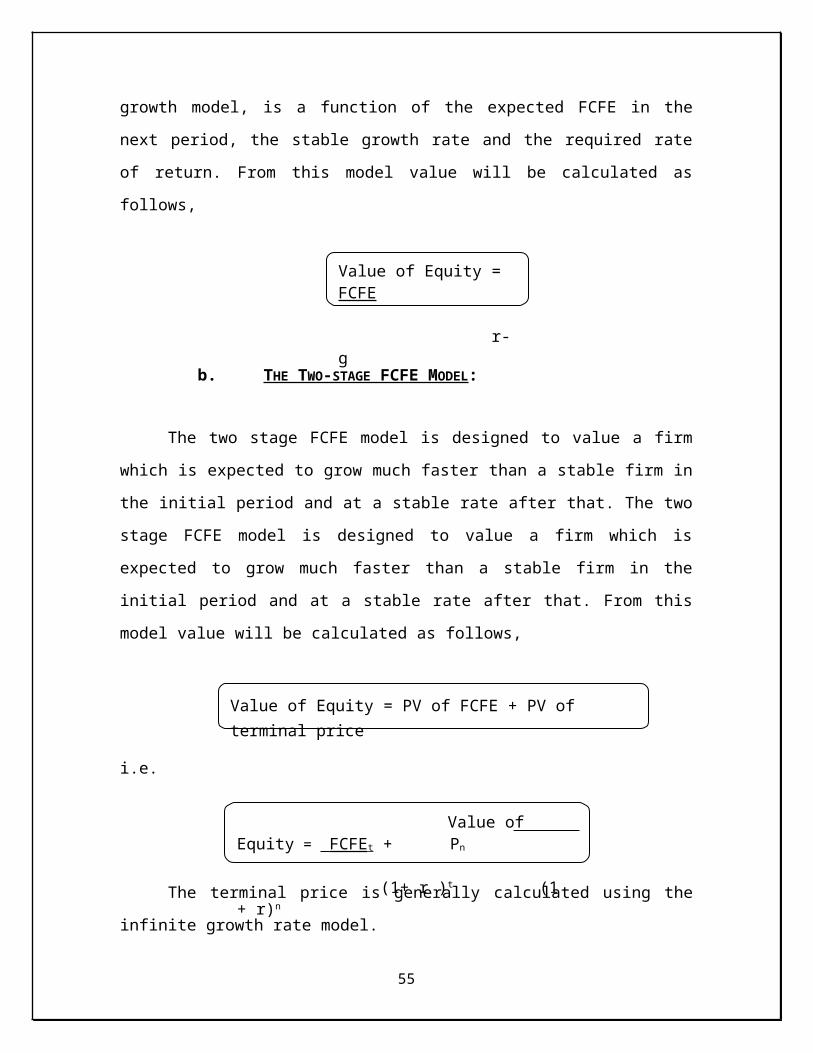
A. THE CONSTANT GROWTH FCFE MODEL :
The constant growth FCFE model is designed to value firms that are growing at a
stable rate and are, hence, in steady state. The value of equity, under the constant growth
model, is a function of the expected FCFE in the next period, the stable growth rate and
the required rate of return. From this model value will be calculated as follows,
B. THE TWO-STAGE FCFE MODEL :
The two stage FCFE model is designed to value a firm which is expected to grow
much faster than a stable firm in the initial period and at a stable rate after that. The two
stage FCFE model is designed to value a firm which is expected to grow much faster
than a stable firm in the initial period and at a stable rate after that. From this model value
will be calculated as follows,
40
Value of Equity = FCFE r-g

i.e.
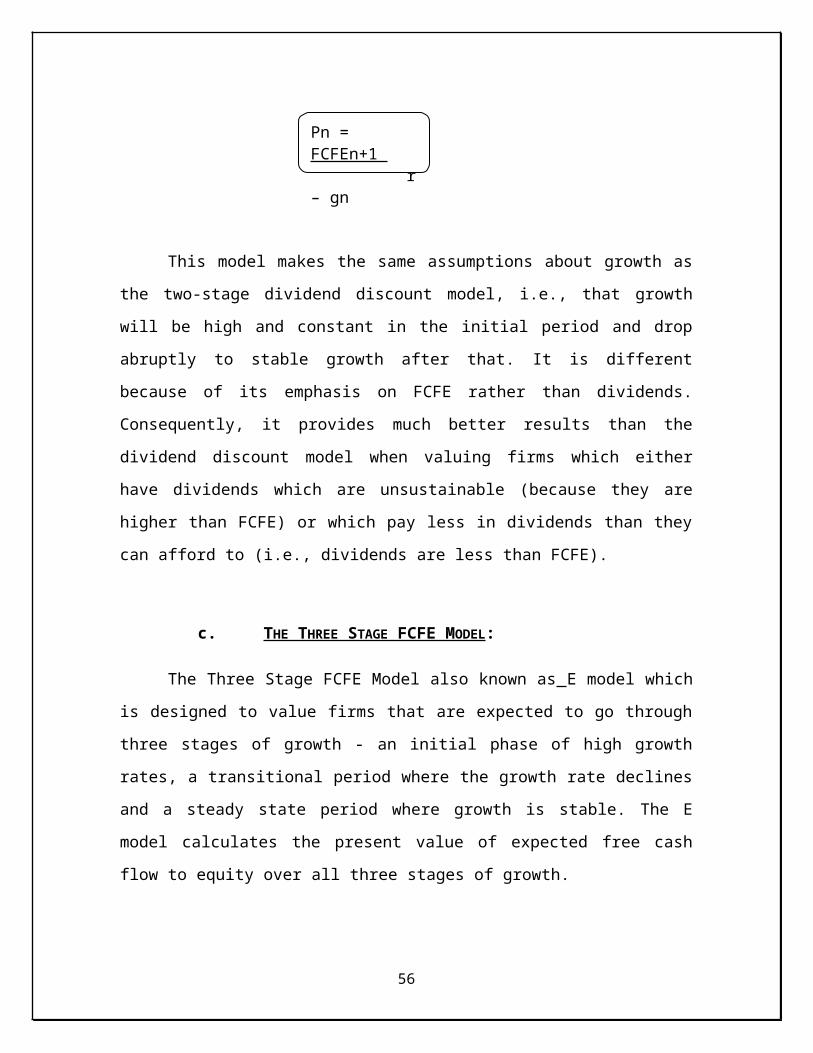
The terminal price is generally calculated using the infinite growth rate model.
This model makes the same assumptions about growth as the two-stage dividend
discount model, i.e., that growth will be high and constant in the initial period and drop
abruptly to stable growth after that. It is different because of its emphasis on FCFE rather
than dividends. Consequently, it provides much better results than the dividend discount
model when valuing firms which either have dividends which are unsustainable (because
they are higher than FCFE) or which pay less in dividends than they can afford to (i.e.,
dividends are less than FCFE).
C. THE THREE STAGE FCFE MODEL :
The Three Stage FCFE Model also known as E model which is designed to value
firms that are expected to go through three stages of growth - an initial phase of high
growth rates, a transitional period where the growth rate declines and a steady state
period where growth is stable. The E model calculates the present value of expected free
cash flow to equity over all three stages of growth.
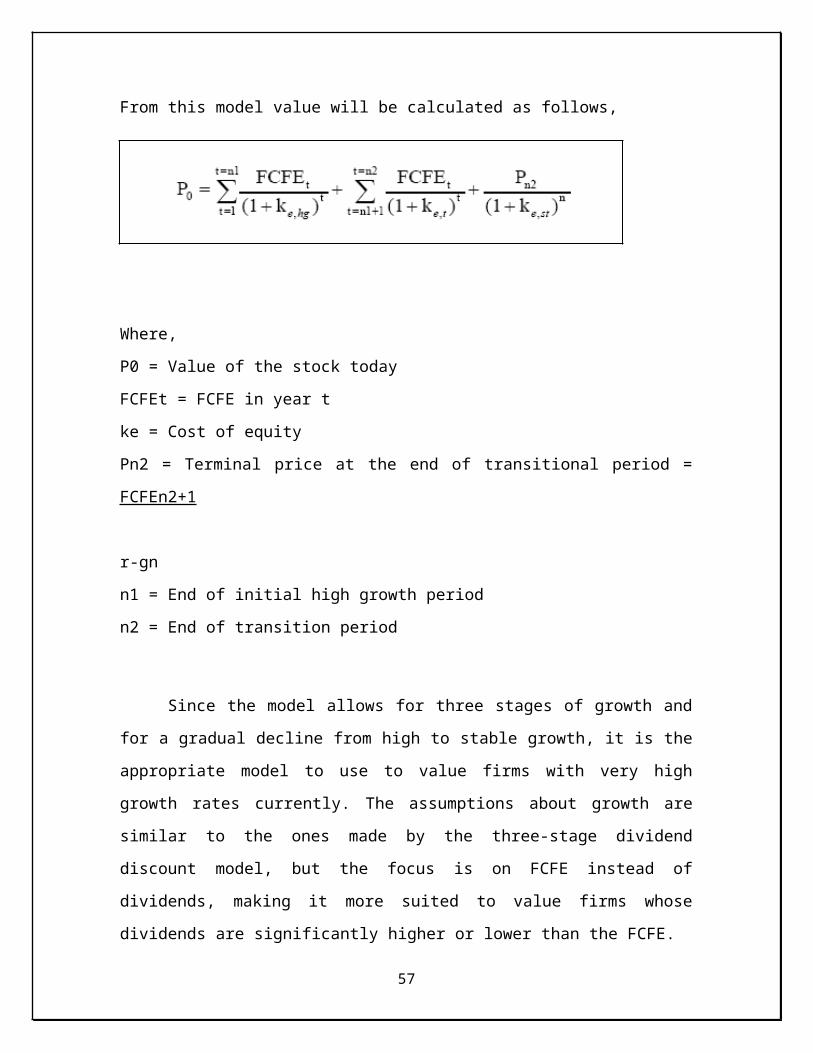
From this model value will be calculated as follows,
41
Value of Equity = FCFEt + Pn (1+ r )t (1 + r)n
Pn = FCFEn+1 r – gn
Value of Equity = PV of FCFE + PV of terminal price
Where,
P0 = Value of the stock today
FCFEt = FCFE in year t
ke = Cost of equity
Pn2 = Terminal price at the end of transitional period = FCFEn2+1
r-gn
n1 = End of initial high growth period
n2 = End of transition period
Since the model allows for three stages of growth and for a gradual decline from
high to stable growth, it is the appropriate model to use to value firms with very high
growth rates currently. The assumptions about growth are similar to the ones made by the
three-stage dividend discount model, but the focus is on FCFE instead of dividends,
making it more suited to value firms whose dividends are significantly higher or lower
than the FCFE.
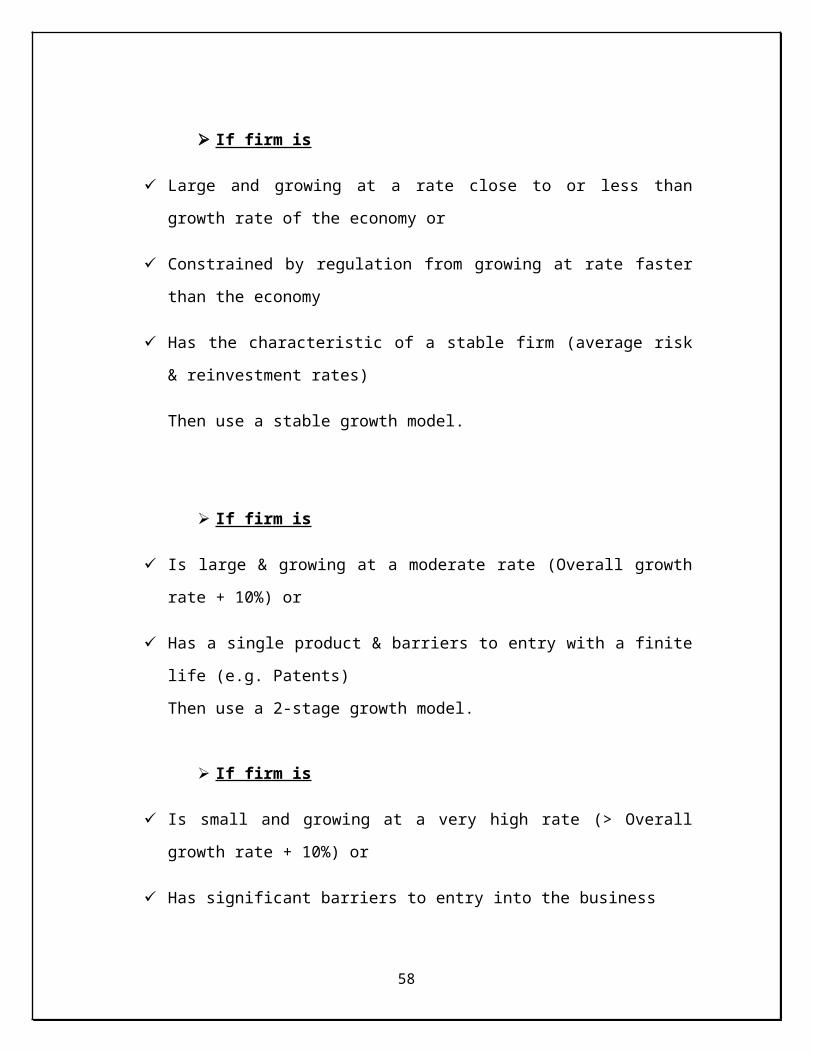
If firm is
Large and growing at a rate close to or less than growth rate of the economy or
Constrained by regulation from growing at rate faster than the economy
Has the characteristic of a stable firm (average risk & reinvestment rates)
Then use a stable growth model.
42
If firm is
Is large & growing at a moderate rate (Overall growth rate + 10%) or
Has a single product & barriers to entry with a finite life (e.g. Patents)
Then use a 2-stage growth model.
If firm is
Is small and growing at a very high rate (> Overall growth rate + 10%) or
Has significant barriers to entry into the business
Has firm characteristics that are very different from the norm
Then use a 3-stage or n-stage model.
4. ASSET BASED APPROACH :
Asset Based Approach focuses on determining the value of net assets from the
perspective of equity share valuation. It should determine whether the assets should be
valued at book, market, and replacement or liquidation value. More often than not, they
are (and should be) valued at book value, that is, original acquisition cost minus
accumulated depreciation, as assets are normally acquired with the intent to be used in
business and not for resale. Thus valuation of assets is based on the going concern
concept.
Apart from tangible assets, intangible assets, such as goodwill, patents,
trademark, brands, know-how, and so on, also need to be valued satisfactorily. It may be
useful to adopt the super profit method to value some of these assets.
To arrive at the net assets value, total external liabilities (including preference
share capital) payable are deducted from total assets (excluding fictitious assets). The
company’s net assets are computed as per equation,
43
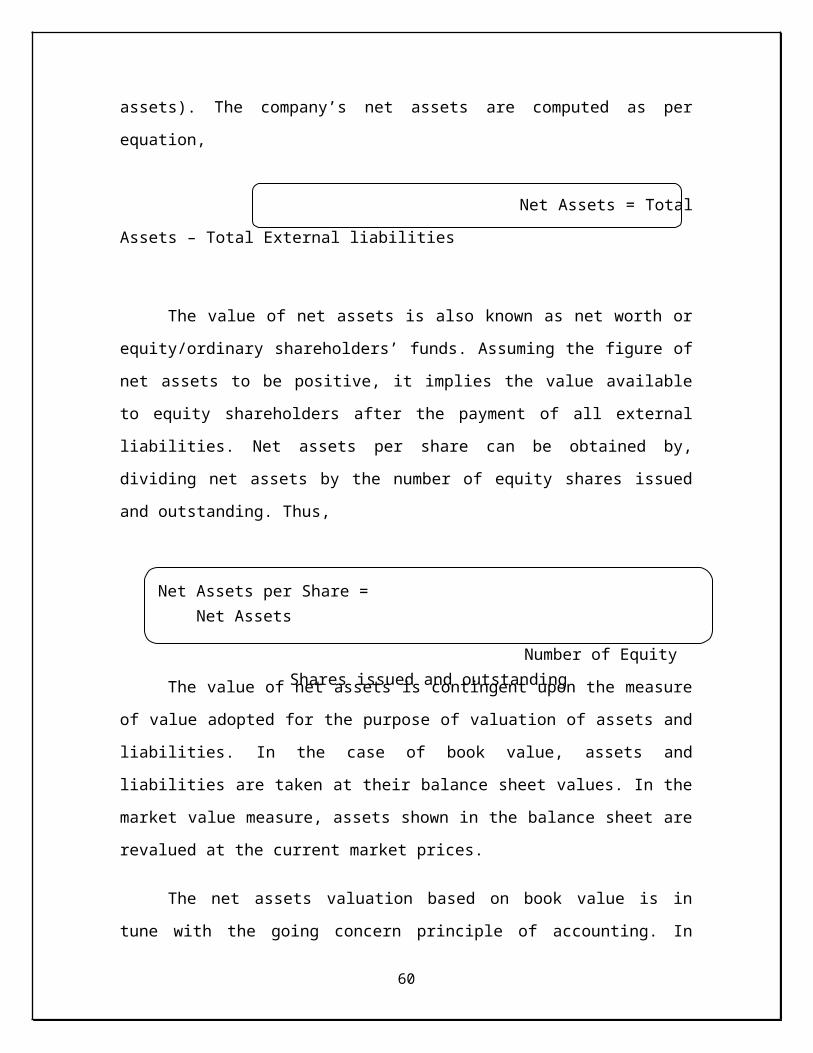
Net Assets = Total Assets – Total External liabilities
The value of net assets is also known as net worth or equity/ordinary
shareholders’ funds. Assuming the figure of net assets to be positive, it implies the value
available to equity shareholders after the payment of all external liabilities. Net assets per
share can be obtained by, dividing net assets by the number of equity shares issued and
outstanding. Thus,
The value of net assets is contingent upon the measure of value adopted for the
purpose of valuation of assets and liabilities. In the case of book value, assets and
liabilities are taken at their balance sheet values. In the market value measure, assets
shown in the balance sheet are revalued at the current market prices.
The net assets valuation based on book value is in tune with the going concern
principle of accounting. In contrast, liquidation value measure is guided by the realizable
value available on the winding up/ liquidation of a corporate firm.
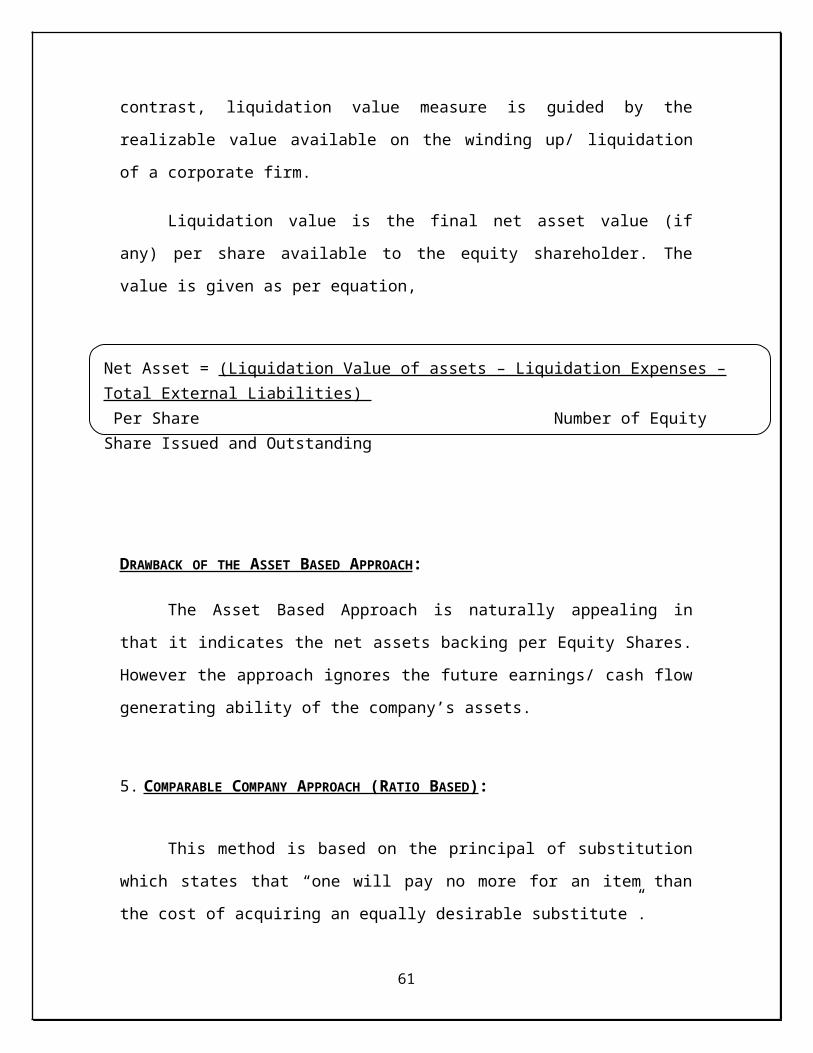
Liquidation value is the final net asset value (if any) per share available to the
equity shareholder. The value is given as per equation,
44
Net Asset = (Liquidation Value of assets – Liquidation Expenses – Total External Liabilities) Per Share Number of Equity Share Issued and Outstanding
Net Assets per Share = Net Assets
Number of Equity Shares issued and outstanding

DRAWBACK OF THE ASSET BASED APPROACH :
The Asset Based Approach is naturally appealing in that it indicates the net assets
backing per Equity Shares. However the approach ignores the future earnings/ cash flow
generating ability of the company’s assets.
5. COMPARABLE COMPANY APPROACH (RATIO BASED) :
This method is based on the principal of substitution which states that “one will
pay no more for an item than the cost of acquiring an equally desirable substitute”.
The objective of comparable company approach is to value the assets based on
how similar assets are priced in the market place. It is also termed as relative valuation.
In relative valuation, the value of an asset is derived from the pricing of 'comparable'
assets, standardized using a common variable such as earnings, cash flows, book value or
revenues. Widely used multiples are price-earnings ratio, price to book value ratio, price
to sales ratio etc.
APPLICATION OF COMPARABLE COMPANY APPROACH :
This approach is easiest to use when
• There are a large number of assets comparable to the one being valued
• These assets are priced in a market
• There exists some common variable that can be used to standardize the
price
This approach tends to work best for investors
• Those who have relatively short time horizons
• Are judged based upon a relative benchmark (the market, other portfolio
managers following the same investment style etc.)
45
• Can take actions that can take advantage of the relative mispricing; for
instance, a hedge fund can buy the undervalued and sell the overvalued
assets.
ADVANTAGES OF COMPARABLE COMPANY APPROACH :
Easy to understand and apply; uses easily available current market data
eliminating the need for projecting cash flows. Valuation based on multiples and
comparable firm can be done with fewer assumptions and at a faster rate than the
discounted cash flow valuation.
The relative valuation is simple and easy to understand and present to clients than
DCF method.
The relative valuation measures the relative value of assets rather than intrinsic
value and hence it reflects current atmosphere of the market.
DISADVANTAGES OF COMPARABLE COMPANY APPROACH :
Difficult to find companies that are truly comparable - listed companies are
typically larger and less risky.
Because we don’t make assumptions, we may ignore the role of key fundamentals
such as growth, ROC, and cash flows.
Relative valuation captures current market sentiment, so it may also incorporate
market misevaluations. Each step in valuing using multiples analysis is subjective
46

and provides an opening for manipulation of results. The multiples approach can
justify a wide range of values for businesses.
The lack of explicit assumptions makes a relative valuation easy to manipulate
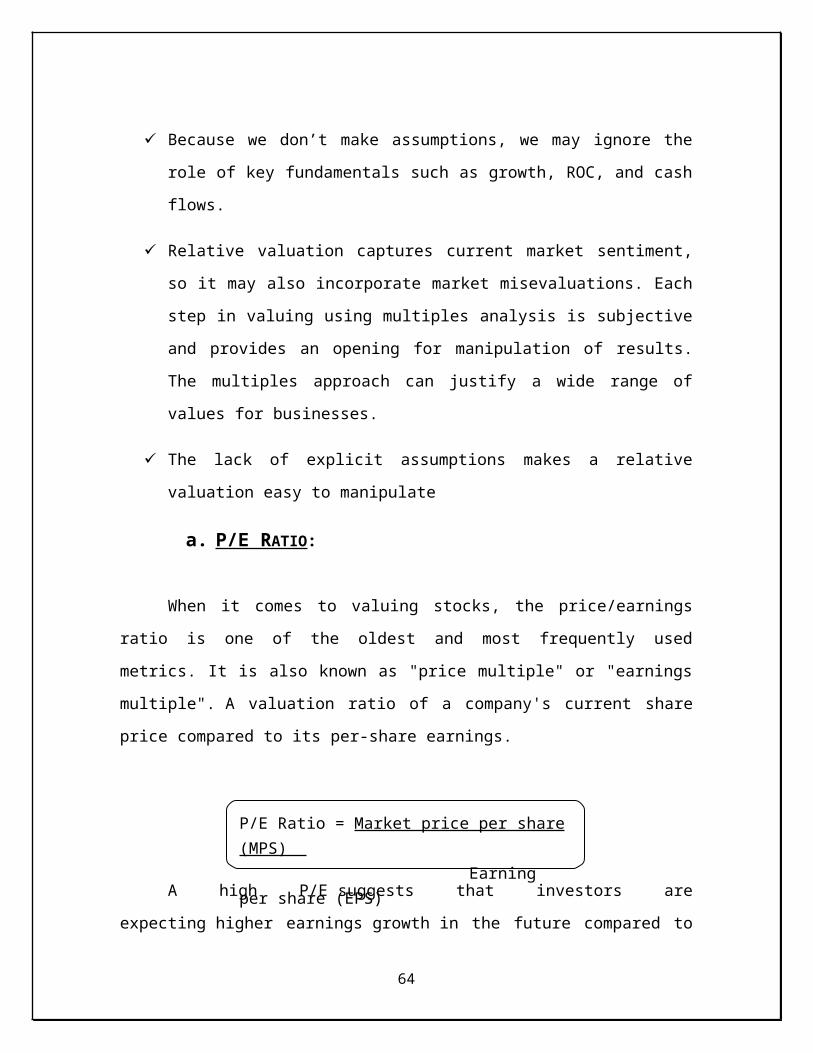
A. P/E RATIO :
When it comes to valuing stocks, the price/earnings ratio is one of the oldest and
most frequently used metrics. It is also known as "price multiple" or "earnings
multiple". A valuation ratio of a company's current share price compared to its per-share
earnings.
A high P/E suggests that investors are expecting higher earnings growth in the
future compared to companies with a lower P/E. However, the P/E ratio doesn't tell us
the whole story by itself. It's usually more useful to compare the P/E ratios of
one company to other companies in the same industry, to the market in general or against
the company's own historical P/E. It would not be useful for investors using the P/E ratio
as a basis for their investment to compare the P/E of a technology company (high P/E) to
a utility company (low P/E) as each industry has much different growth prospects.
DRAWBACK OF P/E RATIO :
Using the Price to earnings (P/E) ratio ignores the cost of capital, time value of
money and is sensitive to the accounting policies adopted.
Because the P/E ratio does not reflect future earnings growth, we use the PEG
ratio to determine whether the market valuation is supported by the predicted future
earnings growth rates.
47
P/E Ratio = Market price per share (MPS) Earning per share (EPS)

B. PEG RATIO :
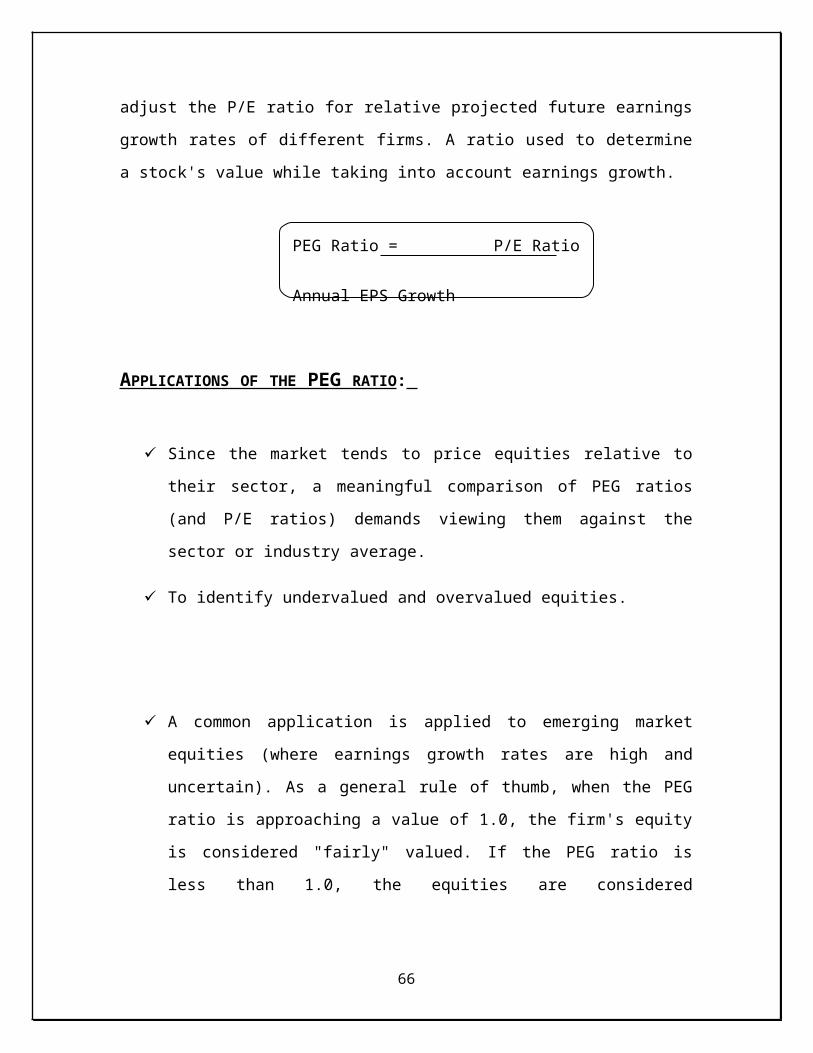
The PEG ratio was developed to address shortcomings in the use of the P/E ratio.
Specifically, it was created to adjust the P/E ratio for relative projected future earnings
growth rates of different firms. A ratio used to determine a stock's value while taking into
account earnings growth.
APPLICATIONS OF THE PEG RATIO :
Since the market tends to price equities relative to their sector, a meaningful
comparison of PEG ratios (and P/E ratios) demands viewing them against the
sector or industry average.
To identify undervalued and overvalued equities.
A common application is applied to emerging market equities (where earnings
growth rates are high and uncertain). As a general rule of thumb, when the PEG
ratio is approaching a value of 1.0, the firm's equity is considered "fairly" valued.
If the PEG ratio is less than 1.0, the equities are considered "undervalued". If the
PEG ratio is greater than 1.0, the equities are considered "overvalued".
48
PEG Ratio = P/E Ratio Annual EPS Growth
c. RELATIVE P/E RATIO :
Relative P/E compares the current absolute P/E to a benchmark or a range of past
P/Es over a relevant time period, such as the last 10 years. Relative P/E shows
what portion or percentage of the past P/Es the current P/E has reached. Relative P/E
usually compares the current P/E value to the highest value of the range, but investors
might also compare the current P/E to the bottom side of the range, measuring how close
the current P/E is to the historic low. The relative P/E will have a value below 100% if
the current P/E is lower than the past value (whether the past high or low). If the relative
P/E measure is 100% or more, this tells investors that the current P/E has reached or
surpassed the past value.
Suppose a company's P/Es over the last 10 years have ranged between 15 and
40. If the current P/E ratio is 25, the relative P/E comparing the current P/E to the highest
value of this past range is 0.625 (25/40), and the current P/E relative to the low end of the
range is 1.67 (25/15). These values tell investors that the company's P/E is currently
62.5% of the 10-year high and 67% higher than the 10-year low.
d. P/BV RATIO :
It reflects the market’s expectation. Book value of an asset reflects its original
cost. It might deviate significantly from market value if the earning power of the asset
has increased or declined significantly since its acquisition.
The Price/ Book value ratio is the ratio of market value of equity to book value of
equity, i.e. the measure of stakeholders’ equity in the balance sheet. It is calculated as
follows,
49
Price/ Book value ratio = Market Value of Equity Book Value of Equity
ADVANTAGES :
For investors who instinctively mistrust discounted cash flow estimates of value,
the book value is a much simpler benchmark for comparison.
Price-book value ratios can be compared across similar firms for signs of under or
over valuation.
Even firms with negative earnings.
DISADVANTAGES :
Affected by accounting decisions on depreciation and other variables
Completely ignores intangible assets.
e. P/SALES RATIO :
A ratio for valuing a stock relative to its own past performance, other companies
or the market itself. Price to sales is calculated by dividing a stock's current price by its
revenue per share for the trailing 12 months:
The price-to-sales ratio can vary substantially across industries;
therefore, it's useful mainly when comparing similar companies. Because it doesn't take
any expenses or debt into account, the ratio is somewhat limited in the story it tells.
50
Price to Sales Ratio = Share Price Revenue Per Share

6. OTHER APPROACHES :
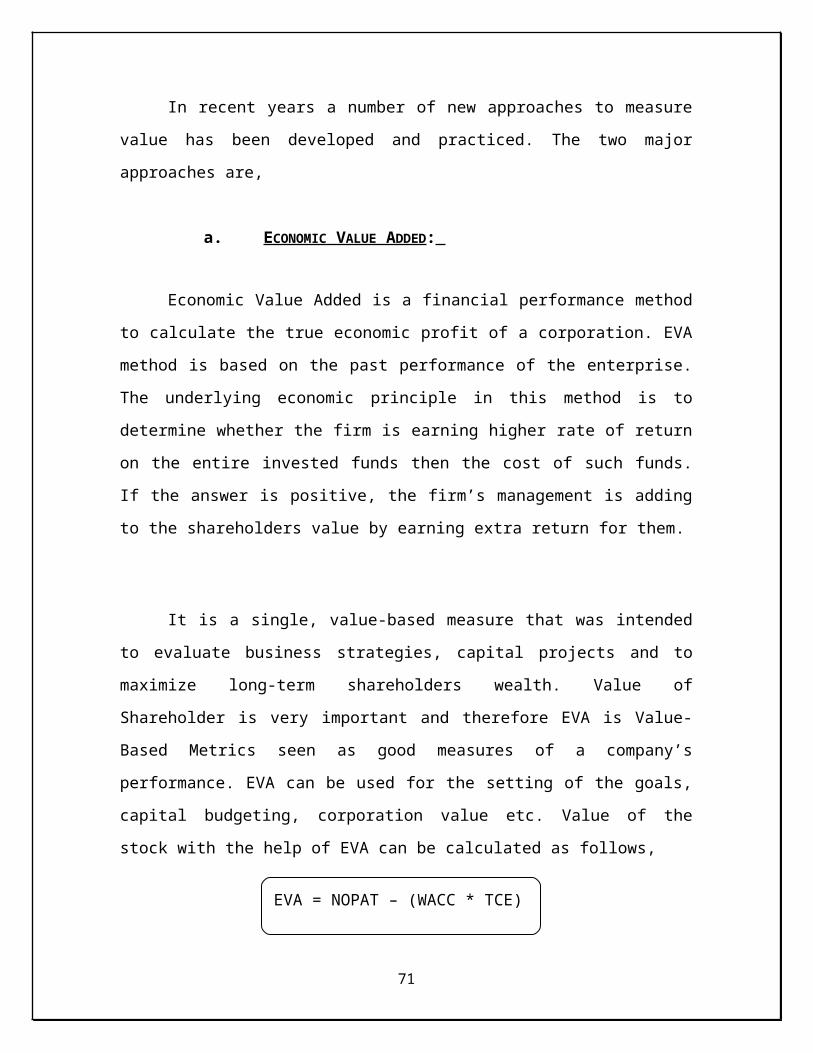
In recent years a number of new approaches to measure value has been developed
and practiced. The two major approaches are,
A. ECONOMIC VALUE ADDED :
Economic Value Added is a financial performance method to calculate the true
economic profit of a corporation. EVA method is based on the past performance of the
enterprise. The underlying economic principle in this method is to determine whether the
firm is earning higher rate of return on the entire invested funds then the cost of such
funds. If the answer is positive, the firm’s management is adding to the shareholders
value by earning extra return for them.
It is a single, value-based measure that was intended to evaluate business
strategies, capital projects and to maximize long-term shareholders wealth. Value of
Shareholder is very important and therefore EVA is Value-Based Metrics seen as good
measures of a company’s performance. EVA can be used for the setting of the goals,
capital budgeting, corporation value etc. Value of the stock with the help of EVA can be
calculated as follows,
Where,
NOPAT= Net operating profit after tax
TCE = Total capital employed
WACC = weighted average cost of capital
51
EVA = NOPAT – (WACC * TCE)
ADVANTAGES OF EVA :
It is directly linked to creation of shareholders wealth over time
The mechanism of EVA forces management to recognize the cost of equity in all
its decision from board room to the shop floor
It is used to assess the likely impact of competing strategies on shareholders
wealth and thus help management to select that one that will best serve the
shareholders.
Improves the overall capital efficiency.
EVA implementation will result in a better business performance due to better
understanding of objectives.
Allows managers to make better decisions.
DISADVANTAGE OF EVA :
EVA provides information that is obvious but offers no solutions in much the
same way as historical financial statement.
EVA is based on financial accounting methods that can be manipulated by
managers
Shareholder-centric
The emphasis of EVA on improving business-unit performance, it does not
encourage collaborative relationship between business unit managers.
B. MARKET VALUE ADDED :
MVA measures the change in the market value of the firm’s equity vis-à-vis
equity investment. Market Value Added (MVA) is the difference between the current
market value of a firm and the capital contributed by investors. If MVA is positive, the
52
firm has added value. If it is negative, the firm has destroyed value. The amount of value
added needs to be greater than the firm's investors could have achieved investing in the
market portfolio.
Though the concept of MVA is normally used in the context of equity investment
therefore it has greater relevance for equity shareholder. Value of the stock with the help
of MVA can be calculated as follows,
DRAWBACKS OF MVA :
The market value added Approach is very much dependent on the market price of
the target company. As the share price is dependent on various factors, viz., market
conditions, its own performance, some natural calamity, investor’s sentiments or
perceptions about the market. Because of all this factors the share price of the company
may fluctuate, so it becomes difficult to get the best price. Other drawbacks are,
Only on listed shares
Depends on capital market
53
MVA = Market value of firm’s equity – Equity capital
investment/funds
DCF FRAMEWORK
54
The following section will present the theoretical recommendations on each
aspect that was included in the empirical study.
ANALYSIS OF HISTORICAL PERFORMANCE:
A crucial step in the DCF model is to collect and analyze relevant historical
information in order to evaluate the historical performance. A solid understanding of the
past performance will enable reasonable forecasts of future performance.
The historical information should at a minimum include income statements
and balance sheets. Additional information such as cash flow statements and
relevant notes may also add value. The number of years of historical data included
should be sufficient to determine historical performance and business trends.
In order for the historical information to provide an understanding of
historical performance it needs to be analyzed. The analysis is performed through
calculating historical financial ratios such as sales growth, profit margins, capital
expenditure etc. Through analyzing these ratios over a number of years the historical
performance will become evident and reasonable assumptions regarding future
performance can be made (Jennergren 2007).
FORECASTING FUTURE PERFORMANCE:
The analysis of the historical performance should provide a clarifying
connection to the assumptions that are made regarding future performance. These
assumptions should be able to generate future expected income statements and
balance sheets from which the free cash flow can be derived. Furthermore, the
assumptions should be clearly stated in a separate section.
The forecasting of a firm’s financial performance is divided into two
periods: the explicit forecast period and the post-horizon period. For each given year
55
in the explicit forecast period the corresponding income statement and the balance
sheet is used to derive the expected annual free cash flow.
In some implementations of the DCF model it is a requirement that the explicit
forecast period is not shorter than the economic life of the firm’s property, plant and
equipment, (Jennergren 2007 and Jennergren 2008).
According to Jennergren (2007a) and Koller et al (2005) the explicit forecast
period should consist of at least 10-15 years. Earlier studies have however
concluded that practitioners often use a shorter forecasting period, often no longer
than five years (Levin and Olsson 1995 and Barker 1999).
Through forecasting entire income statements and balance sheets an analysis
using financial ratios is possible. This analysis can be used to determine the fairness
of the assumptions regarding the future (Levin 1998).
ESTIMATING THE COST OF CAPITAL:
The discount factor for the free cash flows must represent the risk faced
by all investors. The weighted average cost of capital (WACC) combine the required
rates of return for net debt (rnd) and equity (re) based on their market values. The tax
effect on cost of net debt is accounted for in the WACC. Through using a constant
WACC it is implicitly assumed that the capital structure will remain unchanged. The
WACC is defined as follows:
WACC = (Proportion of Equity * Cost of Equity) +
(Proportion of Debt * Cost of Debt)
The components of the WACC should be calculated accordingly:
56
The cost of net debt should be calculated using the company’s yield to
maturity on its long-term debt.
The marginal tax rate should be used as the tax rate in the WACC formula,
which is the tax that the firm would pay if the financing or non
operating items were eliminated.
For mature companies, the target capital structure is often
approximated by the company’s current debt-to-value ratio, using market
values of debt and equity.
The Capital Asset Pricing Model (CAPM) is used to determine the required
rate of return on equity.
CAPM should be calculated accordingly:
Local government default-free bonds should be used to estimate the risk-free rate.
Ideally, each cash flow should be discounted using a government bond with a
similar maturity.
To estimate the beta, first measure a raw beta using regression which should at
least contain five years of monthly returns and then improve the estimate
by using industry comparables.
No single model for estimating the market risk premium has gained
universal acceptance. Based on evidence from the different used models
suggests a market risk premium around 5 percent (Koller et al 2005).
One should note that, given the WACC formula, it is possible to use the required
return on equity as the discount factor if it is assumed that the future target
capital structure will be 100 percent equity and 0 percent net debt. A net debt
of zero requires that the model assumes that no interest bearing liabilities or
financial assets will exist in the target in the future, in this case the tax rate
become irrelevant in the WACC.
57
ESTIMATING THE CONTINUING VALUE:
As already mentioned the forecasting of a firm’s financial performance is
divided into two periods: the explicit forecast period and the post-horizon period.
During the explicit forecast period the firm is expected to transform into a steady state.
When the firm has reached the steady state the terminal value is calculated by a
continuing value formula.
The continuing value formula is applied to the first year in the post-horizon
period which therefore becomes representative for all subsequent years in the steady
state. The explicit forecast period must be long enough for the company to reach a steady
state. According to Koller et al (2005) the following characteristics must be fulfilled in
order for a company to truly be in steady state
The company should grow at a constant rate and reinvests a constant
proportion of its operating profits into the business each year.
The company earns a constant rate of return on new invested capital.
The company earns a constant return on its base level of invested capital.
If these conditions are fulfilled in steady state the free cash flow will grow at a
constant rate consistent with the assumed terminal growth rate and thereby a continuing
value formula can be applied. The DCF model should be constructed in such a way that
an extra year in steady state could be added, this enables to verify if the company truly is
in steady state, since the free cash flow during the extra year is supposed to grow
with the terminal growth rate (Jennergren 2007).
The continuing value formula that is commonly recommended is the
Gordon growth model. It should be noted that even though the terminal value is
calculated by a simple Gordon growth model it does not imply that it is unimportant
and irrelevant for the value of the firm (Levin and Olsson 2000). Earlier studies have
shown that a significant part of the total firm value is in the terminal value (Levin and
58
Olsson 1995). In addition, recent empirical studies have indicated that the terminal
value calculations are crucial for the overall accuracy of a valuation model.
The terminal growth rate in steady state must be less than or equal to that of the
economy (the GDP growth). A higher growth rate would eventually make the company
unrealistically large compared to the aggregated economy.21 The growth rate is often
assumed to equal the rate of inflation (Francis et al 1997).
FINANCIAL CASH FLOW:
The financial cash flow consists of transactions to or from all investors in
the firm. Hence, the financial cash flows consist of all transactions with those providing
capital to the firm. Financial cash flows should be identical to the free cash flows. Thus,
through including the financial cash flows it is possible to check that the free cash
flow calculations are correct. As a result it is possible to identify potential
mistakes concerning the free cash flow calculations (Koller et al 2005 and
Jennergren 2007).
FORECASTING PROCEDURE:
Regarding the forecasting procedure, the following theoretical conditions are used
to determine its quality
The number of years in the explicit forecast period should be at least 10-
15 years.
The forecasting should include entire income statements and balance
sheets.
The assumptions on future expected performance should be clearly linked
from an analysis of historical financial ratios.
The assumptions should be clearly stated in a separate section.
59
DISCUSSION ON
EMPIRICAL RESULTS
60
The ultimate aim of any report is to analyze the topic on certain target population
and likewise we have to analyze six companies’ intrinsic share price based on past
performance, current scenarios and statistics of RBI.
The basis of DCF model is to collect and analyze relevant historical accounting
information in order to evaluate historical performance. A solid understating of the past
performance as well as the current market scenario enables reasonable forecasts of future
performance and that’s why these variables played an important role in our analysis.
Before starting with our analysis we have considered financial year 2008-09 as an
abnormal year because of global recession and our conclusions as well as
recommendations are done when economy gets stabilize. So comparison of the intrinsic
share price with current market price is done on the closing price of the companies’ share
on 1st February, 2010 in NSE.
According to Jennergren (2007), a DCF model must at a minimum include entire
historical income statements and balance sheets. However, additional information in
the notes of the financial statements may provide supplementary information
regarding past performance that might improve the accuracy of predicted future
performance. Therefore the empirical findings of the quantity and quality of historical
information were unexpected and this is the main reason for our various assumptions.
We have considered risk-free rate of 8.01325% which was published on RBI
website. Apart from this risk-premium is estimated at 7.00% for PSEs. The corporate tax
rate is considered to be 33.99% for all estimated periods. We have calculated cost of
equity based on Capital Asset Pricing Model (CAPM) and then we come up Weighted
Average Cost of Capital (WACC). The Discounted Cash Flow model we have used is
based on the revenue generation and what percentage of revenue other component is i.e.
what percentage of revenue Free Cash Flow (FCF) is and likewise. We have considered
61
estimation of 10 years and from 11th year onwards everything will remain stable and the
year 2019-2020 is considered to be the horizon year.
Our analyses are as follows:
1. BHEL :
Based on the past performance and current trends in energy sector we have
assumed the growth rate of revenue at 20.00% and NOI growth rate of 15.00% of
revenue annually. The depreciation is stable at 4.00% every year while working capital
is reduced to 3.00% and capital expenditure increases at 4.50%. WACC is 15.00%. In
the year 2019-20 the revenue growth stabilize at 10.00%.
Table 8 shows the calculation of the company by DCF model. Based on this
calculation the present value of terminal value comes at Rs. 380172.93 cr. and present
value of cash flow comes at Rs. 39465.25 cr. which gives total value of the firm of Rs.
121180.85 cr. and after deducting the value of debt and dividing the figure with total
outstanding share the intrinsic share price of the company comes to Rs. 2472.45 while
the closing price on 1st February, 2010 on NSE was Rs. 2405.50. So there is a deviation
of Rs. 66.95.
62

63
2. BPCL :
The past performance shows that the revenue is growing at 16.00% annually but
on the other side the expenditure is also growing nearly at same percentage and that’s
why the NOI is assumed at just 0.75% of revenue. The depreciation is also assumed at
0.75% every year while working capital is reduced at 2.00% and capital expenditure
increases at 2.06%. WACC is 10.00%. In the year 2019-20 the revenue growth stabilize
at 10.00%.
Table 9 shows the calculation of the company by DCF model. Based on this
calculation the present value of terminal value comes at Rs. 22232.02 cr. and present
value of cash flow comes at Rs. 19194.04 cr. which arrives total value of the firm at Rs.
41426.06 cr. and after deducting the value of debt and dividing the figure with total
outstanding share the intrinsic share price of the company comes to Rs. 560.23 while the
closing price on 1st February, 2010 on NSE was Rs. 584.05. So there is a difference of
Rs. 23.82.
64
65
3. GAIL :
The historical financial results of GAIL and current situation in gas sector, its
revenue is growing at 12.00% annually while NOI is also growing at the same rate of
revenue. The depreciation is assumed to be 3.50% every year while working capital is
increasing at 2.25% and capital expenditure at 7.00%. WACC is 13.00%. In the year
2019-20 the revenue growth stabilize at 10.00%.
Table 10 shows the calculation of the company by DCF model. Based on this
calculation the present value of terminal value comes at Rs. 48610.43 cr. and present
value of cash flow comes at Rs. 4875.69 cr. which gives total value of the firm of Rs.
53486.12 cr. and after deducting the value of debt and dividing the figure with total
outstanding share the intrinsic share price of the company comes at Rs. 412.19 while the
closing price on 1st February, 2010 on NSE was Rs. 412.60. So there is no much
difference and the share looks at its actual value.
66

67
4. NTPC :
Based past performance and current trends in the power sector we have assumed
the revenue growth of the company at 15.00% annually but the profit margin looks good
in this company and average NOI comes at 17.00% of revenue. The depreciation is
assumed at 5.50% every year while working capital is increased at 2.25% and capital
expenditure at just 2.00%. WACC is 12.00%. In the year 2019-20 the revenue growth
stabilize at 10.00%.
Table 11 shows the calculation of the company by DCF model. Based on this
calculation the present value of terminal value comes at Rs. 192128.84 cr. and present
value of cash flow comes at Rs. 3348.26 cr. which gives the total value of the firm of Rs.
195477.10 cr. and after deducting the value of debt of 34567.80 and dividing the figure
with total outstanding share the intrinsic share price of the company comes at Rs. 195.13
while the closing price on 1st February, 2010 on NSE was Rs. 211.30. So there is a
difference of Rs. 16.17.
68

69

5. ONGC :
Based on the past performance and current scenario in oil & gas sector the
company’s revenue growth rate is assumed at 6.00% and NOI growth rate is 20.00% of
revenue. The depreciation is assumes at 15.00% every year while working capital
increases at 1.00% and capital expenditure at 16.00%. WACC is 14.00%. In the year
2019-20 the revenue growth stabilize at just 4.00%.
Table 12 shows the calculation of the company by DCF model. Based on this
calculation the present value of terminal value comes at Rs. 127880.19 cr. and present
value of cash flow comes at Rs. 92947.31 cr. which gives total value of the firm of Rs.
220827.50 cr. and after deducting the value of debt of just Rs. 26.74 cr. and dividing the
figure with total outstanding share the intrinsic share price of the company comes to Rs.
1032.31 while the closing price on 1st February, 2010 on NSE was Rs. 1101.55. So there
is a deviation of Rs. 69.24.
70
71
6. SAIL :
The performance of the company in past and the recent industry trend in steel
sector gives us an assumption of various growth rates. The revenue growth rate is
assumed at 8.00% while the NOI as a percentage of revenue is 19.00%. The depreciation
is also assumed at 2.75% every year while working capital increases at 2.00% and capital
expenditure at 5.00%. WACC is 16.00%. In the year 2019-20 the revenue growth
stabilize at 5.00%.
Table 13 shows the calculation of the company by DCF model. Based on this
calculation the present value of terminal value comes at Rs. 58377.74 cr. and present
value of cash flow comes at Rs. 49676.36 cr. which arrives total value of the firm at Rs.
108054.10 cr. and after deducting the value of debt and dividing the figure with total
outstanding share the intrinsic share price of the company comes to Rs. 243.36 while the
closing price on 1st February, 2010 on NSE was Rs. 213.50. So there is a difference of
Rs. 29.86.
72
73

Thus after each such a deep empirical research our findings comes as follows:
INTRINSIC VALUE AND CURRENT MARKET PRICE
Company Intrinsic value Market price on 1st
February, 2010Difference
BHEL 2472.45 2405.50 66.95 (U)
BPCL 560.23 584.05. 23.82 (O)
GAIL 412.19 412.60 0.41 (O)
NTPC 195.13 211.30 16.17 (O)
ONGC 1032.31 1101.55 69.24 (O)
SAIL 243.36 213.50 29.86 (U)
*U=Undervalued
*O=Overvalued Table 14
74

CONCLUSION
75
The objective behind this project was to compare the intrinsic value of the equity
with the ongoing market price. The intrinsic value and ongoing market price are more or
less similar. Market price is the investors’ understanding regarding the value of the
equity.
This conclusion is on the basis of our DCF model analysis of the company’s
equity. However this conclusion is not exactly match with the market price, because the
market value of the stock is a function of supply and demand in the market and not a
theoretical correct value. Market price is also affected by its own performance, market
condition, investors’ sentiments and investors’ perceptions about the market.
Here the analysis is done with use the of historical data and the estimation are
made for the long period of 10 years, which shows the equity value are calculated are
long-term value and in the long period market price will reach to intrinsic value.
From the Table 14 given in previous page we can say that BHEL is traded at
Rs.2405.05 which is Rs.66.95 lower than its intrinsic value and SAIL are traded at
Rs.213.50 which is also Rs.29.86 lower price than its intrinsic value.
BPCL is traded at Rs.584.05 which is Rs. 23.82 higher than its intrinsic value,
NTPC is traded at Rs.211.30 which is Rs.16.17 higher than it intrinsic value. The ONGC
is also priced Rs. 69.24 higher than its intrinsic value.
There seems to be no difference in GAIL’s intrinsic price and current market
price.
76