Embed Size (px)
Citation preview

TIMESQ U A R T E R L Y F A C T S H E E T • J U N E 2 0 1 7
Mutual Fund investments are subject to market risks, read all scheme related documents carefully
Schemes - Product Labeling
Name of the Scheme This product is suitable for Investors who are seeking* Riskometer
Taurus Starshare • Long term capital appreciationAn open - ended equity growth scheme • Investment in equity & equity related instruments - multi-cap in nature
Taurus Bonanza Fund • Long term capital appreciationAn open - ended equity growth scheme • Investment in equity & equity related instruments - focus on large cap stocks
Taurus Discovery Fund • Long term capital appreciationAn open - ended equity growth scheme • Investment in equity & equity related instruments through price discovery mechanism-mid cap in nature
Taurus Nifty Index Fund • Long term capital appreciationAn open - ended index linked equity scheme • Investment in equity securities by replicating Nifty 50
Taurus Tax Shield • Long term capital appreciationAn open - ended equity linked tax saving scheme • Investment in equity & equity related instruments
Taurus Ethical Fund • Long term capital appreciationAn open - ended equity oriented scheme • Investment in equity & equity related instruments based on the principles of Shariah
Taurus Infrastructure Fund • Long term capital appreciationAn open - ended equity thematic scheme • Investment in equity & equity related instruments of companies from Infrastructure Sector
Taurus Banking & Financial Services Fund • Long term capital appreciationAn open - ended sectoral equity scheme • Investment in equity & equity related instruments of companies from Banking & Financial sector
Taurus Dynamic Income Fund • Long term capital appreciation andAn open - ended income scheme current income with high liquidity • Investment in Debt/ Money Market Instruments
Taurus Short Term Income Fund • Medium term capital appreciationAn open - ended bond scheme and current income with low volatility • Investment in Debt/Money Market Instruments
Taurus Ultra Short Term Bond Fund • Short term capital appreciation andAn open - ended debt scheme current income with high liquidity & low volatility • Investment in Debt/ Money Market Instruments
Taurus Liquid Fund • Short term capital appreciation &An open - ended liquid scheme current income with low risk & high liquidity • Investment in Money Market Instruments /Short Term Debt Instruments upto a maturity of 91 days.
LOW HIGH
woL
yletaredo
M
woL
eraod teM Moderately
High
High
Investors understand that their principal will be at moderately high risk
*Investors should consult their financial advisers if in doubt about whether the product is suitable for them.
LOW HIGH
woL
yletaredo
M
woL
eraod teM Moderately
High
High
Investors understand that their principal will be at high risk
LOW HIGH
woL yletaredo
MwoL
eraod teM Moderately
High
High
Investors understand that their principal will be at moderate risk
LOW HIGH
woL
yletaredo
M
woL
eraod teM Moderately
High
High
Investors understand that their principal will be at moderately low risk
LOW HIGH
woL
yletaredo
M
woL
eraod teM Moderately
High
High
Investors understand that their principal will be at low risk

Dear Friends,
After 10 years of effort, India's new goods and services tax (GST) has taken effect on 1 July 2017,
ushering in one of the most significant reforms in the country's history. This major reform opens a new
chapter for India in terms of economic growth prospects, way of doing business and most importantly
strengthening the formal economy and increasing the tax base of the country.
The timing of the GST implementation in India could not have been better as inflation is under control,
the Indian Rupee is stable, and digitization thrust is at its peak. GST would broaden the formal
economy and increase the tax base in the country, directing the Governments focus in infrastructure
development and easing Government control across sectors. Demonetization just before the GST
implementation will now be seen as blessing in disguise as awareness of digitization increased even
among the smaller businesses.
India is set to climb up in ease of doing business ranking now. Infact the countries participating in the G20 Summit have praised the
Indian government for its efforts in the areas of startup funding, ease of doing business and labour reforms. Even rating-agency Moody's
said that over the medium term, GST will contribute to productivity gains and a higher GDP growth, thus boosting India's attractiveness as
an investment destination. We feel all this may improve India's credit profile, sooner than later.
GST is expected to have a benign impact on inflation and is expected to boost GDP by 1-2% in the long run with some short term
disruption.
Over the years, corporate India has postponed private investment in core sectors. We strongly believe that GST is likely to be game
changer for India as idled capacities are likely to be rekindled giving operating leverage to companies and fresh capacities are likely to
be added across sectors as the share of organized sector increases.
Indian market is likely to remain volatile in the short to medium term as sentiments would be driven by hostile situations prevailing near
Indo-China border and North Korea's Inter Ballistic Missile tests. Also, GST may distort earnings in the short term, may be a quarter,
which may compel investors to remain on the sidelines. However, we strongly believe, against consensus belief, that the GST is likely to
get absorbed sooner as businesses cannot do away with it, but to adopt it. Also, satisfactory monsoon progress and strong liquidity flows
may absorb corrections in the market.
On the Global front, macros appears to be improving supported by manufacturing activity, global trade growth and rising property
prices in the major economies. Uneasiness amid the apparent shift among global central banks to a more-hawkish stance hampered the
market sentiments. On geopolitics, situation in both Middle East and Korean peninsula remains fluid.
Happy Investing!
Prasanna PathakFund Manager - Equity
FROM THE INVESTMENT DESK
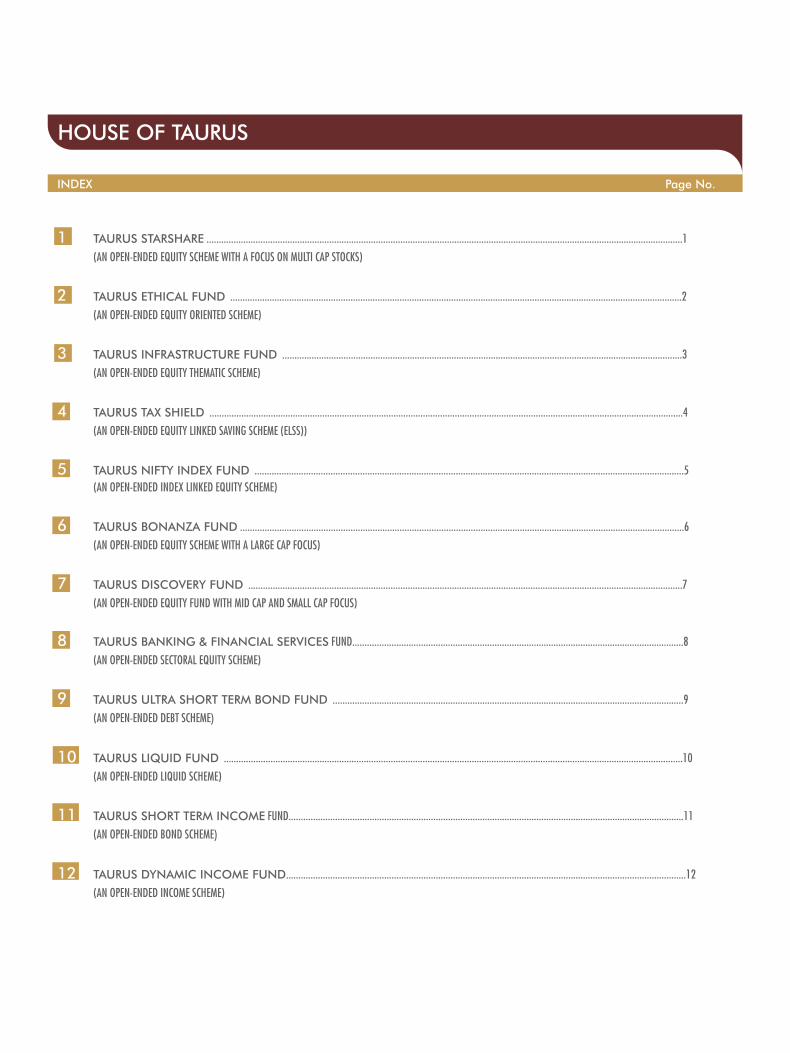
HOUSE OF TAURUS
INDEX Page No.
1 TAURUS STARSHARE ..................................................................................................................................................................................................1
(AN OPEN-ENDED EQUITY SCHEME WITH A FOCUS ON MULTI CAP STOCKS)
2 TAURUS ETHICAL FUND ........................................................................................................................................................................................2
(AN OPEN-ENDED EQUITY ORIENTED SCHEME)
3 TAURUS INFRASTRUCTURE FUND ...................................................................................................................................................................3
(AN OPEN-ENDED EQUITY THEMATIC SCHEME)
4 TAURUS TAX SHIELD .................................................................................................................................................................................................4
(AN OPEN-ENDED EQUITY LINKED SAVING SCHEME (ELSS))
5 TAURUS NIFTY INDEX FUND ...............................................................................................................................................................................5
(AN OPEN-ENDED INDEX LINKED EQUITY SCHEME)
6 TAURUS BONANZA FUND .....................................................................................................................................................................................6
(AN OPEN-ENDED EQUITY SCHEME WITH A LARGE CAP FOCUS)
7 TAURUS DISCOVERY FUND .................................................................................................................................................................................7
(AN OPEN-ENDED EQUITY FUND WITH MID CAP AND SMALL CAP FOCUS)
8 TAURUS BANKING & FINANCIAL SERVICES FUND.......................................................................................................................................8
(AN OPEN-ENDED SECTORAL EQUITY SCHEME)
9 TAURUS ULTRA SHORT TERM BOND FUND ...............................................................................................................................................9
(AN OPEN-ENDED DEBT SCHEME)
10 TAURUS LIQUID FUND ...........................................................................................................................................................................................10
(AN OPEN-ENDED LIQUID SCHEME)
11 TAURUS SHORT TERM INCOME FUND.................................................................................................................................................................11
(AN OPEN-ENDED BOND SCHEME)
12 TAURUS DYNAMIC INCOME FUND...................................................................................................................................................................12
(AN OPEN-ENDED INCOME SCHEME)

1
TAURUS STARSHARE - (AN OPEN-ENDED EQUITY SCHEME WITH A FOCUS ON MULTI CAP STOCKS)
Fund Manager's Comment: Scheme will remain oriented towards absolute ideas to generate its Alpha returns in the portfolio and it remains positive on themes like financial inclusion, formalization of economy, housing for all, agriculture and rural economy plays and increased government spend. Scheme will try to maintain a judicious blend of high quality large cap and mid-cap stocks.
PORTFOLIO
EQUITY SECTOR ALLOCATION
SCHEME FEATURES
Investment Objective
The basic objective of the Scheme is to provide
long-term capital appreciation. Emphasis will be
on sharing growth through appreciation as well as
on distribution of income by way of dividend.
Fund Manager
Mr. Prasanna Pathak - Total work exp. 14 yrs
Date of Allotment
January 29, 1994
Benchmark
S&P BSE 200
Monthly AUM
Monthly Average AUM: ` 214.13 Cr.
Month End AUM: ` 211.87 Cr.
Load Structure
Entry Load - NIL
Exit Load - Upto any amount (Including SIP): • 0.5% if exited on or before 180 days • Nil if exited after 180 days
Switch: Equity to Equity-Exit Load Nil, Equity to ELSS/Debt exit load applicable as mentioned above.
Minimum Application Amount:
` 5000/- & multiples of ` 1/- thereafter.
Liquidity
Sale & repurchase on all business days.
Net Asset Value (NAV)
Face Value `10/-
Regular Plan: `72.78 (D), 106.45 (G) per unit.
Direct Plan: ` 72.92 (D), 109.99 (G) per unit.
NAV Calculation: All Business days.
Expense Ratio:
Regular Plan: 2.56%
Direct Plan: 2.42% (Excluding service tax on investment management fees)
Quantitative Data
Regular Plan :
Sharpe Ratio: 0.54
Standard Deviation: 15.90
Beta: 1.16 (Based on monthly returns over the past 3 years Mibor
has been assumed as the risk-free rate of return)
Portfolio Turnover: 0.90
As on 30th June 2017
Name of the scrip % to Net Assets
Top 10 Holdings
HDFC Bank Ltd. 6.65
ITC Ltd. 6.31
Reliance Industries Ltd. 4.74
ICICI Bank Ltd. 4.64
Housing Development Finance Corporation Ltd. 4.43
Maruti Suzuki India Ltd. 4.30
Godrej Industries Ltd. 4.14
Larsen & Toubro Ltd. 3.69
Aditya Birla Nuvo Ltd. 3.09
Motherson Sumi Systems Ltd. 2.97
Total Top 10 Holdings 44.97
Total - Equity 97.98
Cash & Cash Receivables 2.02
Total 100.00
Month & Year Regular Plan Direct Plan Gross Dividend per unit(`) Gross Dividend Per unit(`)
June 2017 0.70 0.70May 2017 1.45 1.45
DIVIDEND HISTORY
Pursuant to payment of dividend, the NAV of the Scheme will fall to the extent of the dividend and statutory levy, if any. Past performance may or may not be sustained in the future.All dividends are on face value of `10 per unit. For complete details of the dividend declared please log on to ww.taurusmutualfund.com
0.73
0.77
1.05
1.12
1.41
1.49
1.92
2.17
2.95
2.97
3.09
3.24
3.69
3.72
4.18
4.74
5.92
6.08
10.99
13.73
22.01
0.00 5.00 10.00 15.00 20.00 25.00
Pharmaceuticals
Construction
Minerals/Mining
Transportation
Fertilisers
Ferrous Metals
Hotels, Resorts And Other Recreational Activities
Power
Industrial Capital Goods
Auto Ancillaries
Services
Gas
Construction Project
Chemicals
Cement
Petroleum Products
Software
Auto
Finance
Consumer Non Durables
Banks
Note: Mr. Sadanand Shetty has since resigned from the services of the Company and Mr. Prasanna Pathak has been appointed as the new Fund Manager – Equity w.e.f June 30, 2017.
2
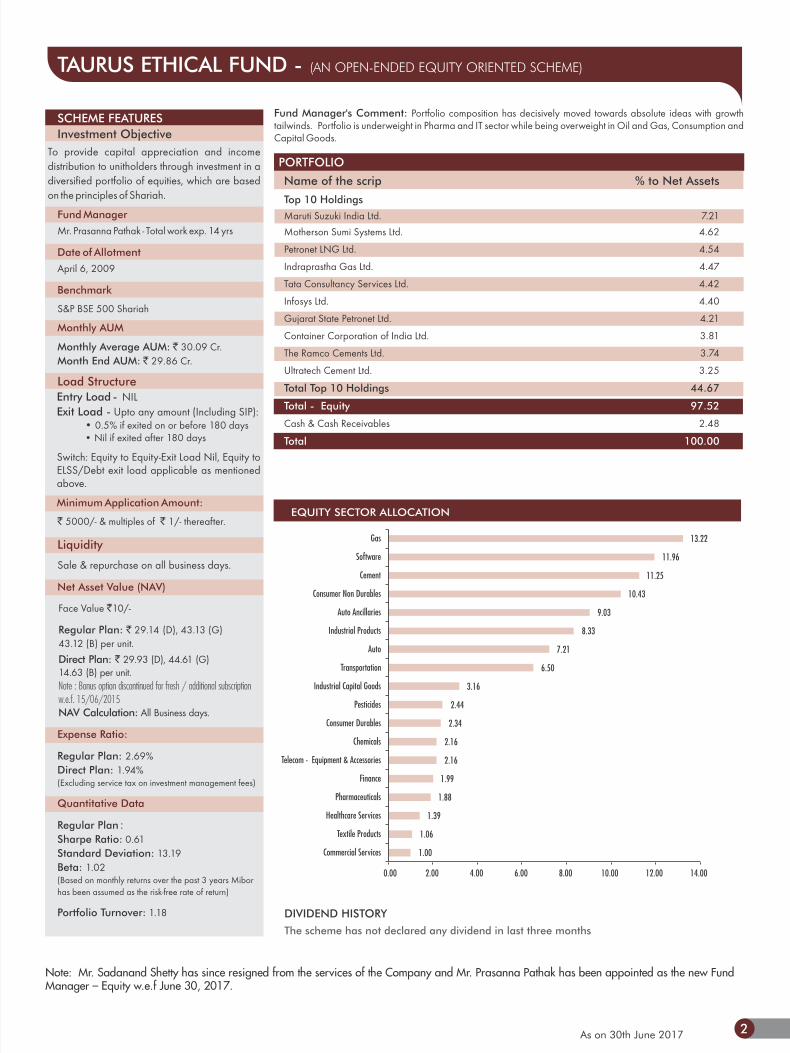
TAURUS ETHICAL FUND - (AN OPEN-ENDED EQUITY ORIENTED SCHEME)
Fund Manager's Comment: Portfolio composition has decisively moved towards absolute ideas with growth tailwinds. Portfolio is underweight in Pharma and IT sector while being overweight in Oil and Gas, Consumption and Capital Goods.
PORTFOLIO
EQUITY SECTOR ALLOCATION
DIVIDEND HISTORY
The scheme has not declared any dividend in last three months
SCHEME FEATURES
Investment Objective
To provide capital appreciation and income
distribution to unitholders through investment in a
diversified portfolio of equities, which are based
on the principles of Shariah.
Fund Manager
Mr. Prasanna Pathak - Total work exp. 14 yrs
Date of Allotment
April 6, 2009
Benchmark
S&P BSE 500 Shariah
Monthly AUM
Monthly Average AUM: ` 30.09 Cr.
Month End AUM: ` 29.86 Cr.
Load Structure
Entry Load - NIL
Exit Load - Upto any amount (Including SIP): • 0.5% if exited on or before 180 days • Nil if exited after 180 days
Switch: Equity to Equity-Exit Load Nil, Equity to ELSS/Debt exit load applicable as mentioned above.
Minimum Application Amount:
` 5000/- & multiples of ` 1/- thereafter.
Liquidity
Sale & repurchase on all business days.
Net Asset Value (NAV)
Face Value `10/-
Regular Plan: ` 29.14 (D), 43.13 (G)
43.12 (B) per unit.
Direct Plan: ` 29.93 (D), 44.61 (G) 14.63 (B) per unit.
Note : Bonus option discontinued for fresh / additional subscription
w.e.f. 15/06/2015 NAV Calculation: All Business days.
Expense Ratio:
Regular Plan: 2.69%
Direct Plan: 1.94% (Excluding service tax on investment management fees)
Quantitative Data
Regular Plan :
Sharpe Ratio: 0.61
Standard Deviation: 13.19
Beta: 1.02 (Based on monthly returns over the past 3 years Mibor
has been assumed as the risk-free rate of return)
Portfolio Turnover: 1.18
Name of the scrip % to Net Assets
Top 10 Holdings
Maruti Suzuki India Ltd. 7.21
Motherson Sumi Systems Ltd. 4.62
Petronet LNG Ltd. 4.54
Indraprastha Gas Ltd. 4.47
Tata Consultancy Services Ltd. 4.42
Infosys Ltd. 4.40
Gujarat State Petronet Ltd. 4.21
Container Corporation of India Ltd. 3.81
The Ramco Cements Ltd. 3.74
Ultratech Cement Ltd. 3.25
Total Top 10 Holdings 44.67
Total - Equity 97.52
Cash & Cash Receivables 2.48
Total 100.00
1.00
1.06
1.39
1.88
1.99
2.16
2.16
2.34
2.44
3.16
6.50
7.21
8.33
9.03
10.43
11.25
11.96
13.22
0.00 2.00 4.00 6.00 8.00 10.00 12.00 14.00
Commercial Services
Textile Products
Healthcare Services
Pharmaceuticals
Finance
Telecom - Equipment & Accessories
Chemicals
Consumer Durables
Pesticides
Industrial Capital Goods
Transportation
Auto
Industrial Products
Auto Ancillaries
Consumer Non Durables
Cement
Software
Gas
As on 30th June 2017
Note: Mr. Sadanand Shetty has since resigned from the services of the Company and Mr. Prasanna Pathak has been appointed as the new Fund Manager – Equity w.e.f June 30, 2017.
3
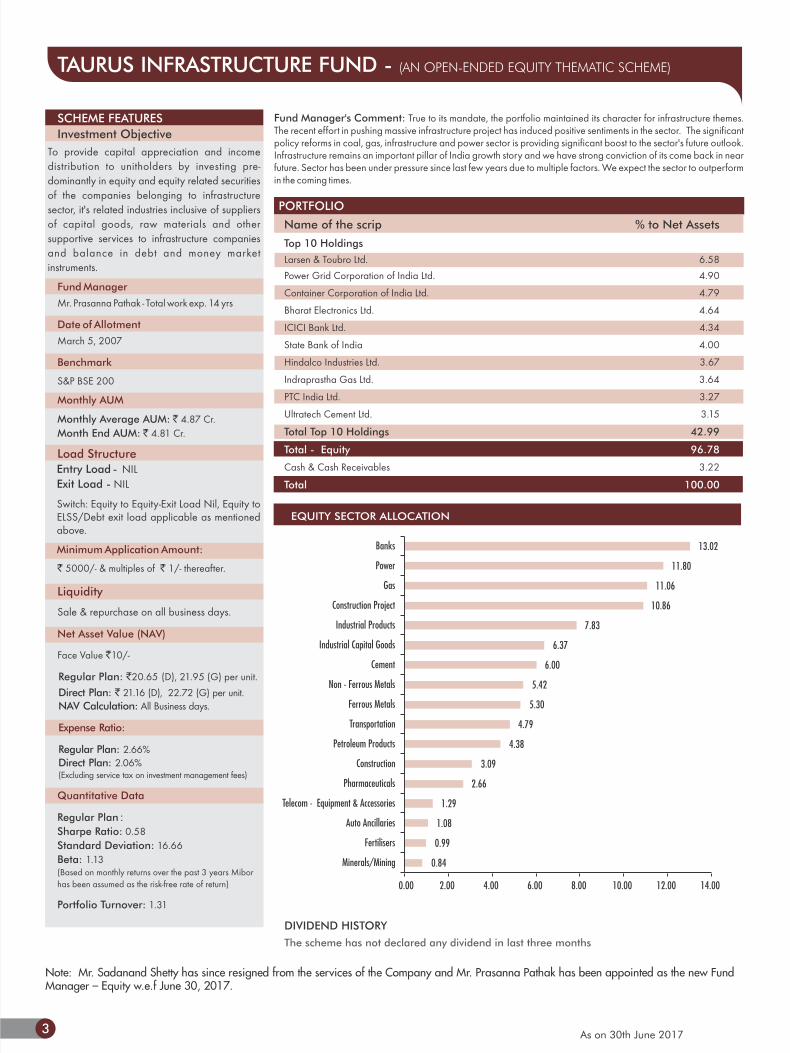
TAURUS INFRASTRUCTURE FUND - (AN OPEN-ENDED EQUITY THEMATIC SCHEME)
Fund Manager's Comment: True to its mandate, the portfolio maintained its character for infrastructure themes. The recent effort in pushing massive infrastructure project has induced positive sentiments in the sector. The significant policy reforms in coal, gas, infrastructure and power sector is providing significant boost to the sector's future outlook. Infrastructure remains an important pillar of India growth story and we have strong conviction of its come back in near future. Sector has been under pressure since last few years due to multiple factors. We expect the sector to outperform in the coming times.
PORTFOLIO
EQUITY SECTOR ALLOCATION
DIVIDEND HISTORY
The scheme has not declared any dividend in last three months
SCHEME FEATURES
Investment Objective
To provide capital appreciation and income
distribution to unitholders by investing pre-
dominantly in equity and equity related securities
of the companies belonging to infrastructure
sector, it's related industries inclusive of suppliers
of capital goods, raw materials and other
supportive services to infrastructure companies
and balance in debt and money market
instruments.
Fund Manager
Mr. Prasanna Pathak - Total work exp. 14 yrs
Date of Allotment
March 5, 2007
Benchmark
S&P BSE 200
Monthly AUM
Monthly Average AUM: ` 4.87 Cr.
Month End AUM: ` 4.81 Cr.
Load Structure
Entry Load - NIL
Exit Load - NIL
Switch: Equity to Equity-Exit Load Nil, Equity to ELSS/Debt exit load applicable as mentioned above.
Minimum Application Amount:
` 5000/- & multiples of ` 1/- thereafter.
Liquidity
Sale & repurchase on all business days.
Net Asset Value (NAV)
Face Value `10/-
Regular Plan: `20.65 (D), 21.95 (G) per unit.
Direct Plan: ` 21.16 (D), 22.72 (G) per unit.
NAV Calculation: All Business days.
Expense Ratio:
Regular Plan: 2.66%
Direct Plan: 2.06% (Excluding service tax on investment management fees)
Quantitative Data
Regular Plan :
Sharpe Ratio: 0.58
Standard Deviation: 16.66
Beta: 1.13 (Based on monthly returns over the past 3 years Mibor
has been assumed as the risk-free rate of return)
Portfolio Turnover: 1.31
Name of the scrip % to Net Assets
Top 10 Holdings
Larsen & Toubro Ltd. 6.58
Power Grid Corporation of India Ltd. 4.90
Container Corporation of India Ltd. 4.79
Bharat Electronics Ltd. 4.64
ICICI Bank Ltd. 4.34
State Bank of India 4.00
Hindalco Industries Ltd. 3.67
Indraprastha Gas Ltd. 3.64
PTC India Ltd. 3.27
Ultratech Cement Ltd. 3.15
Total Top 10 Holdings 42.99
Total - Equity 96.78
Cash & Cash Receivables 3.22
Total 100.00
0.84
0.99
1.08
1.29
2.66
3.09
4.38
4.79
5.30
5.42
6.00
6.37
7.83
10.86
11.06
11.80
13.02
0.00 2.00 4.00 6.00 8.00 10.00 12.00 14.00
Minerals/Mining
Fertilisers
Auto Ancillaries
Telecom - Equipment & Accessories
Pharmaceuticals
Construction
Petroleum Products
Transportation
Ferrous Metals
Non - Ferrous Metals
Cement
Industrial Capital Goods
Industrial Products
Construction Project
Gas
Power
Banks
As on 30th June 2017
Note: Mr. Sadanand Shetty has since resigned from the services of the Company and Mr. Prasanna Pathak has been appointed as the new Fund Manager – Equity w.e.f June 30, 2017.

4
TAURUS TAX SHIELD - (AN OPEN-ENDED EQUITY LINKED SAVING SCHEME (ELSS))
Fund Manager's Comment: The scheme will try to invest in emerging themes in the next few years and play it through a blend of mid-cap and large cap stocks. For example, the Indian government's ambitious target of doubling farm income by 2022 should benefit stocks in the rural theme. Similarly, GST will lead to formalisation of economy and benefit sectors where the share of unorganised players is higher. Again, government's 'Housing for All' project will benefit cement, building material players and Housing Finance companies. The scheme will try to construct a portfolio in-and-around such emerging themes.
PORTFOLIO
EQUITY SECTOR ALLOCATION
DIVIDEND HISTORY
The scheme has not declared any dividend in last three months
SCHEME FEATURES
Investment Objective
To provide long term capital appreciation over the
life of the scheme through investment pre-
dominantly in equity shares, besides tax benefits.
Fund Manager
Mr. Prasanna Pathak - Total work exp. 14 yrs
Date of Allotment
March 31, 1996
Benchmark
S&P BSE 200
Monthly AUM
Monthly Average AUM: ` 54.20 Cr.
Month End AUM: ` 53.09 Cr.
Load Structure
Entry Load - NIL
Exit Load - Up to any amount (Including SIP) : NA (lock - in period of 3 years)
Switch to any (Debt/Equity) schemes after 3 years; Exit Load : Nil.
Minimum Application Amount:
` 500/- & multiples of ` 500/- thereafter.
Liquidity
Sale on all business days. As per Income Tax
Laws, the redemption facility is available after a
lock-in period of 3 years from the date of
investment.
Net Asset Value (NAV)
Face Value `10/-
Regular Plan: ` 31.36 (D), 66.95 (G) per unit.
Direct Plan: ` 31.89 (D), 69.19 (G) per unit.
NAV Calculation: All Business days.
Expense Ratio:
Regular Plan: 2.67%
Direct Plan: 2.27% (Excluding service tax on investment management fees)
Quantitative Data
Regular Plan :
Sharpe Ratio: 0.70
Standard Deviation: 14.56 Beta: 1.07 (Based on monthly returns over the past 3 years Mibor
has been assumed as the risk-free rate of return)
Portfolio Turnover: 0.94
Name of the scrip % to Net Assets
Top 10 Holdings
HDFC Bank Ltd. 6.84
ITC Ltd. 6.16
Maruti Suzuki India Ltd. 5.81
Housing Development Finance Corporation Ltd. 5.47
Reliance Industries Ltd. 5.13
ICICI Bank Ltd. 4.64
Larsen & Toubro Ltd. 3.93
L&T Finance Holdings Ltd. 3.89
NCC Ltd. 2.86
The Ramco Cements Ltd. 2.78
Total Top 10 Holdings 47.50
Total - Equity 97.93
Cash & Cash Receivables 2.07
Total 100.00
0.67
0.98
1.04
1.11
1.11
1.59
1.65
1.95
2.06
2.26
2.34
4.74
5.13
5.31
5.32
6.79
7.62
11.47
14.38
20.41
0.00 5.00 10.00 15.00 20.00 25.00
Consumer Durables
Ferrous Metals
Gas
Minerals/Mining
Fertilisers
Healthcare Services
Non - Ferrous Metals
Construction
Pharmaceuticals
Chemicals
Software
Cement
Petroleum Products
Power
Auto Ancillaries
Construction Project
Auto
Consumer Non Durables
Finance
Banks
As on 30th June 2017
Note: Mr. Sadanand Shetty has since resigned from the services of the Company and Mr. Prasanna Pathak has been appointed as the new Fund Manager – Equity w.e.f June 30, 2017.

5
TAURUS NIFTY INDEX FUND - (AN OPEN-ENDED INDEX LINKED EQUITY SCHEME)
Fund Manager's Comment: The index fund continues to track the performance of its benchmark indices Nifty. The fund portfolio consists of the stocks in the same weight as they are in the Nifty Index. The strategy of the investment is to mirror the index return by minimizing the tracking error with its benchmark.
PORTFOLIO
EQUITY SECTOR ALLOCATION
DIVIDEND HISTORY
The scheme has not declared any dividend in last three months
SCHEME FEATURES
Investment Objective
The investment objective of the scheme is to
replicate the S&P Nifty 50 by investing in
securities of the Nifty 50 in the same proportion/
weightage.
Fund Manager
Mr. Prasanna Pathak - Total work exp. 14 yrs
Date of Allotment
June 19, 2010
Benchmark
Nifty 50
Monthly AUM
Monthly Average AUM: ` 0.38 Cr.
Month End AUM: ` 0.38 Cr.
Load Structure Entry Load - NIL
Exit Load - Up to any amount (Including SIP )
0.5% if exited on or before 30 days. Nil if exited after 30 days
Switch: Equity to Equity-Exit Load Nil, Equity to ELSS/Debt exit load applicable as mentioned above.
Minimum Application Amount:
` 5000/- & multiples of ` 1/- thereafter.
Liquidity
Sale & repurchase on all business days.
Net Asset Value (NAV)
Face Value `10/-
Regular Plan: ̀ 17.5773 (D), 17.5773(G) per unit.
Direct Plan: ̀ 18.0559 (D), 18.2736 (G) per unit.
NAV Calculation: All Business days.
Expense Ratio:
Regular Plan: 1.48%
Direct Plan: 0.98% (Excluding service tax on investment management fees)
Quantitative Data
Regular Plan :
Sharpe Ratio: 0.41
Standard Deviation: 13.19
Beta: 0.99 (Based on monthly returns over the past 3 years Mibor
has been assumed as the risk-free rate of return)
Portfolio Turnover: 1.21
Tracking Error : 0.66
Name of the scrip % to Net Assets
Top 10 Holdings
HDFC Bank Ltd. 9.16
ITC Ltd. 7.44
Housing Development Finance Corporation Ltd. 7.03
Reliance Industries Ltd. 6.19
Infosys Ltd. 5.06
ICICI Bank Ltd. 5.02
Larsen & Toubro Ltd. 3.81
Tata Consultancy Services Ltd. 3.45
Kotak Mahindra Bank Ltd. 3.12
Maruti Suzuki India Ltd. 2.49
Total Top 10 Holdings 52.77
Total - Equity 97.47
Cash & Cash Receivables 2.53
Total 100.00
0.55
0.64
0.76
0.80
0.86
1.00
1.20
1.24
1.40
1.59
1.89
2.71
3.81
4.56
7.94
8.24
9.81
11.02
11.46
26.01
0.00 5.00 10.00 15.00 20.00 25.00 30.00
Telecom - Equipment & Accessories
Gas
Media & Entertainment
Transportation
Minerals/Mining
Ferrous Metals
Oil
Auto Ancillaries
Telecom - Services
Non - Ferrous Metals
Cement
Power
Construction Project
Pharmaceuticals
Finance
Petroleum Products
Auto
Consumer Non Durables
Software
Banks
As on 30th June 2017
Note: Mr. Sadanand Shetty has since resigned from the services of the Company and Mr. Prasanna Pathak has been appointed as the new Fund Manager – Equity w.e.f June 30, 2017.

6
TAURUS BONANZA FUND - (AN OPEN-ENDED EQUITY SCHEME WITH A LARGE CAP FOCUS)
Fund Manager's Comment: Scheme has bias towards high quality large cap stocks with overweight position in BFSI and rural consumption plays. The sustained regulatory change and positive policy frame work coupled with economic recovery should prove to be tailwind for the stocks in the BFSI sector. The Indian government's ambitious target of doubling farm income by 2022 should benefit stocks in the rural theme. Increase in weight in the cyclical commodity sector is tactical in nature.
PORTFOLIO
EQUITY SECTOR ALLOCATION
SCHEME FEATURES
Investment Objective
Taurus Bonanza Fund is an open-end growth
scheme. The investment objective is to provide
investors long-term capital appreciation.
Investments shall be primarily in Equity and Equity
related instruments that offer scope for long-term
capital appreciation. The Fund will also be
invested in debt and money market instruments.
Fund Manager
Mr. Prasanna Pathak - Total work exp. 14 yrs
Date of Allotment
February 28, 1995
Benchmark
S&P BSE 100
Monthly AUM
Monthly Average AUM: ` 76.01 Cr.
Month End AUM: ` 75.20 Cr.
Load Structure
Entry Load - NIL
Exit Load - NIL
Switch: Equity to Equity-Exit Load Nil, Equity to ELSS/Debt exit load applicable as mentioned above.
Minimum Application Amount:
` 5000/- & multiples of ` 1/- thereafter.
Liquidity
Sale & repurchase on all business days.
Net Asset Value (NAV)
Face Value `10/-
Regular Plan:` 49.61 (D), 69.45 (G) per unit.
Direct Plan: ` 50.90 (D), 72.06 (G) per unit.
NAV Calculation: All Business days.
Expense Ratio:
Regular Plan: 2.69%
Direct Plan: 1.94% (Excluding service tax on investment management fees)
Quantitative Data
Regular Plan :
Sharpe Ratio: 0.56
Standard Deviation: 14.20
Beta: 1.03 (Based on monthly returns over the past 3 years Mibor
has been assumed as the risk-free rate of return)
Portfolio Turnover: 2.55
Month & Year Regular Plan Direct Plan Gross Dividend per unit(`) Gross Dividend Per unit(`)
March 2017 18.00 18.00September 2016 1.00 1.00
DIVIDEND HISTORY
Pursuant to payment of dividend, the NAV of the Scheme will fall to the extent of the dividend and statutory levy, if any. Past performance may or may not be sustained in the future.All dividends are on face value of `10 per unit. For complete details of the dividend declared please log on to www.taurusmutualfund.com
Name of the scrip % to Net Assets
Top 10 Holdings
ITC Ltd. 8.43
HDFC Bank Ltd. 7.93
Housing Development Finance Corporation Ltd. 7.39
Reliance Industries Ltd. 6.84
ICICI Bank Ltd. 6.15
Larsen & Toubro Ltd. 5.27
Maruti Suzuki India Ltd. 4.84
Ultratech Cement Ltd. 4.29
Bajaj Auto Ltd. 4.04
Zee Entertainment Enterprises Ltd. 2.87
Total Top 10 Holdings 58.06
Total - Equity 97.09
Cash & Cash Receivables 2.91
Total 100.00
1.04
1.15
1.32
1.48
1.75
2.01
2.87
3.09
3.33
5.27
6.84
7.57
10.30
10.68
14.17
24.22
0.00 5.00 10.00 15.00 20.00 25.00 30.00
Ferrous Metals
Telecom - Equipment & Accessories
Consumer Durables
Fertilisers
Power
Non - Ferrous Metals
Media & Entertainment
Industrial Products
Software
Construction Project
Petroleum Products
Cement
Finance
Consumer Non Durables
Auto
Banks
As on 30th June 2017
Note: Mr. Sadanand Shetty has since resigned from the services of the Company and Mr. Prasanna Pathak has been appointed as the new Fund Manager – Equity w.e.f June 30, 2017.

7
TAURUS DISCOVERY FUND - (AN OPEN-ENDED EQUITY FUND WITH MID CAP AND SMALL CAP FOCUS)
Fund Manager's Comment: Scheme has bias towards undervalued mid-cap stocks with overweight position in BFSI, rural consumption plays, industrials and commodities. We have positioned our portfolio across these themes and companies that will have sustainable growth in coming years. We see larger upside to these ideas than some of the large well run efficient companies.
PORTFOLIO
EQUITY SECTOR ALLOCATION
SCHEME FEATURES
Investment Objective
The primary objective of the Scheme is to identify and select low priced stocks through price discovery mechanism, which would broadly include: • To capitalise on available opportunity on growth potential offered by undervalued penny stocks. • Such stocks being low priced and if dividend paying, decent dividend yield will give desired cushion in the volatile capital market.• Lower side risk is minimum in such investments.• Many of such cases where investment will be made, may be turnaround cases, therefore, greater potential for improvement in NAV.
Fund Manager
Mr. Prasanna Pathak - Total work exp. 14 yrs
Date of Allotment
September 5, 1994
Benchmark
Nifty Free Float Midcap 100
Benchmark Index renamed w.e.f. 28/03/2016
Monthly AUM
Monthly Average AUM: ` 43.92 Cr.
Month End AUM: ` 43.57 Cr.
Load Structure
Entry Load - NIL
Exit Load - Upto any amount (Including SIP): • 0.5% if exited on or before 180 days • Nil if exited after 180 days
Switch: Equity to Equity-Exit Load Nil, Equity to ELSS/Debt exit load applicable as mentioned above.
Minimum Application Amount:
` 5000/- & multiples of ` 1/- thereafter.
Liquidity
Sale & repurchase on all business days.
Net Asset Value (NAV)
Face Value `10/-
Regular Plan: ` 35.05 (D), 39.33 (G) per unit.
Direct Plan: ` 35.74 (D), 40.21 (G) per unit.
NAV Calculation: All Business days.
Expense Ratio:
Regular Plan: 2.68%
Direct Plan: 2.33% (Excluding service tax on investment management fees)
Quantitative Data
Regular Plan :
Sharpe Ratio: 0.97
Standard Deviation: 17.48
Beta: 1.10 (Based on monthly returns over the past 3 years Mibor
has been assumed as the risk-free rate of return)
Portfolio Turnover: 1.99
DIVIDEND HISTORY
Pursuant to payment of dividend, the NAV of the Scheme will fall to the extent of the dividend and statutory levy, if any. Past performance may or may not be sustained in the future.All dividends are on face value of `10 per unit. For complete details of the dividend declared please log on to www.taurusmutualfund.com
Month & Year Regular Plan Direct Plan Gross Dividend per unit(`) Gross Dividend Per unit(`)
December 2016 3.50 3.50
Name of the scrip % to Net Assets
Top 10 Holdings
L&T Finance Holdings Ltd. 4.99
Tata Chemicals Ltd. 4.90
Godrej Industries Ltd. 4.57
Bharat Electronics Ltd. 3.99
Aditya Birla Nuvo Ltd. 3.72
The South Indian Bank Ltd. 3.60
Motherson Sumi Systems Ltd. 3.31
NCC Ltd. 3.20
The Ramco Cements Ltd. 3.17
Piramal Enterprises Ltd. 3.00
Total Top 10 Holdings 38.44
Total - Equity 96.55
Cash & Cash Receivables 3.45
Total 100.00
0.49
0.80
0.96
1.59
2.12
2.44
2.65
3.17
3.20
3.72
4.03
4.08
4.64
6.06
6.59
7.15
7.28
10.48
11.09
14.02
0.00 2.00 4.00 6.00 8.00 10.00 12.00 14.00 16.00
Media & Entertainment
Consumer Durables
Pesticides
Healthcare Services
Non - Ferrous Metals
Construction
Hotels, Resorts And Other Recreational Activities
Cement
Construction Project
Services
Pharmaceuticals
Transportation
Power
Chemicals
Consumer Non Durables
Industrial Capital Goods
Gas
Banks
Auto Ancillaries
Finance
As on 30th June 2017
Note: Mr. Sadanand Shetty has since resigned from the services of the Company and Mr. Prasanna Pathak has been appointed as the new Fund Manager – Equity w.e.f June 30, 2017.

8
TAURUS BANKING & FINANCIAL SERVICES FUND-(AN OPEN-ENDED SECTORAL EQUITY SCHEME)
Fund Manager's Comment: Our overcall call has been inspired by the revival of the demand in the areas of specific focus by Government. We have added few more NBFC's to take advantage of this. We have maintained a positive bias on Private Banks given their resilience to generate profitability in stressed times. In PSU banks the exposure has been restricted to larger players with relatively improving asset quality outlook and faster prospects of stabilisation.
PORTFOLIO
EQUITY SECTOR ALLOCATION
DIVIDEND HISTORY
The scheme has not declared any dividend in last three months
SCHEME FEATURES
Investment Objective
The primary objective of the Scheme is to
generate capital appreciation through a portfolio
that invests predominantly in equity and equity
related instruments of Banking, Financial and Non
Banking Financial Companies that form a part of
the BFSI Sector. However, there is no assurance or
guarantee that the objectives of the scheme will be
realized and the scheme does not assure or
guarantee any returns.
Fund Manager
Mr. Prasanna Pathak - Total work exp. 14 yrs
Date of Allotment
May 22, 2012
Benchmark
S&P BSE Bankex
Monthly AUM
Monthly Average AUM: ` 6.52 Cr.
Month End AUM: ` 6.36 Cr.
Load Structure
Entry Load - NIL
Exit Load - NIL
Switch: Equity to Equity-Exit Load Nil, Equity to ELSS/Debt exit load applicable as mentioned above.
Minimum Application Amount:
` 5000/- & multiples of ` 1/- thereafter.
Liquidity
Sale & repurchase on all business days.
Net Asset Value (NAV)
Face Value `10/-
Regular Plan: ` 18.80 (D), 21.02 (G) per unit.
Direct Plan: ` 21.79 (D), 22.05 (G) per unit.
NAV Calculation: All Business days.
Expense Ratio:
Regular Plan:2.67%
Direct Plan: 1.82% (Excluding service tax on investment management fees)
Quantitative Data
Regular Plan :
Sharpe Ratio: 0.48
Standard Deviation: 18.36
Beta: 0.94 (Based on monthly returns over the past 3 years Mibor
has been assumed as the risk-free rate of return)
Portfolio Turnover: 0.62
Name of the scrip % to Net Assets
Top 10 Holdings
HDFC Bank Ltd. 22.16
ICICI Bank Ltd. 21.66
Kotak Mahindra Bank Ltd. 10.64
State Bank of India 9.68
Axis Bank Ltd. 7.36
IndusInd Bank Ltd. 5.69
Aditya Birla Nuvo Ltd. 2.66
Bank of Baroda 2.47
Yes Bank Ltd. 2.29
The South Indian Bank Ltd. 2.14
Total Top 10 Holdings 86.75
Total - Equity 98.52
Cash & Cash Receivables 1.48
Total 100.00
2.66
8.85
87.01
0.00 10.00 20.00 30.00 40.00 50.00 60.00 70.00 80.00 90.00 100.00
Services
Finance
Banks
As on 30th June 2017
Note: Mr. Sadanand Shetty has since resigned from the services of the Company and Mr. Prasanna Pathak has been appointed as the new Fund Manager – Equity w.e.f June 30, 2017.

9
TAURUS ULTRA SHORT TERM BOND FUND - (AN OPEN-ENDED DEBT SCHEME)
PORTFOLIO
Asset Allocation
Rating Profile
CBLO
Cash & Cash Receivables
SCHEME FEATURES
Investment Objective
To generate returns with higher liquidity and low
volatility from a portfolio of money market and
debt instruments. However, there is no assurance
that the investment objective of the scheme will be
realised.
Fund Manager
Mr. Dheeraj Singh - Total work exp. 24 yrs
Date of Allotment
December 1, 2008
Benchmark
Crisil Liquid Fund Index
Monthly AUM
Monthly Average AUM: ` 17.63 Cr.
Month End AUM: ` 17.54 Cr.
Load Structure
Entry Load - NIL
Exit Load - NIL Switch to any (Debt/Equity) schemes; Exit Load Nil
Minimum Application Amount:
` 5000/- & multiples of ` 1/- thereafter.
Liquidity
Sale & repurchase on all business days.
Net Asset Value (NAV)
Face Value `10/-
Regular Plan:
Retail ` 900.7470 (D), 1686.7310 (G),
901.3147 (W) per unit.
Super Institutional ` 899.6248 (D),
1752.5793 (G), 900.5094 (W) per unit.
Direct Plan:
Super Institutional ` 901.7104 (D), 1777.1912 (G), 902.6594 (W) per unit.
NAV Calculation: All Business days.
Expense Ratio:
Regular Plan: 0.75%
Direct Plan: 0.10% (Excluding service tax on investment management fees)
Quantitative Data
Portfolio Yield : 6.14%
Average Maturity Period: 0.01 years
Modified Duration : 0.01 years
Cash & Cash Receivables
CBLO
Name of the scrip Industry / Rating % to Net Assets
CBLO
The Clearing Corporation of India Ltd. 99.49
Total - CBLO 99.49
Cash & Cash Receivables 0.51
Total 100.00
99.49
0.51
99.49
0.51
Note:
1. With reference to Notice cum Addendum dated February 23, 2017, all subscriptions including SIP/STP/Switch-in applications have been
temporarily suspended till further notice.
2. Mr. Archit Shah has since resigned from the services of the Company and Mr. Dheeraj Singh, Head of Investments has been assigned additional duty to
act as the Fund Manager – Fixed Income w.e.f June 30, 2017
As on 30th June 2017

10
TAURUS LIQUID FUND - (AN OPEN-ENDED LIQUID SCHEME)
Cblo
Asset AllocationRating Profile
PORTFOLIO SCHEME FEATURES
Investment Objective
To generate steady and reasonable income, with
low risk and high level of liquidity from a portfolio
of money market securities and high quality debt.
Fund Manager
Mr. Dheeraj Singh - Total work exp. 24 yrs
Date of Allotment
August 31, 2006
Benchmark
Crisil Liquid Fund Index
Monthly AUM
Monthly Average AUM: ` 49.46 Cr.
Month End AUM: ` 48.82 Cr.
Load Structure
Entry Load - NIL
Exit Load - NIL Switch to any (Debt/Equity) schemes; Exit Load Nil
Minimum Application Amount:
` 5000/- & multiples of ` 1/- thereafter.
Liquidity
Sale & repurchase on all business days.
Net Asset Value (NAV)
Face Value `1000/- Face Value changed from `10 to `1000
w.e.f. 20/02/2010.
Historical NAV adjusted as per new Face value of `1000
Regular Plan:
Retail ` 947.4514 (D), 1941.8207 (G), per unit.
Institutional ` 1678.3573 (G) per unit.
Super Institutional ` 947.5794 (D),
1654.5802 (G), 947.9405 (W) per unit.
Direct Plan:
Super Institutional ` 947.8475 (D), 1659.3111 (G), 948.6512 (W) per unit.
NAV Calculation: All Calender days.
Institutional and Super Institutional plan introduced
w.e.f. 26/09/2008.
Retail & Institutional Plans discontinued for fresh
subscription /additional purchase /switch-in
w.e.f. 01/10/2012
Expense Ratio:
Regular Plan: 0.18%
Direct Plan: 0.10% (Excluding service tax on investment management fees)
Quantitative Data
Portfolio Yield : 6.14%
Average Maturity Period: 0.01 years
Modified Duration : 0.01 years
DIVIDEND HISTORY
The scheme has not declared any
dividend in last three months
Cash & Cash Receivables CBLO
Cash & Cash Receivables
Name of the scrip Industry / Rating % to Net Assets
CBLO
The Clearing Corporation of India Ltd. 99.12
Total - CBLO 99.12
Cash & Cash Receivables 0.88
Total 100.00
99.12
0.88
99.12
0.88
Note:
1. With reference to Notice cum Addendum dated February 23, 2017, all subscriptions including
SIP/STP/Switch-in applications have been temporarily suspended till further notice.
2. Mr. Archit Shah has since resigned from the services of the Company and Mr. Dheeraj Singh, Head of
Investments has been assigned additional duty to act as the Fund Manager – Fixed Income w.e.f June
30, 2017
As on 30th June 2017

11
TAURUS SHORT TERM INCOME FUND - (AN OPEN-ENDED BOND SCHEME)
Cblo
Asset Allocation
PORTFOLIO
DIVIDEND HISTORY
Pursuant to payment of dividend, the NAV of the Scheme will fall to the extent of the dividend and statutory levy, if any. Past performance may or may not be sustained in the future.All dividends are on face value of `10 per unit. For complete details of the dividend declared please log on to www.taurusmutualfund.com
Month & Year Regular Plan Direct Plan Gross Dividend per unit(`) Gross Dividend Per unit(`)
February 2017 2.2642 2.4987January 2017 10.3737 10.6684December 2016 4.3716 4.6631
SCHEME FEATURES
Investment Objective
To generate income and capital appreciation with
low volatility by investing in a diversified portfolio
of short term debt and money market instruments.
Fund Manager
Mr. Dheeraj Singh - Total work exp. 24 yrs
Date of Allotment
August 18, 2001
Benchmark
Crisil Short Term Bond Fund Index
Monthly AUM
Monthly Average AUM: ` 36.83 Cr.
Month End AUM: ` 35.70 Cr.
Load Structure
Entry Load - NIL Exit Load - Upto any amount (Including SIP): • 0.25% if exited on or before 30 days • Nil if exited after 30 days
Switch to any (Debt/Equity) schemes - exit load applicable as mentioned above
Minimum Application Amount:
` 5000/- & multiples of ` 1/- thereafter.
Liquidity
Sale & repurchase on all business days.
Net Asset Value (NAV)
Face Value `1000/-
Face Value changed from `10 to `1000
w.e.f. 26/04/2010.
Historical NAV adjusted as per new Face
value of ` 1000
Regular Plan: ` 1382.8735 (D), 2563.0232 (G)
per unit.
Direct Plan: ` 1383.8818 (D), 2588.8317 (G) per unit.
NAV Calculation: All Business days.
Expense Ratio:
Regular Plan: 0.30%
Direct Plan: 0.10% (Excluding service tax on investment management fees)
Quantitative Data
Portfolio Yield : 6.14%
Average Maturity Period: 0.01 years
Modified Duration : 0.01 years
Cash & Cash Receivables
*Industry exposure, scrip aum, asset aum scrip investment, asset investment not available as listing is awaited
Name of the scrip Industry / Rating % to Net Assets
CBLO
The Clearing Corporation of India Ltd. 99.31
Total - CBLO 99.31
Cash & Cash Receivables 0.69
Total 100.00
Rating Profile CBLO Cash & Cash Receivables
99.31
0.69
99.31
0.69
As on 30th June 2017
Note:
1. With reference to Notice cum Addendum dated February 23, 2017, all subscriptions including SIP/STP/Switch-in applications have been
temporarily suspended till further notice.
2. Mr. Archit Shah has since resigned from the services of the Company and Mr. Dheeraj Singh, Head of Investments has been assigned additional duty to
act as the Fund Manager – Fixed Income w.e.f June 30, 2017
12
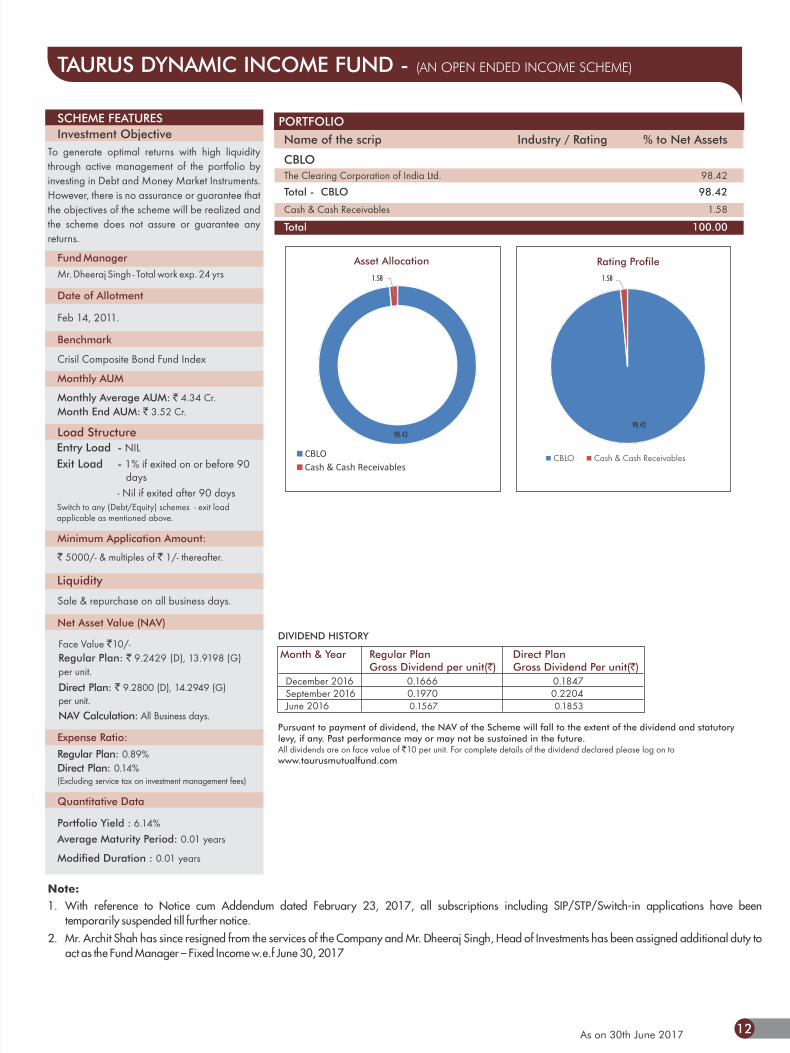
TAURUS DYNAMIC INCOME FUND - (AN OPEN ENDED INCOME SCHEME)
PORTFOLIO
Asset Allocation
DIVIDEND HISTORY
Pursuant to payment of dividend, the NAV of the Scheme will fall to the extent of the dividend and statutory levy, if any. Past performance may or may not be sustained in the future.All dividends are on face value of `10 per unit. For complete details of the dividend declared please log on to www.taurusmutualfund.com
Month & Year Regular Plan Direct Plan Gross Dividend per unit(`) Gross Dividend Per unit(`)
December 2016 0.1666 0.1847September 2016 0.1970 0.2204June 2016 0.1567 0.1853
SCHEME FEATURES
Investment Objective
To generate optimal returns with high liquidity
through active management of the portfolio by
investing in Debt and Money Market Instruments.
However, there is no assurance or guarantee that
the objectives of the scheme will be realized and
the scheme does not assure or guarantee any
returns.
Fund Manager
Mr. Dheeraj Singh - Total work exp. 24 yrs
Date of Allotment
Feb 14, 2011.
Benchmark
Crisil Composite Bond Fund Index
Monthly AUM
Monthly Average AUM: ` 4.34 Cr.
Month End AUM: ` 3.52 Cr.
Load Structure
Entry Load - NIL
Exit Load - 1% if exited on or before 90 days
- Nil if exited after 90 days Switch to any (Debt/Equity) schemes - exit load applicable as mentioned above.
Minimum Application Amount:
` 5000/- & multiples of ` 1/- thereafter.
Liquidity
Sale & repurchase on all business days.
Net Asset Value (NAV)
Face Value `10/-
Regular Plan: ` 9.2429 (D), 13.9198 (G)
per unit.
Direct Plan: ` 9.2800 (D), 14.2949 (G) per unit.
NAV Calculation: All Business days.
Expense Ratio:
Regular Plan: 0.89%
Direct Plan: 0.14% (Excluding service tax on investment management fees)
Quantitative Data
Portfolio Yield : 6.14%
Average Maturity Period: 0.01 years
Modified Duration : 0.01 years
CBLO
Cash & Cash Receivables
Name of the scrip Industry / Rating % to Net Assets
CBLO
The Clearing Corporation of India Ltd. 98.42
Total - CBLO 98.42
Cash & Cash Receivables 1.58
Total 100.00
Rating Profile
CBLO Cash & Cash Receivables
98.42
1.58
98.42
1.58
As on 30th June 2017
Note:
1. With reference to Notice cum Addendum dated February 23, 2017, all subscriptions including SIP/STP/Switch-in applications have been
temporarily suspended till further notice.
2. Mr. Archit Shah has since resigned from the services of the Company and Mr. Dheeraj Singh, Head of Investments has been assigned additional duty to
act as the Fund Manager – Fixed Income w.e.f June 30, 2017

13
SCHEME PERFORMANCE FUND MANAGER WISE (As on 30th June 2017)
Taurus Starshare - Regular Plan
Mr. Prasanna PathakDesignation: Fund Manager - Equity
Mr. Prasanna Pathak is PGDBM with 14 years of experience Prior to joining Taurus Asset Management Co. Ltd, Prasanna Pathak (Finance) from S.P. Jain, Mumbai was associated organizations like Hindustan Unilever as research analyst for 2 years, UTI Mutual Fund as Asst. Fund Manager & research analyst for 4.5 years, Taurus Mutual Fund as Fund Manager-Equity for 1.5 years & IndiaFirst Life as Fund Manager-Equity for 5.5 years
Responsibilities: At Taurus Mutual Fund, he has been managing all the Equity Schemes
Particulars 1 year 3 Years 5 years Since Inception
CAGR [%] Current Value CAGR [%] Current Value CAGR [%] Current Value CAGR [%] Current Value of Investment of Investment of Investment of Investment of Rs. 10000 Rs. 10000 of Rs. 10000 of Rs. 10000
Scheme 18.93 11,892.53 10.03 13,319.42 14.61 19,771.47 10.62 106,420.57 S&P BSE 200 (Benchmark) 18.08 11,808.36 9.91 13,276.62 14.16 19,392.03 9.45 82,978.81 Nifty 50 (Additional Benchmark) 14.88 11,487.92 7.74 12,506.26 12.50 18,024.12 8.97 74,868.13 NAV [Rs.] Per Unit (as on June 30, 2017 : 106.45) 89.51 79.90 53.80 10.00
Taurus Starshare - Direct Plan
Particulars 1 year 3 Years 5 years Since Inception
CAGR [%] Current Value CAGR [%] Current Value CAGR [%] Current Value CAGR [%] Current Value of Investment of Investment of Investment of Investment of Rs. 10000 Rs. 10000 of Rs. 10000 of Rs. 10000
Scheme 19.31 11,930.80 11.12 13,720.77 - - 12.79 17,180.57 S&P BSE 200 (Benchmark) 18.08 11,808.36 9.91 13,276.62 - - 12.47 16,961.41 Nifty 50 (Additional Benchmark) 14.88 11,487.92 7.74 12,506.26 - - 11.02 15,999.23 NAV [Rs.] Per Unit (as on June 30, 2017 : 109.99) 92.19 80.14 - 64.02
Taurus Ethical Fund - Regular Plan
Particulars 1 year 3 Years 5 years Since Inception
CAGR [%] Current Value CAGR [%] Current Value CAGR [%] Current Value CAGR [%] Current Value of Investment of Investment of Investment of Investment of Rs. 10000 Rs. 10000 of Rs. 10000 of Rs. 10000
Scheme 8.86 10,885.92 9.25 13,038.87 14.90 20,026.57 19.41 43,109.05 S&P BSE 500 Shariah (Benchmark) 8.12 10,812.06 10.87 13,629.17 14.99 20,100.83 15.58 32,974.60 Nifty 50 (Additional Benchmark) 14.88 11,487.92 7.74 12,506.26 12.50 18,024.12 13.90 29,225.28 NAV [Rs.] Per Unit (as on June 30, 2017 : 43.13) 39.62 33.07 21.52 10.00
Taurus Ethical Fund - Direct Plan
Particulars 1 year 3 Years 5 years Since Inception
CAGR [%] Current Value CAGR [%] Current Value CAGR [%] Current Value CAGR [%] Current Value of Investment of Investment of Investment of Investment of Rs. 10000 Rs. 10000 of Rs. 10000 of Rs. 10000
Scheme 9.77 10,976.87 10.08 13,340.79 - - 15.37 19,015.35 S&P BSE 500 Shariah (Benchmark) 8.12 10,812.06 10.87 13,629.17 - - 14.70 18,529.43 Nifty 50 (Additional Benchmark) 14.88 11,487.92 7.74 12,506.26 - - 11.02 15,999.23 NAV [Rs.] Per Unit (as on June 30, 2017 : 44.61) 40.64 33.43 - 23.46
Taurus Infrastructure Fund - Regular Plan
Particulars 1 year 3 Years 5 years Since Inception
CAGR [%] Current Value CAGR [%] Current Value CAGR [%] Current Value CAGR [%] Current Value of Investment of Investment of Investment of Investment of Rs. 10000 Rs. 10000 of Rs. 10000 of Rs. 10000
Scheme 22.83 12,283.16 10.28 13,413.27 13.77 19,056.90 7.91 21,945.42 S&P BSE 200 (Benchmark) 18.08 11,808.36 9.91 13,276.62 14.16 19,392.03 10.55 28,186.59 Nifty 50 (Additional Benchmark) 14.88 11,487.92 7.74 12,506.26 12.50 18,024.12 9.94 26,613.81 NAV [Rs.] Per Unit (as on June 30, 2017 : 21.95) 17.87 16.36 11.51 10.00
Taurus Infrastructure Fund - Direct Plan
Particulars 1 year 3 Years 5 years Since Inception
CAGR [%] Current Value CAGR [%] Current Value CAGR [%] Current Value CAGR [%] Current Value of Investment of Investment of Investment of Investment of Rs. 10000 Rs. 10000 of Rs. 10000 of Rs. 10000
Scheme 23.75 12,374.73 11.35 13,807.48 - - 13.57 17,722.31 S&P BSE 200 (Benchmark) 18.08 11,808.36 9.91 13,276.62 - - 12.47 16,961.41 Nifty 50 (Additional Benchmark) 14.88 11,487.92 7.74 12,506.26 - - 11.02 15,999.23 NAV [Rs.] Per Unit (as on June 30, 2017 : 22.72) 18.36 16.45 - 12.82
14
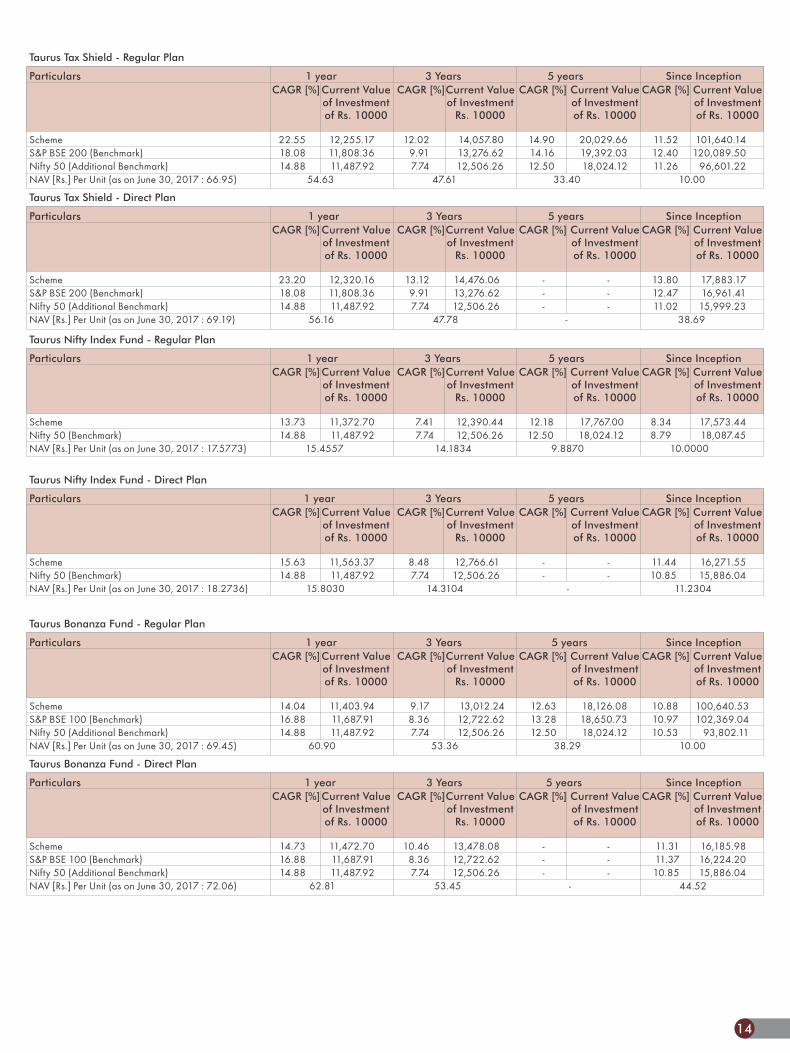
Taurus Tax Shield - Regular Plan
Particulars 1 year 3 Years 5 years Since Inception
CAGR [%] Current Value CAGR [%] Current Value CAGR [%] Current Value CAGR [%] Current Value of Investment of Investment of Investment of Investment of Rs. 10000 Rs. 10000 of Rs. 10000 of Rs. 10000
Scheme 22.55 12,255.17 12.02 14,057.80 14.90 20,029.66 11.52 101,640.14 S&P BSE 200 (Benchmark) 18.08 11,808.36 9.91 13,276.62 14.16 19,392.03 12.40 120,089.50 Nifty 50 (Additional Benchmark) 14.88 11,487.92 7.74 12,506.26 12.50 18,024.12 11.26 96,601.22 NAV [Rs.] Per Unit (as on June 30, 2017 : 66.95) 54.63 47.61 33.40 10.00
Taurus Tax Shield - Direct Plan
Particulars 1 year 3 Years 5 years Since Inception
CAGR [%] Current Value CAGR [%] Current Value CAGR [%] Current Value CAGR [%] Current Value of Investment of Investment of Investment of Investment of Rs. 10000 Rs. 10000 of Rs. 10000 of Rs. 10000
Scheme 23.20 12,320.16 13.12 14,476.06 - - 13.80 17,883.17 S&P BSE 200 (Benchmark) 18.08 11,808.36 9.91 13,276.62 - - 12.47 16,961.41 Nifty 50 (Additional Benchmark) 14.88 11,487.92 7.74 12,506.26 - - 11.02 15,999.23 NAV [Rs.] Per Unit (as on June 30, 2017 : 69.19) 56.16 47.78 - 38.69
Taurus Nifty Index Fund - Regular Plan
Particulars 1 year 3 Years 5 years Since Inception
CAGR [%] Current Value CAGR [%] Current Value CAGR [%] Current Value CAGR [%] Current Value of Investment of Investment of Investment of Investment of Rs. 10000 Rs. 10000 of Rs. 10000 of Rs. 10000
Scheme 13.73 11,372.70 7.41 12,390.44 12.18 17,767.00 8.34 17,573.44 Nifty 50 (Benchmark) 14.88 11,487.92 7.74 12,506.26 12.50 18,024.12 8.79 18,087.45 NAV [Rs.] Per Unit (as on June 30, 2017 : 17.5773) 15.4557 14.1834 9.8870 10.0000
Taurus Nifty Index Fund - Direct Plan
Particulars 1 year 3 Years 5 years Since Inception
CAGR [%] Current Value CAGR [%] Current Value CAGR [%] Current Value CAGR [%] Current Value of Investment of Investment of Investment of Investment of Rs. 10000 Rs. 10000 of Rs. 10000 of Rs. 10000
Scheme 15.63 11,563.37 8.48 12,766.61 - - 11.44 16,271.55 Nifty 50 (Benchmark) 14.88 11,487.92 7.74 12,506.26 - - 10.85 15,886.04 NAV [Rs.] Per Unit (as on June 30, 2017 : 18.2736) 15.8030 14.3104 - 11.2304
Taurus Bonanza Fund - Regular Plan
Particulars 1 year 3 Years 5 years Since Inception
CAGR [%] Current Value CAGR [%] Current Value CAGR [%] Current Value CAGR [%] Current Value of Investment of Investment of Investment of Investment of Rs. 10000 Rs. 10000 of Rs. 10000 of Rs. 10000
Scheme 14.04 11,403.94 9.17 13,012.24 12.63 18,126.08 10.88 100,640.53 S&P BSE 100 (Benchmark) 16.88 11,687.91 8.36 12,722.62 13.28 18,650.73 10.97 102,369.04 Nifty 50 (Additional Benchmark) 14.88 11,487.92 7.74 12,506.26 12.50 18,024.12 10.53 93,802.11 NAV [Rs.] Per Unit (as on June 30, 2017 : 69.45) 60.90 53.36 38.29 10.00
Taurus Bonanza Fund - Direct Plan
Particulars 1 year 3 Years 5 years Since Inception
CAGR [%] Current Value CAGR [%] Current Value CAGR [%] Current Value CAGR [%] Current Value of Investment of Investment of Investment of Investment of Rs. 10000 Rs. 10000 of Rs. 10000 of Rs. 10000
Scheme 14.73 11,472.70 10.46 13,478.08 - - 11.31 16,185.98 S&P BSE 100 (Benchmark) 16.88 11,687.91 8.36 12,722.62 - - 11.37 16,224.20 Nifty 50 (Additional Benchmark) 14.88 11,487.92 7.74 12,506.26 - - 10.85 15,886.04 NAV [Rs.] Per Unit (as on June 30, 2017 : 72.06) 62.81 53.45 - 44.52

15
• Past performance may or may not be sustained in the future. Returns are calculated on compounded annualised basis (CAGR).
• Returns are given separately for Regular & Direct Plan - Growth option. Different Plans shall have different expense structure.
• Direct Plan was introduced for all schemes w.e.f. January 1, 2013 and have not been in existence for more than 5 years, no returns are available.
• Taurus Banking & Financial Services Fund - Regular Plan has not been in existence for more than 5 years, no returns are available.
Taurus Discovery Fund - Direct Plan
Particulars 1 year 3 Years 5 years Since Inception
CAGR [%] Current Value CAGR [%] Current Value CAGR [%] Current Value CAGR [%] Current Value of Investment of Investment of Investment of Investment of Rs. 10000 Rs. 10000 of Rs. 10000 of Rs. 10000
Scheme 26.89 12,688.55 18.85 16,788.21 - - 20.01 22,704.69 Nifty Free Float Midcap 100 (Benchmark) 28.32 12,832.35 16.89 15,970.38 - - 17.45 20,610.00 Nifty 50 (Additional Benchmark) 14.88 11,487.92 7.74 12,506.26 - - 11.02 15,999.23 NAV [Rs.] Per Unit (as on June 30, 2017 : 40.21) 31.69 23.94 - 17.71
Taurus Banking & Financial Services Fund - Regular Plan
Particulars 1 year 3 Years 5 years Since Inception
CAGR [%] Current Value CAGR [%] Current Value CAGR [%] Current Value CAGR [%] Current Value of Investment of Investment of Investment of Investment of Rs. 10000 Rs. 10000 of Rs. 10000 of Rs. 10000
Scheme 26.17 12,617.05 10.75 13,583.79 13.57 18,889.71 15.64 21,011.63 S&P BSE Bankex Index (Benchmark) 27.99 12,799.04 14.55 15,031.79 17.13 22,047.06 19.26 24,595.75 Nifty 50 (Additional Benchmark) 14.88 11,487.92 7.74 12,506.26 12.50 18,024.12 14.06 19,581.26 NAV [Rs.] Per Unit (as on June 30, 2017 : 21.02) 16.66 15.47 11.12 10.00
Taurus Banking & Financial Services Fund - Direct Plan
Particulars 1 year 3 Years 5 years Since Inception
CAGR [%] Current Value CAGR [%] Current Value CAGR [%] Current Value CAGR [%] Current Value of Investment of Investment of Investment of Investment of Rs. 10000 Rs. 10000 of Rs. 10000 of Rs. 10000
Scheme 27.90 12,790.02 12.41 14,202.92 - - 11.01 15,989.85 S&P BSE Bankex Index (Benchmark) 27.99 12,799.04 14.55 15,031.79 - - 13.81 17,881.75 Nifty 50 (Additional Benchmark) 14.88 11,487.92 7.74 12,506.26 - - 10.85 15,886.04 NAV [Rs.] Per Unit (as on June 30, 2017 : 22.05) 17.24 15.52 - 13.79
Taurus Discovery Fund - Regular Plan
Particulars 1 year 3 Years 5 years Since Inception
CAGR [%] Current Value CAGR [%] Current Value CAGR [%] Current Value CAGR [%] Current Value of Investment of Investment of Investment of Investment of Rs. 10000 Rs. 10000 of Rs. 10000 of Rs. 10000
Scheme 26.42 12,642.24 18.19 16,510.71 23.67 28,928.01 6.18 39,323.54 Nifty Free Float Midcap 100 (Benchmark) 28.32 12,832.35 16.89 15,970.38 19.23 24,092.97 9.56 80,401.87 Nifty 50 (Additional Benchmark) 14.88 11,487.92 7.74 12,506.26 12.50 18,024.12 8.92 70,324.28 NAV [Rs.] Per Unit (as on June 30, 2017 : 39.33) 31.11 23.81 13.58 10.00

16
Mr. Dheeraj SinghDesignation: Head of Investments and Fund Manager - Fixed Income
Mr. Dheeraj Singh is B.E (Hons), PGD in Management from IIM Bangalore with over 24 years of experience. Prior to that, he served as Head – Fixed Income with Sundaram Asset Management Company. He has extensive experience of consultancy in Banking & Financial Service industry.
Responsibilities: He is the Head - Investments for the all the Schemes of Taurus Mutual Fund. He monitors the Equity & Debt segment investments.
Taurus Ultra Short Term Bond Fund - Regular Plan
Particulars 1 year 3 Years 5 years Since Inception
CAGR [%] Current Value CAGR [%] Current Value CAGR [%] Current Value CAGR [%] Current Value of Investment of Investment of Investment of Investment of Rs. 10000 Rs. 10000 of Rs. 10000 of Rs. 10000
Scheme (6.11) 9,389.04 3.72 11,157.98 6.13 13,466.42 6.75 17,522.66 CRISIL Liquid Fund Index (Benchmark) 6.86 10,685.56 7.83 12,538.19 8.25 14,865.34 7.54 18,663.25 CRISIL 1 Year T-Bill Index (Additional Benchmark) 6.53 10,653.33 7.57 12,448.18 7.36 14,260.26 6.44 17,083.50 NAV [Rs.] Per Unit (as on June 30, 2017 : 1,752.5793) 1,866.6219 1,570.5389 1,301.0200 1,000.0000
Particulars 1 year 3 Years 5 years Since Inception
CAGR [%] Current Value CAGR [%] Current Value CAGR [%] Current Value CAGR [%] Current Value of Investment of Investment of Investment of Investment of Rs. 10000 Rs. 10000 of Rs. 10000 of Rs. 10000
Scheme (5.49) 9,451.09 4.13 11,290.07 - - 6.06 13,028.66 CRISIL Liquid Fund Index (Benchmark) 6.86 10,685.56 7.83 12,538.19 - - 8.29 14,306.10 CRISIL 1 Year T-Bill Index (Additional Benchmark) 6.53 10,653.33 7.57 12,448.18 - - 7.28 13,716.58 NAV [Rs.] Per Unit (as on June 30, 2017 : 1,777.1912) 1,880.4083 1,573.9448 - 1,364.0625
Taurus Ultra Short Term Bond Fund - Direct Plan
Fund Manager's Comment (Debt Schemes):
The consumer price inflation (CPI) index came in at 2.18% for the month of May 2017, indicating benign inflationary conditions in the economy.
The monetary policy committee (MPC) of the Reserve Bank of India (RBI) kept policy interest rates on hold during their meeting in June. Statutory Liquidity Ratio (SLR) was however reduced by 0.5%.
At least one member of the committee however wanted a 0.5% reduction in policy interest rates in view of the benign inflationary conditions in the economy. Some other members were however of the view that it was preferable to wait for the transitory effects (on inflation) to wear off before making a change in the policy interest rates.
The RBI also unexpectedly announced an open market sale of securities for the first week of July. In view of this benchmark 10 year government bond yield rose by 10 basis points from approx. 6.45% to 6.55%.
Liquidity situation within the system did not witness any material change with the surplus reducing gradually. Currency in circulation has been going up progressively and was at about INR 15.3 trn by the end of June.
The Assets under management for the fund have reduced significantly and hence it is not economical to deploy the funds in assets. Consequently, the entire fund has been invested in the CBLO segment of the overnight money market. Returns from the fund therefore mirror the overnight money market rates.
Taurus Liquid Fund - Regular Plan
Particulars 1 year 3 Years 5 years Since Inception
CAGR [%] Current Value CAGR [%] Current Value CAGR [%] Current Value CAGR [%] Current Value of Investment of Investment of Investment of Investment of Rs. 10000 Rs. 10000 of Rs. 10000 of Rs. 10000
Scheme (1.03) 9,896.75 5.28 11,668.50 6.89 13,954.89 5.91 16,543.20 Crisil liquid fund Index (Benchmark) 6.86 10,685.56 7.83 12,538.19 8.26 14,868.57 7.60 19,003.71 CRISIL 1 Year T-Bill Index (Additional Benchmark) 6.53 10,653.33 7.57 12,448.18 7.36 14,263.03 6.61 17,525.52 NAV [Rs.] Per Unit (as on June 30, 2017 : 1,654.5802) 1,671.8415 1,417.7884 1,185.4469 1,000.0000
Taurus Liquid Fund - Direct Plan
Particulars 1 year 3 Years 5 years Since Inception
CAGR [%] Current Value CAGR [%] Current Value CAGR [%] Current Value CAGR [%] Current Value of Investment of Investment of Investment of Investment of Rs. 10000 Rs. 10000 of Rs. 10000 of Rs. 10000
Scheme (0.95) 9,904.62 5.35 11,692.96 - - 6.71 13,390.58 Crisil liquid fund Index (Benchmark) 6.86 10,685.56 7.83 12,538.19 - - 8.28 14,305.68 CRISIL 1 Year T-Bill Index (Additional Benchmark) 6.53 10,653.33 7.57 12,448.18 - - 7.28 13,719.87 NAV [Rs.] Per Unit (as on June 30, 2017 : 1,659.3111) 1,675.2893 1,418.8657 - 1,238.9426

17
Taurus Dynamic Income Fund - Regular Plan
Particulars 1 year 3 Years 5 years Since Inception
CAGR [%] Current Value CAGR [%] Current Value CAGR [%] Current Value CAGR [%] Current Value of Investment of Investment of Investment of Investment of Rs. 10000 Rs. 10000 of Rs. 10000 of Rs. 10000
Scheme (7.27) 9,272.51 2.29 10,704.16 4.02 12,179.40 5.32 13,917.82 CRISIL Composite Bond Fund Index (Benchmark) 11.47 11,147.01 10.91 13,642.25 9.58 15,796.57 9.27 17,600.11 CRISIL 10 year Gilt Index (Additional Benchmark) 11.69 11,169.45 11.15 13,732.04 8.46 15,010.80 7.84 16,179.46 NAV [Rs.] Per Unit (as on June 30, 2017 : 13.9198) 15.0119 13.0033 11.4265 10.0000
Taurus Dynamic Income Fund - Direct Plan
Particulars 1 year 3 Years 5 years Since Inception
CAGR [%] Current Value CAGR [%] Current Value CAGR [%] Current Value CAGR [%] Current Value of Investment of Investment of Investment of Investment of Rs. 10000 Rs. 10000 of Rs. 10000 of Rs. 10000
Scheme (6.55) 9,344.72 2.97 10,918.43 - - 3.80 11,819.53 CRISIL Composite Bond Fund Index (Benchmark) 11.47 11,147.01 10.91 13,642.25 - - 9.47 15,005.85 CRISIL 10 year Gilt Index (Additional Benchmark) 11.69 11,169.45 11.15 13,732.04 - - 8.10 14,183.44 NAV [Rs.] Per Unit (as on June 30, 2017 : 14.2949) 15.2973 13.0914 - 12.0943
• Past performance may or may not be sustained in the future. Returns are calculated on compounded annualised basis (CAGR).
• Returns are given separately for Regular & Direct Plan - Growth option. Different Plans shall have different expense structure.
• Direct Plan was introduced for all schemes w.e.f. January 1, 2013 and have not been in existence for more than 5 years, no returns are available.
• With reference to our Notice cum Addendum dated February 23, 2017, all subscriptions including SIP/STP/Switch - in applications have been temporarily suspended till further notice.
Taurus Short Term Income Fund - Regular Plan
Particulars 1 year 3 Years 5 years Since Inception
CAGR [%] Current Value CAGR [%] Current Value CAGR [%] Current Value CAGR [%] Current Value of Investment of Investment of Investment of Investment of Rs. 10000 Rs. 10000 of Rs. 10000 of Rs. 10000
Scheme (5.68) 9,432.35 3.84 11,195.25 6.30 13,573.69 6.11 25,626.07 Crisil Short Term Bond Fund Index (Benchmark) 8.88 10,888.13 9.12 12,992.18 9.09 15,447.46 7.02 29,368.44 CRISIL 1 Year T-Bill Index (Additional Benchmark) 6.53 10,653.33 7.57 12,448.18 7.36 14,260.26 6.08 25,523.62 NAV [Rs.] Per Unit (as on June 30, 2017 : 2,563.0232) 2,717.2686 2,289.1476 1,887.5970 1,000.0000
Taurus Short Term Income Fund - Direct Plan
Particulars 1 year 3 Years 5 years Since Inception
CAGR [%] Current Value CAGR [%] Current Value CAGR [%] Current Value CAGR [%] Current Value of Investment of Investment of Investment of Investment of Rs. 10000 Rs. 10000 of Rs. 10000 of Rs. 10000
Scheme (5.43) 9,456.85 4.12 11,288.78 - - 6.10 13,050.09 Crisil Short Term Bond Fund Index (Benchmark) 8.88 10,888.13 9.12 12,992.18 - - 9.07 14,774.34 CRISIL 1 Year T-Bill Index (Additional Benchmark) 6.53 10,653.33 7.57 12,448.18 - - 7.28 13,716.58 NAV [Rs.] Per Unit (as on June 30, 2017 : 2,588.8317) 2,737.5197 2,293.0239 - 1,983.7656

18
SIP Returns in Equity Schemes - Regular Plan - Growth (As on 30th June 2017)
SIP Investments (Rs 10000 per month) Since Inception 3 Year SIP 1 Year SIPTotal Amount Invested (Rs '000) 530.00 360.00 120.00Market Value as on Month End (Rs '000) 769.14 451.07 135.41Scheme Returns(% CAGR) 18.39 16.25 27.41Benchmark Returns (S&P BSE 200) (% CAGR) 15.93 11.58 20.41Nifty 50 (% CAGR) 14.93 9.58 18.31
SIP Investments (Rs 10000 per month) Since Inception 5 Year SIP 3 Year SIP 1 Year SIPTotal Amount Invested (Rs '000) 2490.00 600.00 360.00 120.00Market Value as on Month End (Rs '000) 19713.81 848.04 422.73 132.50Scheme Returns(% CAGR) 21.97 14.85 11.30 21.98Benchmark Returns (S&P BSE 200) (% CAGR) 15.93 14.64 11.99 20.41Nifty 50 (% CAGR) 14.93 12.12 9.58 18.31
Taurus Starshare - Direct Plan
Taurus Starshare - Regular Plan
SIP Investments (Rs 10000 per month) Since Inception 3 Year SIP 1 Year SIPTotal Amount Invested (Rs '000) 530.00 360.00 120.00Market Value as on Month End (Rs '000) 704.33 402.75 125.85Scheme Returns(% CAGR) 13.76 7.03 10.02Benchmark Returns (S&P BSE 500 Shariah) (% CAGR) 27.90 11.10 4.60Nifty 50 (% CAGR) 14.93 9.58 18.31
SIP Investments (Rs 10000 per month) Since Inception 5 Year SIP 3 Year SIP 1 Year SIPTotal Amount Invested (Rs '000) 990.00 600.00 360.00 120.00Market Value as on Month End (Rs '000) 1666.65 824.71 393.38 125.32Scheme Returns(% CAGR) 13.48 13.58 6.09 9.10Benchmark Returns (S&P BSE 500 Shariah) (% CAGR) 27.90 20.20 11.10 4.60Nifty 50 (% CAGR) 14.93 12.12 9.58 18.31
Taurus Ethical Fund - Direct Plan
Taurus Ethical Fund - Regular Plan
SIP Investments (Rs 10000 per month) Since Inception 5 Year SIP 3 Year SIP 1 Year SIPTotal Amount Invested (Rs '000) 1230.00 600.00 360.00 120.00Market Value as on Month End (Rs '000) 2185.66 910.32 443.42 132.48Scheme Returns(% CAGR) 11.87 18.16 14.91 21.96Benchmark Returns (S&P BSE 200) (% CAGR) 15.93 14.64 11.55 20.41Nifty 50 (% CAGR) 15.93 12.12 9.58 18.31
Taurus Infrastructure Fund - Direct Plan
Taurus Infrastructure Fund - Regular Plan
Taurus Tax Shield - Regular PlanSIP Investments (Rs 10000 per month) Since Inception 5 Year SIP 3 Year SIP 1 Year SIPTotal Amount Invested (Rs '000) 2540.00 600.00 360.00 120.00Market Value as on Month End (Rs '000) 15342.23 884.37 444.10 135.09Scheme Returns(% CAGR) 18.52 16.80 15.02 26.82Benchmark Returns (S&P BSE 200) (% CAGR) 15.93 14.64 11.99 20.41Nifty 50 (% CAGR) 14.93 12.12 9.58 18.31
Taurus Tax Shield - Direct Plan
SIP Investments (Rs 10000 per month) Since Inception 3 Year SIP 1 Year SIPTotal Amount Invested (Rs '000) 530.00 360.00 120.00Market Value as on Month End (Rs '000) 734.33 429.22 132.61Scheme Returns(% CAGR) 15.93 12.44 22.19Benchmark Returns (S&P BSE 200) (% CAGR) 15.93 11.99 20.41Nifty 50 (% CAGR) 14.93 9.58 18.31
SIP Investments (Rs 10000 per month) Since Inception 3 Year SIP 1 Year SIPTotal Amount Invested (Rs '000) 530.00 360.00 120.00Market Value as on Month End (Rs '000) 799.08 446.21 132.98Scheme Returns(% CAGR) 20.46 15.39 22.88Benchmark Returns (S&P BSE 200) (% CAGR) 15.93 11.99 20.41Nifty 50 (% CAGR) 14.93 9.58 18.31

19
SIP Investments (Rs 10000 per month) Since Inception 3 Year SIP 1 Year SIPTotal Amount Invested (Rs '000) 530.00 360.00 120.00Market Value as on Month End (Rs '000) 689.35 417.79 131.21Scheme Returns(% CAGR) 12.66 10.43 19.61Nifty 50 (% CAGR) 14.93 9.58 18.31
SIP Investments (Rs 10000 per month) Since Inception 5 Year SIP 3 Year SIP 1 Year SIPTotal Amount Invested (Rs '000) 840.00 600.00 360.00 120.00Market Value as on Month End (Rs '000) 1202.95 790.21 409.77 129.84Scheme Returns(% CAGR) 10.80 11.65 9.02 17.13Nifty 50 (% CAGR) 14.93 12.12 9.58 18.31
Taurus Nifty Index Fund - Direct Plan
Taurus Nifty Index Fund - Regular Plan
SIP Investments (Rs 10000 per month) Since Inception 3 Year SIP 1 Year SIPTotal Amount Invested (Rs '000) 530.00 360.00 120.00Market Value as on Month End (Rs '000) 708.61 415.64 128.53Scheme Returns(% CAGR) 14.08 10.05 14.76Benchmark Returns (S&P BSE 100) (% CAGR) 15.73 10.73 19.37Nifty 50 (% CAGR) 14.93 9.58 18.31
SIP Investments (Rs 10000 per month) Since Inception 5 Year SIP 3 Year SIP 1 Year SIPTotal Amount Invested (Rs '000) 2590.00 600.00 360.00 120.00Market Value as on Month End (Rs '000) 14428.02 810.31 407.84 128.12Scheme Returns(% CAGR) 17.11 12.78 8.67 14.04Benchmark Returns (S&P BSE 100) (% CAGR) 15.73 13.21 10.73 19.37Nifty 50 (% CAGR) 14.93 12.12 9.58 18.31
Taurus Bonanza Fund - Direct Plan
Taurus Bonanza Fund - Regular Plan
SIP Investments (Rs 10000 per month) Since Inception 5 Year SIP 3 Year SIP 1 Year SIPTotal Amount Invested (Rs '000) 2510.00 600.00 360.00 120.00Market Value as on Month End (Rs '000) 12425.11 1053.67 465.12 134.88Scheme Returns(% CAGR) 16.45 25.28 18.63 26.43Benchmark (Nifty Free Float Midcap 100) Returns (% CAGR) 23.74 23.66 19.82 26.29Nifty 50 (% CAGR) 14.93 12.12 9.58 18.31
Taurus Discovery Fund - Direct Plan
Taurus Discovery Fund - Regular Plan
SIP Investments (Rs 10000 per month) Since Inception 3 Year SIP 1 Year SIPTotal Amount Invested (Rs '000) 530.00 360.00 120.00Market Value as on Month End (Rs '000) 886.25 469.29 135.14Scheme Returns(% CAGR) 26.25 19.33 26.91Benchmark (Nifty Free Float Midcap 100) Returns (% CAGR) 23.74 19.82 26.29Nifty 50 (% CAGR) 14.93 9.58 18.31
SIP Investments (Rs 10000 per month) Since Inception 5 Year SIP 3 Year SIP 1 Year SIPTotal Amount Invested (Rs '000) 610.00 600.00 360.00 120.00Market Value as on Month End (Rs '000) 894.68 873.72 447.14 139.11Scheme Returns(% CAGR) 16.27 16.23 15.55 34.49Benchmark (S&P BSE Bankex) Returns (% CAGR) 24.22 20.00 17.88 34.25Nifty 50 (% CAGR) 14.93 12.12 9.58 18.31
Taurus Banking & Financial Services Fund - Direct Plan
Taurus Banking & Financial Services Fund - Regular Plan
SIP Investments (Rs 10000 per month) Since Inception 3 Year SIP 1 Year SIPTotal Amount Invested (Rs '000) 530.00 360.00 120.00Market Value as on Month End (Rs '000) 775.15 457.56 140.26Scheme Returns(% CAGR) 18.81 17.34 36.74Benchmark (S&P BSE Bankex) Returns (% CAGR) 24.22 17.88 34.25Nifty 50 (% CAGR) 14.93 9.58 18.31
• Past performance may or may not be sustained in the future. Returns are calculated on compounded annualised basis (CAGR).
• Returns are given separately for Regular & Direct Plan - Growth option. Different Plans shall have different expense structure.
• Direct Plan was introduced for all schemes w.e.f. January 1, 2013 and have not been in existence for more than 5 years, no returns are available.
• Taurus Banking & Financial Services Fund - Regular Plan has not been in existence for more than 5 years, no returns are available.

20
Fund Manager : An employee of the asset management company such as a mutual fund or life insurer, who manages investments of the scheme. He is usually part of a larger team of fund managers and research analysts.
Application Amount for Fresh Subscription : This is the minimum investment amount for a new investor in a mutual fund scheme.
Minimum Additional Amount : This I s minimum investment amount for an existing investor in a mutual fund scheme.
Yield to Maturity : The Yield to Maturity or the YTM is the rate of return anticipated on a bond if held until maturity. YTM is expressed as an annual rate. The YTM factors in the bond’s current market price, par value, coupon interest rate and time to maturity.
SIP : SIP or systematic investment plan works on the principle of making periodic investments of a fixed sum. It works similar to a recurring bank deposit. For instance, an investor may opt for an SIP that invests Rs. 500 every 15th of the month in an equity fund for a period of three years.
NAV : The NAV or the net asset value is the total asset value per unit of the mutual fund after deducting all related and permissible expenses. The NAV is calculated at the end of every business day. It is the value at which the investor enters or exits the mutual fund.
Benchmark : A group of securities, usually a market index, whose performance is used as a standard or benchmark to measure investment performance of mutual funds, among other investments. Some typical benchmarks include the Nifty, Sensex, BSE200, BSE500, 10 - Year Gsec.
Entry Load : A Mutual fund may have a sales charge or load at the time of entry and/or exit to compensate the distributor/agent.
Entry load is charged at the time an investor purchases the units of a mutual fund. The entry load is added to the prevailing NAV at the time of investment. For instance, if the NAV is Rs. 100 and the entry load is 1%, the investor will enter the fund at Rs. 101
Note: SEBI, vide circular dated June 30, 2009 has abolished entry load and mandated that upfront commission to distributors will be paid by the investor directly to the distributor, based on his assessment of various factors including the service rendered by the distributor.
Exit Load : Exit load is charged at the time an investor redeems the units of a mutual fund. The exit load is reduced from the prevailing NAV at the time of redemption. The investor will receive redemption proceed at net value of NAV less Exit Load. For instance if the NAV is Rs. 100 and the exit load is 1% the investor will receive Rs.99.
Modified Duration : Modified duration is the price sensitivity and the percentage change in price for a unit change in yield
Standard Deviation : Standard deviation is a statistical measure of the range of an investment’s performance. When a mutual fund has a high standard deviation, its means its range of performance is wide, implying greater volatility.
Sharp Ratio : The Sharp Ratio, named after its founder, the Nobel Laureate William Sharpe, is a measure of risk-adjusted returns. It is calculated using standard deviation and excess return to determine reward per unit of risk.
Beta : Beta is a measure of an investment’s volatility vis-a-vis the market. Beta of less than 1 means that the security will be less volatile than the market. A beta of greater than 1 implies that the security’s price will be more volatile than the market.
AUM : AUM or assets under management refers to the recent / updated cumulative market value of investments managed by a mutual fund or any investment firm.
Holdings : The holdings or the portfolio is a mutual fund’s latest or updated reported statement of investments/securities. These are usually displayed in terms of percentage to net assets or the rupee value or both. The objective is to give investors an idea of where their money is being invested by the fund manger.
Nature of Scheme : The investment objective and underlying investments determine the nature of the mutual fund scheme. For instance, a mutual fund or growth fund. Likewise, a mutual fund that aims at capital preservation by investing in debt markets is a debt fund or incoem fund. Each of these categories may have sub-categories.
Rating Profile : Mutual funds invest in securities after evaluating their creditworthiness as disclosed by the rating. A depiction of the mutual fund in various investments based on their ratings becomes the rating profile of the fund. Typically, this is a feature of debt funds.
How to read Factsheet
Tax Benefits Dividend distributed by the Scheme (s) are free from Income - tax in the hands of Investors. The additional Income Tax on distribution of dividend by a debt fund
(including money market or a liquid fund) to an individual / HUF shall be payable at the rate of 28.84%* and at the rate of 34.608%* to any other investor for FY 2015 - 16. With
effect from 01/10/2014, Dividend Distribution Tax would apply on gross dividend instead of net dividend. Units of the Scheme(s) are not subject to Wealth-tax and Gift-tax. Unit
holders are required to pay Securities Transaction Tax (STT) at the rate of 0.001% at the time of redemption /switch-out of units of an equity oriented fund.*Including applicable surcharge, education cess and secondary and higher education cess.
Investors should be aware that the fiscal rules/tax laws may change and there can be no guarantee that the current tax position may continue indefinitely. In view of individual nature of tax
consequences, each investor is advised to consult his /her own professional tax advisor.
Direct Plan was introduced for all schemes with effect from January 1, 2013

CIN: U67190MH1993PLC073154Regd. Office: 305, Regent Chambers, 208, Jamnalal Bajaj Marg, Nariman Point, Mumbai - 400021
Ground Floor, AML Centre-1, 8 Mahal Industrial Estate, Mahakali Caves Road, Andheri(E), Mumbai-400 093Head Office:Tel.: 022 6624 2700 (Board) Fax 022 6624 2777
Email:[email protected] • Website: www.taurusmutualfund.com • Toll Free No. 1800 108 1111
Mutual Fund Investments are subject to market risks, read all scheme related documents carefully.
Disclaimers:
Nifty 50 Related Disclaimers (Applicable to Taurus Nifty Index Fund)
(I) "The Product(s) are not sponsored, endorsed, sold or promoted by India Index Services & Products Limited ("IISL"). IISL does not make any representation or warranty, express or implied, to the owners of the Product(s) or any member of the public regarding the advisability of investing in securities generally or in the Product(s) particularly or the ability of the Nifty 50 to track general stock market performance in India. The relationship of IISL with the Licensee is only in respect of the licensing of the indices and certain trademarks and trade names associated with such indices which is determined, composed and calculated by IISL without regard to the Licensee or the Product(s). IISL does not have any obligation to take the needs of the Licensee or the owners of the Product(s) into consideration in determining, composing or calculating the Nifty 50. IISL is not responsible for has participated in the determination of the timing of, prices at, or quantities of the Product(s) to be issued or in the determination or calculation of the equation by which the Product(s) is to be converted into cash. IISL has no obligation or liability in connection with the administration, marketing or trading of the Product(s)".
(ii) "IISL does not guarantee the accuracy and/or the completeness of the Nifty 50 or any data included therein and IISL shall have not have any responsibility or liability for any errors, omissions, or interruptions therein. IISL does not make any warranty, express or implied, as to results to be obtained by the Licensee, owners of the Product(s), or any other person or entity from the use of the Nifty 50 or any data included therein. IISL makes no express or implied warranties or merchantability or fitness for a particular purpose or use with respect to the Index or any data included therein. Without limiting any of the foregoing, IISL expressly disclaim any and all liability for any claims, damages or losses arising out of or related to the Product(s), including any and all direct, special, punitive, indirect, or consequential damages (including lost profits), even if notified of the possibility of such damages".
(iii) "An investor, by subscribing or purchasing an interest in the Product(s), will be regarded as having acknowledged, understood and accepted the disclaimer referred to in Clauses above and will be bound by it".
Disclaimer with respect to S&P BSE 500 Shariah Index (applicable to Taurus Ethical Fund)
"The "S&P BSE Shariah 500 Index" (the "Index") is published by Asia Index Private Limited ("AIPL"), which is a joint venture among affiliates of S&P Dow Jones Indices LLC ("SPDJI") and BSE Limited ("BSE"), and has been licensed for use by Taurus Asset Management Company Limited ("Licensee"). Standard & Poor's® and S&P® are registered trademarks of Standard & Poor's Financial Services LLC ("S&P") and Dow Jones® is a registered trademark of Dow Jones Trademark Holdings LLC ("Dow Jones"). BSE® and SENSEX® are registered trademarks of BSE. The trademarks have been licensed to AIPL and have been sublicensed for use for certain purposes by Licensee. Licensee's "[Taurus Ethical Fund]" (the "Product") is/are not sponsored, endorsed, sold or promoted by AIPL, SPDJI, Dow Jones, S&P, any of their respective affiliates (collectively, "S&P Dow Jones Indices") or BSE. None of AIPL, S&P Dow Jones Indices or BSE makes any representation or warranty, express or implied, to the owners of the Product or any member of the public regarding the advisability of investing in securities generally or in the Product particularly or the ability of the Index to track general market performance. AIPL's, S&P Dow Jones Indices' and BSE's only relationship to Licensee with respect to the Index is the licensing of the Index and certain trademarks, service marks and/or trade names of AIPL, S&P Dow Jones Indices, BSE and/or their licensors. The S&P BSE Shariah 500 Index is determined, composed and calculated by AIPL or its agent without regard to Licensee or the Product. None of AIPL, S&P Dow Jones Indices or BSE are responsible for and have not participated in the determination of the prices, and amount of the Product or the timing of the issuance or sale of the Product or in the determination or calculation of the equation by which the Product is to be converted into cash, surrendered or redeemed, as the case may be. AIPL, S&P Dow Jones Indices and BSE have no obligation or liability in connection with the administration, marketing or trading of the Product. There is no assurance that investment products based on the Index will accurately track index performance or provide positive investment returns. AIPL and S&P Dow Jones Indices LLC are not investment advisors. Inclusion of a security within an index is not a recommendation by AIPL, S&P Dow Jones Indices or BSE to buy, sell, or hold such security, nor is it considered to be investment advice.
AIPL, S&P DOW JONES INDICES, BSE AND THEIR THIRD PARTY LICENSORS DO NOT GUARANTEE THE ADEQUACY, ACCURACY, TIMELINESS AND/OR THE COMPLETENESS OF THE INDEX OR ANY DATA RELATED THERETO. AIPL, S&P DOW JONES INDICES, BSE AND THEIR THIRD PARTY LICENSORS SHALL NOT BE SUBJECT TO ANY DAMAGES OR LIABILITY FOR ANY ERRORS, OMISSIONS, OR DELAYS THEREIN. AIPL, S&P DOW JONES INDICES, BSE AND THEIR THIRD PARTY LICENSORS MAKE NO EXPRESS OR IMPLIED WARRANTIES, AND EXPRESSLY DISCLAIM ALL WARRANTIES, OF MERCHANTABILITY OR FITNESS FOR A PARTICULAR PURPOSE OR USE OR AS TO RESULTS TO BE OBTAINED BY LICENSEE, OWNERS OF THE PRODUCT, OR ANY OTHER PERSON OR ENTITY FROM THE USE OF THE INDEX OR WITH RESPECT TO ANY DATA RELATED THERETO. WITHOUT LIMITING ANY OF THE FOREGOING, IN NO EVENT WHATSOEVER SHALL AIPL, S&P DOW JONES INDICES, BSE OR THEIR THIRD PARTY LICENSORS BE LIABLE FOR ANY INDIRECT, SPECIAL, INCIDENTAL, PUNITIVE, OR CONSEQUENTIAL DAMAGES INCLUDING BUT NOT LIMITED TO, LOSS OF PROFITS, TRADING LOSSES, LOST TIME OR GOODWILL, EVEN IF THEY HAVE BEEN ADVISED OF THE POSSIBILITY OF SUCH DAMAGES, WHETHER IN CONTRACT, TORT, STRICT LIABILITY, OR OTHERWISE. THERE ARE NO THIRD PARTY BENEFICIARIES OF ANY AGREEMENTS OR ARRANGEMENTS BETWEEN AIPL AND LICENSEE, OTHER THAN THE LICENSORS OF AIPL (INCLUDING S&P DOW JONES INDICES AND/OR BSE)."
Disclaimer with respect to S&P BSE 100, S&P BSE 200 and S&P BSE Bankex (Applicable to Taurus Starshare, Taurus Tax Shield, Taurus Bonanza Fund and Taurus Banking & Financial Services Fund)The S&P BSE 100,S&P BSE 200 and S&P BSE Bankex are products of AIPL, which is a joint venture of S&P Dow Jones Indices LLC or its affiliates ('SPDJI') and BSE, and has been licensed for use by Taurus Asset Management Company Limited. Standard & Poor's® and S&P® are registered trademarks of Standard & Poor's Financial Services LLC ("S&P"); BSE® is a registered trademark of BSE Limited ("BSE"); and Dow Jones® is a registered trademark of Dow Jones Trademark Holdings LLC ("Dow Jones").©Asia Index Private Limited 201(x). All rights reserved. Redistribution, reproduction and/or photocopying in whole or in part are prohibited without written permission of AIPL. For more information of any of AIPL's indices please visit http://www.asiaindex.com/. None of AIPL, BSE, Dow Jones Trademark Holdings LLC, their affiliates nor their third party licensors make any representation or warranty, express or implied, as to the ability of any index to accurately represent the asset class or market sector that it purports to represent and none of AIPL, BSE, S&P Dow Jones Indices LLC, Dow Jones Trademark Holdings LLC or their affiliates nor their third party licensors shall have any liability for any errors, omissions or interruptions of any index or the data included therein”
Disclaimer with respect to Nifty Free Float Midcap 100 (Applicable to Taurus Discovery Fund)A. IISL is engaged in the business of developing, constructing, compiling, computing and maintaining various equity indices. Nifty Free Float Midcap 100 is owned by IISL and authorized DotEx to distribute the data pertaining to Nifty Free Float Midcap 100. The Index is determined, composed and calculated by IISL without regard to the Subscriber and/or Client. Neither IISL nor DotEx has any obligation to take the needs of the Subscriber/ Clients into consideration in determining, composing or calculating, distributing Nifty Free Float Midcap 100.
B. IISL and DotEx do not guarantee the accuracy and/or the completeness of Nifty Free Float Midcap 100 or any data included therein and they shall have no liability for any errors, omissions, or interruptions therein. Neither IISL nor DotEx makes any warranty, express or implied, as to results to be obtained by the Subscriber or any other person or entity from use of Nifty Free Float Midcap 100 or any data included therein. IISL and DotEx make no express or implied warranties, and expressly disclaim all warranties of merchantability or fitness for a particular purpose or use with respect to the Index or any data included therein. Without limiting any of the foregoing, IISL expressly disclaim any and all liability for any damages or losses arising out of the use of Nifty Free Float Midcap 100 or any data included therein by any third party, including any and all direct, special, punitive, indirect, or consequential damages (including lost profits), even if notified of the possibility of such damages.