Embed Size (px)
Citation preview

Pension Schemes
Investment Report | Market Outlook | Pension | Contact Us
Fund Assure Investment Report, March 2015
Pension Schemes
Fund Assure, Investment Report, March 2015
IN THIS POLICY, THE INVESTMENT RISK IN INVESTMENT PORTFOLIO IS BORNE BY THE POLICYHOLDER.
Dear Friends,
The month of March 2015 saw the benchmark index BSE Sensex and CNX Nifty shed 4.78% and 4.62% respectively. The Mid-cap index,CNX Mid-cap shed a modest 0.89% during the same period.On the global front, the US Federal Reserve (Fed) lowered its projections for growth and inflation in the US while expecting more improvement in the labor market. The Fed chairperson highlighted the fact that the removal of the word “patient” from the communication did not necessarily mean that the Fed was poised for an immediate hike in interest rates. Some market watchers opine that given the tighter financial conditions in the US on account of a strong US dollar, the eventual lift-off in interest rates could be delayed till September, this year.There has been a spike in the price of crude oil on the back of increased geopolitical concerns in the Middle East. The Saudi intervention in neighboring Yemen has raised concerns of a wider conflict in the region while Yemen’s geographical location at the heart of the international oil trading routes poses added risk of a possible disruption in oil supply. These pressures have partly offset the downward pressure in oil prices on account of a glut in global oil supply.On the domestic front, the budget session of Parliament has been productive as the government has been able to secure the passage of key economic bills pertaining to insurance, coal and mineral sector. The landmark legislations will facilitate more investments in these large sectors of the economy in the medium term.In its first Bi-monthly policy for FY 2016, the RBI kept the policy repo rate unchanged at 7.5%. The RBI stated that with little monetary transmission, and the possibility that incoming data will provide more clarity on the balance of risks to inflation, it decided to maintain status quo in its monetary policy stance in this review.HSBC’s India manufacturing PMI improved to 52.1 in March as against 51.2 in the prior month on the back of a rise in new orders, primarily driven by domestic growth even as the export orders eased a tad. However, there has been a rise in inflationary pressures as both input prices and output prices rebounded.India’s new Foreign Trade Policy (FTP) 2015-2020 unveiled by the government aimed at increasing merchandise and services export to USD 900 bn by FY 2020 from USD 466 bn in FY 2014 by integrating trade improvement with the key thrust areas of ‘Make in India’, ‘Digital India’ and ‘Skill India’ . FTP has rationalized existing schemes into Merchandise Exports from India Scheme (MEIS) and Service Exports from India Scheme (SEIS) with a focus on high-value products and labor-intensive sectors. The policy aims to move to single- window clearances to improve the ease of doing business.Trade deficit in February was at a 17 month low at around USD 6.9 bn aided by lower oil imports even as the non-oil non-gold imports were around 14% higher year on year, led by electronic goods, machinery and transport equipment.The Current account deficit (CAD) for the third quarter FY 2015 stood at a muted 1.6% of the GDP largely on account of a significant contraction in oil imports and a rise in invisibles. Moreover, the CAD was financed comfortably as the capital flows remained robust, resulting in a comfortable balance of payments surplus of USD13 bn.The Consumer Price Index (CPI) inflation for February 2015 came in at 5.4%, higher than the market expectation of around 5.2% and the January CPI inflation of 5.1%. The Wholesale Price Index (WPI) inflation in February 2015 came in at a negative 2.1%, lower than the market consensus of a negative 0.8%.The trajectory of CPI inflation indicates that inflation could be well within the RBI’s projection of 6% by January 2016, though much of the drop in inflation would be due to base effects rather than continued down tick in prices. Going forward, there could be some inflationary pressures due to higher food prices given the impact of the unseasonal rainfall on some crops.In the near term, the markets would want to see the government forge a consensus on major reforms such as constitutional amendment for Goods and Services Tax (GST) and the land bill when the parliament resumes on April 20th. We believe that the equity markets continue to offer the comfort of reasonable valuations for a long-term investor with a 3-5 year view.
Team Investment
Pension Schemes
Market Outlook - DebtFund Assure, Investment Report, March 2015
Debt market in the month of March 2015 saw the 10 year Government security (G-sec) close the month at 7.74% levels, hardening by 2 bps from February levels. The yields hardened across the yield curve reflecting subdued sentiment in the G-sec market in the month of March. On the corporate bond side, the 10 year AAA corporate bonds closed the month at around 8.28% levels, hardening by just 1 bp over the month. The foreign portfolio investors (FPIs) have bought Indian debt to the tune of USD 0.9 bn in the month of March 2015 taking the cumulative purchase to around USD 6.8 bn in the first three months of the calendar year 2015.
The central government’s borrowing calendar for fiscal FY 2016 indicated that it will borrow `3.6 tn in the first half of the fiscal FY 2016 compared to `3.68 tn in the first half prior fiscal. The borrowing calendar has been front-loaded as usual with the government targeting to complete 60% of its gross borrowing program for FY 2016 in the first half itself. While the quantum of gross borrowing in the first half is similar to last year, the net borrowing is pegged at `2.25 tn, 23% lower than the same period last year on account of higher redemption. The central government plans to auction securities with a 40-year maturity for the first time in an effort to attract long term funds from insurance companies, pension funds and provident fund players.
In its first Bi-monthly policy for FY 2016, the RBI kept the policy repo rate unchanged at 7.5 %. The RBI expected the CPI inflation to remain at its current levels in the first quarter of FY 2016, moderating thereafter to around 4 % by August before firming up to reach 5.8 % by March 2016 . The RBI noted the upside risks to the projected path of inflation from the possibility of less than normal monsoon; surge in vegetable and fruit prices given unseasonal rains and geo-political developments leading to hardening of global commodity prices, among other factors. However, the RBI opined that these upside risks might be offset by downside originating from global disinflationary tendencies as well as the slack in the domestic economy.
The RBI noted with concern that the transmission of policy rates to lending rates had not taken place thus far, despite weak credit off take and the front loading of two rate cuts. The RBI stated that with little monetary transmission, and the possibility that the incoming data would provide more clarity on the balance of risks to inflation, it decided to maintain status quo in its monetary policy stance in this review.
The RBI reiterated that the Monetary policy framework agreement signed by the Government of India and the RBI in February 2015 would shape the stance of its monetary policy in FY 2016 and succeeding years. The RBI expects to stay focused on ensuring that the economy disinflates gradually and durably, with CPI inflation targeted at 6% by January 2016 and at 4% by the end of FY 2018.
RBI noted the gradual improvement in growth and opined that comfortable liquidity conditions should enable banks to transmit the recent reductions in the policy rate into their lending rates, thereby improving financing conditions for the productive sectors of the economy. The RBI projected the growth for FY2016 at 7.8% assuming normal monsoon, higher by 30 bps from 7.5% in the prior fiscal, albeit with a downward bias to reflect the still subdued indicators of economic activity.
Going forward, the RBI guided that the accommodative stance of monetary policy would be maintained but monetary policy actions would be conditioned by incoming data. The RBI will await the transmission by banks of its front-loaded rate reductions into their lending rates as well as monitor developments in sectoral prices, especially those of food due to the effects of recent weather disturbances and the likely strength of the monsoon even as it will look through seasonal as well as base effects. The RBI believed that government’s policy efforts to unclog the supply response to make available key inputs such as power and land, progress on repurposing of public spending from poorly targeted subsidies towards public investment and reducing the pipeline of stalled investment will help in addressing supply constraints and create room for monetary accommodation. Finally, the RBI would watch for signs of normalization of the US monetary policy, though it anticipates India to be better buffered against likely volatility than in the past. Based on this guidance from the RBI, some market watchers expect limited room for more repo rate cuts from the RBI in the near term if the inflation tracks the RBI’s projected path of 5.8% in March 2016.
The borrowing calendar and the RBI policy have been broadly in line with market expectations. The bond markets will react to domestic inflationary dynamics as these would shape RBI’s monetary policy. Additionally, the government policies to contain food inflation and ease supply concerns of key inputs as well as commentary on interest rate action from the US Federal Reserve would be other factors which would determine the trajectory of yields in the Indian fixed income market in the near term.
Pension Schemes
Market Outlook - Equity Fund Assure, Investment Report, March 2015
The month of March 2015 saw the benchmark index BSE Sensex and CNX Nifty shed 4.78% and 4.62% respectively. The Mid-cap index, CNX Mid-cap shed a modest 0.89% during the same period.
FIIs were net buyers with inflows of around USD 1.6 bn in the month of March 2015 and the DIIs were net sellers to the tune of USD 14 mn with insurance companies net sellers to the tune of USD 0.54 bn and domestic mutual funds, net buyers to the tune of USD 0.53 bn. FIIs have bought Indian equities to the tune of USD 5.9 bn in the first three months of the calendar year even as the DIIs have been net sellers of around USD 0.9 bn in the same period, with insurance companies selling around USD 2.2 bn even as domestic mutual funds bought around USD 1.3 bn.
Indian parliament approved the long-pending legislation on insurance that facilitated an increase in the foreign ownership in the sector, to 49% from the 26% permitted earlier. The new law will allow foreign joint venture partners to increase their stakes, helping insurance companies monetize their stake or access growth capital.
The Coal Mines Special Provision Bill 2015, which was passed by the Parliament, provided the legal framework for auctioning of all coal blocks. Moreover, it enabled private participation in coal auctions for commercial mining.
The Mines & Minerals Development and Regulation Amendment Bill 2015 (MMDRA) passed by the Parliament mandated all mining leases to be granted only via competitive bidding or e-auctions, thereby creating a level playing field and increasing transparency besides providing an opportunity for companies to secure long term supply of key raw materials like iron ore and bauxite.
The government’s assured revenue from telecom spectrum auction was pegged at `1.09 tn with many telecom operators bidding aggressively to regain their existing spectrum holding as 29 licenses of different operators were up for renewal in FY2016.
The Union cabinet has cleared a proposal to revive the gas-based power plants stranded due to lack of gas. The mechanism envisaged importing Regasified Liquefied Natural Gas (RLNG) for supply to these
plants to improve the operational performance of these projects so that they can generate power at 30% of their capacity. The government has proposed to conduct a ‘reverse auction’ to source capacity eligible for this scheme with the government providing subsidy beyond `5.5/KWh, which would be the cap in tariff for the power produced.
The Cabinet Committee on EconomicAffairs (CCEA) has approved a proposal to pool prices of domestic natural gas and imported LNG used by fertilizer plants to make the cost of fuel uniform and affordable. This will lead to supply of gas to all urea plants at uniform prices and result in savings in the urea subsidy.
The market experts would be keenly watching the executive actions from the government such as finalizing the subsidy sharing formula with respect to state owned oil and gas companies and the government’s plans to infuse capital in the PSU Banks.
The Indian markets have been buoyant in the last twelve months aided by positive sentiments due to a reform oriented government as well as a significant improvement in the macro situation due to low global oil prices, a stable currency and a sharp decline in inflation. However, these tailwinds are yet to translate in a broad based earnings recovery for corporate India.
Some market experts opine that there could be some downward pressure on the FY2016 earnings estimates for companies making up the BSE Sensex due to weak domestic demand conditions, tepid performance of upstream energy sector on account of a steep fall in oil prices as well as adverse impact on earnings of metals and mining companies due to higher royalty pay out. However, these headwinds would be offset to an extent by the expectations of robust government spending in infrastructure as well as an uptick in retail loan growth aided by lower interest rates.
Continued reform agenda of the government as well as the fourth quarter earnings season will offer cues for shaping the near term trajectory of the equity market.We believe that the equity markets continue to offer comfort of reasonable valuations for a long-term investor with a 3-5 year view.
Pension Schemes
Fund Assure, Investment Report, March 2015
Liquid FundEquity Fund
Balanced Fund
Short Term Fixed Income Fund
Growth FundBond Fund
Income Fund
Pension Schemes
Fund Details Portfolio
Instrument Industry/Rating % Of NAV
Equity FundULGF 001 02/03/04 E1 110Fund Assure, Investment Report, March 2015
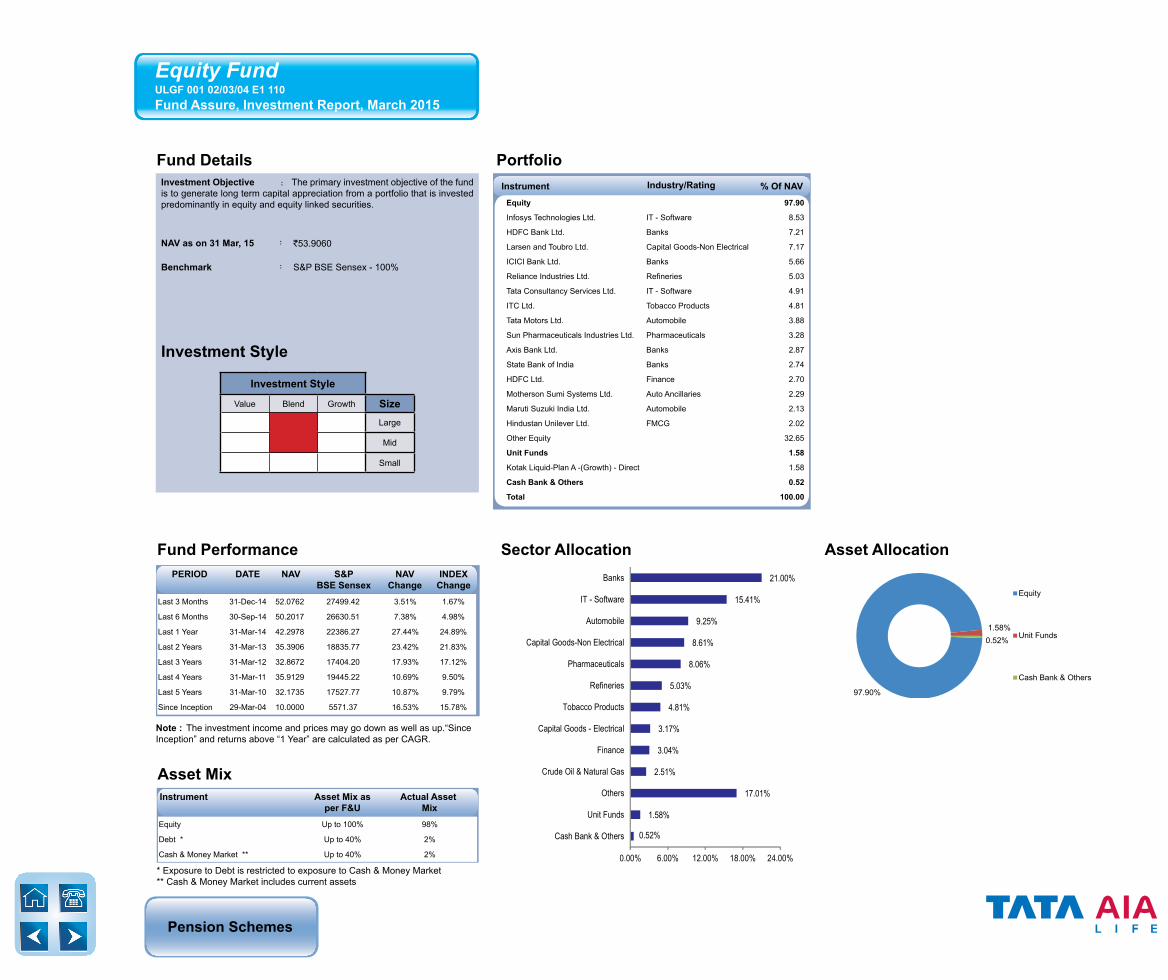
Investment Objective : The primary investment objective of the fund is to generate long term capital appreciation from a portfolio that is invested predominantly in equity and equity linked securities.
NAV as on 31 Mar, 15 : `53.9060
Benchmark : S&P BSE Sensex - 100%
Investment Style
Investment Style
Value Blend Growth SizeLarge
Mid
Small
Fund Performance Sector Allocation Asset Allocation
Note : The investment income and prices may go down as well as up.“Since Inception” and returns above “1 Year” are calculated as per CAGR.
Last 3 Months 31-Dec-14 52.0762 27499.42 3.51% 1.67%
Last 6 Months 30-Sep-14 50.2017 26630.51 7.38% 4.98%
Last 1 Year 31-Mar-14 42.2978 22386.27 27.44% 24.89%
Last 2 Years 31-Mar-13 35.3906 18835.77 23.42% 21.83%
Last 3 Years 31-Mar-12 32.8672 17404.20 17.93% 17.12%
Last 4 Years 31-Mar-11 35.9129 19445.22 10.69% 9.50%
Last 5 Years 31-Mar-10 32.1735 17527.77 10.87% 9.79%
Since Inception 29-Mar-04 10.0000 5571.37 16.53% 15.78%
PERIOD DATE NAV S&PBSE Sensex
NAVChange
INDEXChange
* Exposure to Debt is restricted to exposure to Cash & Money Market** Cash & Money Market includes current assets
Instrument Asset Mix as per F&U
Actual Asset Mix
Equity Up to 100% 98%
Debt * Up to 40% 2%
Cash & Money Market ** Up to 40% 2%
Asset Mix
Equity 97.90
Infosys Technologies Ltd. IT - Software 8.53
HDFC Bank Ltd. Banks 7.21
Larsen and Toubro Ltd. Capital Goods-Non Electrical 7.17
ICICI Bank Ltd. Banks 5.66
Reliance Industries Ltd. Refineries 5.03
Tata Consultancy Services Ltd. IT - Software 4.91
ITC Ltd. Tobacco Products 4.81
Tata Motors Ltd. Automobile 3.88
Sun Pharmaceuticals Industries Ltd. Pharmaceuticals 3.28
Axis Bank Ltd. Banks 2.87
State Bank of India Banks 2.74
HDFC Ltd. Finance 2.70
Motherson Sumi Systems Ltd. Auto Ancillaries 2.29
Maruti Suzuki India Ltd. Automobile 2.13
Hindustan Unilever Ltd. FMCG 2.02
Other Equity 32.65
Unit Funds 1.58
Kotak Liquid-Plan A -(Growth) - Direct 1.58
Cash Bank & Others 0.52
Total 100.00
0.52%
1.58%
17.01%
2.51%
3.04%
3.17%
4.81%
5.03%
8.06%
8.61%
9.25%
15.41%
21.00%
0.00% 6.00% 12.00% 18.00% 24.00%
Cash Bank & Others
Unit Funds
Others
Crude Oil & Natural Gas
Finance
Capital Goods - Electrical
Tobacco Products
Refineries
Pharmaceuticals
Capital Goods-Non Electrical
Automobile
IT - Software
Banks
97.90%
1.58%0.52%
Equity
Unit Funds
Cash Bank & Others
Pension Schemes
Fund Details Portfolio
Fund Performance Rating Profile Maturity Profile
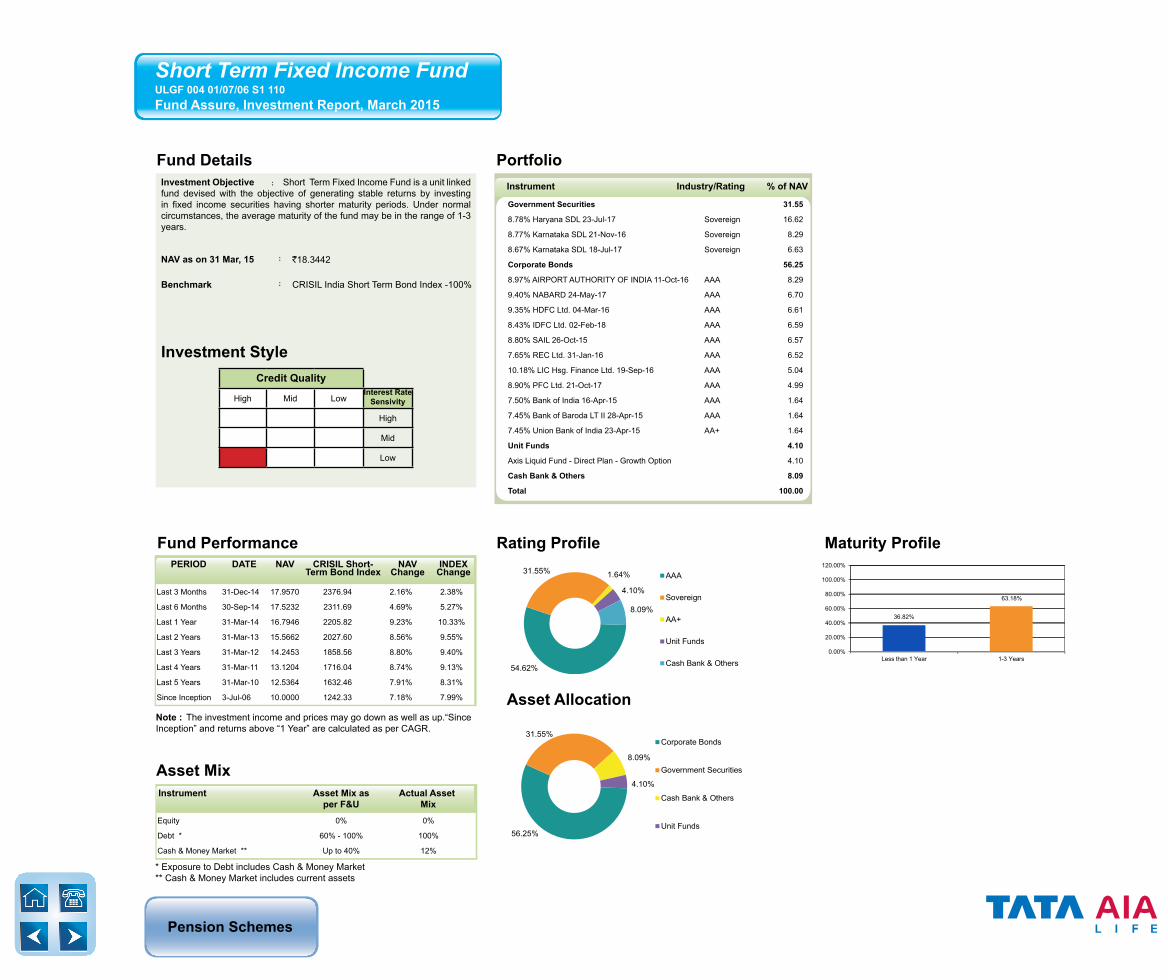
54.62%
31.55% 1.64%
4.10%
8.09%
AAA
Sovereign
AA+
Unit Funds
Cash Bank & Others
36.82%
63.18%
0.00%
20.00%
40.00%
60.00%
80.00%
100.00%
120.00%
Less than 1 Year 1-3 Years
Asset Allocation
56.25%
31.55%
8.09%
4.10%
Corporate Bonds
Government Securities
Cash Bank & Others
Unit Funds
Note : The investment income and prices may go down as well as up.“Since Inception” and returns above “1 Year” are calculated as per CAGR.
Last 3 Months 31-Dec-14 17.9570 2376.94 2.16% 2.38%
Last 6 Months 30-Sep-14 17.5232 2311.69 4.69% 5.27%
Last 1 Year 31-Mar-14 16.7946 2205.82 9.23% 10.33%
Last 2 Years 31-Mar-13 15.5662 2027.60 8.56% 9.55%
Last 3 Years 31-Mar-12 14.2453 1858.56 8.80% 9.40%
Last 4 Years 31-Mar-11 13.1204 1716.04 8.74% 9.13%
Last 5 Years 31-Mar-10 12.5364 1632.46 7.91% 8.31%
Since Inception 3-Jul-06 10.0000 1242.33 7.18% 7.99%
PERIOD DATE NAV CRISIL Short-Term Bond Index
NAVChange
INDEXChange
Government Securities 31.55
8.78% Haryana SDL 23-Jul-17 Sovereign 16.62
8.77% Karnataka SDL 21-Nov-16 Sovereign 8.29
8.67% Karnataka SDL 18-Jul-17 Sovereign 6.63
Corporate Bonds 56.25
8.97% AIRPORT AUTHORITY OF INDIA 11-Oct-16 AAA 8.29
9.40% NABARD 24-May-17 AAA 6.70
9.35% HDFC Ltd. 04-Mar-16 AAA 6.61
8.43% IDFC Ltd. 02-Feb-18 AAA 6.59
8.80% SAIL 26-Oct-15 AAA 6.57
7.65% REC Ltd. 31-Jan-16 AAA 6.52
10.18% LIC Hsg. Finance Ltd. 19-Sep-16 AAA 5.04
8.90% PFC Ltd. 21-Oct-17 AAA 4.99
7.50% Bank of India 16-Apr-15 AAA 1.64
7.45% Bank of Baroda LT II 28-Apr-15 AAA 1.64
7.45% Union Bank of India 23-Apr-15 AA+ 1.64
Unit Funds 4.10
Axis Liquid Fund - Direct Plan - Growth Option 4.10
Cash Bank & Others 8.09
Total 100.00
Instrument Industry/Rating % of NAV
Short Term Fixed Income FundULGF 004 01/07/06 S1 110Fund Assure, Investment Report, March 2015
Investment Objective : Short Term Fixed Income Fund is a unit linked fund devised with the objective of generating stable returns by investing in fixed income securities having shorter maturity periods. Under normal circumstances, the average maturity of the fund may be in the range of 1-3 years.
NAV as on 31 Mar, 15 : `18.3442
Benchmark : CRISIL India Short Term Bond Index -100%
Investment StyleCredit Quality
High Mid LowInterest Rate Sensivity
High
Mid
Low
* Exposure to Debt includes Cash & Money Market** Cash & Money Market includes current assets
Equity 0% 0%
Debt * 60% - 100% 100%
Cash & Money Market ** Up to 40% 12%
Asset MixInstrument Asset Mix as
per F&UActual Asset
Mix
Pension Schemes
Fund Details Portfolio
Fund Performance Rating Profile Maturity Profile
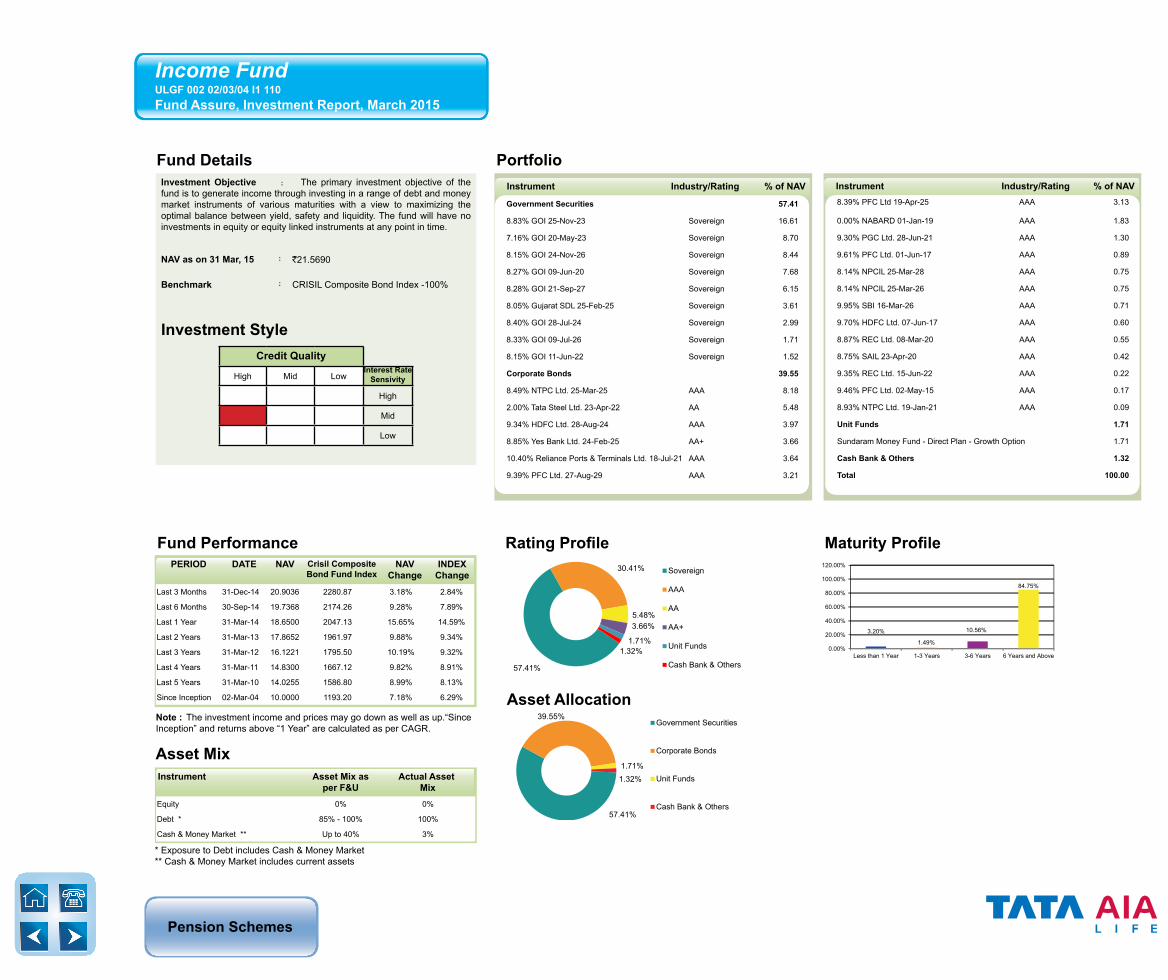
57.41%
30.41%
5.48%3.66%
1.71%1.32%
Sovereign
AAA
AA
AA+
Unit Funds
Cash Bank & Others
3.20%
1.49%
10.56%
84.75%
0.00%
20.00%
40.00%
60.00%
80.00%
100.00%
120.00%
Less than 1 Year 1-3 Years 3-6 Years 6 Years and Above
Asset Allocation
57.41%
39.55%
1.71%1.32%
Government Securities
Corporate Bonds
Unit Funds
Cash Bank & Others
Note : The investment income and prices may go down as well as up.“Since Inception” and returns above “1 Year” are calculated as per CAGR.
Last 3 Months 31-Dec-14 20.9036 2280.87 3.18% 2.84%
Last 6 Months 30-Sep-14 19.7368 2174.26 9.28% 7.89%
Last 1 Year 31-Mar-14 18.6500 2047.13 15.65% 14.59%
Last 2 Years 31-Mar-13 17.8652 1961.97 9.88% 9.34%
Last 3 Years 31-Mar-12 16.1221 1795.50 10.19% 9.32%
Last 4 Years 31-Mar-11 14.8300 1667.12 9.82% 8.91%
Last 5 Years 31-Mar-10 14.0255 1586.80 8.99% 8.13%
Since Inception 02-Mar-04 10.0000 1193.20 7.18% 6.29%
PERIOD DATE NAV Crisil Composite Bond Fund Index
NAVChange
INDEXChange
Instrument Industry/Rating % of NAV Instrument Industry/Rating % of NAV
Income FundULGF 002 02/03/04 I1 110Fund Assure, Investment Report, March 2015
Investment Objective : The primary investment objective of the fund is to generate income through investing in a range of debt and money market instruments of various maturities with a view to maximizing the optimal balance between yield, safety and liquidity. The fund will have no investments in equity or equity linked instruments at any point in time.
NAV as on 31 Mar, 15 : `21.5690
Benchmark : CRISIL Composite Bond Index -100%
Investment StyleCredit Quality
High Mid LowInterest Rate Sensivity
High
Mid
Low
* Exposure to Debt includes Cash & Money Market** Cash & Money Market includes current assets
Equity 0% 0%
Debt * 85% - 100% 100%
Cash & Money Market ** Up to 40% 3%
Asset MixInstrument Asset Mix as
per F&UActual Asset
Mix
Government Securities 57.41
8.83% GOI 25-Nov-23 Sovereign 16.61
7.16% GOI 20-May-23 Sovereign 8.70
8.15% GOI 24-Nov-26 Sovereign 8.44
8.27% GOI 09-Jun-20 Sovereign 7.68
8.28% GOI 21-Sep-27 Sovereign 6.15
8.05% Gujarat SDL 25-Feb-25 Sovereign 3.61
8.40% GOI 28-Jul-24 Sovereign 2.99
8.33% GOI 09-Jul-26 Sovereign 1.71
8.15% GOI 11-Jun-22 Sovereign 1.52
Corporate Bonds 39.55
8.49% NTPC Ltd. 25-Mar-25 AAA 8.18
2.00% Tata Steel Ltd. 23-Apr-22 AA 5.48
9.34% HDFC Ltd. 28-Aug-24 AAA 3.97
8.85% Yes Bank Ltd. 24-Feb-25 AA+ 3.66
10.40% Reliance Ports & Terminals Ltd. 18-Jul-21 AAA 3.64
9.39% PFC Ltd. 27-Aug-29 AAA 3.21
8.39% PFC Ltd 19-Apr-25 AAA 3.13
0.00% NABARD 01-Jan-19 AAA 1.83
9.30% PGC Ltd. 28-Jun-21 AAA 1.30
9.61% PFC Ltd. 01-Jun-17 AAA 0.89
8.14% NPCIL 25-Mar-28 AAA 0.75
8.14% NPCIL 25-Mar-26 AAA 0.75
9.95% SBI 16-Mar-26 AAA 0.71
9.70% HDFC Ltd. 07-Jun-17 AAA 0.60
8.87% REC Ltd. 08-Mar-20 AAA 0.55
8.75% SAIL 23-Apr-20 AAA 0.42
9.35% REC Ltd. 15-Jun-22 AAA 0.22
9.46% PFC Ltd. 02-May-15 AAA 0.17
8.93% NTPC Ltd. 19-Jan-21 AAA 0.09
Unit Funds 1.71
Sundaram Money Fund - Direct Plan - Growth Option 1.71
Cash Bank & Others 1.32
Total 100.00
Pension Schemes
Fund Details Portfolio
Note : The investment income and prices may go down as well as up.“Since Inception” and returns above “1 Year” are calculated as per CAGR.
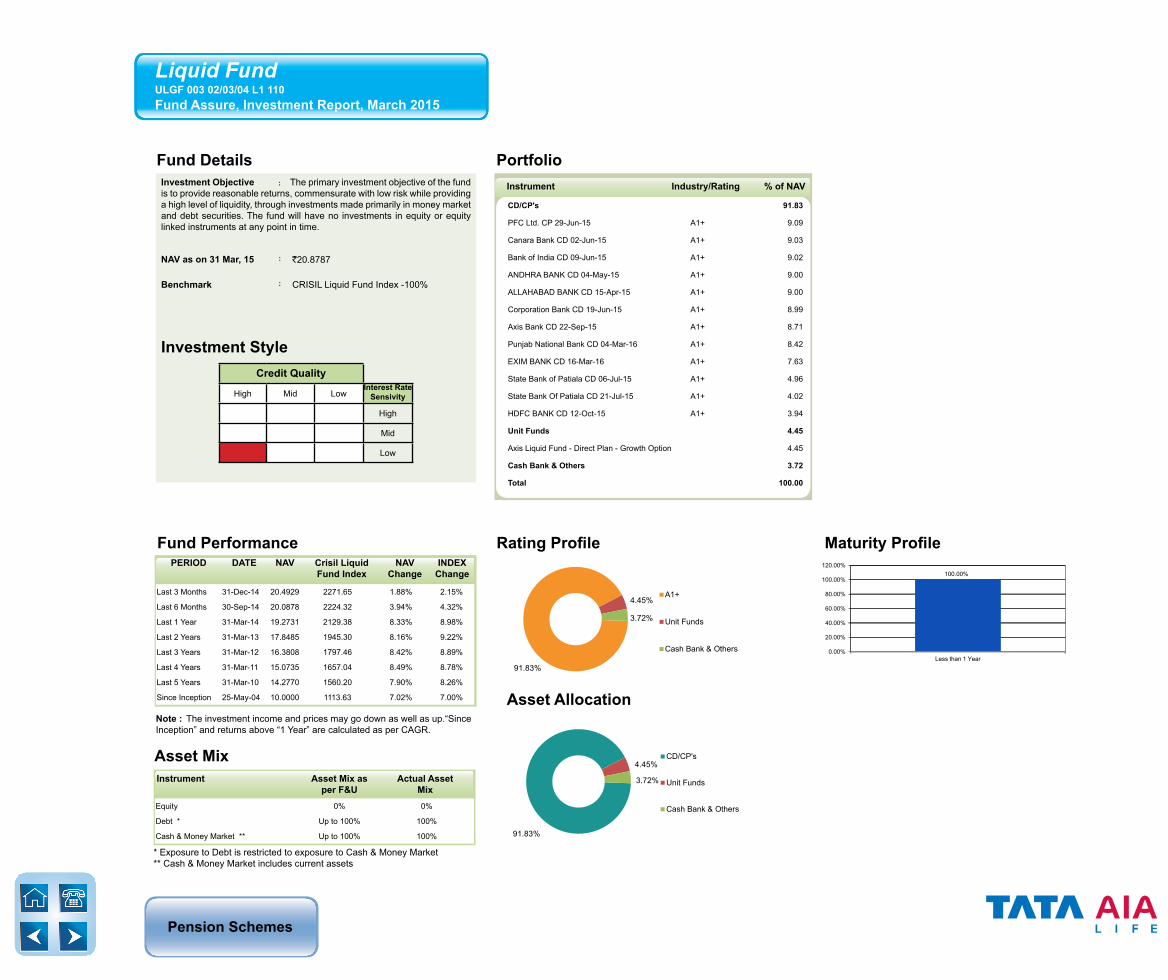
Last 3 Months 31-Dec-14 20.4929 2271.65 1.88% 2.15%
Last 6 Months 30-Sep-14 20.0878 2224.32 3.94% 4.32%
Last 1 Year 31-Mar-14 19.2731 2129.38 8.33% 8.98%
Last 2 Years 31-Mar-13 17.8485 1945.30 8.16% 9.22%
Last 3 Years 31-Mar-12 16.3808 1797.46 8.42% 8.89%
Last 4 Years 31-Mar-11 15.0735 1657.04 8.49% 8.78%
Last 5 Years 31-Mar-10 14.2770 1560.20 7.90% 8.26%
Since Inception 25-May-04 10.0000 1113.63 7.02% 7.00%
PERIOD DATE NAV Crisil Liquid Fund Index
NAVChange
INDEXChange
Fund Performance Rating Profile Maturity Profile
91.83%
4.45%
3.72%
A1+
Unit Funds
Cash Bank & Others
100.00%
0.00%
20.00%
40.00%
60.00%
80.00%
100.00%
120.00%
Less than 1 Year
Asset Allocation
91.83%
4.45%
3.72%
CD/CP's
Unit Funds
Cash Bank & Others
CD/CP's 91.83
PFC Ltd. CP 29-Jun-15 A1+ 9.09
Canara Bank CD 02-Jun-15 A1+ 9.03
Bank of India CD 09-Jun-15 A1+ 9.02
ANDHRA BANK CD 04-May-15 A1+ 9.00
ALLAHABAD BANK CD 15-Apr-15 A1+ 9.00
Corporation Bank CD 19-Jun-15 A1+ 8.99
Axis Bank CD 22-Sep-15 A1+ 8.71
Punjab National Bank CD 04-Mar-16 A1+ 8.42
EXIM BANK CD 16-Mar-16 A1+ 7.63
State Bank of Patiala CD 06-Jul-15 A1+ 4.96
State Bank Of Patiala CD 21-Jul-15 A1+ 4.02
HDFC BANK CD 12-Oct-15 A1+ 3.94
Unit Funds 4.45
Axis Liquid Fund - Direct Plan - Growth Option 4.45
Cash Bank & Others 3.72
Total 100.00
Instrument Industry/Rating % of NAV
Liquid FundULGF 003 02/03/04 L1 110Fund Assure, Investment Report, March 2015
Investment Objective : The primary investment objective of the fund is to provide reasonable returns, commensurate with low risk while providing a high level of liquidity, through investments made primarily in money market and debt securities. The fund will have no investments in equity or equity linked instruments at any point in time.
NAV as on 31 Mar, 15 : `20.8787
Benchmark : CRISIL Liquid Fund Index -100%
Investment StyleCredit Quality
High Mid LowInterest Rate Sensivity
High
Mid
Low
* Exposure to Debt is restricted to exposure to Cash & Money Market** Cash & Money Market includes current assets
Equity 0% 0%
Debt * Up to 100% 100%
Cash & Money Market ** Up to 100% 100%
Asset MixInstrument Asset Mix as
per F&UActual Asset
Mix

Pension Schemes
Fund Details Portfolio
Note : The investment income and prices may go down as well as up.“Since Inception” and returns above “1 Year” are calculated as per CAGR.
PERIOD DATE NAV Crisil Composite Bond Fund Index
NAVChange
INDEXChange
Fund Performance Rating Profile Maturity Profile
55.74%
36.65%
4.59%
4.46%
-1.43%
Sovereign
AAA
AA+
Unit Funds
Cash Bank & Others
3.03%
15.77%
81.21%
0.00%
20.00%
40.00%
60.00%
80.00%
100.00%
120.00%
Less than 1 Year 3-6 Years 6 Years and Above
Asset Allocation
55.74%
41.24%
4.46%
-1.43%
Government Securities
Corporate Bonds
Unit Funds
Cash Bank & Others
Instrument Industry/Rating % of NAV Instrument Industry/Rating % of NAV
Bond FundULGF 005 17/08/07 BO 110Fund Assure, Investment Report, March 2015
Investment Objective : The primary investment objective of the fund is to generate income through investing in a range of debt and money market instruments of various maturities with a view to maximizing the optimal balance between yield, safety and liquidity. The fund will have no investments in equity or equity linked instruments at any point in time.
NAV as on 31 Mar, 15 : `18.4293
Benchmark : CRISIL Composite Bond Index -100%
Investment StyleCredit Quality
High Mid LowInterest Rate Sensivity
High
Mid
Low
Last 3 Months 31-Dec-14 17.8647 2280.87 3.16% 2.84%
Last 6 Months 30-Sep-14 16.8718 2174.26 9.23% 7.89%
Last 1 Year 31-Mar-14 15.9451 2047.13 15.58% 14.59%
Last 2 Years 31-Mar-13 15.2528 1961.97 9.92% 9.34%
Last 3 Years 31-Mar-12 13.7669 1795.50 10.21% 9.32%
Last 4 Years 31-Mar-11 12.6590 1667.12 9.84% 8.91%
Last 5 Years 31-Mar-10 11.9803 1586.80 9.00% 8.13%
Since Inception 17-Aug-07 10.0000 1339.53 8.35% 7.63%
* Exposure to Debt includes Cash & Money Market** Cash & Money Market includes current assets
Equity 0% 0%
Debt * Up to 100% 100%
Cash & Money Market ** Up to 40% 3%
Asset MixInstrument Asset Mix as
per F&UActual Asset
Mix
Government Securities 55.74
8.28% GOI 21-Sep-27 Sovereign 14.29
8.83% GOI 25-Nov-23 Sovereign 10.72
8.27% GOI 09-Jun-20 Sovereign 7.78
8.15% GOI 24-Nov-26 Sovereign 6.27
7.16% GOI 20-May-23 Sovereign 5.28
8.05% Gujarat SDL 25-Feb-25 Sovereign 4.53
8.40% GOI 28-Jul-24 Sovereign 3.77
8.15% GOI 11-Jun-22 Sovereign 2.01
8.60% GOI 02-Jun-28 Sovereign 1.09
Corporate Bonds 41.24
8.49% NTPC Ltd. 25-Mar-25 AAA 8.07
8.75% SAIL 23-Apr-20 AAA 5.75
8.39% PFC Ltd 19-Apr-25 AAA 5.13
8.85% Yes Bank Ltd. 24-Feb-25 AA+ 4.59
9.34% HDFC Ltd. 28-Aug-24 AAA 4.41
9.48% REC Ltd. 10-Aug-21 AAA 3.77
10.40% Reliance Ports & Terminals Ltd. 18-Jul-21 AAA 2.89
9.39% PFC Ltd. 27-Aug-29 AAA 2.88
0.00% NABARD 01-Jan-19 AAA 2.09
8.14% NPCIL 25-Mar-28 AAA 0.76
8.14% NPCIL 25-Mar-26 AAA 0.76
9.75% SBI Series 3 Lower Tier II 16-Mar-21 AAA 0.14
Unit Funds 4.46
Sundaram Money Fund - Direct Plan - Growth Option 4.46
Cash Bank & Others -1.43
Total 100.00

Pension Schemes
Fund Details Portfolio
Balanced FundULGF 006 17/08/07 BL 110Fund Assure, Investment Report, March 2015
Note : The investment income and prices may go down as well as up. “SinceInception” and returns above “1 Year” are calculated as per CAGR.
Fund Performance
Last 3 Months 31-Dec-14 17.4683 2.62% 2.81%
Last 6 Months 30-Sep-14 16.6433 7.70% 7.76%
Last 1 Year 31-Mar-14 15.3813 16.54% 15.79%
Last 2 Years 31-Mar-13 14.3409 11.80% 10.63%
Last 3 Years 31-Mar-12 13.0844 11.06% 10.09%
Last 4 Years 31-Mar-11 12.5323 9.36% 9.01%
Last 5 Years 31-Mar-10 11.8125 8.70% 8.33%
Since Inception 17-Aug-07 10.0000 7.95% 7.86%
PERIOD DATE NAV NAVChange
INDEX Change
Sector Allocation Asset Allocation
Instrument Industry/Rating % Of NAV Instrument Industry/Rating % Of NAVInvestment Objective : The objective of the fund is to supplement the income generation from the fixed income instruments with capital appreciation of the equity assets.
NAV as on 31 Mar, 15 : `17.9251
Benchmark : Nifty - 10%CRISIL Composite Bond Index - 90%
Debt Investment StyleCredit Quality
High Mid Low Interest Rate Sensitivity
High
Mid
Low
Equity Investment StyleInvestment Style
Value Blend Growth Size
Large
Mid
Small
* Exposure to Debt includes Cash & Money Market** Cash & Money Market includes current assets
Equity Up to 20% 14%
Debt * 80% - 100% 86%
Cash & Money Market ** Up to 40% 9%
Asset MixInstrument Asset Mix as
per F&UActual Asset
Mix
Equity 13.92
Infosys Technologies Ltd. IT - Software 1.44
Larsen and Toubro Ltd. Capital Goods-Non Electrical 1.19
HDFC Bank Ltd. Banks 1.16
ICICI Bank Ltd. Banks 1.09
ITC Ltd. Tobacco Products 0.95
Tata Consultancy Services Ltd. IT - Software 0.93
HDFC Ltd. Finance 0.86
Tata Motors Ltd. Automobile 0.72
Reliance Industries Ltd. Refineries 0.67
Sun Pharmaceuticals Industries Ltd. Pharmaceuticals 0.58
Dr. Reddys Laboratories Ltd. Pharmaceuticals 0.43
Oil and Natural Gas Corpn Ltd. Crude Oil & Natural Gas 0.42
Maruti Suzuki India Ltd. Automobile 0.42
Bharat Petroleum Corporation Ltd. Refineries 0.33
State Bank of India Banks 0.33
Other Equity 2.39
Government Securities 56.77
8.15% GOI 24-Nov-26 Sovereign 26.83
8.83% GOI 25-Nov-23 Sovereign 8.23
8.60% GOI 02-Jun-28 Sovereign 7.45
8.79% GOI 08-Nov-21 Sovereign 7.32
9.23% GOI 23-Dec-43 Sovereign 4.50
8.40% GOI 28-Jul-24 Sovereign 2.44
Corporate Bonds 20.26
8.57% REC Ltd. 21-Dec-24 AAA 5.48
9.97% IL&FS 28-Sep-16 AAA 4.99
8.84% PFC Ltd. 04-Mar-23 AAA 3.35
9.30% SAIL 25-May-19 AAA 2.19
8.97% PFC Ltd. 15-Jan-18 AAA 1.6610.40% Reliance Ports & Terminals Ltd. 18-Jul-21 AAA 1.07
8.84% PGC Ltd. 21-Oct-18 AAA 0.83
9.95% SBI 16-Mar-26 AAA 0.48
9.25% PGC Ltd. 26-Dec-20 AAA 0.21
Unit Funds 4.47
Kotak Liquid-Plan A -(Growth) - Direct 4.47
Cash Bank & Others 4.57
Total 100.00
56.77%
20.26% 13.92%
4.57%
4.47%
Government Securities
Corporate Bonds
Equity
Cash Bank & Others
Unit Funds
4.57%
4.47%
20.26%
56.77%
0.86%
0.32%
0.42%
0.86%
0.95%
1.00%
1.19%
1.24%
1.61%
2.62%
2.85%
0.00% 15.00% 30.00% 45.00% 60.00%
Cash Bank & Others
Unit Funds
Corporate Bonds
Government Securities
Others
Telecomm-Service
Crude Oil & Natural Gas
Finance
Tobacco Products
Refineries
Capital Goods-Non Electrical
Pharmaceuticals
Automobile
IT - Software
Banks
Pension Schemes
Fund Details Portfolio
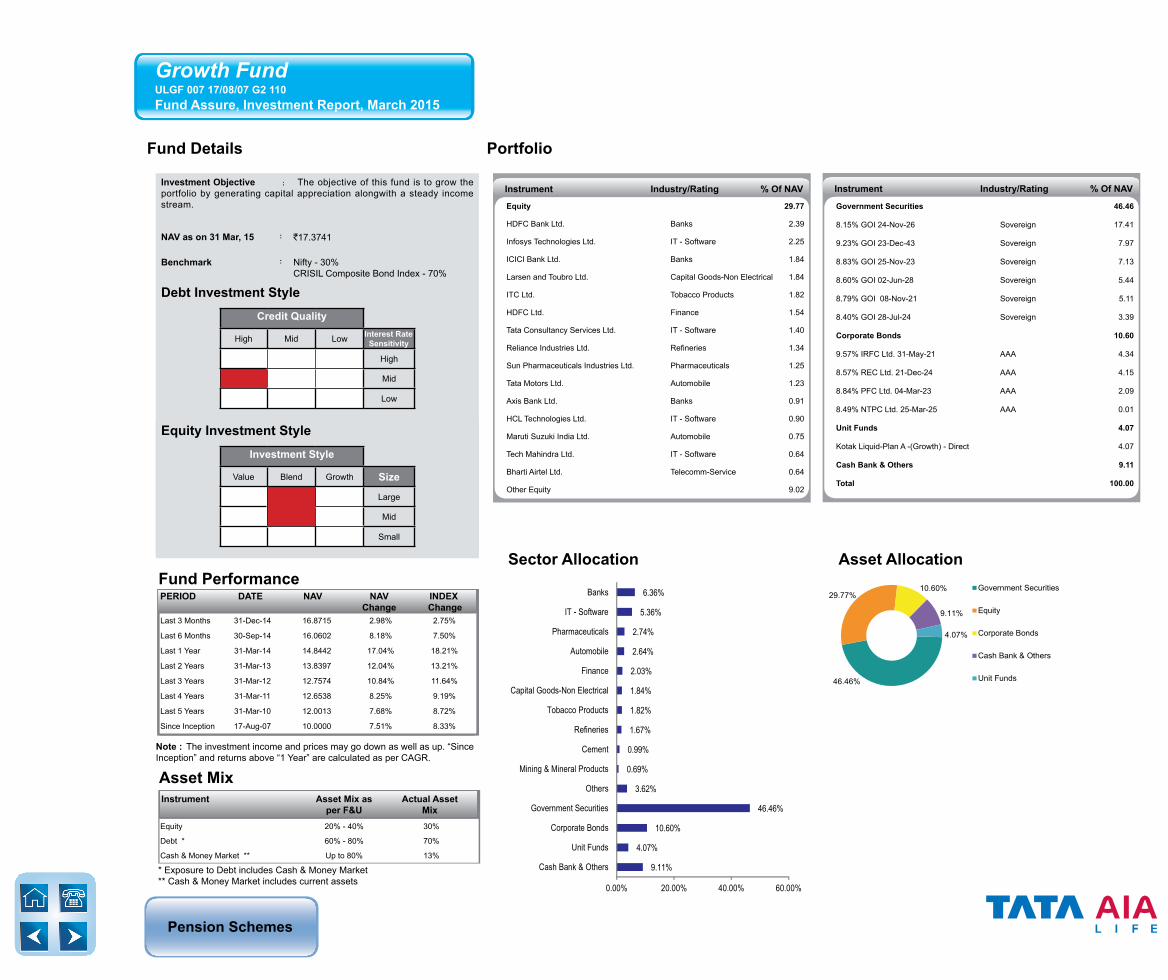
Growth FundULGF 007 17/08/07 G2 110Fund Assure, Investment Report, March 2015
Sector Allocation Asset Allocation
Equity 29.77
HDFC Bank Ltd. Banks 2.39
Infosys Technologies Ltd. IT - Software 2.25
ICICI Bank Ltd. Banks 1.84
Larsen and Toubro Ltd. Capital Goods-Non Electrical 1.84
ITC Ltd. Tobacco Products 1.82
HDFC Ltd. Finance 1.54
Tata Consultancy Services Ltd. IT - Software 1.40
Reliance Industries Ltd. Refineries 1.34
Sun Pharmaceuticals Industries Ltd. Pharmaceuticals 1.25
Tata Motors Ltd. Automobile 1.23
Axis Bank Ltd. Banks 0.91
HCL Technologies Ltd. IT - Software 0.90
Maruti Suzuki India Ltd. Automobile 0.75
Tech Mahindra Ltd. IT - Software 0.64
Bharti Airtel Ltd. Telecomm-Service 0.64
Other Equity 9.02
Instrument Industry/Rating % Of NAVInvestment Objective : The objective of this fund is to grow the portfolio by generating capital appreciation alongwith a steady income stream.
NAV as on 31 Mar, 15 : `17.3741
Benchmark : Nifty - 30%CRISIL Composite Bond Index - 70%
Debt Investment StyleCredit Quality
High Mid Low Interest Rate Sensitivity
High
Mid
Low
Equity Investment StyleInvestment Style
Value Blend Growth Size
Large
Mid
Small
Fund Performance
Note : The investment income and prices may go down as well as up. “SinceInception” and returns above “1 Year” are calculated as per CAGR.
Last 3 Months 31-Dec-14 16.8715 2.98% 2.75%
Last 6 Months 30-Sep-14 16.0602 8.18% 7.50%
Last 1 Year 31-Mar-14 14.8442 17.04% 18.21%
Last 2 Years 31-Mar-13 13.8397 12.04% 13.21%
Last 3 Years 31-Mar-12 12.7574 10.84% 11.64%
Last 4 Years 31-Mar-11 12.6538 8.25% 9.19%
Last 5 Years 31-Mar-10 12.0013 7.68% 8.72%
Since Inception 17-Aug-07 10.0000 7.51% 8.33%
PERIOD DATE NAV NAVChange
INDEX Change
* Exposure to Debt includes Cash & Money Market** Cash & Money Market includes current assets
Equity 20% - 40% 30%
Debt * 60% - 80% 70%
Cash & Money Market ** Up to 80% 13%
Asset MixInstrument Asset Mix as
per F&UActual Asset
Mix
9.11%
4.07%
10.60%
46.46%
3.62%
0.69%
0.99%
1.67%
1.82%
1.84%
2.03%
2.64%
2.74%
5.36%
6.36%
0.00% 20.00% 40.00% 60.00%
Cash Bank & Others
Unit Funds
Corporate Bonds
Government Securities
Others
Mining & Mineral Products
Cement
Refineries
Tobacco Products
Capital Goods-Non Electrical
Finance
Automobile
Pharmaceuticals
IT - Software
Banks
46.46%
29.77%10.60%
9.11%
4.07%
Government Securities
Equity
Corporate Bonds
Cash Bank & Others
Unit Funds
Government Securities 46.46
8.15% GOI 24-Nov-26 Sovereign 17.41
9.23% GOI 23-Dec-43 Sovereign 7.97
8.83% GOI 25-Nov-23 Sovereign 7.13
8.60% GOI 02-Jun-28 Sovereign 5.44
8.79% GOI 08-Nov-21 Sovereign 5.11
8.40% GOI 28-Jul-24 Sovereign 3.39
Corporate Bonds 10.60
9.57% IRFC Ltd. 31-May-21 AAA 4.34
8.57% REC Ltd. 21-Dec-24 AAA 4.15
8.84% PFC Ltd. 04-Mar-23 AAA 2.09
8.49% NTPC Ltd. 25-Mar-25 AAA 0.01
Unit Funds 4.07
Kotak Liquid-Plan A -(Growth) - Direct 4.07
Cash Bank & Others 9.11
Total 100.00
Instrument Industry/Rating % Of NAV

Pension Schemes
Choose a convenient contact option from the following:
For any enquiriesCall on our toll free no.1800 267 9966or helpline no.1860 266 9966 (local charges apply)
Just SMS ‘SERVICE’ to 58888or to get the summary of allshort codes within 2 minutes,please send HELP to 5676799
Write to UsCustomer Services TeamB- wing, 9th Floor, I-Think Techno Campus, Behind TCS, Pokhran Road No.2, Close to Eastern Express Highway, Thane (West) Pin Code – 400 607.
Contact Us
Disclaimer1. The fund is managed by Tata AIA Life Insurance Company Ltd. (hereinafter the “Company”).2. Past performance is not indicative of future performance. Returns are calculated on an absolute basis for a period of less than (or equal to) a year, with reinvestment of dividends (if
any).3. All investments made by the Company are subject to market risks. The Company does not guarantee any assured returns. The investment income and price may go down as well as
up depending on several factors influencing the market.4. Every effort is made to ensure that all information contained in this publication is accurate at the date of publication, but no responsibility or liability in respect of any error or omission
is accepted by the Company.5. Please know the associated risks and the applicable charges, from your Insurance agent or the Intermediary or policy document issued by the insurance company.6. Various funds offered are the names of funds and do not, in any way, indicate the quality of the funds, their future prospects & returns. 7. Premium paid in ULIPs are subject to Investment risks associated with capital markets & the NAV of the units may go up or down based on the performance of the fund and factors
influencing capital markets & the insured is responsible for his/her decision.8. Whilst every care has been taken in the preparation of this document, it is subject to correction and markets may not perform in a similar fashion based on factors influencing the
capital and debt markets; hence this review note does not individually confer any legal rights or duties.9. Unit Linked Life Insurance products are different from traditional insurance products and are subject to risk factors.10. Tata AIA Life Insurance Company Limited is only the name of the Insurance Company & any contract bearing the prefix ‘Tata AIA Life” is only the name of the Unit Linked Life
Insurance contract and does not in any way indicate the quality of the contract, its future prospects or returns.11. Insurance is the subject matter of the solicitation. BEWARE OF SPURIOUS PHONE CALLS AND FICTITIOUS/FRAUDULENT OFFERS IRDA of India clarifies to public that
IRDA of India or its officials do not involve in activities like sale of any kind of insurance or financial products nor invest premiums.• IRDA of India does not announce any bonus. • Public recieving such phone calls are requested to lodge a police complaint along with details of phone call, number.
Tata AIA Life Insurance Company Ltd. (IRDA of India Regn. No. 110) CIN: U66010MH2000PLC128403.Registered and Corporate Office: 14th Floor, Tower A, Peninsula Business Park, Senapati Bapat Marg, Lower Parel, Mumbai 400013
Name DesignationHarshad Patil Chief Investment OfficerRajeev Tewari Head of EquitiesJayanth Udupa Head of Credit Analysis & EconomistNitin Bansal Senior Analyst & Fund ManagerCheenu Gupta Senior Analyst & Fund ManagerPankaj Khetan Fund ManagerNimesh Mistry AnalystAnirban Ray AnalystNalin Ladiwala AnalystHS Bharath DealerPankaj Agarwal Dealer
Tata AIA Life Insurance’s Investment team
Unique Reference Number: L&C/Misc/2015/Apr/082