Embed Size (px)
Citation preview

1
Volume 1 No: 6 (2017)
Functions and Impacts of
Multi-Stakeholder Platforms in Benin
ADEGBOLA Ygué Patrice, KOUTON-BOGNON Baudelaire, AHOYO ADJOVI Nestor
René, ATACOLODJOU Annick
October 2017
2
Citation Adegbola, Y P, Kouton-Bognon B, Ahoyo-Adjovi, N R and Atacolodjou A, (2017). Functions and Impacts of Multi-Stakeholder Platforms in Benin. FARA Research Results Vol 1(6) PP 26.
Corresponding Author Dr. ADEGBOLA Ygué Patrice ([email protected] ) FARA encourages fair use of this material. Proper citation is requested
Forum for Agricultural Research in Africa (FARA) 12 Anmeda Street, Roman Ridge PMB CT 173, Accra, Ghana Tel: +233 302 772823 / 302 779421 Fax: +233 302 773676 Email: [email protected] Website: www.faraafrica.org Editorials Dr. Fatunbi A.O ([email protected]); Dr. Abdulrazak Ibrahim ([email protected] ), Dr. Augustin Kouevi([email protected] ) and Mr. Benjamin Abugri([email protected])
ISSN: 2550-3359
.
About FARA The Forum for Agricultural Research in Africa (FARA) is the apex continental organisation responsible for coordinating and advocating for agricultural research-for-development. (AR4D). It serves as the entry point for agricultural research initiatives designed to have a continental reach or a sub-continental reach spanning more than one sub-region. FARA serves as the technical arm of the African Union Commission (AUC) on matters concerning agricultural science, technology and innovation. FARA has provided a continental forum for stakeholders in AR4D to shape the vision and agenda for the sub-sector and to mobilise themselves to respond to key continent-wide development frameworks, notably the Comprehensive Africa Agriculture Development Programme (CAADP). FARA’s vision is; “Reduced poverty in Africa as a result of sustainable broad-based agricultural growth and improved livelihoods, particularly of smallholder and pastoral enterprises” its mission is the “Creation of broad-based improvements in agricultural productivity, competitiveness and markets by strengthening the capacity for agricultural innovation at the continental-level”; its Value Proposition is the “Strengthening Africa’s capacity for innovation and transformation by visioning its strategic direction, integrating its capacities for change and creating an enabling policy environment for implementation”. FARA’s strategic direction is derived from and aligned to the Science Agenda for Agriculture in Africa (S3A), which is in turn designed to support the realization of the CAADP vision.
About FARA Research Result (FRR) FARA Research Report (FRR) is an online organ of the Forum for Agricultural Research in Africa (FARA). It aims to promote access to information generated from research activities, commissioned studies or other intellectual inquiry that are not structured to yield journal articles. The outputs could be preliminary in most cases and in other instances final. The papers are only published after FARA secretariat internal review and adjudgment as suitable for the intellectual community consumption.
Disclaimer “The opinions expressed in this publication are those of the authors. They do not purport to reflect the opinions or views of FARA or its members. The designations employed in this publication and the presentation of material therein do not imply the expression of any opinion whatsoever on the part of FARA concerning the legal status of any country, area or territory or of its authorities, or concerning the delimitation of its frontiers”.
3
Acknowledgements
This work was carried out within the Program of Accompanying Research for Agricultural Innovation (PARI), the PARI project is coordinated at the global level by the Center for Development Studies (ZEF), University of Bonn in Germany. The PARI project is also coordinated in Africa by the Forum for Agricultural Research in Africa (FARA). The funding for this work is provided by the German Federal Ministry of Economic Cooperation and Development (BMZ). The authors wish to acknowledge the contributions of the different individuals in ZEF and FARA to the reviews of the proposals and the final outputs of the research endeavours. The contributions of Dr. Fatunbi Oluwole and its team in FARA, as well as Dr. Heike Baumüller and her team at ZEF are well acknowledged. The authors further wish to acknowledge the contributions of all stakeholders in the Dogbo and
Houeyogbe districts’ white rice multi-stakeholder platforms (MPS), for data collection and
various discussion. We are also indebted to the multi-stakeholder platforms’ leaders at various
levels in both municipalities for their help. We appreciate the support of the following
individuals at Dogbo municipality, Mr Solagni Martin; Mr Houessou Comlan; Mrs Houessou
Céline; Mr Meto Samuel and Mr Meto Gregory and at Houéyogbé, Mr Dansou Paul and Mr
Hounkpè Mathieu. We would also like to express our gratitude to the management of the
National Institute of Agricultural Research of Benin (INRAB) for their scientific and administrative
supports. We also appreciate the efforts of the enumerators who contributed to this study. We
couldn’t end without expressing our sincere gratitude to the staff of the International Center for
Research and Training in Social Sciences (CIRFOSS), which played great roles, mainly in data
collection, data analyses and reporting.
4
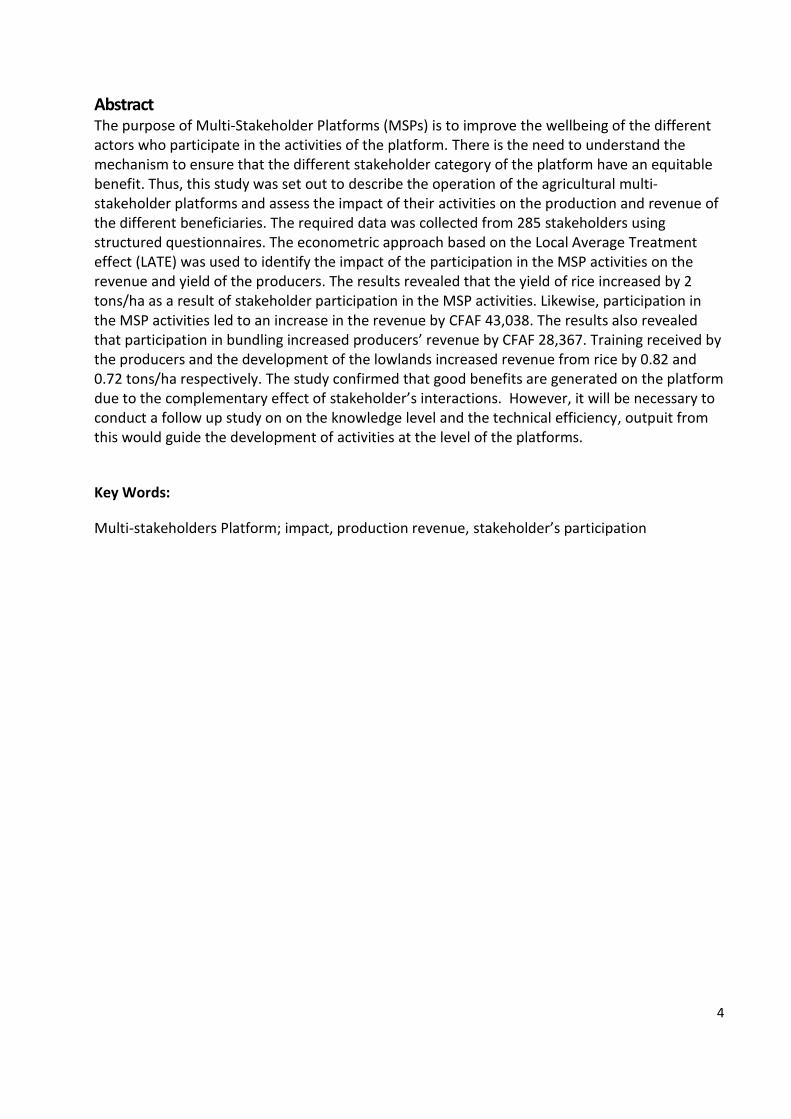
Abstract The purpose of Multi-Stakeholder Platforms (MSPs) is to improve the wellbeing of the different actors who participate in the activities of the platform. There is the need to understand the mechanism to ensure that the different stakeholder category of the platform have an equitable benefit. Thus, this study was set out to describe the operation of the agricultural multi-stakeholder platforms and assess the impact of their activities on the production and revenue of the different beneficiaries. The required data was collected from 285 stakeholders using structured questionnaires. The econometric approach based on the Local Average Treatment effect (LATE) was used to identify the impact of the participation in the MSP activities on the revenue and yield of the producers. The results revealed that the yield of rice increased by 2 tons/ha as a result of stakeholder participation in the MSP activities. Likewise, participation in the MSP activities led to an increase in the revenue by CFAF 43,038. The results also revealed that participation in bundling increased producers’ revenue by CFAF 28,367. Training received by the producers and the development of the lowlands increased revenue from rice by 0.82 and 0.72 tons/ha respectively. The study confirmed that good benefits are generated on the platform due to the complementary effect of stakeholder’s interactions. However, it will be necessary to conduct a follow up study on on the knowledge level and the technical efficiency, outpuit from this would guide the development of activities at the level of the platforms.
Key Words:
Multi-stakeholders Platform; impact, production revenue, stakeholder’s participation

5
1. Introduction
Cultivated in more than 113 countries and on all continents except Antarctica, rice is the staple food for more than half of the world population (Hirsch, 1999). More than 2 billion people in Asia obtain 60 to 70 percent of their energy intake from rice and its derived products (FAO, 2001). In Benin, rice is becoming more and more important in the diets of the populations in the urban as well as rural areas (Adégbola and Sodjinou, 2003). The needs in average rice consumption per adult-equivalency and per year are 35 kg in the big cities and 32 kg in the rural areas (CEPED, 2010). The total amount of rice consumed in 2009 was 255,520 tons (Kumako, 2015). Rice production in Benin is not among the most dynamic value chains. In fact, the production volume had never gone beyond 100,000 tons per year before 2007. From 2008, various development initiatives were undertaken following the world food crisis. The initiatives led to a boom in rice production, with a peak of 206,943 tons in 2013 (FAO, 2013). Despite an increase in the national rice production experienced these last decades, the local production does not meet the national rice needs (Adekambi, 2005). In fact, the national production currently covers only 47 percent of the country’s needs (MAEP, 2010), thus necessitating importation of large volumes (971,365 tons in 2012). (Lavinon, 2015). This is despite the country’s high potential in natural resources (205,000 ha of lowlands and 117,000 ha of flood plains) (Adégbola et al., 2011). The low rice production is due to the fact that the rice sector is characterized by low productivity linked to the use of ‘archaic’ tools, unimproved seeds, poor management of water, poor organization of the sector, inadequacy of technical supervision, lack of infrastructure, and absence of funds for production activities. These constraints hamper development and modernization of the sector, a situation that makes rice production uncompetitive and hence a poor wealth creator. Several traditional agricultural research for development (ARD) approaches were used to remedy these inadequacies. According to the traditional model, innovation starts with conception by scientists and spreads to adoption by farmers through extension agents (Knickel et al., 2009). Research, transfer and adoption are independent activities, and less attention is given to the context in which these processes are integrated. These poor approaches are widely blamed for contributing significantly to the poor performance of the sector in improving the means of subsistence of end users, and of small producers in particular. The poor performance of these approaches is manifested in low adoption rates of technologies and poor links among stakeholders in the value chain (Adekunle et al., 2014). To address the problems associated with the traditional approach, the Forum for Agricultural Research in Africa (FARA) proposed a new approach titled Integrated Agricultural Research for Development (IAR4D). The IAR4D approach aims at integrating research within an innovation system including all stakeholders of the agricultural value chain. This is the same as a participatory approach in innovation and dissemination, which entails moving an innovation from a product to a process (Knickel et al., 2009). In such a system, innovation does not follow a linear path that starts with research, going through processes of development, transfer, dissemination, adoption, production and ending in the introduction and successful utilisation of new products and procedures (Adekunle et al., 2014). It rather tends to involve continuous feedback between the different steps (Dantas, 2005), by relying on the knowledge of the stakeholders involved at each step. The structure of the IAR4D concept is an innovation platform (IP) comprising agents (enterprises, research institutes, intermediaries, clients, authorities, and financial organizations) who interact and are motivated by the common conviction that an
6
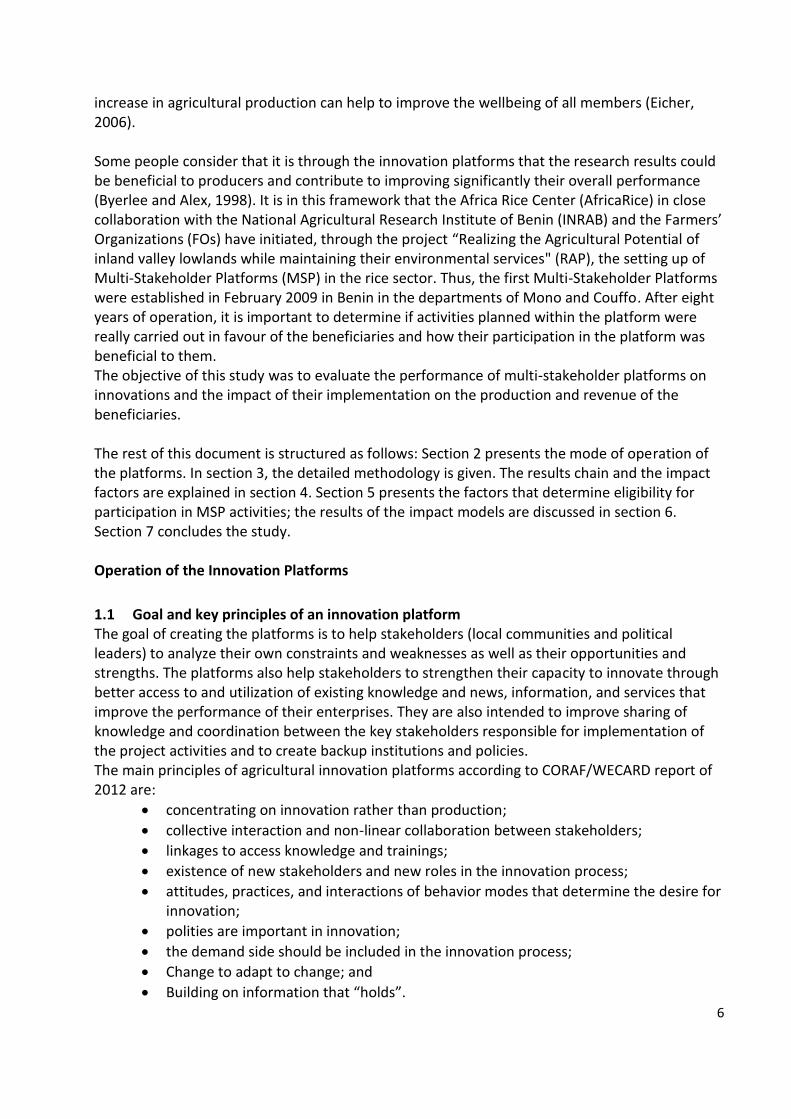
increase in agricultural production can help to improve the wellbeing of all members (Eicher, 2006). Some people consider that it is through the innovation platforms that the research results could be beneficial to producers and contribute to improving significantly their overall performance (Byerlee and Alex, 1998). It is in this framework that the Africa Rice Center (AfricaRice) in close collaboration with the National Agricultural Research Institute of Benin (INRAB) and the Farmers’ Organizations (FOs) have initiated, through the project “Realizing the Agricultural Potential of inland valley lowlands while maintaining their environmental services" (RAP), the setting up of Multi-Stakeholder Platforms (MSP) in the rice sector. Thus, the first Multi-Stakeholder Platforms were established in February 2009 in Benin in the departments of Mono and Couffo. After eight years of operation, it is important to determine if activities planned within the platform were really carried out in favour of the beneficiaries and how their participation in the platform was beneficial to them. The objective of this study was to evaluate the performance of multi-stakeholder platforms on innovations and the impact of their implementation on the production and revenue of the beneficiaries. The rest of this document is structured as follows: Section 2 presents the mode of operation of the platforms. In section 3, the detailed methodology is given. The results chain and the impact factors are explained in section 4. Section 5 presents the factors that determine eligibility for participation in MSP activities; the results of the impact models are discussed in section 6. Section 7 concludes the study. Operation of the Innovation Platforms
1.1 Goal and key principles of an innovation platform The goal of creating the platforms is to help stakeholders (local communities and political leaders) to analyze their own constraints and weaknesses as well as their opportunities and strengths. The platforms also help stakeholders to strengthen their capacity to innovate through better access to and utilization of existing knowledge and news, information, and services that improve the performance of their enterprises. They are also intended to improve sharing of knowledge and coordination between the key stakeholders responsible for implementation of the project activities and to create backup institutions and policies. The main principles of agricultural innovation platforms according to CORAF/WECARD report of 2012 are:
• concentrating on innovation rather than production;
• collective interaction and non-linear collaboration between stakeholders;
• linkages to access knowledge and trainings;
• existence of new stakeholders and new roles in the innovation process;
• attitudes, practices, and interactions of behavior modes that determine the desire for innovation;
• polities are important in innovation;
• the demand side should be included in the innovation process;
• Change to adapt to change; and
• Building on information that “holds”.
7
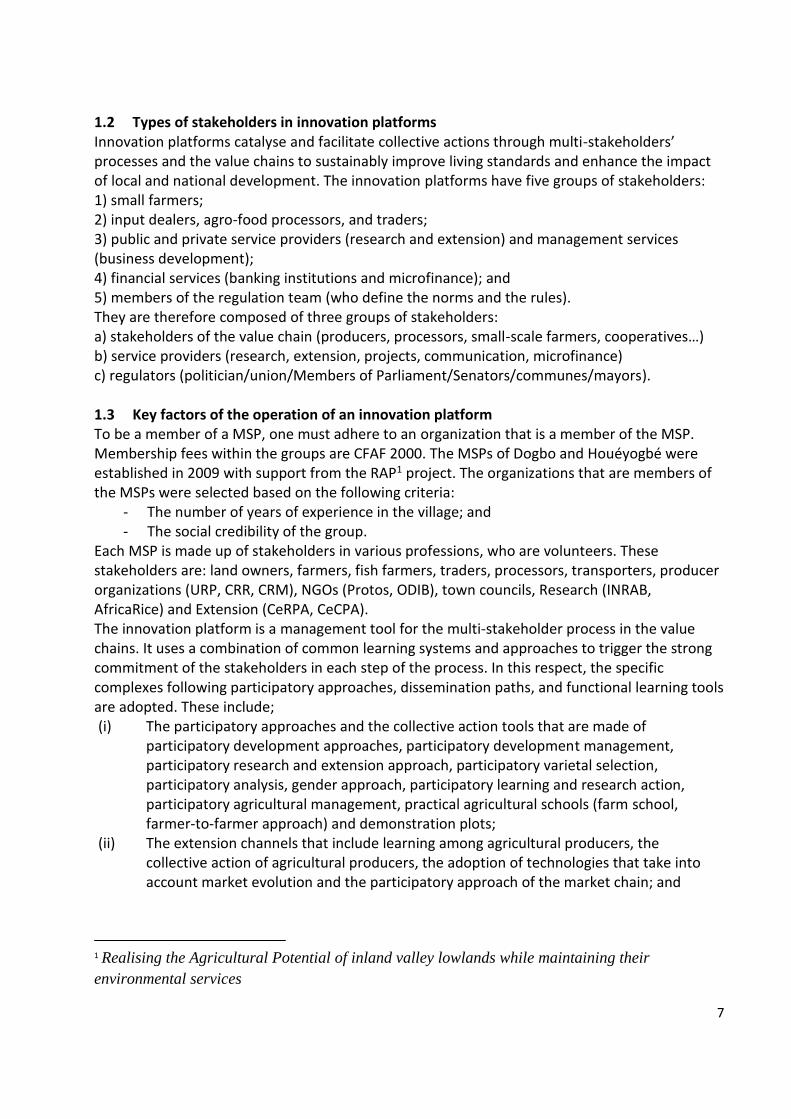
1.2 Types of stakeholders in innovation platforms Innovation platforms catalyse and facilitate collective actions through multi-stakeholders’ processes and the value chains to sustainably improve living standards and enhance the impact of local and national development. The innovation platforms have five groups of stakeholders: 1) small farmers; 2) input dealers, agro-food processors, and traders; 3) public and private service providers (research and extension) and management services (business development); 4) financial services (banking institutions and microfinance); and 5) members of the regulation team (who define the norms and the rules). They are therefore composed of three groups of stakeholders: a) stakeholders of the value chain (producers, processors, small-scale farmers, cooperatives…) b) service providers (research, extension, projects, communication, microfinance) c) regulators (politician/union/Members of Parliament/Senators/communes/mayors). 1.3 Key factors of the operation of an innovation platform To be a member of a MSP, one must adhere to an organization that is a member of the MSP. Membership fees within the groups are CFAF 2000. The MSPs of Dogbo and Houéyogbé were established in 2009 with support from the RAP1 project. The organizations that are members of the MSPs were selected based on the following criteria:
- The number of years of experience in the village; and - The social credibility of the group.
Each MSP is made up of stakeholders in various professions, who are volunteers. These stakeholders are: land owners, farmers, fish farmers, traders, processors, transporters, producer organizations (URP, CRR, CRM), NGOs (Protos, ODIB), town councils, Research (INRAB, AfricaRice) and Extension (CeRPA, CeCPA). The innovation platform is a management tool for the multi-stakeholder process in the value chains. It uses a combination of common learning systems and approaches to trigger the strong commitment of the stakeholders in each step of the process. In this respect, the specific complexes following participatory approaches, dissemination paths, and functional learning tools are adopted. These include; (i) The participatory approaches and the collective action tools that are made of
participatory development approaches, participatory development management, participatory research and extension approach, participatory varietal selection, participatory analysis, gender approach, participatory learning and research action, participatory agricultural management, practical agricultural schools (farm school, farmer-to-farmer approach) and demonstration plots;
(ii) The extension channels that include learning among agricultural producers, the collective action of agricultural producers, the adoption of technologies that take into account market evolution and the participatory approach of the market chain; and
1 Realising the Agricultural Potential of inland valley lowlands while maintaining their
environmental services

8
(iii) Function learning through joint systemic analysis, documentation, experimental learning and information/knowledge sharing among the stakeholders and the platform.
2 Methodology
2.1 Theoretical frame The theoretical frame that backs up this impact evaluation is that of the “potential results”, developed by Rubin (1974). To describe the concept of “potential results”, let us consider 𝑌𝑖 as the revenue of a rice farmer i, who participates or does not participate in the MSP activities. Let 𝐴𝑖 be the decision to participate, to be taken in such a way that 𝐴𝑖 = 1 if the producer participates in the activities and 𝐴𝑖 = 0 if the producer does not. By supposing that the equation of the revenue depends on the observed and non-observed factors, and by using the notation of classical regression, the revenue 𝑌𝑖 can be written as follows: 𝑌𝑖 = 𝜆 + 𝛾𝑥𝑖 + 𝛽𝐴𝑖 + 휀𝑖, 𝐸(휀|𝜆, 𝛾, 𝛽, 𝑥𝑖 , 𝐴𝑖) = 0 (1) where λ, γ and β are unknown parameters to be estimated; 𝑥𝑖 are independent variables; and 휀𝑖 the error term. β is the mean causal impact of A on Y in all observation units. There are three main potential sources of bias in the programme impact measurement (Godtland et al., 2004). First of all, participants in the activities are likely to be different from non-participants in the distribution of their observed characteristics, leading to a bias due to the “selection on observables”. A second source of bias in the impact may arise when there is a dissemination of MSP knowledge within the communities. In the presence of the dissemination, the comparison between those taking part in MSP activities and non-participants in the same village is likely to underestimate the impact. A last source of bias is that those taking part in the activities may be different from non-participants in the distribution of non-observed characteristics (for example, in the capacity of the farmer that affects at the same time the decision to participate in the activities and the desire to look for new knowledge), which leads to the selection on non-observables. In the absence of an appropriate instrument to participate in the programme, it is difficult to control explicitly the selection of non-observable factors. Observable and non-observable variables must be controlled, otherwise it is possible to wrongly conclude that there is a relation of causality between the participation in the activities and the revenue. Estimating the impact of farmers’ participation in the activities on the revenues is therefore likely to be biased. Thus, the correct estimation of equation (1) needs the instrument 𝐴𝑖. By admitting that the impact of the participation in the activities on the revenue (β) is heterogeneous, interaction terms were included in the model. The impact of the participation in the activities on the revenue (β) is therefore rewritten as being a function of the independent variables x and of the non-observed heterogeneity (v). 𝛽 = 𝛼 + (𝑥 − �̅�)𝛿 + 𝑣𝑖 𝐸(𝑣𝑖|𝑥𝑖) = 0 (2) Where �̅� is a vector of sample means of x.
9
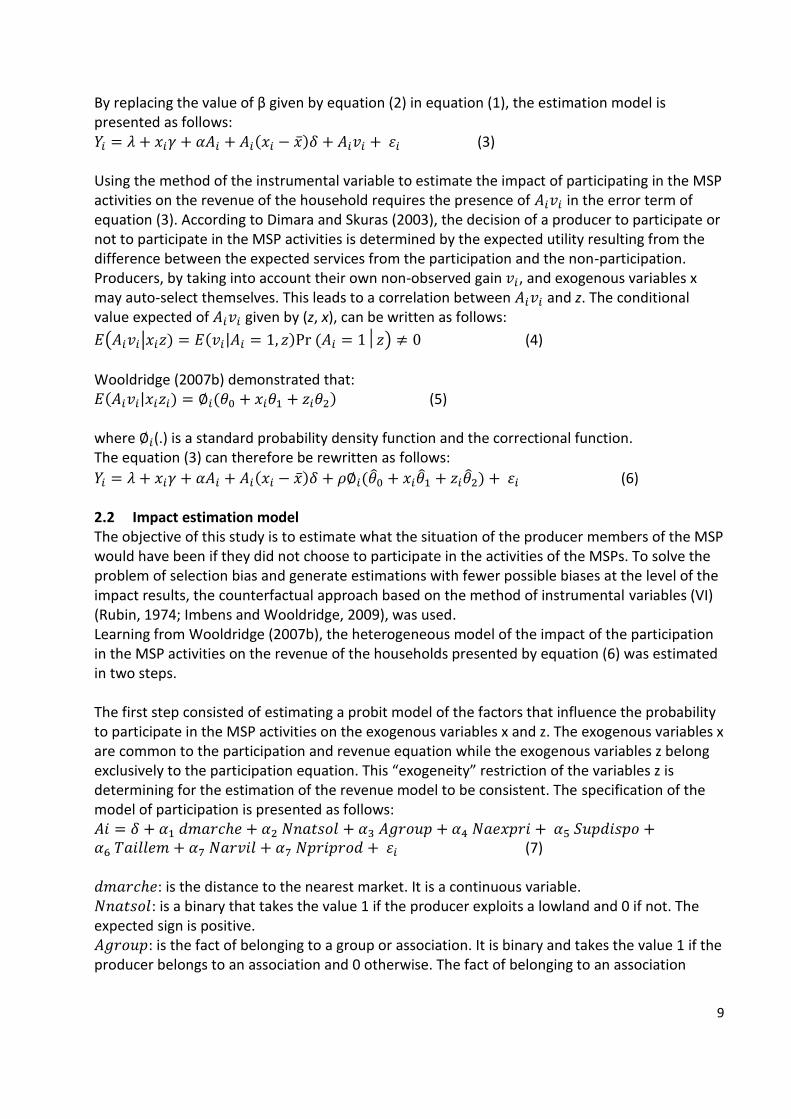
By replacing the value of β given by equation (2) in equation (1), the estimation model is presented as follows: 𝑌𝑖 = 𝜆 + 𝑥𝑖𝛾 + 𝛼𝐴𝑖 + 𝐴𝑖(𝑥𝑖 − �̅�)𝛿 + 𝐴𝑖𝑣𝑖 + 휀𝑖 (3) Using the method of the instrumental variable to estimate the impact of participating in the MSP activities on the revenue of the household requires the presence of 𝐴𝑖𝑣𝑖 in the error term of equation (3). According to Dimara and Skuras (2003), the decision of a producer to participate or not to participate in the MSP activities is determined by the expected utility resulting from the difference between the expected services from the participation and the non-participation. Producers, by taking into account their own non-observed gain 𝑣𝑖, and exogenous variables x may auto-select themselves. This leads to a correlation between 𝐴𝑖𝑣𝑖 and z. The conditional value expected of 𝐴𝑖𝑣𝑖 given by (z, x), can be written as follows:
𝐸(𝐴𝑖𝑣𝑖|𝑥𝑖𝑧) = 𝐸(𝑣𝑖|𝐴𝑖 = 1, 𝑧)Pr (𝐴𝑖 = 1│𝑧) ≠ 0 (4)
Wooldridge (2007b) demonstrated that: 𝐸(𝐴𝑖𝑣𝑖|𝑥𝑖𝑧𝑖) = ∅𝑖(𝜃0 + 𝑥𝑖𝜃1 + 𝑧𝑖𝜃2) (5) where ∅𝑖(.) is a standard probability density function and the correctional function. The equation (3) can therefore be rewritten as follows:
𝑌𝑖 = 𝜆 + 𝑥𝑖𝛾 + 𝛼𝐴𝑖 + 𝐴𝑖(𝑥𝑖 − �̅�)𝛿 + 𝜌∅𝑖(𝜃0 + 𝑥𝑖𝜃1 + 𝑧𝑖𝜃2) + 휀𝑖 (6) 2.2 Impact estimation model The objective of this study is to estimate what the situation of the producer members of the MSP would have been if they did not choose to participate in the activities of the MSPs. To solve the problem of selection bias and generate estimations with fewer possible biases at the level of the impact results, the counterfactual approach based on the method of instrumental variables (VI) (Rubin, 1974; Imbens and Wooldridge, 2009), was used. Learning from Wooldridge (2007b), the heterogeneous model of the impact of the participation in the MSP activities on the revenue of the households presented by equation (6) was estimated in two steps. The first step consisted of estimating a probit model of the factors that influence the probability to participate in the MSP activities on the exogenous variables x and z. The exogenous variables x are common to the participation and revenue equation while the exogenous variables z belong exclusively to the participation equation. This “exogeneity” restriction of the variables z is determining for the estimation of the revenue model to be consistent. The specification of the model of participation is presented as follows: 𝐴𝑖 = 𝛿 + 𝛼1 𝑑𝑚𝑎𝑟𝑐ℎ𝑒 + 𝛼2 𝑁𝑛𝑎𝑡𝑠𝑜𝑙 + 𝛼3 𝐴𝑔𝑟𝑜𝑢𝑝 + 𝛼4 𝑁𝑎𝑒𝑥𝑝𝑟𝑖 + 𝛼5 𝑆𝑢𝑝𝑑𝑖𝑠𝑝𝑜 +𝛼6 𝑇𝑎𝑖𝑙𝑙𝑒𝑚 + 𝛼7 𝑁𝑎𝑟𝑣𝑖𝑙 + 𝛼7 𝑁𝑝𝑟𝑖𝑝𝑟𝑜𝑑 + 휀𝑖 (7) 𝑑𝑚𝑎𝑟𝑐ℎ𝑒: is the distance to the nearest market. It is a continuous variable. 𝑁𝑛𝑎𝑡𝑠𝑜𝑙: is a binary that takes the value 1 if the producer exploits a lowland and 0 if not. The expected sign is positive. 𝐴𝑔𝑟𝑜𝑢𝑝: is the fact of belonging to a group or association. It is binary and takes the value 1 if the producer belongs to an association and 0 otherwise. The fact of belonging to an association

10
increases the contact with other producers and improves the probability to know or to adopt the CEF. The expected sign is positive; 𝑁𝑎𝑒𝑥𝑝𝑟𝑖: is the number of years of experience in rice production. It is a continuous variable. The expected sign is positive. 𝑆𝑢𝑝𝑑𝑖𝑠𝑝𝑜: is the total available acreage. The expected sign of this variable may be positive or negative. 𝑇𝑎𝑖𝑙𝑙𝑒𝑚: is the size of the household. It measures the labour force available in the household. The more labour force the household has, the more focused it would be on innovations. The expected sign is positive; 𝑁𝑎𝑟𝑣𝑖𝑙 : is the number of years of residence in the village. This is a continuous variable. The expected sign is positive. 𝑁𝑝𝑟𝑖𝑝𝑟𝑜𝑑 : The agreement on the selling price is a continuous variable. The expected effect of this variable is positive. In the second step, the impact model of the participation in the MSP activities on the revenue of equation (6) was estimated by using the Local Average Treatment effect (LATE) introduced by Imbens and Angrist (1994). For the LATE estimation, the estimator proposed by Abadie (2003) was used. This estimator is a generalization of the one proposed by Imbens and Angrist (1994) and for which the randomness of the instrument is not required or instrument z is independent
from 1iy and 0iy 2 conditionally from x . This estimator requires using at least an instrument z
that affects directly the status of the participation in the MSP activities but indirectly the results
1iy and 0iy once the independent variables x are controlled.
In this study, the instrumental variable is the knowledge of the existence of the MSP ( z ) with 1z for the producers who know of the existence of the MSP and 0z for the producers who
don’t. In fact, the choice of this instrument is justified by the fact that knowing the existence of the MSP can influence participation in the MSP activities. It is the producers who are aware of the existence of the MSP that can be members of the MSP and therefore participate in the activities. On the contrary, the fact of being aware of the existence of the MSP does not influence directly the yield and the revenue. A producer may be aware of the existence of the MSP and still not participate in the MSP activities. Thus, to participate in the activities of a MSP, it is not enough to be aware of its existence. In summary, being aware of the existence of the MSP may influence its adoption but does not influence directly the yield and the revenue. Thus, this variable respects the definition of the instrument as presented by Abadie (2003) and Heckman (2010). According to Abadie (2003) and Lee (2005), the average impact for the sub-population of potential participants (LATE) can be used from the function of Local Average Response Function (LARF) » defined by 𝑓(𝑥, 𝑡) ≡ 𝐸 (𝑦|𝑥, a, a1 = 1). With 𝑓(𝑥, 𝑡) the LARF. Thus:
(5)
With �̂�𝑖 = 1 −𝑍𝑖
𝑝(𝑡1=1) the weight of those ‘obeying’,
2 𝑦1𝑖 and 𝑦0𝑖 represent respectively the variable of interest (the revenue for example) if the producer has
participated in the activities (𝑎𝑖 = 1) or not (𝑎𝑖 = 0).

11
h(𝑦𝑖,𝑥𝑖 , 𝜃) = f(x, 1, 𝜃) - f(x, 0, 𝜃) and 𝜃 a parameter to be estimated by the method of ordinary least squares (MOLS). In addition to the instrumental variable introduced in the impact model, other independent variables were introduced based on the literature on the revenue determinants (for the revenue model) and the yield (for the yield model).
Glèlè et al. (2008) identified the number of years of experience as a factor affecting positively the revenue. The number of years spent in a given activity influences positively the acquisition of the experience for that activity. Thus, more experienced producers are therefore likely to have higher revenues than the others. The ability of the producer increases with experience and may favour yield improvement. However, Ahouandjinou (2008) showed that experience is not a determinant of the revenue of the shea processor in North Benin. This continuous variable may therefore have a negative or positive sign. According to Hessavi (2013), mutual aid, information and sharing of know-how are the benefits that a producer can have from being a member of an association. Producers belonging to a group will have practical knowledge on the technical production itineraries and therefore will have higher revenues compared to others. Belonging to a group or association is a binary variable that takes the value 1 if the producer is a member of a group and 0 if not. Jagwe et al. (2010) and Mathenge et al. (2010) argue that groups of producers can be good platforms in building social capital, from which small producers can obtain information about the market at lower prices, hence the reduction of fixed transaction costs to participate in the market. The effect expected from this variable is positive. The sex of the producer is a binary variable that takes the value 1 when the producer is a man and 0 when the producer is a woman. Gender intervenes significantly in the socio-economic situation of the individual. In general, women, because of their weak physical capacity compared to men, cannot carry out activities requiring strong labour force. Customs in the traditional society, especially in African societies, are also often a hindrance to women’s development. For this reason, the revenue obtained by a woman will be lower than that obtained by a man. The variable formal education is a binary and takes the value 1 when the person interviewed is educated (no matter the level reached) and 0 when not. Arouna et al. (2011) demonstrated that producers who received formal education applied the innovations more than those who did not. It is expected that formal education will reduce the risk of innovation perceived and increase the degree of openness to innovations. It is also expected that education will influence positively participation in the MSP activities. Problems may come out if some independent variables are highly correlated. The coefficients of partial correlation were therefore verified for all variables included in the model. 2.3 Sampling The challenge in evaluating the impact of a programme, a project, or an intervention like that of the platform is that it is not possible to observe what would have happened to the participants in its absence. The key to the identification and measure of the impact is therefore to have a correct hypothesis, a group of comparison (control) that is similar to the intervention group

12
(treatment) with the exception that it did not receive the intervention. In the frame of this study, the comparison group was selected based on the characteristics3 of the intervention villages that are Houinga-Houégbé (Commune of Houéyogbé), Vovokanmey, and Agbédranfo (Commune of Dogbo). Thus, the villages of Tokpota (Commune of Dogbo) and Davè (Commune of Houéyogbé) were chosen as comparison groups in each commune because they presented the same characteristics as those cited above. The minimum size of the sample to be surveyed at the level of all the communes retained was determined based on the formula used by (Dillman, 2007):
𝑁𝑠 =𝑁𝑝∗𝑝∗(1−𝑝)
(𝑁𝑝−1)(𝐵/𝐶)2+𝑝∗(1−𝑝) (1)
Ns: total number of rice producers to be surveyed; Np: total number of rice producers; p: estimated proportion of the population presenting the studied characteristic in the study (50 percent or 0.5 is the most conservative); B: acceptable error margin (1 percent); C: confidence interval (C=2.58 for 99 percent of confidence level). To know the number of MSP and non-MSP rice producers, two strata were made:
- Stratum1: producers participating in the MSP in all the pilot villages; - Stratum 2: all producers not participating in the MSP and producers of the control
villages. The following formulae were used to determine the number rice producers to be surveyed at the level of each stratum:
𝑛1 =𝑁𝑠∗𝑁1
𝑁𝑝 (2)
and
𝑛2 =𝑁𝑠∗𝑁2
𝑁𝑝 (3)
n1: the number of rice producers who are members of MSP to be surveyed; n2: the number of rice producers not members of MSP to be surveyed; N1: total number of rice producers who are members of the MSP; N2: total number of rice producers who are not members of the MSP. Based on the list4 of rice producers in the pilot and control villages, a random sorting was done using the spreadsheet Excel to choose the rice producers to be surveyed. Table 1 presents the number of rice producers to be surveyed in each village.
3: The size of the population, the geographic situation, the agricultural production and access to local organisations (NGO, Communal Sector of
Rural Development, microfinance institutions, etc.) were the characteristics used.
4 A complete survey of rice producers was carried out in each village

13
Table 1: Distribution of rice producers based on the participation or non-participation in the MSP activities per village
Communes Villages
MSP Non-MSP
Number Absolute frequency
Relative frequency ( percent)
Absolute frequency
Relative frequency ( percent)
Houéyogbé Houingah-houégbé
46 58.23 33 41.77 79
Davè - - 8 100 8
Dogbo
Agbédranfo 23 25.84 66 74.16 89
Tokpota - - 33 100 33
Vovokanmey 33 68.75 15 31.25 48
Total 102 39.69 155 60.31 257
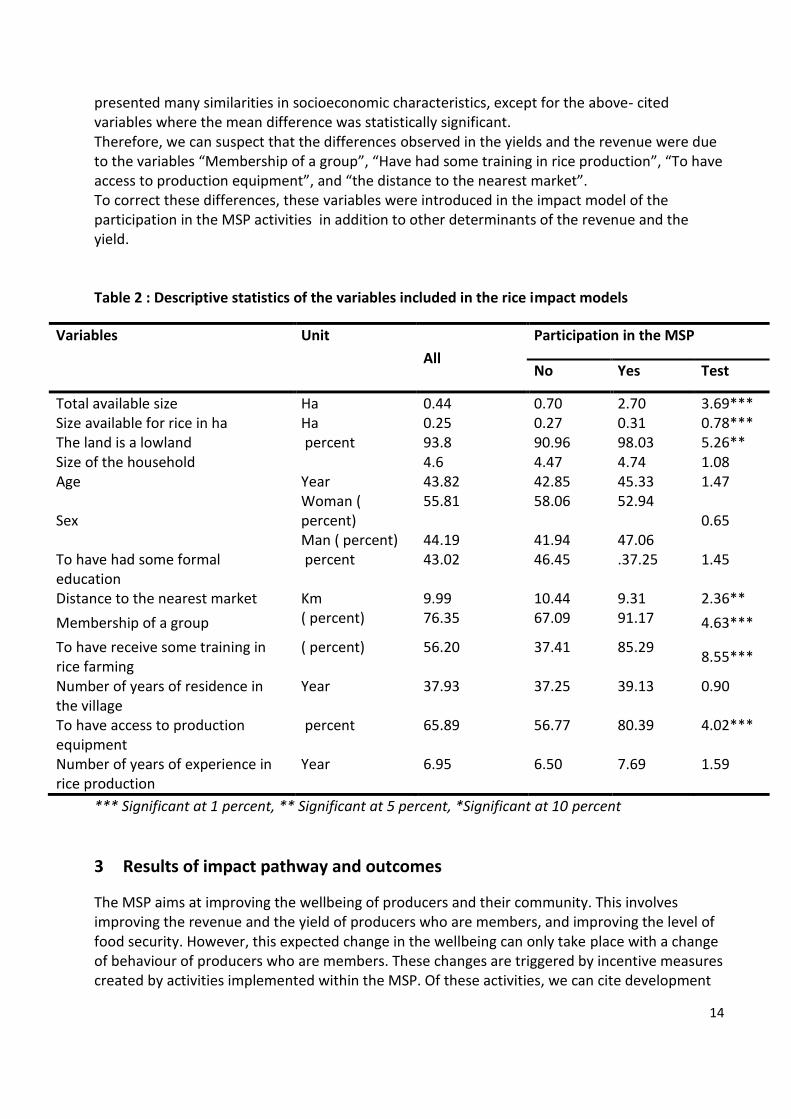
Source: Survey report 2017 FARA/INRAB 2.4 Data Data used for this study were collected on a sample of 257 rice farmers (including 102 rice producers who were members of the MSP and 155 rice producers who were not members of the MSP). Three collection methods were used. First, the literature review and group discussions took stock of previous studies on the platforms and obtained data on the characteristics of the study zone. Then, individual interviews done using a structured questionnaire allowed us to collect data on the characteristics of the households, access to credit and to extension services, the size of the household, and membership of a group among other parameters. Table 2 presents the descriptive statistics for the members of the MSP as well as those for the non-members. It also presents the statistical test of the mean difference between both groups. This allowed us to know the variables likely to influence the impact of the indicators. The results showed that the total available acreage was higher at the level of the MSP members than at the level of the non-members. Members of the MSP had on average 2.70 ha of available land for agriculture. Among these lands, 0.21 ha were devoted to rice farming. The difference between the two groups for the total available acreage as well as for the acreage devoted to rice farming is significant at the threshold of 1 percent. Ninety-eight percent of the rice farmers who were members of the MSP had their rice farms in the lowlands while 90 percent of the farmers who were not members of the MSP had their rice farms in the lowlands. There was a significamt difference at the threshold of percent between the two categories of farmers. At the level of the households’ characteristics, the results show that the average size of the rice farmers’ household was about 4.6 with a non-significant difference between the two groups. The difference between members of the MSP and those who were not members is significant at the threshold of 1 percent for the variables “Membership of a group”, “Have had some training in rice production” and “To have access to production equipment”. Comparing both groups, the distance to the nearest market and the yield were significant at the threshold of 5 percent. Generally, these results show that the two groups (Members of MSP and non-members of MSP)
14
presented many similarities in socioeconomic characteristics, except for the above- cited variables where the mean difference was statistically significant. Therefore, we can suspect that the differences observed in the yields and the revenue were due to the variables “Membership of a group”, “Have had some training in rice production”, “To have access to production equipment”, and “the distance to the nearest market”. To correct these differences, these variables were introduced in the impact model of the participation in the MSP activities in addition to other determinants of the revenue and the yield. Table 2 : Descriptive statistics of the variables included in the rice impact models
Variables Unit
All
Participation in the MSP
No Yes Test
Total available size Ha 0.44 0.70 2.70 3.69*** Size available for rice in ha Ha 0.25 0.27 0.31 0.78*** The land is a lowland percent 93.8 90.96 98.03 5.26** Size of the household 4.6 4.47 4.74 1.08 Age Year 43.82 42.85 45.33 1.47
Sex Woman ( percent)
55.81 58.06 52.94 0.65
Man ( percent) 44.19 41.94 47.06 To have had some formal education
percent 43.02 46.45 .37.25 1.45
Distance to the nearest market Km 9.99 10.44 9.31 2.36**
Membership of a group ( percent) 76.35 67.09 91.17 4.63***
To have receive some training in rice farming
( percent) 56.20 37.41 85.29 8.55***
Number of years of residence in the village
Year 37.93 37.25 39.13 0.90
To have access to production equipment
percent 65.89 56.77 80.39 4.02***
Number of years of experience in rice production
Year 6.95 6.50 7.69 1.59
*** Significant at 1 percent, ** Significant at 5 percent, *Significant at 10 percent
3 Results of impact pathway and outcomes
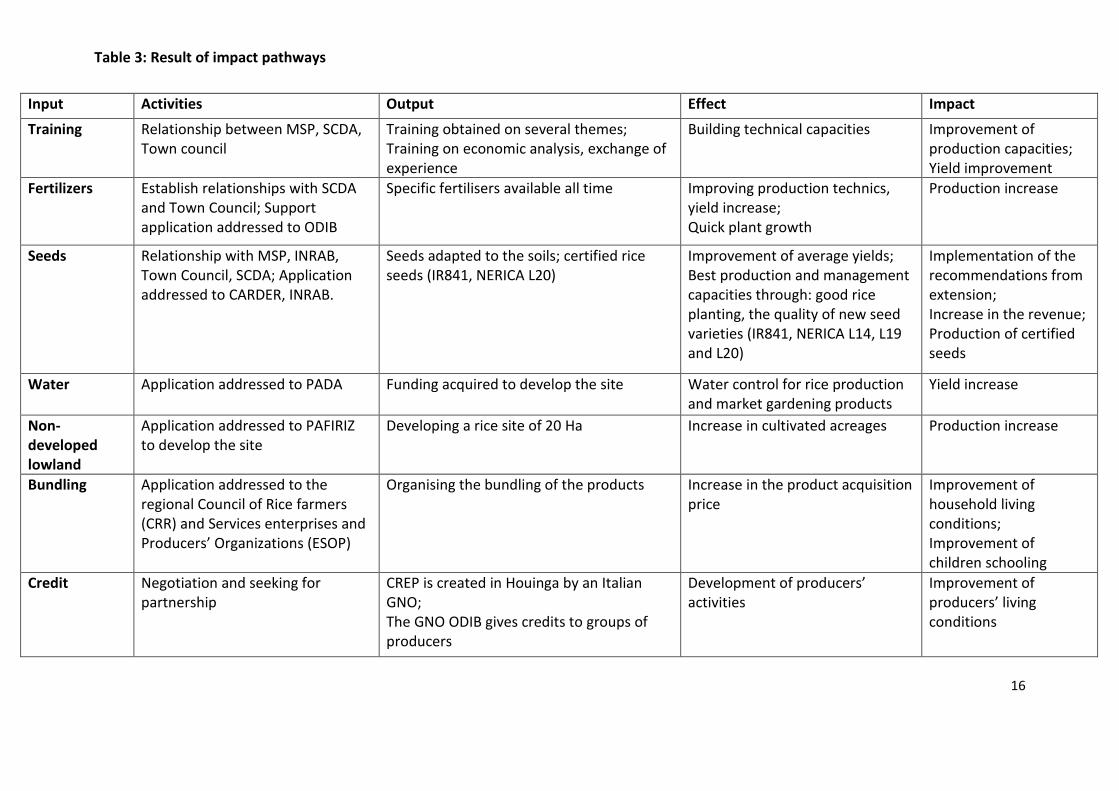
The MSP aims at improving the wellbeing of producers and their community. This involves improving the revenue and the yield of producers who are members, and improving the level of food security. However, this expected change in the wellbeing can only take place with a change of behaviour of producers who are members. These changes are triggered by incentive measures created by activities implemented within the MSP. Of these activities, we can cite development
15
of lowlands; training producers in the development of lowlands; the value chain; rice technical itineraries; collective marketing and rational utilisation of water; bundling; access to fertilisers; seeds; and insecticides. Utilisation of resources supplied by the MSP will yield results related to the wellbeing of the individual at the level of the producer such as increase in production and increase in the revenue. The result chain, made by producers who were members of the MSP from the activities, is presented in Table 3. It allows us to know the impact path and which indicator can be measured to estimate the effect of participating in the MSP activities. For this study, based on the result chain, the revenue and the yield were the main outcomes chosen. In addition to the impact of participating in the MSP activities on these impact indicators, this study also evaluated the effect of the major activities5 on the same impact indicators.
5 These are training sessions, lowland development and bundling that are the major activities that
trigger the participation of many members of the MSP (Annex 1)
16
Table 3: Result of impact pathways
Input Activities Output Effect Impact
Training Relationship between MSP, SCDA, Town council
Training obtained on several themes; Training on economic analysis, exchange of experience
Building technical capacities Improvement of production capacities; Yield improvement
Fertilizers Establish relationships with SCDA and Town Council; Support application addressed to ODIB
Specific fertilisers available all time Improving production technics, yield increase; Quick plant growth
Production increase
Seeds Relationship with MSP, INRAB, Town Council, SCDA; Application addressed to CARDER, INRAB.
Seeds adapted to the soils; certified rice seeds (IR841, NERICA L20)
Improvement of average yields; Best production and management capacities through: good rice planting, the quality of new seed varieties (IR841, NERICA L14, L19 and L20)
Implementation of the recommendations from extension; Increase in the revenue; Production of certified seeds
Water Application addressed to PADA Funding acquired to develop the site Water control for rice production and market gardening products
Yield increase
Non-developed lowland
Application addressed to PAFIRIZ to develop the site
Developing a rice site of 20 Ha Increase in cultivated acreages Production increase
Bundling Application addressed to the regional Council of Rice farmers (CRR) and Services enterprises and Producers’ Organizations (ESOP)
Organising the bundling of the products Increase in the product acquisition price
Improvement of household living conditions; Improvement of children schooling
Credit Negotiation and seeking for partnership
CREP is created in Houinga by an Italian GNO; The GNO ODIB gives credits to groups of producers
Development of producers’ activities
Improvement of producers’ living conditions
17
4 Determinants of producers’ participation in the activities of the MSP
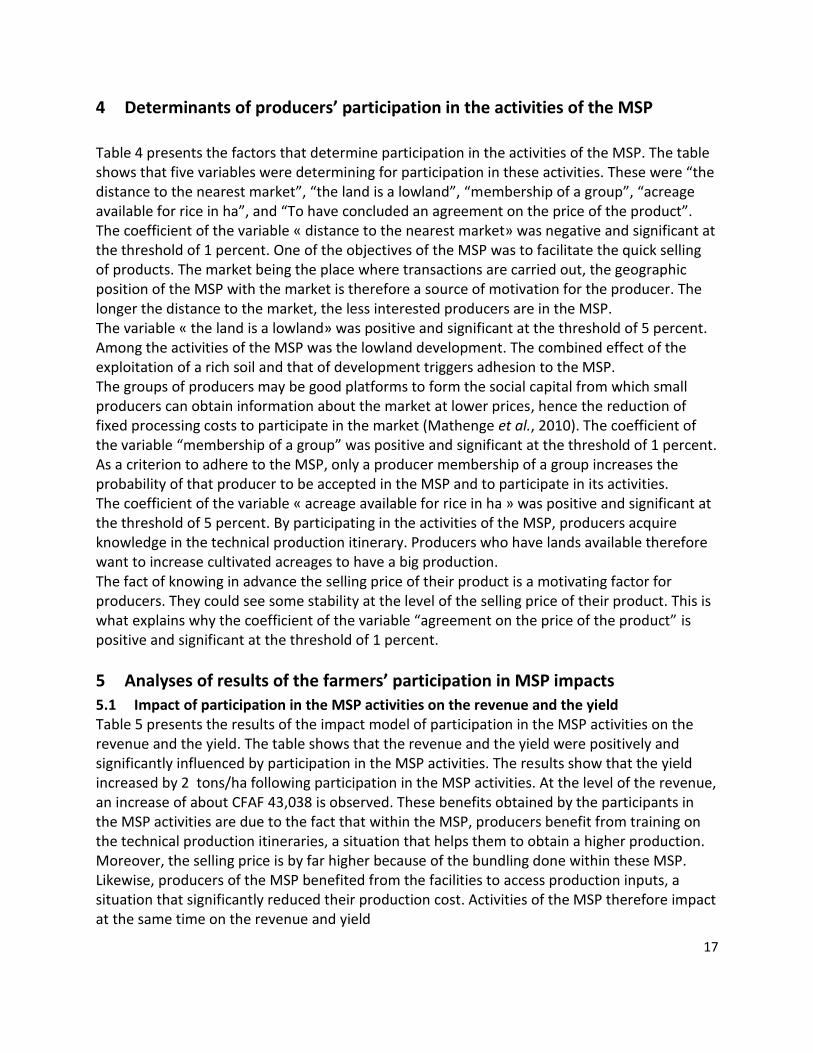
Table 4 presents the factors that determine participation in the activities of the MSP. The table shows that five variables were determining for participation in these activities. These were “the distance to the nearest market”, “the land is a lowland”, “membership of a group”, “acreage available for rice in ha”, and “To have concluded an agreement on the price of the product”. The coefficient of the variable « distance to the nearest market» was negative and significant at the threshold of 1 percent. One of the objectives of the MSP was to facilitate the quick selling of products. The market being the place where transactions are carried out, the geographic position of the MSP with the market is therefore a source of motivation for the producer. The longer the distance to the market, the less interested producers are in the MSP. The variable « the land is a lowland» was positive and significant at the threshold of 5 percent. Among the activities of the MSP was the lowland development. The combined effect of the exploitation of a rich soil and that of development triggers adhesion to the MSP. The groups of producers may be good platforms to form the social capital from which small producers can obtain information about the market at lower prices, hence the reduction of fixed processing costs to participate in the market (Mathenge et al., 2010). The coefficient of the variable “membership of a group” was positive and significant at the threshold of 1 percent. As a criterion to adhere to the MSP, only a producer membership of a group increases the probability of that producer to be accepted in the MSP and to participate in its activities. The coefficient of the variable « acreage available for rice in ha » was positive and significant at the threshold of 5 percent. By participating in the activities of the MSP, producers acquire knowledge in the technical production itinerary. Producers who have lands available therefore want to increase cultivated acreages to have a big production. The fact of knowing in advance the selling price of their product is a motivating factor for producers. They could see some stability at the level of the selling price of their product. This is what explains why the coefficient of the variable “agreement on the price of the product” is positive and significant at the threshold of 1 percent.
5 Analyses of results of the farmers’ participation in MSP impacts
5.1 Impact of participation in the MSP activities on the revenue and the yield Table 5 presents the results of the impact model of participation in the MSP activities on the revenue and the yield. The table shows that the revenue and the yield were positively and significantly influenced by participation in the MSP activities. The results show that the yield increased by 2 tons/ha following participation in the MSP activities. At the level of the revenue, an increase of about CFAF 43,038 is observed. These benefits obtained by the participants in the MSP activities are due to the fact that within the MSP, producers benefit from training on the technical production itineraries, a situation that helps them to obtain a higher production. Moreover, the selling price is by far higher because of the bundling done within these MSP. Likewise, producers of the MSP benefited from the facilities to access production inputs, a situation that significantly reduced their production cost. Activities of the MSP therefore impact at the same time on the revenue and yield

18
Table 4: Determinants of producers’ participation in the activities of the MSP
Variables Coefficients Standard error
Distance to the nearest market -0.24 *** 0.05
The land is a lowland -0.04 ** 0.32
Membership of a group 0.85 *** 0.36
Number of years of experience in rice production
-0.06 0.02
Available size for rice in ha 0.11 ** 0.02
Size of the household 0.18 0.07
Number of years of residence in the village 0.005 0.01
Agreement on the price of the product 3.06 *** 0.40
Sex -0.11 0.25
Age 0.003 0.012
Constant -0.78 0.64
Log likelihood -75.35
LR chi2 166.02*** (ddl=8)
Pseudo 𝑅2 0.50
Observations 265
*** Significant at 1 percent, ** Significant at 5 percent, *Significant at 10 percent Cavatassi et al. (2009) obtained an increase of 33 percent in the yield of potato and 20 percent in the revenue at the level of the beneficiaries of the platform in Ecuador. Sweet potato producers Members of the MSP in Peru who produced sweet potatoes registered yields that were significantly higher and received double the price on the traditional markets, with a profit margin of more than 20 percent (Thiele et al., 2011).

19
Table 5 : Econometric results of the impact of participation in activities of the MSP on the yield and revenue
Variables
Yield Revenue
Coefficients Standard error
Coefficients Standard error
Constant 16.96*** 4.43 68730.51 34912.41
Participation in the MSP activities
6.14 4.35 409761.3 366418.2
Yield 11272.74 2957.687 Agriculture as major activity 57769.49 25334.52 Sex 73831.99 8984.621 Membership of a group 1.87 2.18 656289.7*** 8.41
Formal education 0.003*** 0.001
To have had some training on rice
-2.03 1.64
Total available acreage 626.8014*** 41.52
Access mode to the land 0.42 1.31 -138116.8 104255.8
Land size cultivated for rice in ha
-7.81*** 1.31 -246539.4 14893.63
Number of years of residence in the village (years)
-0.05*** 0.02 -1782.592 2391.72
Number of years of experience in rice production.
-0.10 0.09 3383.673 871.4004
To have access to production equipment
-1.39 2.45
Total available acreage (ha) -0.08 0.072 Global impact of the activities (LATE)
2.00*** 0.18 43038.85*** 7627.80
F F (18, 120) = 5.70 F (13, 122) = 20.67
R2 adjusted 0.38 0.65
Observations 139 136
*** Significant at 1 percent, ** Significant at 5 percent, *Significant at 10 percent

20
5.2 Impact of the major activities of the MSPs on the yield or revenue Among the benefits that producer members of the MSP have, we must point out bundling, training, and development of lowlands. These are the major activities that trigger the participation of several members of the MSP. Tables 3, 4, and 5 present the results of the impact model of those activities on the revenue (for bundling) and the yield (for training and lowland development). Table 6 shows that participation of producer members of the MSP in bundling affects positively and significantly the agricultural revenue of the participants at the threshold of 1 percent and therefore increases the revenue. Participation in bundling increases producers’ revenue by CFAF 28367. This increase in the revenue could have an effect on food security and the wellbeing of the households of producers participating in the MSP. In other words, the MSP through bundling contributes towards improving food security and the wellbeing of the producers’ households. Moreover, five determining variables of producers’ participation in the bundling were identified. These were “membership of a group or association”, “the available acreage for rice farming”, “formal education” and “training received in rice farming”. Table 7 shows that participation of producer members of MSPs in the different training sessions had positive and significant effects on the yields of participants at the threshold of 1 percent. The different training courses received in the MSPs improved the yield of producers by 0.83 tons/ha. Producers who were members of the MSPs received training courses on the rice technical itineraries, the value chain, financial management techniques, bundling, and rational use of water. They owned these training courses, a situation that favored the improvement obtained in the yield. Table 8 reveals that development of the lowlands affects the participants’ yield positively and significantly at the threshold of 1 percent. Development of lowlands by rice producers who were members of the MSP resulted in an increase in the rice yield by 0.72 tonne/ha. The lowlands have some naturally rich black soils that cannot be accessed easily for use. The development has therefore favoured utilisation of the potential of those lands. This has resulted in the yield improvement observed.

21
Table 6: Econometric results of the impact of participation in bundling on the revenue
Variables Coefficients Standard error
Participation in the bundling 8546.856 179293.5 Age 102714.7 81446.29
Size of the household -20947.2 16277.31
Sex of the head of the household -10439.95 83327.91
Yield of the paddy rice -34595.57 19857.6
Total acreage available (ha) -6972.436 6760.381
Size of land with rice (ha) -353156.8*** 141905.7
Agriculture as main activity 296219.6*** 116708.2
Formal education 668.4946*** 40.74
Membership of a group or association 199.0941*** 76.79
Training received in rice farming 306063.6*** 96068.7
Impact (Late) 28367.46*** 915.124
Difference 54983.58 87236.36
Participant 656289.7*** 78070.94
Non-Participant 601306.1*** 38924.44
Constant 656721.9*** 232636
F( 13, 118) 28.00***
R2 adjusted 0.72
Observations 132
*** Significant at 1 percent, ** Significant at 5 percent, *Significant at 10 percent

22
Table 7: Econometric results of the impact of the participation in the training on the yield
Variables Coefficients Standard error
Participation in the training 2.22 3.53
Membership of a group -4.23 5.26
Formal education 0.001*** .0005
Land access mode -2.17 1.94 Number of years of residence in the village (years) -0.07 0.07 Number of years of experience in rice production -0.05 0.10
Available land size in ha -0.15 0.15
Impact (Late) 0.83*** 0.02
Difference 0.61 0.495
Participant 3.92 0.41
Non-Participant 3.31 0.27
Constant 12.18 8.37
F(8, 65) 1.51***
R2 adjusted 0.72
Observations 74
*** Significant at 1 percent, ** Significant at 5 percent, *Significant at 10 percent Table 8: Econometric results of the impact of participating in lowland development on the yield
Variables Coefficients Standard error
Development of lowlands 1.94 2.18
Age 0.33*** 0.09
Age2 -0.002*** 0.0008
Sex 0.97 1.09
Size of the household -0.21 0.15
To have access to production equipment 0.49 0.99
Available acreage in ha -2.41*** 0.62
Impact (Late) 0.72*** 0.02
Difference 0.38 0.31
Participant 3.73 .23
Non-Participant 3.35 0.21
Constant -3.67 2.63
F(9, 104) 3.58***
R2 adjusted 0.72
Observations 114
*** Significant at 1 percent, ** Significant at 5 percent, *Significant at 10 percent
23
6 Conclusion
This study assesses the impact of participating in the activities of the Multi-Stakeholder Platform (MSP) on the yield and revenue of rice producers in South-West Benin. The study shows that distance to the nearest market, type of land (lowland), membership of a group, available land size for rice, and the agreement on the price of the product are the determining factors for participating in the activities of the MSP. This participation influences significantly and positively the revenue and yield of the producer members of the MSP. Likewise, the bundling, lowland development, and the training courses received influenced the revenue and yield. Studies on the effect of the MSP on the knowledge level and technical efficiency of the producers are necessary to better guide activities to be carried out at the level of the Multi-Stakeholder Platforms.
7. Bibliography
Abadie, A., 2003. “Semiparametric Instrumental Variable Estimation of Treatment Response Models,” mimeo, Harvard University, December 2001.
Adegbola, P.Y. et Akoha, S., 2011 : Etude de la compétitivité de la riziculture béninoise, Mars 2011, 46p.
Adégbola, P.Y. et Sodjinou, E., 2003 : Analyse de la filière riz au Bénin, rapport final, Porto-Novo, PAPA/INRAB, 235p.
Adekambi, S.A. 2005 : Impact de l’adoption de variétés améliorées de riz sur la scolarisation et la santé des enfants au Bénin : cas du département des collines, Thèse d’Igénieur Agronome, FAS/UNB, Abomey-Calavi, 83p.
Adekunle, A. A., Ayanwale, A. B., Fatunbi, A. O., Olarinde, L. O., Mango, N., Nyikahadzoi, K., Siziba, S., Oladunni, O., Nokoe, S., Musinguzi, E. et Baidu-Forson, J., 2014 : Exploring the Potentials of Integrated Agricultural Research for Development in Southern Africa, Forum for Agricultural Research in Africa (FARA), Accra, Ghana.
Ahouandjinou Morènikè Cendrine 2008 Adoption et impact socio-économique de la semi-mécanisation du procédé de transformations des amandes de karité en beurre au Nord-Benin, Mémoire pour l’obtention du diplôme d’ingénieur agronome, Université de Parakou, 104p.
Byerlee, D. et Alex, G., 1998 : Strenghing National Agricultural Research System : Policy Issues and Good Patrice, Environmentally and Socially Sustainable Development, Washing tonne, 1998.
Dantas, E., 2005 : The system of innovation approach and its relevance to deelopping countries, SciDevNet, April.
Dimara, E., and Skuras, D. 2003. Adoption of agricultural innovations as a two-stage partial observability process, Agricultural Economics 28, 187-196.
Eicher, C.K., 2006 : The evolution of agricultural education and training : global insights of relevance for Africa, Staff Paper 2006-26, East Lansing, Michigan : Department of Agricultural Economics, Michigan State University.
24
FAO, 2001 : Données sur la production mondiale du riz, FAOSTAT disponible sur le lien : www.fao.org.
FAO, 2013 : Données sur la production de riz paddy, FAOSTAT disponible sur le lien : www.fao.org.
Godtland E., M., Sadoulet E., De janvry A., Murgai R., et Ortiz O., 2004. The Impact of Farmer Field Schools on Knowledge and Productivity: A Study of Potato Farmers in the Peruvian Andes. The University of chicago. 30p.
Graham Thiele, Andre´ Devaux, Iva´n Reinoso, Herna´n Pico, Fabia´ n Montesdeoca, Manuel Pumisacho, Jorge Andrade-Piedra, Claudio Velasco, Paola Flores, Rau´ Esprella,Alice Thomann, Kurt Manrique and Doug Hor tonne., 2011. Multi-stakeholder platforms for linking
Hirsh, R., 1999 : La riziculture africaine : Importance et enjeux (le riz et les politiques rizicoles en Afrique de l’Ouest et dans la zone PSI/CORAF), Synthèse des résultats du Pole régionale de Recherche sur les systèmes irrigués (PSI/CORAF), Dakar, Sénégal CIRAD/CF/CTA.
Imbens, G. and Angrist, J., 1994. Identification and estimation of Local Average. Jagwe, J., Machethe, C. and Ouma, E., 2010. .Transaction Cost and Smallholder Farmer’s
Participation in Banana Markets in the Great Lakes Region of Burundi, Rwanda and the Democratic Republic of Congo. AFJARE, 6(1): 302-317.
Knickel, K., Brunori, G., Rand, S., et Proost, J., 2009: Towards a Better Conceptual Framework for Innovation Processses in Agriculture and Rural Development: From linear Models to Systemic Apporaches, Journal of Agricultural and Extension, 15(2), 131-146p.
Kumako, J.G., 2015 : Evaluation de l’impact de la plateforme Multi-Acteurs (PMA) sur la production et le revenu des producteurs de riz du Sud-Ouest Bénin, Mémoire pour l’obtention du diplôme de Master, 72p.
Lavinon, U.T., 2015 : Impact socio-économique de la vente groupé de riz par les membres des Plateformes Multi acteurs au Sud-Ouest du Bénin, Mémoire pour l’obtention du diplôme de Master, 79p
Lee, M. J., 2005. Micro-Econometrics for Policy, Programme and Treatment Effects. Advanced Texts in Econometrics. Oxford University Press.
MAEP, 2010 : Plan d’Investissement Agricole 2010-2015, Co tonneou. Mathenge, M., Place, F., Olwande, J., and Mithöfer, D., 2010. Participation in Agricultural
Markets among the Poor and Marginalized: Analysis of Factors Influencing Participation and Impacts on Income and Poverty in Kenya. Tegemeo Institute. Eger tonne University, Kenya.
Romina Cavatassi, Mario Gonzalez, Paul Winters, Jorge Andrade-Piedra, Patricio Espinosa and Graham Thiele., 2009. Linking Smallholders to the New Agricultural Economy: An Evaluation of the Plataformas Programme in Ecuador. ESA Working Paper No. 09-06. small farmers to value chains: evidence from the Andes. INTERNATIONAL JOURNAL OF AGRICULTURAL SUSTAINABILITY 9(3) 2011. PAGES 423–433, doi:10.1080/14735903.2011.589206 # 2011 Earthscan | Taylor & Francis Group | an Informa business. ISSN: 1473-5903 (print), 1747-762X (online). www.earthscan.co.uk/journals/ijas.
25
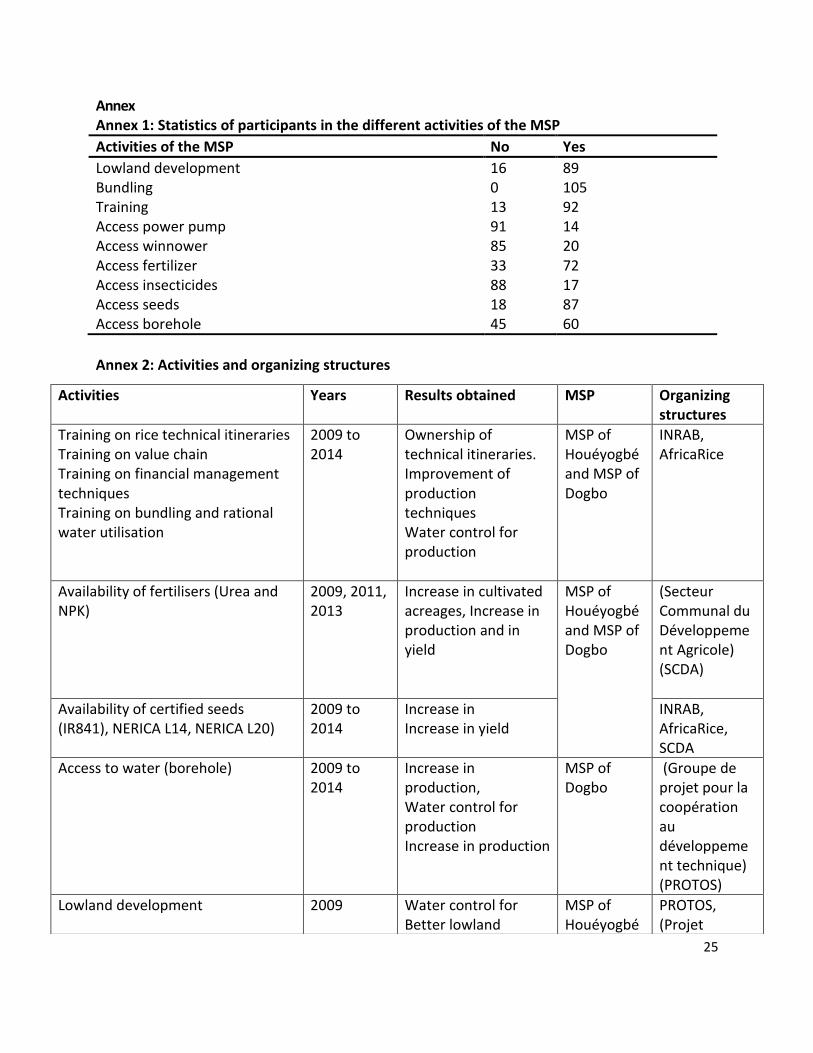
Annex Annex 1: Statistics of participants in the different activities of the MSP
Activities of the MSP No Yes
Lowland development 16 89 Bundling 0 105 Training 13 92 Access power pump 91 14 Access winnower 85 20 Access fertilizer 33 72 Access insecticides 88 17 Access seeds 18 87 Access borehole 45 60
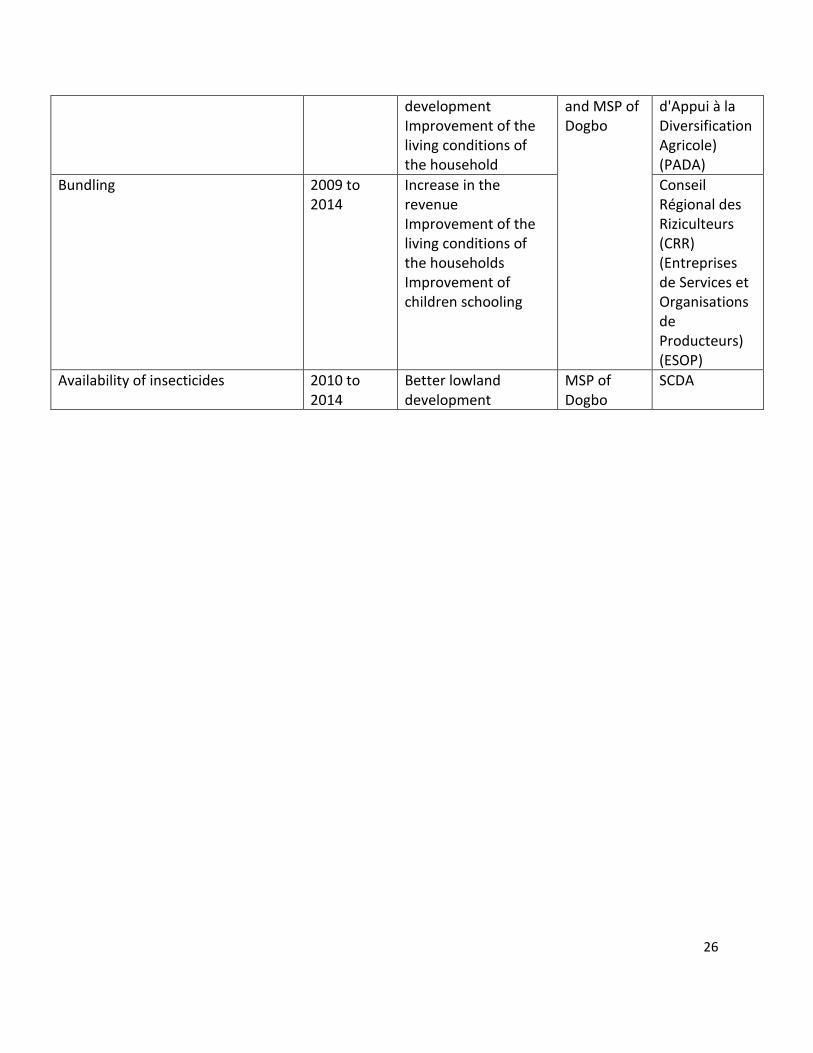
Annex 2: Activities and organizing structures
Activities Years Results obtained MSP Organizing structures
Training on rice technical itineraries Training on value chain Training on financial management techniques Training on bundling and rational water utilisation
2009 to 2014
Ownership of technical itineraries. Improvement of production techniques Water control for production
MSP of Houéyogbé and MSP of Dogbo
INRAB, AfricaRice
Availability of fertilisers (Urea and NPK)
2009, 2011, 2013
Increase in cultivated acreages, Increase in production and in yield
MSP of Houéyogbé and MSP of Dogbo
(Secteur Communal du Développement Agricole) (SCDA)
Availability of certified seeds (IR841), NERICA L14, NERICA L20)
2009 to 2014
Increase in Increase in yield
INRAB, AfricaRice, SCDA
Access to water (borehole) 2009 to 2014
Increase in production, Water control for production Increase in production
MSP of Dogbo
(Groupe de projet pour la coopération au développement technique) (PROTOS)
Lowland development 2009 Water control for Better lowland
MSP of Houéyogbé
PROTOS, (Projet
26
development Improvement of the living conditions of the household
and MSP of Dogbo
d'Appui à la Diversification Agricole) (PADA)
Bundling 2009 to 2014
Increase in the revenue Improvement of the living conditions of the households Improvement of children schooling
Conseil Régional des Riziculteurs (CRR) (Entreprises de Services et Organisations de Producteurs) (ESOP)
Availability of insecticides 2010 to 2014
Better lowland development
MSP of Dogbo
SCDA