Embed Size (px)
Citation preview
Functional regionalization of the teleost cerebellumanalyzed in vivoHideaki Matsuia,b,1, Kazuhiko Namikawaa,c, Andreas Babarykac, and Reinhard W. Köstera
aDepartment of Cellular and Molecular Neurobiology, Zoological Institute, Technical University Braunschweig, 38106 Braunschweig, Germany; bDepartmentof Neuroscience, Section of Integrative Physiology, Faculty of Medicine, University of Miyazaki, Miyazaki 8891692, Japan; and cInstitute of DevelopmentalGenetics, Helmholtz Zentrum München, 85764 Neuherberg, Munich, Germany
Edited by Masao Ito, RIKEN Brain Science Institute, Wako, Japan, and approved June 10, 2014 (received for review February 19, 2014)
There has been accumulating evidence for a regionalized organi-zation of the cerebellum, which was mostly deduced fromanatomical mapping of axonal projections of cerebellar afferents.A likewise regionalization of the cerebellar output has beensuggested from lesion studies and dye-tracer experiments, butits physiological targets as well as the functional relevance of suchan output regionalization are less clear. Ideally, such functionalregionalization should be proven noninvasively in vivo. We hereprovide evidence for such a regionalization of the output from thecerebellar cortex by genetically encoded transneuronal mappingof efferent circuits of zebrafish Purkinje neurons. These identifiedcircuits correspond to distinct regionalized Purkinje cell activitypatterns in freely behaving zebrafish larvae during the performanceof cerebellar-dependent behaviors. Furthermore, optogenetic inter-rogation of selected Purkinje cell regions during animal behaviorconfirms the functional regionalization of Purkinje cell efferents andreveals their contribution to behavior control as well as their functionin controlling lateralized behavioral output. Our findings reveal howbrain compartments serve to fulfill a multitude of functions bydedicating specialized efferent circuits to distinct behavioral tasks.
The vertebrate cerebellum is involved in controlling balance,body posture, smooth performance of movements, and likely,
conditioning and motor learning (1–4). It is, thus, interconnectedin many ways with other brain regions, such as the cortex and thespinal cord. Several approaches have attempted to prove theexistence of a functional regionalization in the cerebellum, tryingto ascribe a distinct function to individual cerebellar subregions(5, 6). These studies usually used electrophysiological methodsfor mapping cerebellar input (afferents), and such maps, whichcorrelate each sensory input to a distinct cerebellar region, havebeen well-constructed in mammals (6). The illustration of asimilar output (efferents) map, however, would be more mean-ingful to prove the subdivision of the cerebellar cortex into dis-crete functional regions, but this illustration has remained morechallenging (2, 3, 7). Until recently, a precise physiologic char-acterization of the functional output governed by efferent cir-cuits was highly invasive. Ideally, such characterization wouldaddress true activity-dependent coupling of neurons by non-invasively manipulating their activity, while monitoring behav-ioral consequences for freely behaving animals.Recently, several techniques have been developed that allow
for (i) the characterization of transneuronal connections, (ii) thedirect noninvasive observation of neuronal activity, and (iii) theprecise manipulation of neuronal circuits using optical methods(8–11). In this study, we use the combination of these techniquesfor circuit analysis in the zebrafish cerebellum to address a po-tential functional regionalization of the cerebellar cortex.
ResultsPurkinje cells (PCs) represent the sole output neurons of thecerebellar cortex. We have isolated a 258-bp PC-specific regu-latory element from zebrafish, which becomes active at around2.5 d postfertilization (dpf) and continues to express in adults. Atandem organization of this 258-bp enhancer allows for specific
coexpression of two different targets in PCs (Fig. 1A and SIAppendix, Fig. S1).
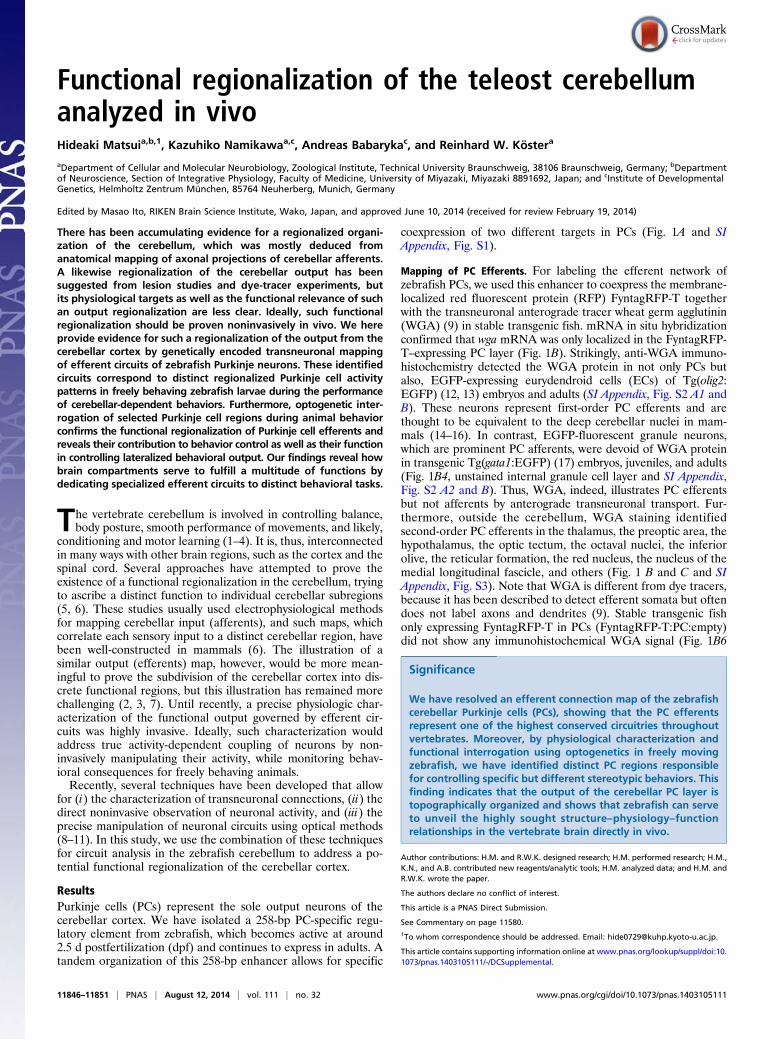
Mapping of PC Efferents. For labeling the efferent network ofzebrafish PCs, we used this enhancer to coexpress the membrane-localized red fluorescent protein (RFP) FyntagRFP-T togetherwith the transneuronal anterograde tracer wheat germ agglutinin(WGA) (9) in stable transgenic fish. mRNA in situ hybridizationconfirmed that wga mRNA was only localized in the FyntagRFP-T–expressing PC layer (Fig. 1B). Strikingly, anti-WGA immuno-histochemistry detected the WGA protein in not only PCs butalso, EGFP-expressing eurydendroid cells (ECs) of Tg(olig2:EGFP) (12, 13) embryos and adults (SI Appendix, Fig. S2 A1 andB). These neurons represent first-order PC efferents and arethought to be equivalent to the deep cerebellar nuclei in mam-mals (14–16). In contrast, EGFP-fluorescent granule neurons,which are prominent PC afferents, were devoid of WGA proteinin transgenic Tg(gata1:EGFP) (17) embryos, juveniles, and adults(Fig. 1B4, unstained internal granule cell layer and SI Appendix,Fig. S2 A2 and B). Thus, WGA, indeed, illustrates PC efferentsbut not afferents by anterograde transneuronal transport. Fur-thermore, outside the cerebellum, WGA staining identifiedsecond-order PC efferents in the thalamus, the preoptic area, thehypothalamus, the optic tectum, the octaval nuclei, the inferiorolive, the reticular formation, the red nucleus, the nucleus of themedial longitudinal fascicle, and others (Fig. 1 B and C and SIAppendix, Fig. S3). Note that WGA is different from dye tracers,because it has been described to detect efferent somata but oftendoes not label axons and dendrites (9). Stable transgenic fishonly expressing FyntagRFP-T in PCs (FyntagRFP-T:PC:empty)did not show any immunohistochemical WGA signal (Fig. 1B6
Significance
We have resolved an efferent connection map of the zebrafishcerebellar Purkinje cells (PCs), showing that the PC efferentsrepresent one of the highest conserved circuitries throughoutvertebrates. Moreover, by physiological characterization andfunctional interrogation using optogenetics in freely movingzebrafish, we have identified distinct PC regions responsiblefor controlling specific but different stereotypic behaviors. Thisfinding indicates that the output of the cerebellar PC layer istopographically organized and shows that zebrafish can serveto unveil the highly sought structure–physiology–functionrelationships in the vertebrate brain directly in vivo.
Author contributions: H.M. and R.W.K. designed research; H.M. performed research; H.M.,K.N., and A.B. contributed new reagents/analytic tools; H.M. analyzed data; and H.M. andR.W.K. wrote the paper.
The authors declare no conflict of interest.
This article is a PNAS Direct Submission.
See Commentary on page 11580.1To whom correspondence should be addressed. Email: [email protected].
This article contains supporting information online at www.pnas.org/lookup/suppl/doi:10.1073/pnas.1403105111/-/DCSupplemental.
11846–11851 | PNAS | August 12, 2014 | vol. 111 | no. 32 www.pnas.org/cgi/doi/10.1073/pnas.1403105111
and SI Appendix, Fig. S4). These identified PC efferents inzebrafish are largely consistent with indirect connectivity data inother fish deduced from tracer injections (18–20) and WGAmapping results in mouse (9), indicating that cerebellar con-nectivity has been highly conserved during evolution.
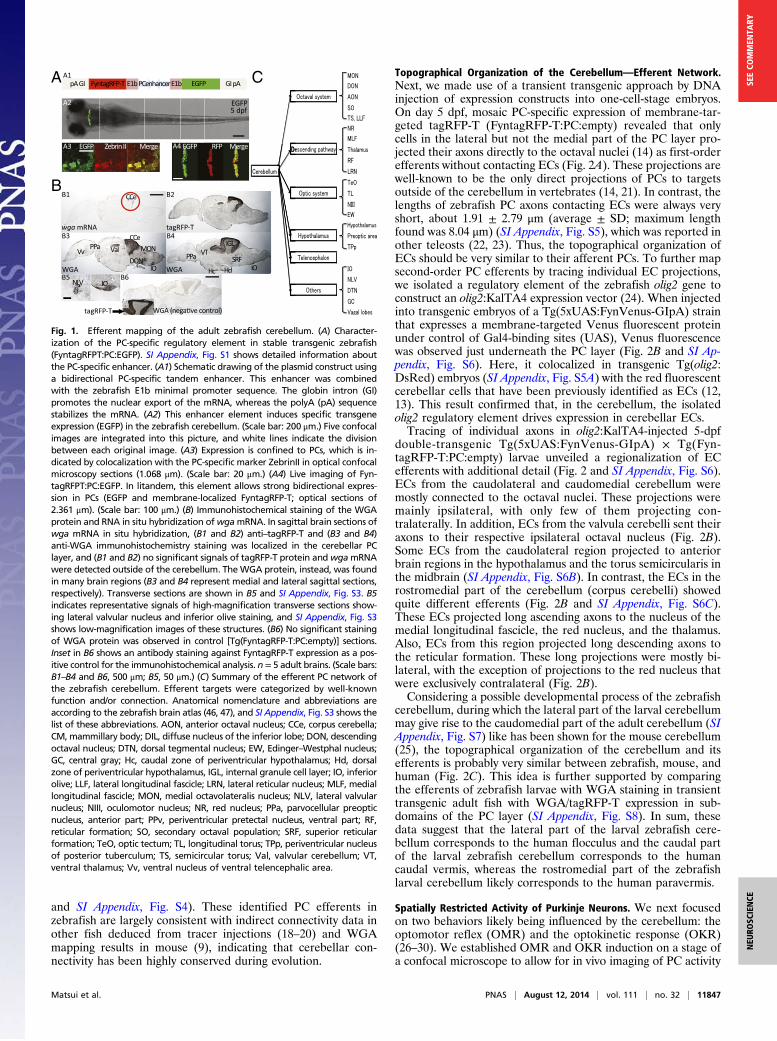
Topographical Organization of the Cerebellum—Efferent Network.Next, we made use of a transient transgenic approach by DNAinjection of expression constructs into one-cell-stage embryos.On day 5 dpf, mosaic PC-specific expression of membrane-tar-geted tagRFP-T (FyntagRFP-T:PC:empty) revealed that onlycells in the lateral but not the medial part of the PC layer pro-jected their axons directly to the octaval nuclei (14) as first-orderefferents without contacting ECs (Fig. 2A). These projections arewell-known to be the only direct projections of PCs to targetsoutside of the cerebellum in vertebrates (14, 21). In contrast, thelengths of zebrafish PC axons contacting ECs were always veryshort, about 1.91 ± 2.79 μm (average ± SD; maximum lengthfound was 8.04 μm) (SI Appendix, Fig. S5), which was reported inother teleosts (22, 23). Thus, the topographical organization ofECs should be very similar to their afferent PCs. To further mapsecond-order PC efferents by tracing individual EC projections,we isolated a regulatory element of the zebrafish olig2 gene toconstruct an olig2:KalTA4 expression vector (24). When injectedinto transgenic embryos of a Tg(5xUAS:FynVenus-GIpA) strainthat expresses a membrane-targeted Venus fluorescent proteinunder control of Gal4-binding sites (UAS), Venus fluorescencewas observed just underneath the PC layer (Fig. 2B and SI Ap-pendix, Fig. S6). Here, it colocalized in transgenic Tg(olig2:DsRed) embryos (SI Appendix, Fig. S5A) with the red fluorescentcerebellar cells that have been previously identified as ECs (12,13). This result confirmed that, in the cerebellum, the isolatedolig2 regulatory element drives expression in cerebellar ECs.Tracing of individual axons in olig2:KalTA4-injected 5-dpf
double-transgenic Tg(5xUAS:FynVenus-GIpA) × Tg(Fyn-tagRFP-T:PC:empty) larvae unveiled a regionalization of ECefferents with additional detail (Fig. 2 and SI Appendix, Fig. S6).ECs from the caudolateral and caudomedial cerebellum weremostly connected to the octaval nuclei. These projections weremainly ipsilateral, with only few of them projecting con-tralaterally. In addition, ECs from the valvula cerebelli sent theiraxons to their respective ipsilateral octaval nucleus (Fig. 2B).Some ECs from the caudolateral region projected to anteriorbrain regions in the hypothalamus and the torus semicircularis inthe midbrain (SI Appendix, Fig. S6B). In contrast, the ECs in therostromedial part of the cerebellum (corpus cerebelli) showedquite different efferents (Fig. 2B and SI Appendix, Fig. S6C).These ECs projected long ascending axons to the nucleus of themedial longitudinal fascicle, the red nucleus, and the thalamus.Also, ECs from this region projected long descending axons tothe reticular formation. These long projections were mostly bi-lateral, with the exception of projections to the red nucleus thatwere exclusively contralateral (Fig. 2B).Considering a possible developmental process of the zebrafish
cerebellum, during which the lateral part of the larval cerebellummay give rise to the caudomedial part of the adult cerebellum (SIAppendix, Fig. S7) like has been shown for the mouse cerebellum(25), the topographical organization of the cerebellum and itsefferents is probably very similar between zebrafish, mouse, andhuman (Fig. 2C). This idea is further supported by comparingthe efferents of zebrafish larvae with WGA staining in transienttransgenic adult fish with WGA/tagRFP-T expression in sub-domains of the PC layer (SI Appendix, Fig. S8). In sum, thesedata suggest that the lateral part of the larval zebrafish cere-bellum corresponds to the human flocculus and the caudal partof the larval zebrafish cerebellum corresponds to the humancaudal vermis, whereas the rostromedial part of the zebrafishlarval cerebellum likely corresponds to the human paravermis.
Spatially Restricted Activity of Purkinje Neurons. We next focusedon two behaviors likely being influenced by the cerebellum: theoptomotor reflex (OMR) and the optokinetic response (OKR)(26–30). We established OMR and OKR induction on a stage ofa confocal microscope to allow for in vivo imaging of PC activity
A C
B
Fig. 1. Efferent mapping of the adult zebrafish cerebellum. (A) Character-ization of the PC-specific regulatory element in stable transgenic zebrafish(FyntagRFPT:PC:EGFP). SI Appendix, Fig. S1 shows detailed information aboutthe PC-specific enhancer. (A1) Schematic drawing of the plasmid construct usinga bidirectional PC-specific tandem enhancer. This enhancer was combinedwith the zebrafish E1b minimal promoter sequence. The globin intron (GI)promotes the nuclear export of the mRNA, whereas the polyA (pA) sequencestabilizes the mRNA. (A2) This enhancer element induces specific transgeneexpression (EGFP) in the zebrafish cerebellum. (Scale bar: 200 μm.) Five confocalimages are integrated into this picture, and white lines indicate the divisionbetween each original image. (A3) Expression is confined to PCs, which is in-dicated by colocalization with the PC-specific marker ZebrinII in optical confocalmicroscopy sections (1.068 μm). (Scale bar: 20 μm.) (A4) Live imaging of Fyn-tagRFPT:PC:EGFP. In litandem, this element allows strong bidirectional expres-sion in PCs (EGFP and membrane-localized FyntagRFP-T; optical sections of2.361 μm). (Scale bar: 100 μm.) (B) Immunohistochemical staining of the WGAprotein and RNA in situ hybridization ofwgamRNA. In sagittal brain sections ofwga mRNA in situ hybridization, (B1 and B2) anti–tagRFP-T and (B3 and B4)anti-WGA immunohistochemistry staining was localized in the cerebellar PClayer, and (B1 and B2) no significant signals of tagRFP-T protein andwgamRNAwere detected outside of the cerebellum. TheWGA protein, instead, was foundin many brain regions (B3 and B4 represent medial and lateral sagittal sections,respectively). Transverse sections are shown in B5 and SI Appendix, Fig. S3. B5indicates representative signals of high-magnification transverse sections show-ing lateral valvular nucleus and inferior olive staining, and SI Appendix, Fig. S3shows low-magnification images of these structures. (B6) No significant stainingof WGA protein was observed in control [Tg(FyntagRFP-T:PC:empty)] sections.Inset in B6 shows an antibody staining against FyntagRFP-T expression as a pos-itive control for the immunohistochemical analysis. n = 5 adult brains. (Scale bars:B1–B4 and B6, 500 μm; B5, 50 μm.) (C) Summary of the efferent PC network ofthe zebrafish cerebellum. Efferent targets were categorized by well-knownfunction and/or connection. Anatomical nomenclature and abbreviations areaccording to the zebrafish brain atlas (46, 47), and SI Appendix, Fig. S3 shows thelist of these abbreviations. AON, anterior octaval nucleus; CCe, corpus cerebella;CM, mammillary body; DIL, diffuse nucleus of the inferior lobe; DON, descendingoctaval nucleus; DTN, dorsal tegmental nucleus; EW, Edinger–Westphal nucleus;GC, central gray; Hc, caudal zone of periventricular hypothalamus; Hd, dorsalzone of periventricular hypothalamus, IGL, internal granule cell layer; IO, inferiorolive; LLF, lateral longitudinal fascicle; LRN, lateral reticular nucleus; MLF, mediallongitudinal fascicle; MON, medial octavolateralis nucleus; NLV, lateral valvularnucleus; NIII, oculomotor nucleus; NR, red nucleus; PPa, parvocellular preopticnucleus, anterior part; PPv, periventricular pretectal nucleus, ventral part; RF,reticular formation; SO, secondary octaval population; SRF, superior reticularformation; TeO, optic tectum; TL, longitudinal torus; TPp, periventricular nucleusof posterior tuberculum; TS, semicircular torus; Val, valvular cerebellum; VT,ventral thalamus; Vv, ventral nucleus of ventral telencephalic area.
Matsui et al. PNAS | August 12, 2014 | vol. 111 | no. 32 | 11847
NEU
ROSC
IENCE
SEECO
MMEN
TARY
at high spatial and temporal resolutions in behaving larvae (SIAppendix, Fig. S9 and Movie S1). To analyze PC activity duringthese behaviors, we aimed for using genetically encoded calciumindicators (GECIs). Their use in PCs is challenging, because it iswell-established that GECIs provide only low-signal intensity
changes during the recording of Ca2+ transients in cerebellarPCs (31). To partially overcome this problem, we screeneda number of available GECIs for their emission properties inPCs. Although GCaMP2, GCaMP3, GECO1.1, and GECO1.2provided a low sensitivity (10, 32, 33), GCaMP5G emittedsufficiently strong amplitudes for discriminating PCs withfluctuating Ca2+ levels from inactive PCs (34). Furthermore,we increased the GECI expression level by tetramerizing thePC-specific regulatory element, and this transgene was usedto generate a stable transgenic strain Tg(tagRFP-T:PC:GCaMP5G). Next, continuous Ca2+ fluctuation recordings atlow magnification were performed across the entire PC layerat 3.64 Hz to localize Ca2+-level changes of zebrafish larvaeduring OMR and OKR performance. Although such record-ings using GECIs do not allow for distinguishing single-PCaction potentials (31), they do reveal areas of cumulative ac-tivity of PCs and thus, allow for revealing the physiologicalinvolvement of PC areas in certain behaviors (Figs. 3 and 4A).First, the head of the larvae was restrained in agarose, whereas
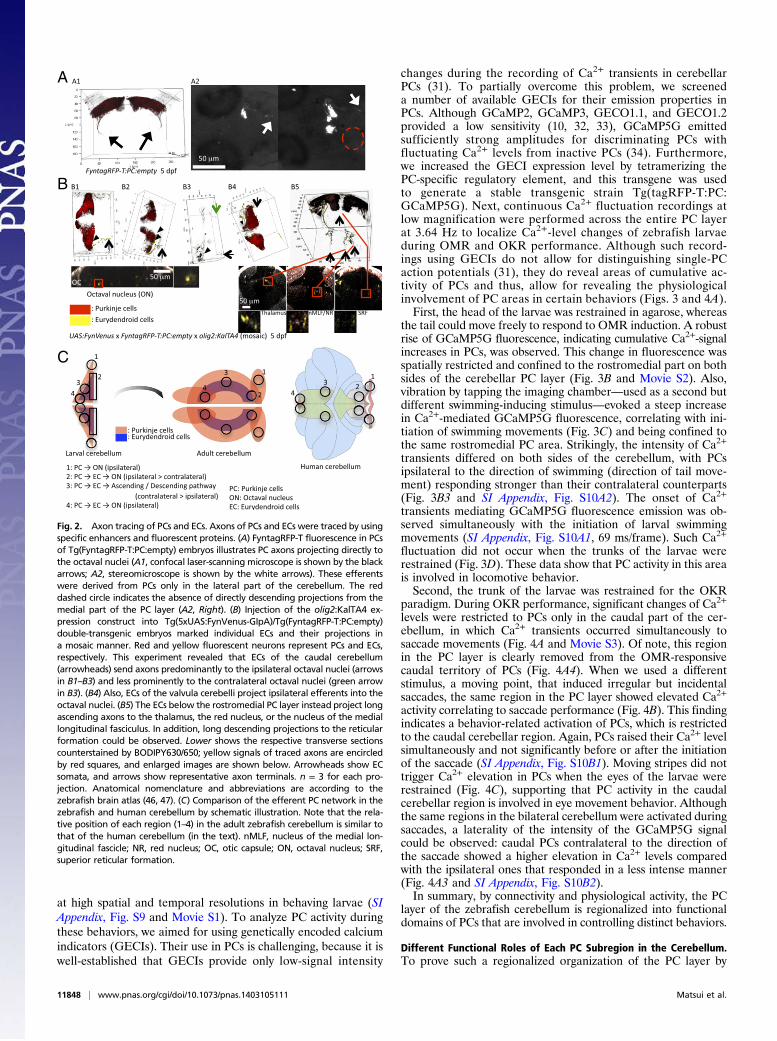
the tail could move freely to respond to OMR induction. A robustrise of GCaMP5G fluorescence, indicating cumulative Ca2+-signalincreases in PCs, was observed. This change in fluorescence wasspatially restricted and confined to the rostromedial part on bothsides of the cerebellar PC layer (Fig. 3B and Movie S2). Also,vibration by tapping the imaging chamber—used as a second butdifferent swimming-inducing stimulus—evoked a steep increasein Ca2+-mediated GCaMP5G fluorescence, correlating with ini-tiation of swimming movements (Fig. 3C) and being confined tothe same rostromedial PC area. Strikingly, the intensity of Ca2+
transients differed on both sides of the cerebellum, with PCsipsilateral to the direction of swimming (direction of tail move-ment) responding stronger than their contralateral counterparts(Fig. 3B3 and SI Appendix, Fig. S10A2). The onset of Ca2+
transients mediating GCaMP5G fluorescence emission was ob-served simultaneously with the initiation of larval swimmingmovements (SI Appendix, Fig. S10A1, 69 ms/frame). Such Ca2+
fluctuation did not occur when the trunks of the larvae wererestrained (Fig. 3D). These data show that PC activity in this areais involved in locomotive behavior.Second, the trunk of the larvae was restrained for the OKR
paradigm. During OKR performance, significant changes of Ca2+
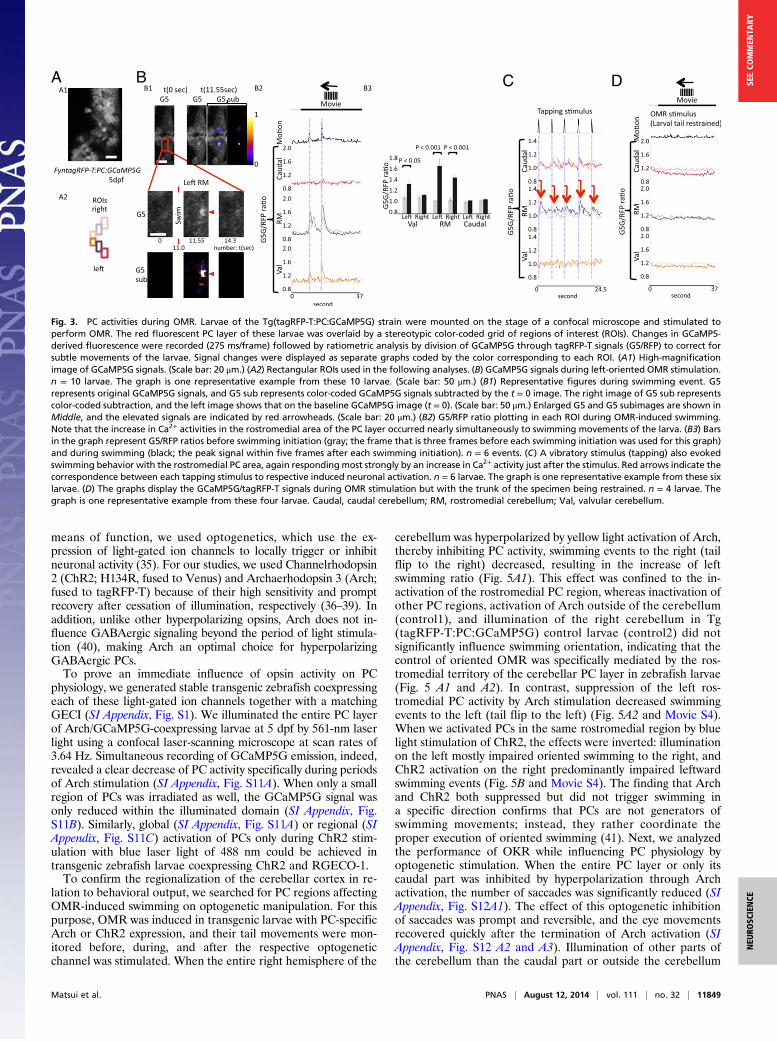
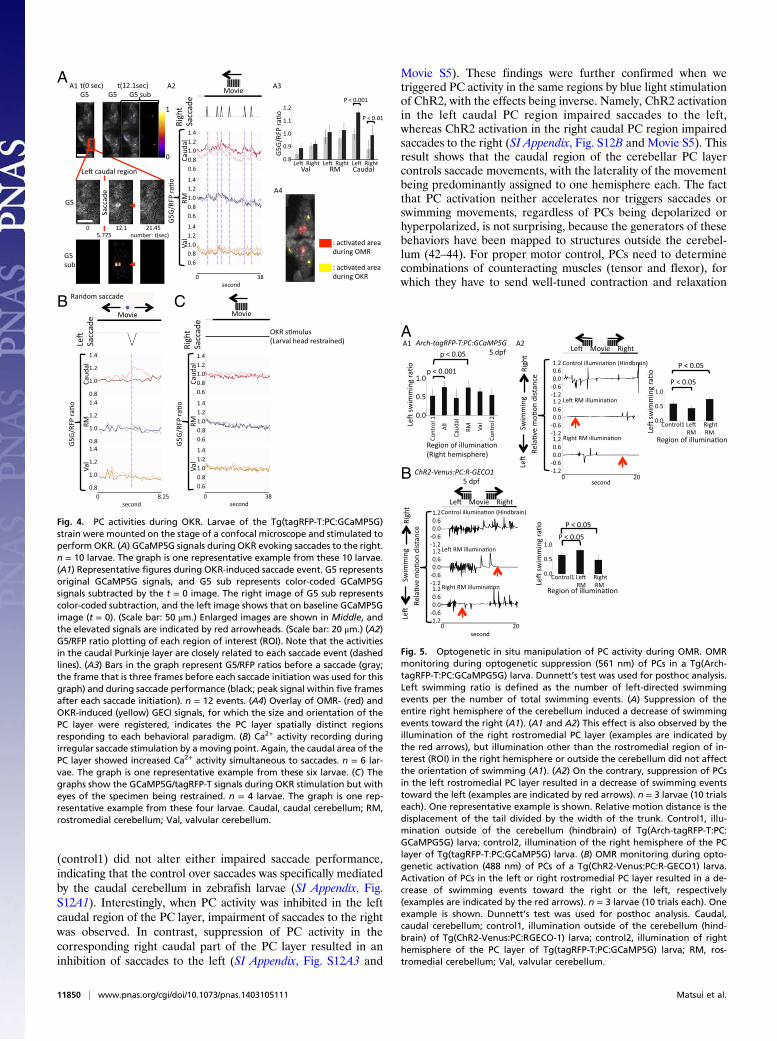
levels were restricted to PCs only in the caudal part of the cer-ebellum, in which Ca2+ transients occurred simultaneously tosaccade movements (Fig. 4A and Movie S3). Of note, this regionin the PC layer is clearly removed from the OMR-responsivecaudal territory of PCs (Fig. 4A4). When we used a differentstimulus, a moving point, that induced irregular but incidentalsaccades, the same region in the PC layer showed elevated Ca2+
activity correlating to saccade performance (Fig. 4B). This findingindicates a behavior-related activation of PCs, which is restrictedto the caudal cerebellar region. Again, PCs raised their Ca2+ levelsimultaneously and not significantly before or after the initiationof the saccade (SI Appendix, Fig. S10B1). Moving stripes did nottrigger Ca2+ elevation in PCs when the eyes of the larvae wererestrained (Fig. 4C), supporting that PC activity in the caudalcerebellar region is involved in eye movement behavior. Althoughthe same regions in the bilateral cerebellum were activated duringsaccades, a laterality of the intensity of the GCaMP5G signalcould be observed: caudal PCs contralateral to the direction ofthe saccade showed a higher elevation in Ca2+ levels comparedwith the ipsilateral ones that responded in a less intense manner(Fig. 4A3 and SI Appendix, Fig. S10B2).In summary, by connectivity and physiological activity, the PC
layer of the zebrafish cerebellum is regionalized into functionaldomains of PCs that are involved in controlling distinct behaviors.
Different Functional Roles of Each PC Subregion in the Cerebellum.To prove such a regionalized organization of the PC layer by
A
B
C
Fig. 2. Axon tracing of PCs and ECs. Axons of PCs and ECs were traced by usingspecific enhancers and fluorescent proteins. (A) FyntagRFP-T fluorescence in PCsof Tg(FyntagRFP-T:PC:empty) embryos illustrates PC axons projecting directly tothe octaval nuclei (A1, confocal laser-scanning microscope is shown by the blackarrows; A2, stereomicroscope is shown by the white arrows). These efferentswere derived from PCs only in the lateral part of the cerebellum. The reddashed circle indicates the absence of directly descending projections from themedial part of the PC layer (A2, Right). (B) Injection of the olig2:KalTA4 ex-pression construct into Tg(5xUAS:FynVenus-GIpA)/Tg(FyntagRFP-T:PC:empty)double-transgenic embryos marked individual ECs and their projections ina mosaic manner. Red and yellow fluorescent neurons represent PCs and ECs,respectively. This experiment revealed that ECs of the caudal cerebellum(arrowheads) send axons predominantly to the ipsilateral octaval nuclei (arrowsin B1–B3) and less prominently to the contralateral octaval nuclei (green arrowin B3). (B4) Also, ECs of the valvula cerebelli project ipsilateral efferents into theoctaval nuclei. (B5) The ECs below the rostromedial PC layer instead project longascending axons to the thalamus, the red nucleus, or the nucleus of the mediallongitudinal fasciculus. In addition, long descending projections to the reticularformation could be observed. Lower shows the respective transverse sectionscounterstained by BODIPY630/650; yellow signals of traced axons are encircledby red squares, and enlarged images are shown below. Arrowheads show ECsomata, and arrows show representative axon terminals. n = 3 for each pro-jection. Anatomical nomenclature and abbreviations are according to thezebrafish brain atlas (46, 47). (C) Comparison of the efferent PC network in thezebrafish and human cerebellum by schematic illustration. Note that the rela-tive position of each region (1–4) in the adult zebrafish cerebellum is similar tothat of the human cerebellum (in the text). nMLF, nucleus of the medial lon-gitudinal fascicle; NR, red nucleus; OC, otic capsule; ON, octaval nucleus; SRF,superior reticular formation.
11848 | www.pnas.org/cgi/doi/10.1073/pnas.1403105111 Matsui et al.
means of function, we used optogenetics, which use the ex-pression of light-gated ion channels to locally trigger or inhibitneuronal activity (35). For our studies, we used Channelrhodopsin2 (ChR2; H134R, fused to Venus) and Archaerhodopsin 3 (Arch;fused to tagRFP-T) because of their high sensitivity and promptrecovery after cessation of illumination, respectively (36–39). Inaddition, unlike other hyperpolarizing opsins, Arch does not in-fluence GABAergic signaling beyond the period of light stimula-tion (40), making Arch an optimal choice for hyperpolarizingGABAergic PCs.To prove an immediate influence of opsin activity on PC
physiology, we generated stable transgenic zebrafish coexpressingeach of these light-gated ion channels together with a matchingGECI (SI Appendix, Fig. S1). We illuminated the entire PC layerof Arch/GCaMP5G-coexpressing larvae at 5 dpf by 561-nm laserlight using a confocal laser-scanning microscope at scan rates of3.64 Hz. Simultaneous recording of GCaMP5G emission, indeed,revealed a clear decrease of PC activity specifically during periodsof Arch stimulation (SI Appendix, Fig. S11A). When only a smallregion of PCs was irradiated as well, the GCaMP5G signal wasonly reduced within the illuminated domain (SI Appendix, Fig.S11B). Similarly, global (SI Appendix, Fig. S11A) or regional (SIAppendix, Fig. S11C) activation of PCs only during ChR2 stim-ulation with blue laser light of 488 nm could be achieved intransgenic zebrafish larvae coexpressing ChR2 and RGECO-1.To confirm the regionalization of the cerebellar cortex in re-
lation to behavioral output, we searched for PC regions affectingOMR-induced swimming on optogenetic manipulation. For thispurpose, OMR was induced in transgenic larvae with PC-specificArch or ChR2 expression, and their tail movements were mon-itored before, during, and after the respective optogeneticchannel was stimulated. When the entire right hemisphere of the
cerebellum was hyperpolarized by yellow light activation of Arch,thereby inhibiting PC activity, swimming events to the right (tailflip to the right) decreased, resulting in the increase of leftswimming ratio (Fig. 5A1). This effect was confined to the in-activation of the rostromedial PC region, whereas inactivation ofother PC regions, activation of Arch outside of the cerebellum(control1), and illumination of the right cerebellum in Tg(tagRFP-T:PC:GCaMP5G) control larvae (control2) did notsignificantly influence swimming orientation, indicating that thecontrol of oriented OMR was specifically mediated by the ros-tromedial territory of the cerebellar PC layer in zebrafish larvae(Fig. 5 A1 and A2). In contrast, suppression of the left ros-tromedial PC activity by Arch stimulation decreased swimmingevents to the left (tail flip to the left) (Fig. 5A2 and Movie S4).When we activated PCs in the same rostromedial region by bluelight stimulation of ChR2, the effects were inverted: illuminationon the left mostly impaired oriented swimming to the right, andChR2 activation on the right predominantly impaired leftwardswimming events (Fig. 5B and Movie S4). The finding that Archand ChR2 both suppressed but did not trigger swimming ina specific direction confirms that PCs are not generators ofswimming movements; instead, they rather coordinate theproper execution of oriented swimming (41). Next, we analyzedthe performance of OKR while influencing PC physiology byoptogenetic stimulation. When the entire PC layer or only itscaudal part was inhibited by hyperpolarization through Archactivation, the number of saccades was significantly reduced (SIAppendix, Fig. S12A1). The effect of this optogenetic inhibitionof saccades was prompt and reversible, and the eye movementsrecovered quickly after the termination of Arch activation (SIAppendix, Fig. S12 A2 and A3). Illumination of other parts ofthe cerebellum than the caudal part or outside the cerebellum
A B C D
Fig. 3. PC activities during OMR. Larvae of the Tg(tagRFP-T:PC:GCaMP5G) strain were mounted on the stage of a confocal microscope and stimulated toperform OMR. The red fluorescent PC layer of these larvae was overlaid by a stereotypic color-coded grid of regions of interest (ROIs). Changes in GCaMP5-derived fluorescence were recorded (275 ms/frame) followed by ratiometric analysis by division of GCaMP5G through tagRFP-T signals (G5/RFP) to correct forsubtle movements of the larvae. Signal changes were displayed as separate graphs coded by the color corresponding to each ROI. (A1) High-magnificationimage of GCaMP5G signals. (Scale bar: 20 μm.) (A2) Rectangular ROIs used in the following analyses. (B) GCaMP5G signals during left-oriented OMR stimulation.n = 10 larvae. The graph is one representative example from these 10 larvae. (Scale bar: 50 μm.) (B1) Representative figures during swimming event. G5represents original GCaMP5G signals, and G5 sub represents color-coded GCaMP5G signals subtracted by the t = 0 image. The right image of G5 sub representscolor-coded subtraction, and the left image shows that on the baseline GCaMP5G image (t = 0). (Scale bar: 50 μm.) Enlarged G5 and G5 subimages are shown inMiddle, and the elevated signals are indicated by red arrowheads. (Scale bar: 20 μm.) (B2) G5/RFP ratio plotting in each ROI during OMR-induced swimming.Note that the increase in Ca2+ activities in the rostromedial area of the PC layer occurred nearly simultaneously to swimming movements of the larva. (B3) Barsin the graph represent G5/RFP ratios before swimming initiation (gray; the frame that is three frames before each swimming initiation was used for this graph)and during swimming (black; the peak signal within five frames after each swimming initiation). n = 6 events. (C) A vibratory stimulus (tapping) also evokedswimming behavior with the rostromedial PC area, again respondingmost strongly by an increase in Ca2+ activity just after the stimulus. Red arrows indicate thecorrespondence between each tapping stimulus to respective induced neuronal activation. n = 6 larvae. The graph is one representative example from these sixlarvae. (D) The graphs display the GCaMP5G/tagRFP-T signals during OMR stimulation but with the trunk of the specimen being restrained. n = 4 larvae. Thegraph is one representative example from these four larvae. Caudal, caudal cerebellum; RM, rostromedial cerebellum; Val, valvular cerebellum.
Matsui et al. PNAS | August 12, 2014 | vol. 111 | no. 32 | 11849
NEU
ROSC
IENCE
SEECO
MMEN
TARY
(control1) did not alter either impaired saccade performance,indicating that the control over saccades was specifically mediatedby the caudal cerebellum in zebrafish larvae (SI Appendix, Fig.S12A1). Interestingly, when PC activity was inhibited in the leftcaudal region of the PC layer, impairment of saccades to the rightwas observed. In contrast, suppression of PC activity in thecorresponding right caudal part of the PC layer resulted in aninhibition of saccades to the left (SI Appendix, Fig. S12A3 and
Movie S5). These findings were further confirmed when wetriggered PC activity in the same regions by blue light stimulationof ChR2, with the effects being inverse. Namely, ChR2 activationin the left caudal PC region impaired saccades to the left,whereas ChR2 activation in the right caudal PC region impairedsaccades to the right (SI Appendix, Fig. S12B and Movie S5). Thisresult shows that the caudal region of the cerebellar PC layercontrols saccade movements, with the laterality of the movementbeing predominantly assigned to one hemisphere each. The factthat PC activation neither accelerates nor triggers saccades orswimming movements, regardless of PCs being depolarized orhyperpolarized, is not surprising, because the generators of thesebehaviors have been mapped to structures outside the cerebel-lum (42–44). For proper motor control, PCs need to determinecombinations of counteracting muscles (tensor and flexor), forwhich they have to send well-tuned contraction and relaxation
A
B C
Fig. 4. PC activities during OKR. Larvae of the Tg(tagRFP-T:PC:GCaMP5G)strain were mounted on the stage of a confocal microscope and stimulated toperform OKR. (A) GCaMP5G signals during OKR evoking saccades to the right.n = 10 larvae. The graph is one representative example from these 10 larvae.(A1) Representative figures during OKR-induced saccade event. G5 representsoriginal GCaMP5G signals, and G5 sub represents color-coded GCaMP5Gsignals subtracted by the t = 0 image. The right image of G5 sub representscolor-coded subtraction, and the left image shows that on baseline GCaMP5Gimage (t = 0). (Scale bar: 50 μm.) Enlarged images are shown in Middle, andthe elevated signals are indicated by red arrowheads. (Scale bar: 20 μm.) (A2)G5/RFP ratio plotting of each region of interest (ROI). Note that the activitiesin the caudal Purkinje layer are closely related to each saccade event (dashedlines). (A3) Bars in the graph represent G5/RFP ratios before a saccade (gray;the frame that is three frames before each saccade initiation was used for thisgraph) and during saccade performance (black; peak signal within five framesafter each saccade initiation). n = 12 events. (A4) Overlay of OMR- (red) andOKR-induced (yellow) GECI signals, for which the size and orientation of thePC layer were registered, indicates the PC layer spatially distinct regionsresponding to each behavioral paradigm. (B) Ca2+ activity recording duringirregular saccade stimulation by a moving point. Again, the caudal area of thePC layer showed increased Ca2+ activity simultaneous to saccades. n = 6 lar-vae. The graph is one representative example from these six larvae. (C) Thegraphs show the GCaMP5G/tagRFP-T signals during OKR stimulation but witheyes of the specimen being restrained. n = 4 larvae. The graph is one rep-resentative example from these four larvae. Caudal, caudal cerebellum; RM,rostromedial cerebellum; Val, valvular cerebellum.
A
B
Fig. 5. Optogenetic in situ manipulation of PC activity during OMR. OMRmonitoring during optogenetic suppression (561 nm) of PCs in a Tg(Arch-tagRFP-T:PC:GCaMPG5G) larva. Dunnett’s test was used for posthoc analysis.Left swimming ratio is defined as the number of left-directed swimmingevents per the number of total swimming events. (A) Suppression of theentire right hemisphere of the cerebellum induced a decrease of swimmingevents toward the right (A1). (A1 and A2) This effect is also observed by theillumination of the right rostromedial PC layer (examples are indicated bythe red arrows), but illumination other than the rostromedial region of in-terest (ROI) in the right hemisphere or outside the cerebellum did not affectthe orientation of swimming (A1). (A2) On the contrary, suppression of PCsin the left rostromedial PC layer resulted in a decrease of swimming eventstoward the left (examples are indicated by red arrows). n = 3 larvae (10 trialseach). One representative example is shown. Relative motion distance is thedisplacement of the tail divided by the width of the trunk. Control1, illu-mination outside of the cerebellum (hindbrain) of Tg(Arch-tagRFP-T:PC:GCaMPG5G) larva; control2, illumination of the right hemisphere of the PClayer of Tg(tagRFP-T:PC:GCaMP5G) larva. (B) OMR monitoring during opto-genetic activation (488 nm) of PCs of a Tg(ChR2-Venus:PC:R-GECO1) larva.Activation of PCs in the left or right rostromedial PC layer resulted in a de-crease of swimming events toward the right or the left, respectively(examples are indicated by the red arrows). n = 3 larvae (10 trials each). Oneexample is shown. Dunnett’s test was used for posthoc analysis. Caudal,caudal cerebellum; control1, illumination outside of the cerebellum (hind-brain) of Tg(ChR2-Venus:PC:RGECO-1) larva; control2, illumination of righthemisphere of the PC layer of Tg(tagRFP-T:PC:GCaMP5G) larva; RM, ros-tromedial cerebellum; Val, valvular cerebellum.
11850 | www.pnas.org/cgi/doi/10.1073/pnas.1403105111 Matsui et al.
commands controlling muscle tonus (2, 45). Increasing eitherone will impair proper movement execution.
DiscussionIn this report, we have used noninvasive in vivo methods to showa regionalized output organization of the zebrafish cerebellar PClayer into areas that control different behaviors. Shown by Ca2+
imaging and optogenetic manipulation, the caudal part of thecerebellar PC layer controls saccadic eye movements, and thesePCs send projections to the octaval populations, which is shownby transneuronal WGA mapping and axon tracing of ECs. Incontrast, swimming behavior is controlled by the rostromedialpart of the PC layer, which is connected to the locomotor-relatedsystem of the CNS as revealed by WGA transport from PCs toascending and descending projections and the axonal projectionof rostromedial ECs. Therefore, not only the input but also, theoutput of the vertebrate cerebellar PC layer are organized intounits of different functions. Our zebrafish model offers a pow-erful in vivo approach for addressing how such regionalizedneuronal networks are organized and optimized during braindifferentiation to generate an optimal physiological output.In conclusion, by mostly using noninvasive methods on freely
behaving animals, we have shown a regionalized functional
organization of the output of the PC layer in the zebrafish cer-ebellum. Therefore, not only the input but also, the output of thevertebrate cerebellar PC layer are organized into units of dif-ferent functions. Our zebrafish model offers a powerful in vivoapproach for addressing how such regionalized neuronal net-works are organized and optimized during brain differentiationto generate an optimal physiological output.
Materials and MethodsFor in vivo calcium imaging, larvae were kept in 30% (vol/vol) Danieau’ssolution containing 75 μM 1-phenyl 2-thiourea (PTU) from 1 dpf. tagRFP-T and fluctuating GCaMP5G fluorescence were monitored under a confocalmicroscope (TCS SP8; Leica Microsystems) simultaneously to observe animalbehavior. Fish for optogenetics combined with behavioral monitoring werekept in 30% Danieau’s solution. When optogenetics were combined withcalcium imaging, 75 μM PTU was added to the medium from 1 dpf onward.Illumination of Arch was performed using a 561-nm laser, whereas ChR2 wasilluminated using the 488-nm laser.
ACKNOWLEDGMENTS. We thank Angela Traudt, Eva Saxinger, and TimoFritsch for technical support. We also thank Dr. Mario F. Wullimann forintense discussions and Dr. Marta Zagrebelsky for carefully commenting onthe manuscript. This work was supported by funding from DeutscheForschungsgemeinschaft Grant KO 1949/7-1 and an Alexander von Hum-boldt Fellowship (to H.M.).
1. Timmann D, et al. (2010) The human cerebellum contributes to motor, emotional andcognitive associative learning. A review. Cortex 46(7):845–857.
2. Carpenter MB (1992) Core Text of Neuroanatomy (Lippincott Williams & Wilkins,Philadelphia), 4th Ed.
3. Guyton AC, Hall JE (2005) Textbook of Medical Physiology (Saunders, Philadelphia),11th Ed.
4. Aizenberg M, Schuman EM (2011) Cerebellar-dependent learning in larval zebrafish.J Neurosci 31(24):8708–8712.
5. Bolk L (1906) Das Cerebellum der Säugetiere: Eine vergleichende anatomische Un-tersuchung (Fischer, Stuttgart).
6. Manni E, Petrosini L (2004) A century of cerebellar somatotopy: A debated repre-sentation. Nat Rev Neurosci 5(3):241–249.
7. Dow RS, Moruzzi G (1958) The Physiology and Pathology of the Cerebellum (Min-nesota Univ Press, Minneapolis).
8. Scott EK (2009) The Gal4/UAS toolbox in zebrafish: New approaches for definingbehavioral circuits. J Neurochem 110(2):441–456.
9. Yoshihara Y, et al. (1999) A genetic approach to visualization of multisynaptic neuralpathways using plant lectin transgene. Neuron 22(1):33–41.
10. Tian L, et al. (2009) Imaging neural activity in worms, flies and mice with improvedGCaMP calcium indicators. Nat Methods 6(12):875–881.
11. Adamantidis AR, Zhang F, Aravanis AM, Deisseroth K, de Lecea L (2007) Neural sub-strates of awakening probed with optogenetic control of hypocretin neurons. Nature450(7168):420–424.
12. Shin J, Park HC, Topczewska JM, Mawdsley DJ, Appel B (2003) Neural cell fate analysisin zebrafish using olig2 BAC transgenics. Methods Cell Sci 25(1-2):7–14.
13. Park HC, Shin J, Roberts RK, Appel B (2007) An olig2 reporter gene marks oligoden-drocyte precursors in the postembryonic spinal cord of zebrafish. Dev Dyn 236(12):3402–3407.
14. Bae YK, et al. (2009) Anatomy of zebrafish cerebellum and screen for mutations af-fecting its development. Dev Biol 330(2):406–426.
15. Pouwels E (1978) On the development of the cerebellum of the trout, Salmo gaird-neri. III. Development of neuronal elements. Anat Embryol (Berl) 153(1):37–54.
16. Pouwels E (1978) On the development of the cerebellum of the trout, Salmo gaird-neri. IV. Development of the pattern of connectivity. Anat Embryol (Berl) 153(1):55–65.
17. Volkmann K, Rieger S, Babaryka A, Köster RW (2008) The zebrafish cerebellarrhombic lip is spatially patterned in producing granule cell populations of differentfunctional compartments. Dev Biol 313(1):167–180.
18. Wullimann MF, Northcutt RG (1988) Connections of the corpus cerebelli in the greensunfish and the common goldfish: A comparison of perciform and cypriniform tele-osts. Brain Behav Evol 32(5):293–316.
19. Ikenaga T, Yoshida M, Uematsu K (2002) Efferent connections of the cerebellum ofthe goldfish, Carassius auratus. Brain Behav Evol 60(1):36–51.
20. Wullimann MF, Rooney DJ (1990) A direct cerebello-telencephalic projection in anelectrosensory mormyrid fish. Brain Res 520(1-2):354–357.
21. Altman J, Bayer SA (1997) Development of the Cerebellar System in Relation to ItsEvolution, Structure, and Function (CRC, Boca Raton, FL).
22. Hoggatt AM, Lannoo MJ (1994) Monoclonal antibody anti-type I and anti-zebrin IIlabelling in siluriform fishes: The role of shared lineage versus shared function inpolypeptide co-distributions. Brain Res 665(2):181–191.
23. Lannoo MJ, Ross L, Maler L, Hawkes R (1991) Development of the cerebellum and itsextracerebellar Purkinje cell projection in teleost fishes as determined by zebrin IIimmunocytochemistry. Prog Neurobiol 37(4):329–363.
24. Distel M, Wullimann MF, Köster RW (2009) Optimized Gal4 genetics for permanentgene expression mapping in zebrafish. Proc Natl Acad Sci USA 106(32):13365–13370.
25. Sgaier SK, et al. (2005) Morphogenetic and cellular movements that shape the mousecerebellum; insights from genetic fate mapping. Neuron 45(1):27–40.
26. Omata T, et al. (2000) Purkinje cell activity in the middle zone of the cerebellarflocculus during optokinetic and vestibular eye movement in cats. Jpn J Physiol 50(3):357–370.
27. Angelaki DE, Hess BJ (1994) The cerebellar nodulus and ventral uvula control thetorsional vestibulo-ocular reflex. J Neurophysiol 72(3):1443–1447.
28. Beck JC, Rothnie P, Straka H, Wearne SL, Baker R (2006) Precerebellar hindbrainneurons encoding eye velocity during vestibular and optokinetic behavior in thegoldfish. J Neurophysiol 96(3):1370–1382.
29. Maurer CM, Huang YY, Neuhauss SC (2011) Application of zebrafish oculomotorbehavior to model human disorders. Rev Neurosci 22(1):5–16.
30. Paul DH, Roberts BL (1984) The activity of cerebellar neurones of the decerebratedogfish Scyliorhinus during spontaneous swimming movements. J Physiol 352:1–16.
31. Yamada Y, et al. (2011) Quantitative comparison of genetically encoded Ca indicatorsin cortical pyramidal cells and cerebellar Purkinje cells. Front Cell Neurosci 5:18.
32. Zhao Y, et al. (2011) An expanded palette of genetically encoded Ca²⁺ indicators.Science 333(6051):1888–1891.
33. Tallini YN, et al. (2006) Imaging cellular signals in the heart in vivo: Cardiac expressionof the high-signal Ca2+ indicator GCaMP2. Proc Natl Acad Sci USA 103(12):4753–4758.
34. Akerboom J, et al. (2012) Optimization of a GCaMP calcium indicator for neural ac-tivity imaging. J Neurosci 32(40):13819–13840.
35. Tye KM, Deisseroth K (2012) Optogenetic investigation of neural circuits underlyingbrain disease in animal models. Nat Rev Neurosci 13(4):251–266.
36. Chow BY, et al. (2010) High-performance genetically targetable optical neural si-lencing by light-driven proton pumps. Nature 463(7277):98–102.
37. Nagel G, et al. (2005) Light activation of channelrhodopsin-2 in excitable cellsof Caenorhabditis elegans triggers rapid behavioral responses. Curr Biol 15(24):2279–2284.
38. Boyden ES, Zhang F, Bamberg E, Nagel G, Deisseroth K (2005) Millisecond-timescale,genetically targeted optical control of neural activity. Nat Neurosci 8(9):1263–1268.
39. Zhang F, et al. (2007) Multimodal fast optical interrogation of neural circuitry. Nature446(7136):633–639.
40. Raimondo JV, Kay L, Ellender TJ, Akerman CJ (2012) Optogenetic silencing strategiesdiffer in their effects on inhibitory synaptic transmission. Nat Neurosci 15(8):1102–1104.
41. Del Bene F, Wyart C (2012) Optogenetics: A new enlightenment age for zebrafishneurobiology. Dev Neurobiol 72(3):404–414.
42. Schoonheim PJ, Arrenberg AB, Del Bene F, Baier H (2010) Optogenetic localizationand genetic perturbation of saccade-generating neurons in zebrafish. J Neurosci30(20):7111–7120.
43. Wyart C, et al. (2009) Optogenetic dissection of a behavioural module in the verte-brate spinal cord. Nature 461(7262):407–410.
44. Arrenberg AB, Del Bene F, Baier H (2009) Optical control of zebrafish behavior withhalorhodopsin. Proc Natl Acad Sci USA 106(42):17968–17973.
45. Standring S (2005) Gray’s Anatomy: The Anatomical Basis of Clinical Practice (ChurchillLivingstone, Philadelphia), 39th Ed.
46. Wullimann MF, Rupp B, Reichert H (1996) Neuroanatomy of the Zebrafish Brain(Birkhaeuser, Basel).
47. Mueller T, Wullimann MF (2005) Atlas of Early Zebrafish Brain Development (Elsevier,Amsterdam).
Matsui et al. PNAS | August 12, 2014 | vol. 111 | no. 32 | 11851
NEU
ROSC
IENCE
SEECO
MMEN
TARY