Embed Size (px)
Citation preview
1
Supporting Information for
Functional Nucleic Acid-based
Electrochemiluminescent Biosensor for Interaction
Study and Detection of Ag+ Ions and Cysteine
Chun-Xia Tang, Nan-Nan Bu, Xi-Wen He, Xue-Bo Yin *
State Key Laboratory of Medicinal Chemical Biology and Research Center for Analytical Sciences,
College of Chemistry, Nankai University, Tianjin, 300071, P. R. China.
AUTHOR EMAIL ADDRESS: [email protected]
Content s
Experimental Section
The construction of ECL aptasensor for detection of Ag+ ions and Cys
Investigation of intercalation of Ru(phen)32+ into the duplex with fluorescent titration
The electrochemical behavior of the biosensor
Selectivity of the present biosensor for Ag+ ions
Selectivity of the biosensor for Cys
The comparison of analytical performance of various biosensor for Ag+ ions and Cys
Validation of the performance of the biosensor based on C-Ag+-C complex
The comparison of “turn-on” and “turn-off” detection strategies
Supplementary Material (ESI) for Chemical Communications This journal is © The Royal Society of Chemistry 2011

2
Experimental Section
Apparatus. The electrochemical measurements for ECL emission were carried out on a Model
LK98BII Microcomputer-based Electrochemical Analyzer (Tianjin Lanlike High-Tech Company,
Tianjin, China). A traditional three-electrode system was used with Ag/AgCl/KCl (satured) as reference
electrode, a 3-mm diameter Au disk modified electrode as working electrode, and Pt wire as counter
electrode. The ECL emission was detected by using a model MPI-A Chemiluminescence Analyzer
(Xi’An Remax Electronic Science & Technology Co. Ltd, Xi’An, China) at room temperature. The
voltage of the PMT was set at -900 V in the detection process. The fluorescence is measured using an F-
4500 spectrofluorometer (Hitachi, Japan) with a 1 cm quartz cell at room temperature.
Reagents. HPLC-purified DNA oligonucleotides were provided by Takara Biotechnology (Dalian,
China) with the following sequences:
1: 5’-SH-(CH2)6-CCCCC-3’ (SS1)
2: 5’-CCCCC GTT TGT AAT AGA ACA A GAG T TGT TCT ATT ACA AAC -3’ (denoted as
Functional Oligonucleotides, FO). C5 section is used to recognize of Ag+ ion and form C-Ag+-C
complex. The italic part can form intermolecular duplex and is used for Ru(phen)32+ intercalation. Black
GAG is a loop for the formation of duplex.)
3: 5’- GGGGG-3’ (SS2)
All oligonucleotides were diluted to 5 μM in TE buffer (10 mM Tris-HCl, 1 mM EDTA, pH 7.5) as
single strand concentration. Tris(1,10-phenanthroline)ruthenium chloride hydrate (Ru(phen)3Cl2 ·H2O)
and tripropylamine (TPA) were obtained from Sigma-Aldrich, Shanghai, China. 2-Mercaptoethanol
(MCE) used to block the active sits was obtained from Yangguang Yunneng Biotechnology Company,
Tianjin, China. Saline solutions were prepared with Mn(Ac)2, Mg(NO3)2, Pb(NO3)2, Zn(Ac)2,
Cd(NO3)2, Fe(NO3)3, CaCl2, Co(Ac)2, Cu(NO3)2, AgNO3, and Hg(NO3)2. Various amino acids were
used to investigate the potential interference and to validate the selectivity of this biosensor for the Cys.
Sensing Ag+ ions. The procedure for determination of Ag+ ions using the ECL biosensor was
presented in Scheme 1. The new gold electrode (3-mm in diameter) was polished with 0.3- and 0.05-μm
Supplementary Material (ESI) for Chemical Communications This journal is © The Royal Society of Chemistry 2011

3
aluminum slurry and ultrasonicated with distilled water for 3 minutes. The electrodes were cleaned
further in 0.1 M H2SO4 by potential scanning between -0.2-1.6 V until a remarkable voltammetric peak
was obtained. The gold electrode was modified with SS-DNA (C5, SS1) using 6 μL of 5 μM thiolated
oligonucleotide solution for 0.5 h at 36 °C. Then, 2-mercaptoethanol (MCE) was used to block the
active sites for 0.5 h at 36 °C. At the same time, 10 μM FO was mixed with 1 mM Ru(phen)32+ at 4 °C
in refrigerator over night for the probe intercalation (Scheme 1A). 10 μM G5 (SS2) was added into FO
intercalated with Ru(phen)32+ for the formation of G-C double helix structure for 1 h at 36 °C. 5 μL as-
prepared FO and 10 μL sample containing Ag+ ions were dropped onto the SS1-modified electrode for
0.5 h at 36 °C. During this period, the C-Ag+-C construction formed and the probe, Ru(phen)32+, was
introduced into the electrode surface (Scheme 1C). After the modified electrode was cleaned
thoroughly, the potential was scanned linearly from 0 to 1.25 V vs Ag/AgCl with 20 mM TPA as co-
reactant for ECL determination of Ag+ ions. The selectivity of the biosensor was tested in the presence
of the competing metal ions such as Mn2+, Mg2+, Pb2+, Zn2+, Cd2+, Fe3+, Ca2+, Co2+, Ag+, and Cu2+.
Sensing Cys. For sensing Cys, the mixture of 10 μL of 100 nM Ag+ ions and 5 μL of as-prepared FO
prepared freshly was incubated onto the C5-modified electrode. Further, 10 μL of the sample containing
Cys was dropped onto the FO-modified electrode (Scheme 1D). The interaction between Cys and Ag+
ion dissociated the C-Ag+-C complex and the ECL probe, Ru(phen)32+ was released. The change (ΔIECL)
in the emission before and after reacting to the sample was used to quantify the content of Cys.
The recovery experiment of Cys and the result comparison between the present method and ESI-MS
were used to validate the performance of the biosensor. Human serum samples were obtained from
volunteers and provided by a local hospital. 10 μL of the serum sample was diluted to 1000 μL for Cys
determination. Similar to the standard solution, 10 μL of the serum sample with and without spiked Cys
was dropped onto the FO-modified electrode for intramolecular displacement between Cys and cytosine
bases in C-Ag+-C complex.
Supplementary Material (ESI) for Chemical Communications This journal is © The Royal Society of Chemistry 2011

4
The construction of ECL aptasensor for detection of Ag+ ions and Cys
The formation of C-Ag+-C complex and the intercalation of Ru(phen)32+ into the formed duplex play
an important role in the present biosensor for Ag+ and Cys. Ag+ has a strong interaction with nucleic
acid containing multi-cytosine, and thus, the complex formed between Ag+ and cytosine can be used as
a platform for probing Ag+. 1-9 Ru(phen)32+ has the capacity to be intercalated into the preformed duplex
of DNA and is used to develop various ECL DNA-based biosensors. 10 Other, Cys is much strong Ag+
ion-binder and can interact with Ag+ to dissociate the C-Ag+-C complex. 11-12 A functional
oligonucleotide (FO) is therefore designed to integrate a cytosine-rich section for Ag+ ion recognition
and an intermolecular duplex for intercalation of Ru(phen)32+. The duplex was designed as only 4
cytosine bases in the total 35 bases, so Ag+ ion has weak interaction to the duplex section in FO. To
eliminate the hybrid between Ag+ ions and the duplex section, the strand for duplex in FO was designed
as cytosine-poor sequence as shown in Experimental section. With this design, the ECL sensor for Ag+
ion and Cys was constructed as illustrated in Scheme 1. The incubation of FO and Ru(phen)32+ achieved
the intercalation of Ru(phen)32+ into the intermolecular duplex (Scheme 1A). The interaction between
Ru(phen)32+ and the duplex was investigated with fluorescent titration experiment as shown in Fig. S1.
To avoid the self-assembly between cytosine-rich sections in different FOs and Ag+ ions, a G-C duplex
preformed with the Ag+ ion recognition section and a G5 oligonucleotide (Scheme 1B). To introduce FO
onto a gold electrode surface, a thiolated C5 oligonucleotide was immobilized onto the electrode surface
through gold-thiol bond. In the presence of Ag+ ions, C-Ag+-C complex formed between FO and the
immobilized C5 sequence (Scheme 1C). In this mode, the FO containing ECL probe Ru(phen)32+ was
introduced onto the electrode surface. An ECL emission was observed when a potential was applied
with tripropylamine (TPA) as co-reactant. The emission was employed to monitor Ag+ ion
concentration. The strong interaction between Cys and Ag+ ion can dissociate the C-Ag+-C complex.
Then, the FO was released from the electrode surface as shown in Scheme 1D. Correspondingly, the
decreased emission was used to quantify the content of Cys.
Investigation of intercalation of Ru(phen)32+ into the duplex with fluorescent titration
Supplementary Material (ESI) for Chemical Communications This journal is © The Royal Society of Chemistry 2011
5
Functional oligonucleotide functions as the intercalation of Ru(phen)32+ into the duplex and the
formation of C-Ag+-C complex. To validate the formation of intermolecular duplex, the intercalation of
Ru(phen)32+ and that whether the two parts interfere to each other, a fluorescent titration experiment was
carried out (Fig. S1). Ru(phen)32+ has natural fluorescent emission but DNA strand not. Moreover, the
intercalation can enhance the fluorescent emission. As shown in Fig. S1, the fluorescent emission was
enhanced as FO concentration increased from 0 to 0.4 μM and then the intensity levelled off. There are
two kinds of interaction between Ru(phen)32+ and adjacent DNA base pairs (bps), one is the strong
intercalation and the other is the electrostatic interaction. 10, 13-14 The strong intercalation between
Ru(phen)32+ and DNA bps resulted in the enhanced luminescence. 10, 13 Thus, once Ru(phen)3
2+ was
totally intercalated into the duplex, no further increase in fluorescence emission was observed even the
concentration of FO increased. Binding constant and site size can be calculated from the fluorescence
data. 10, 13 Using the data in Fig. S1, the calculated ratio (i.e. site size) between base pair number of
duplex in FO and Ru(phen)32+ molecules was 3.97:1, similar to the previous result of 4:1. 10, 13 The
consistent result indicated the successful formation of intermolecular duplex and the intercalation of
Ru(phen)32+. It also validated that the Ag+ ion recognition section did not interfere to the formation of
duplex and intercalation of Ru(phen)32+. There are 16 bps in the duplex section of FO and every 4 bps
can be intercalated with one Ru(phen)32+ molecule, so four Ru(phen)3
2+ molecules were integrated into
one FO strand. Comparing with the chemical labelling signal molecule at the end of DNA strand,15-17
the intercalation strategy provides a simple but efficient method to integrate the probe into the DNA
strand because no chemical labelling is needed and one strand can be integrated with four signal
molecules. 10, 13-14 The duplex was designed as only 4 cytosine bases in the total 35 bases, so Ag+ ion has
weak interaction to the duplex section in FO.
Supplementary Material (ESI) for Chemical Communications This journal is © The Royal Society of Chemistry 2011

6
Fig. S1. (A) Fluorescent titration of 1.0 μM Ru(phen)32+ using different concentration of FO (where
an intermolecular duplex section formed for the intercalation of Ru(phen)32+). (B) The profile of the
peak emission intensity and the concentration of FO.
Supplementary Material (ESI) for Chemical Communications This journal is © The Royal Society of Chemistry 2011

7
The electrochemical behavior of the biosensor
The electrochemistry during the preparation procedure of the biosensor was investigated to validate
the possibility of the biosensor. Fig. S2 shows the electrochemistry in 0.1 M phosphate buffer solution
(PBS) containing 20 mM TPA. A low TPA oxidation current appeared at the bare gold electrode (Fig.
s2a). Once the electrode was modified with C5, an improved peak current was observed. The integration
of FO on the electrode surface resulted in an enhancement of the anionic currents, while the oxidation
peak split into two parts. The first one was related to the oxidation of TPA and the second peak, as
shown by the arrow, was from the oxidation of Ru(phen)32+. The previous works 10, 18-19 validated that
dsDNA enhanced the TPA oxidation through the preconcentration and the improved deprotonation to
TPA 10, 18 or the high conductivity of double strand of DNA. 20 The catalytic action of Ru(phen)32+ also
increase the oxidation of TPA (Fig. S2c). The second peak, from the oxidation of Ru(phen)32+, validated
that the intercalated Ru(phen)32+ was successfully introduced onto the electrode surface.
Fig. S2. Cyclic voltammograms of (a) bare gold electrode, (b) C5-modified gold electrode, and (c)
electrode modified with FO in 0.1 M PBS solution containing 20 mM TPA. Scan rate: 0.2 V s-1.
The electrochemical behaviors of TPA and the intercalated Ru(phen)32+ were further investigated with
the cyclic voltammograms at different scan rates (Fig. S3). At C5-modified electrode, the anion currents
for TPA oxidation increased as the scan rates increased and the peak currents were directly proportional
to the square root of the scan rates (Fig. S3A and B). The results indicated TPA oxidation was
Supplementary Material (ESI) for Chemical Communications This journal is © The Royal Society of Chemistry 2011

8
controlled by its diffusion from the bulk solution to the electrode surface. After FO integrated with
Ru(phen)32+ was modified on the C5-modified electrode, an increase in the oxidation current was
observed as a comparison with the that at C5-modified electrode at the same scan rate. An improved
TPA oxidation was observed at dsDNA-modified electrode10, 18 and a low potential ECL biosensor was
successfully developed using the ECL emission from the improved TPA oxidation. 18 At high scan rate
(>0.15 V s-1), a shoulder peak appeared at about 1.10 V, that is the oxidation potential of ruthenium
complex (Ru(phen)32+ and Ru(bpy)3
2+). Moreover, the oxidation currents from the shoulder peaks
increased linearly with the increase in scan rate (Fig. S3D), indicating a surface-controlled
electrochemistry for Ru(phen)32+ oxidation. The results was same as the previous reports 21-22 and
proved that Ru(phen)32+ was immobilized onto the electrode surface.
Fig. S3. Cyclic voltammograms of the gold electrode modified with C5 (A) and the FO- Ru(phen)32+
complex via Ag+ ions (C) at different scan rates. (B) The relationship between the anodic peak currents
at Profile A and the square root of scan rates. (D) The relationship between the peak current as indicated
Supplementary Material (ESI) for Chemical Communications This journal is © The Royal Society of Chemistry 2011
9
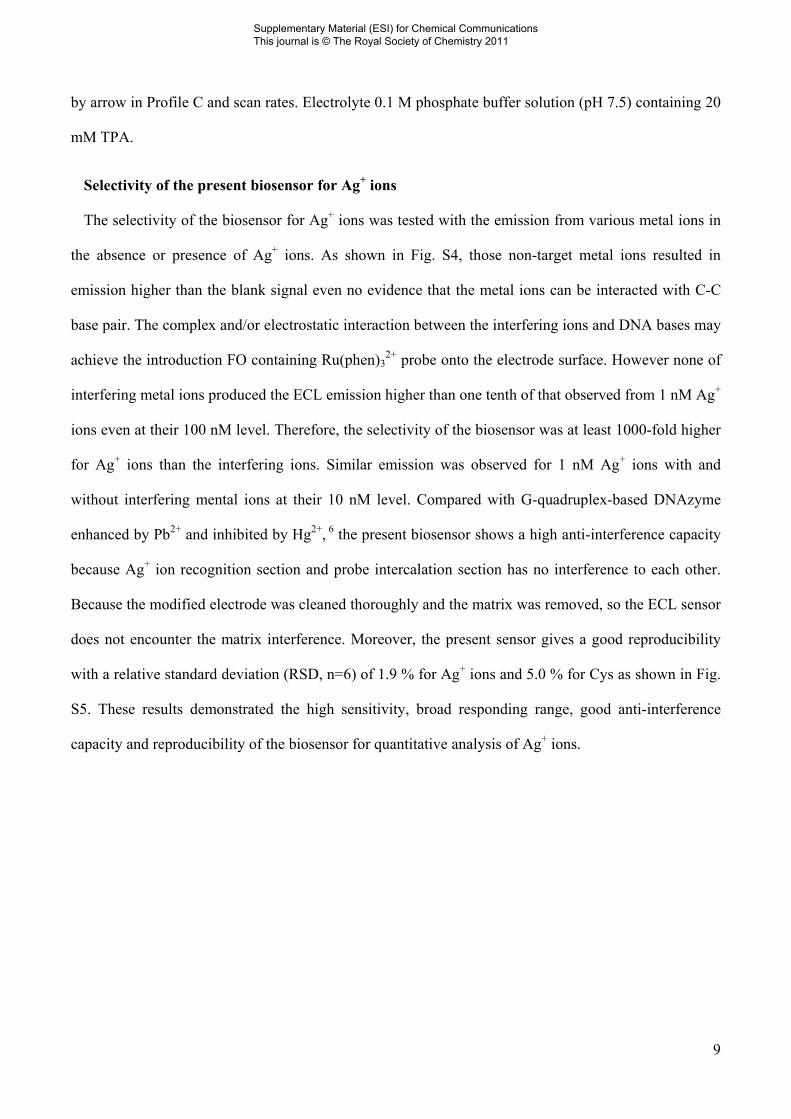
by arrow in Profile C and scan rates. Electrolyte 0.1 M phosphate buffer solution (pH 7.5) containing 20
mM TPA.
Selectivity of the present biosensor for Ag+ ions
The selectivity of the biosensor for Ag+ ions was tested with the emission from various metal ions in
the absence or presence of Ag+ ions. As shown in Fig. S4, those non-target metal ions resulted in
emission higher than the blank signal even no evidence that the metal ions can be interacted with C-C
base pair. The complex and/or electrostatic interaction between the interfering ions and DNA bases may
achieve the introduction FO containing Ru(phen)32+ probe onto the electrode surface. However none of
interfering metal ions produced the ECL emission higher than one tenth of that observed from 1 nM Ag+
ions even at their 100 nM level. Therefore, the selectivity of the biosensor was at least 1000-fold higher
for Ag+ ions than the interfering ions. Similar emission was observed for 1 nM Ag+ ions with and
without interfering mental ions at their 10 nM level. Compared with G-quadruplex-based DNAzyme
enhanced by Pb2+ and inhibited by Hg2+, 6 the present biosensor shows a high anti-interference capacity
because Ag+ ion recognition section and probe intercalation section has no interference to each other.
Because the modified electrode was cleaned thoroughly and the matrix was removed, so the ECL sensor
does not encounter the matrix interference. Moreover, the present sensor gives a good reproducibility
with a relative standard deviation (RSD, n=6) of 1.9 % for Ag+ ions and 5.0 % for Cys as shown in Fig.
S5. These results demonstrated the high sensitivity, broad responding range, good anti-interference
capacity and reproducibility of the biosensor for quantitative analysis of Ag+ ions.
Supplementary Material (ESI) for Chemical Communications This journal is © The Royal Society of Chemistry 2011

10
Fig. S4. Selectivity of the biosensor for Ag+ ion. All competing ions were at their 100 nM level. As a
comparison, the responses of 1.0 nM Ag+ ions, and the mixtures of 1 nM Ag+ and 10 nM for each other
ions were presented.
Fig. S5. The reproducibility of the present biosensor for (A) 1 nM Ag+ ions and (B) 5 nM Cys with six
repetitive determinations.
Supplementary Material (ESI) for Chemical Communications This journal is © The Royal Society of Chemistry 2011

11
Selectivity of the biosensor for Cys
To evaluate the selectivity of the sensor for detecting Cys, the ECL response of the biosensor to some
amino acids and GSSG (at 10 nM level) with and without 1.0 nM Cys was recorded. As shown in Fig.
6, Cys exhibited a significant decrease on the ECL emission, but those amino acids and GSSG did not
induce obvious ECL emission change. The signals from those amino acids and GSSG were less than
one tenth of that from 1.0 nM Cys even their concentration was ten times higher than Cys. In addition,
the ECL signal change by Cys was less than 5 % in the presence of amino acid and GSSG except for
phenylalanine and glycine (9.1 and -11.4 %, respectively). These results illustrated that none of the
tested amino acids have the interaction strong enough to dissociate the C-Ag+-C complex and the
biosensor has high selectivity for Cys over those amino acids and GSSG. As shown in Fig. 3B, GSH
may interfere to the determination of Cys because it contains free thiol group. However, once GSH is
oxidized and transferred into GSSG, the interference is eliminated.
Supplementary Material (ESI) for Chemical Communications This journal is © The Royal Society of Chemistry 2011

12
The comparison of analytical performance of various biosensors for Ag+ ions and Cys
Table S1 presented a comparison of the detection limits for Ag+ ions and Cys based on C-Ag+-C
strategy. We can find the detection limits of this biosensor were a few orders of magnitude lower than
those obtained by fluorescent and Colorimetric methods. Besides the high sensitivity of ECL and the
increased probe molecule number with the intercalation strategy for probe introduction, the low
background also contributed to the low detection limit. Gong and Li 8 designed a Y-type C-rich DNA
strand and immobilized the strand onto the electrode surface. A label-free electrochemical biosensor for
Ag+ ions and Cys was constructed using electrochemical impedance spectroscopy (EIS) with the
detection limits of 10 and 100 fM for the two species. Both the present work and Gong and Li’s work 8
validated the merits of electrochemical and related detections, such as simple setup and high sensitivity.
Supplementary Material (ESI) for Chemical Communications This journal is © The Royal Society of Chemistry 2011

13
Table S1. Method detection limits (DLs) for Ag+ ions and Cys with C-Ag+-C strategy using different
detection techniques.
Method Notes DLs/nM
Ref. For Ag+ For Cys
Colorimetry Ag+-induced disruption of G-
quadruplex–hemin DNAzyme 64 50 1
Colorimetry G-quadruplex–hemin DNAzyme-
amplified colorimetric detection 6.3 - 2
FL a Quench of FI of dye-labeled ss-DNA by
single-walled carbon nanotubes 1 9.5 3
Colorimetry Ag+-induced formation of G-quadruplex
DNAzyme for colorimetric detection 2.5 40 5
Colorimetry Ag+ ion induced formation of G-
quadruplex DNAzyme for colorimetric
detection
20 25 6
FL a Ag+-induced disruption of
triphenylmethane dye/ G-quadruplex
complex
36 59 7
EC a Electrochemical impedance spectroscopy
with Y-type, C-rich DNA probe 10 fM 100 fM 8
Colorimetry Ag+-induced aggregation of DNA-coated
Au nanoparticles 12 - 23
FL a Ag+-induced formation of duplex for
intercalation of SYBR Green I probe 32 - 24
ECLa A functional oligonucleotide for Ag
identification and ECL probe
intercalation
0.005 0.050 This work
a ECL: electrochemiluminescence; EC: electrochemistry; FL: fluorescence.
Supplementary Material (ESI) for Chemical Communications This journal is © The Royal Society of Chemistry 2011
14
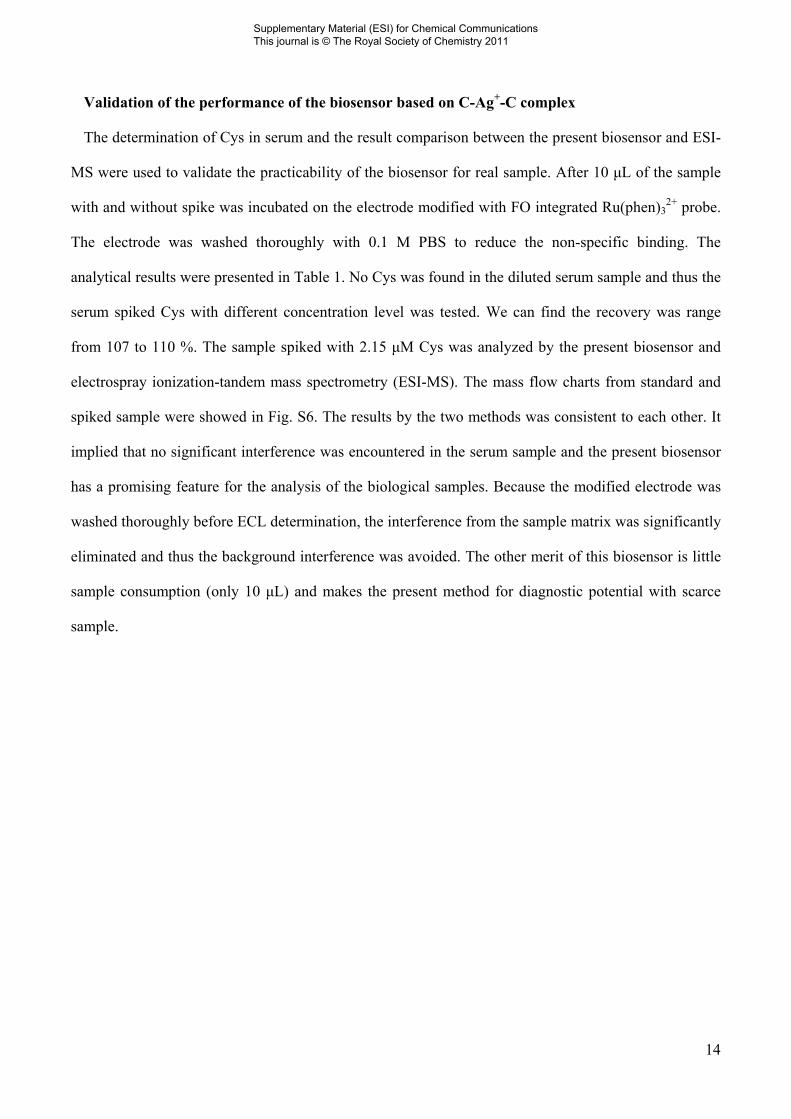
Validation of the performance of the biosensor based on C-Ag+-C complex
The determination of Cys in serum and the result comparison between the present biosensor and ESI-
MS were used to validate the practicability of the biosensor for real sample. After 10 μL of the sample
with and without spike was incubated on the electrode modified with FO integrated Ru(phen)32+ probe.
The electrode was washed thoroughly with 0.1 M PBS to reduce the non-specific binding. The
analytical results were presented in Table 1. No Cys was found in the diluted serum sample and thus the
serum spiked Cys with different concentration level was tested. We can find the recovery was range
from 107 to 110 %. The sample spiked with 2.15 μM Cys was analyzed by the present biosensor and
electrospray ionization-tandem mass spectrometry (ESI-MS). The mass flow charts from standard and
spiked sample were showed in Fig. S6. The results by the two methods was consistent to each other. It
implied that no significant interference was encountered in the serum sample and the present biosensor
has a promising feature for the analysis of the biological samples. Because the modified electrode was
washed thoroughly before ECL determination, the interference from the sample matrix was significantly
eliminated and thus the background interference was avoided. The other merit of this biosensor is little
sample consumption (only 10 μL) and makes the present method for diagnostic potential with scarce
sample.
Supplementary Material (ESI) for Chemical Communications This journal is © The Royal Society of Chemistry 2011

15
Fig. S6. Mass spectra of (A) diluted serum spiked 2.15 μM cysteine and (B) the 2.00 μM cysteine
standard solution with electrospray ionization-tandem mass spectrometry.
Supplementary Material (ESI) for Chemical Communications This journal is © The Royal Society of Chemistry 2011
16
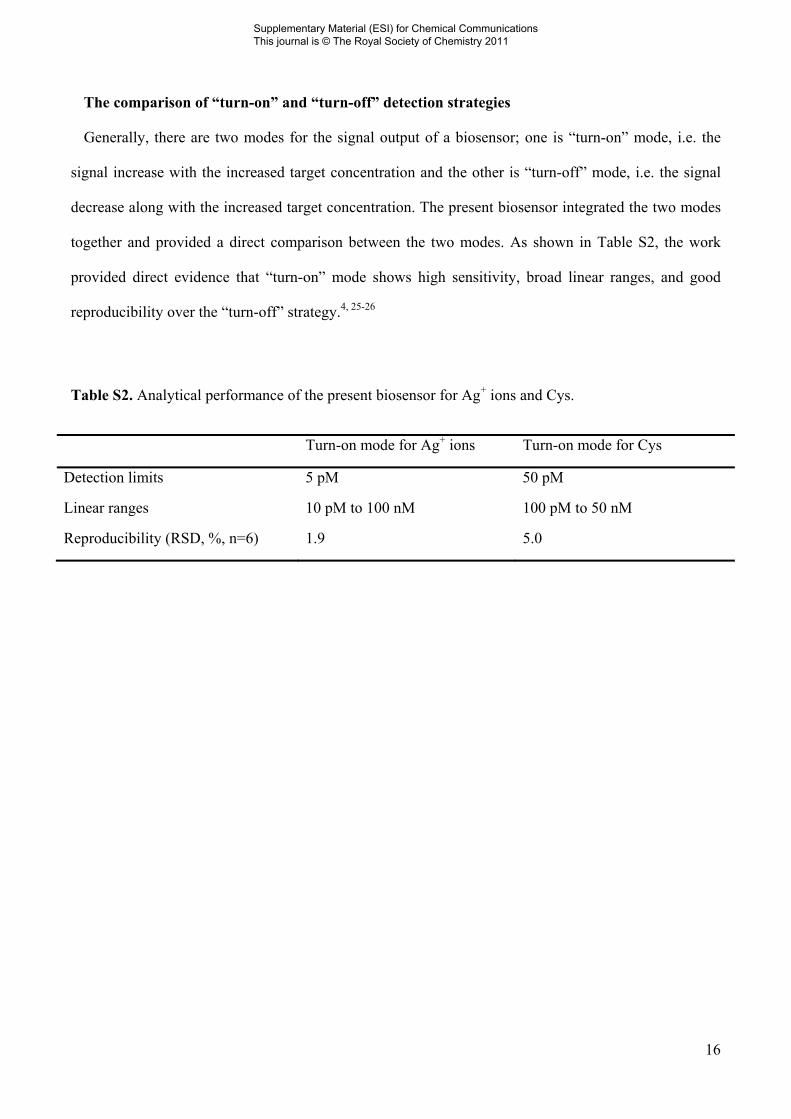
The comparison of “turn-on” and “turn-off” detection strategies
Generally, there are two modes for the signal output of a biosensor; one is “turn-on” mode, i.e. the
signal increase with the increased target concentration and the other is “turn-off” mode, i.e. the signal
decrease along with the increased target concentration. The present biosensor integrated the two modes
together and provided a direct comparison between the two modes. As shown in Table S2, the work
provided direct evidence that “turn-on” mode shows high sensitivity, broad linear ranges, and good
reproducibility over the “turn-off” strategy.4, 25-26
Table S2. Analytical performance of the present biosensor for Ag+ ions and Cys.
Turn-on mode for Ag+ ions Turn-on mode for Cys
Detection limits 5 pM 50 pM
Linear ranges 10 pM to 100 nM 100 pM to 50 nM
Reproducibility (RSD, %, n=6) 1.9 5.0
Supplementary Material (ESI) for Chemical Communications This journal is © The Royal Society of Chemistry 2011

17
REFERENCES
1. X.-H. Zhou, D.-M. Kong and H.-X. Shen, Anal. Chem., 2010, 82, 789-793. 2. X.-H. Zhou, D.-M. Kong and H.-X. Shen, Anal. Chim. Acta, 2010, 678, 124-127. 3. C. Zhao, K. G. Qu, Y. J. Song, C. Xu, J. S. Ren and X. G. Qu, Chem. Eur. J., 2010, 16, 8147-
8154. 4. A. Ono, S. Cao, H. Togashi, M. Tashiro, T. Fujimoto, T. Machinami, S. Oda, Y. Miyake, I.
Okamoto and Y. Tanaka, Chem. Commun., 2008, 4825-4827. 5. T. Li, L. L. Shi, E. K. Wang and S. J. Dong, Chem. Eur. J., 2009, 15, 3347-3350. 6. D.-M. Kong, L.-L. Cai and H.-X. Shen, Analyst., 2010, 135, 1253-1258. 7. J.-H. Guo, D.-M. Kong and H.-X. Shen, Biosens. Bioelectron., 2010, 26, 327-332. 8. H. Gong and X. Li, Analyst., 2011, 136, 2242-2246. 9. D. Q. Feng, G. L. Liu, W. J. Zheng, J. Liu, T. F. Chen and D. Li, Chem. Commun., 2011, 47,
8557-8559. 10. X. B. Yin, Y. Y. Xin and Y. Zhao, Anal. Chem., 2009, 81, 9299-9305. 11. J. L. Barriada, A. D. Tappin, E. H. Evans and E. P. Achterberg, Trac-Trends Anal. Chem., 2007,
26, 809-817. 12. A. D. Tappin, J. L. Barriada, C. B. Braungardt, E. H. Evans, M. D. Patey and E. P. Achterberg,
Water Res., 2010, 44, 4204-4216. 13. M. T. Carter and A. J. Bard, Bioconjugate Chem., 1990, 1, 257-263. 14. T. Kuwabara, T. Noda, H. Ohtake, T. Ohtake, S. Toyama and Y. Ikariyama, Anal. Biochem.,
2003, 314, 30-37. 15. Y. Xiao, R. Y. Lai and K. W. Plaxco, Nature Protocols, 2007, 2, 2875-2880. 16. Y. Xiao, A. A. Lubin, A. J. Heeger and K. W. Plaxco, Angew. Chem. Int. Ed., 2005, 44, 5456-
5459. 17. Y. Xiao, T. Uzawa, R. J. White, D. DeMartini and K. W. Plaxco, Electroanal., 2009, 21, 1267-
1271. 18. D. Y. Liu, Y. Y. Xin, X. W. He and X. B. Yin, Analyst., 2011, 136, 479-485. 19. D. Y. Liu, Y. Zhao, X. W. He and X. B. Yin, Biosens. Bioelectron., 2011, 26, 2905-2910. 20. T. L. Pittman and W. J. Miao, J. Phys. Chem. C, 2008, 112, 16999-17004. 21. B. Xing and X. B. Yin, Plos One, 2009, 4. 22. B. Xing and X. B. Yin, Biosens. Bioelectron., 2009, 24, 2939-2942. 23. B. L. Li, Y. Du and S. J. Dong, Anal. Chim. Acta, 2009, 644, 78-82. 24. Y. H. Lin and W. L. Tseng, Chem. Commun., 2009, 6619-6621. 25. Y. Miyake, H. Togashi, M. Tashiro, H. Yamaguchi, S. Oda, M. Kudo, Y. Tanaka, Y. Kondo, R.
Sawa, T. Fujimoto, T. Machinami and A. Ono, J. Am. Chem. Soc., 2006, 128, 2172-2173. 26. A. Ono and H. Togashi, Angew. Chem. Int. Ed., 2004, 43, 4300-4302.
Supplementary Material (ESI) for Chemical Communications This journal is © The Royal Society of Chemistry 2011