Embed Size (px)
Citation preview

Functional imaging with the multi-wavelength Adaptive Optics Scanning Laser Ophthalmoscope
Kate Grieve, Pavan Tiruveedhula, Yuhua Zhang, Austin Roorda University of California, Berkeley
School of Optometry Berkeley, CA 94720-2020 [email protected]
ABSTRACT
The adaptive optics scanning laser ophthalmoscope may be used in multi-wavelength mode to allow simultaneous imaging and retinal stimulation and so probe retinal function. The wavelengths available are 532 nm, 658 nm and 840 nm. Typically the imaging is performed at 840 nm and precisely coincident retinal stimulation occurs in one of the visible wavelengths. Simultaneous multi-wavelength imaging in the living human retina is demonstrated, and experiments to test retinal function that may be carried out using this instrument are presented. Keywords: (010.1080) adaptive optics; (170.0110) imaging systems; (170.4470) ophthalmology
1. INTRODUCTION The adaptive optics scanning laser ophthalmoscope (AOSLO) [1] is used for high resolution retinal imaging, revealing organization of cellular-level features such as the cone photoreceptor mosaic, and allowing measurement of blood flow in retinal capillaries [2]. Addition of an acousto-optic modulator (AOM) in the illumination path allows high frequency (50 MHz) modulation of the scanning laser beam, meaning that complex patterned stimuli may be written onto the retina and therefore into the image, so that stimulus location is precisely recorded within the image itself [3].
Recently, the AOSLO has been fitted with three light sources of different wavelengths to allow simultaneous dual-wavelength imaging [4]. The source wavelengths used are 532 nm, 658 nm and 840 nm. Dual-wavelength imaging is implemented at a 30 Hz frame rate by using both the forward and return scanning paths for imaging, thereby preserving the frame rate of the original AOSLO. Each illumination path contains an AOM. The AOMs are used to switch sources on and off to create book-matched dual-wavelength interleaved image pairs.
Each wavelength performs best at a different specific task, e.g. green light is best for blood flow imaging while infrared is best for imaging the cone mosaic. A combined multi-wavelength image may therefore contain more information than a single wavelength image [5].
The modified multi-wavelength AOSLO offers a wider range of applications than its single wavelength predecessor. Here, we describe a range of applications in functional imaging that may be performed using the multi-wavelength AOSLO. For these applications, we typically image the retina in near-infrared light (840 nm) as this light is relatively imperceptible to the subject and is therefore comfortable for imaging. The green (532 nm) or red (658 nm) source is then used to stimulate the retina. Stimulus delivery is controlled by independently modulating the AOMs in each illumination arm. Each AOM may be modulated digitally to switch the laser on or off to form a binary image, or may be operated in analog mode to create gray-scale images [3]. Since the AOM acts directly on the illuminating beam, the stimulus is written onto the retina by the scanning beam, meaning that the location where the stimulus has landed is automatically recorded within the image. In dual-wavelength mode, a pair of opposing contrast images can be sent to the retina, so that the patient sees the positive contrast stimulus in the visible wavelength and the position at which that stimulus landed on the retina is marked in the book-matched image by a corresponding negative contrast area. The high lateral resolution of our instrument allows us to precisely place a stimulus on the retina as small as the size of a single cone. We may
Ophthalmic Technologies XVII, edited by Fabrice Manns, Per G. Soederberg, Arthur Ho, Bruce E. Stuck, Michael Belkin,Proc. of SPIE Vol. 6426, 64261M, (2007) · 1605-7422/07/$18 · doi: 10.1117/12.702542
Proc. of SPIE Vol. 6426 64261M-1
Downloaded from SPIE Digital Library on 26 May 2010 to 128.32.232.50. Terms of Use: http://spiedl.org/terms

therefore hope to detect functional signals from very small areas of retina, with higher precision than is offered by the conventional fundus cameras traditionally used for retinal imaging.
Functional imaging applications that can be envisaged with this technique include measurement of blood flow [2], oximetry, photoreceptor bleaching, visual acuity measurement and intrinsic signal imaging [6-12]. Here, we will demonstrate our ability to perform such measurements.
2. DUAL-WAVELENGTH IMAGING 2.1 Instrument set-up and image capture The multi-wavelength AOSLO set-up has been described previously [4]. The set-up is shown in figure 1.
DM
Light Delivery
CP
BS LA M1
DMPCM2
M3
M4M5
HS
M6M7
VS
M8eye
L1 L2BS
EP
Source 3 (840 nm)
Source 1 (532 nm)
AOM 3
L3
Wavefront Compensation
Frame Grabbing
Wavefront Sensing
Raster Scanning
p
pp
CCD
r
r
rr
r
r
r
r
p
p
p
p
PMT
Light Detection
AOM 2Source 2 (658 nm)
AOM 1
DF1
DF2r
r
r
r
Fig. 1: The multi-wavelength adaptive optics scanning laser ophthalmoscope. Light delivery, wavefront sensing,
wavefront compensation, raster scanning, light detection and frame grabbing components are labeled. L# represent lenses while M# represent mirrors. Labels r and p indicate retinal and pupil conjugate points in the optical path. AOM #: acousto-optic modulator, DF#: dichroic filter, EP: entrance pupil, BS: beamsplitter, DM: deformable mirror, HS: horizontal scanner (16 kHz), VS: vertical scanner (30 Hz), LA: lenslet array, CP: confocal pinhole, PMT: photomultiplier tube.
To briefly describe the set-up, green (532 nm), red (658 nm) and infrared (840 nm) sources are delivered through independent AOMs and then directed into one collinear beam by a series of dichroic mirrors in periscope arrangements. Correct alignment of the instrument aims to make all three sources conjugate with the pinhole and the focused spot on the retina, so that optimal AO correction occurs for all three wavelengths at once, giving identical best resolution in all wavelengths, though in different planes due to LCA. The maximum power we used for imaging in either of the visible wavelengths was 20 µW, while we may use up to 200 µW of infrared light. Power levels at all wavelengths were at least a factor of 10 below limits recommended by ANSI [13].
Proc. of SPIE Vol. 6426 64261M-2
Downloaded from SPIE Digital Library on 26 May 2010 to 128.32.232.50. Terms of Use: http://spiedl.org/terms

A custom GUI interface has been developed to control the three AOMs. It allows fast switching between different wavelengths and control of stimulus delivery in all wavelength channels. A single wavelength is used for wavefront sensing and compensation, and the second wavelength is switched on once the correction has been fixed. Wavefront aberrations are measured with the same light as is used to form the image. A beamsplitter directs a small portion of this light to the Shack-Hartmann wavefront sensor (SHWFS) while the remainder passes through to the detector for imaging. Aberrations are fit to a 10th order Zernike polynomial.
Wavefront compensation is performed by a 37 channel deformable mirror (Xinetics, Andover, MA) in a pupil conjugate plane. Aberrations are corrected on ingoing and outgoing paths, on the ingoing path to focus the light to a compact spot on the retina and on the outgoing path to refocus the diffusely reflected light from the eye through the confocal pinhole. Wavefront correction is controlled using custom C++ and Labview software in a low bandwidth closed loop. The corrected beam passes through the confocal pinhole to a photomultiplier tube module and transimpedance amplifier which passes the signal to the input of the frame grabbing board. Scanning is carried out using a resonant scanner – galvanometric scanner combination at a frame sampling rate of 525 lines/frame at about 30 frames/second. Scanning is performed in pupil conjugate planes so that the scanning beam does not move at its pivot point in the pupil plane. Adjusting scan amplitude according to a precisely calibrated grid in the retinal plane allows choice of field size from 1°× 1° to 3° × 3°. Frames are generated by the frame grabbing board, whose timing is set by the scan. The horizontal scan is sinusoidal. In single wavelength mode, each line of the frame corresponds to the forward going part of the sinusoid. The source is switched off for the return path of the scan. In dual wavelength mode, the second wavelength source is switched on during the return path of the scan to form the second frame. Two frames are therefore captured simultaneously and at the same rate as single frame imaging (30 Hz). The two simultaneously captured frames are seen by the operator as a book-matched mirror imaged pair, while the subject being imaged sees the two superimposed. Image processing involves separating the two frames, correcting for sinusoidal distortion caused by scanning, and stabilizing frames to eliminate eye movement distortions [14, 15].
2.1 Imaging protocol
Informed consent was obtained from the subjects after we explained the nature and possible complications of the study. Our experiment was approved by the University of California, Berkeley Committee for the Protection of Human Subjects. As for previous studies with the AOSLO [1-4], patients were aligned and stabilized in the system using a bite bar, and the eye was cyclopleged. Trial lenses were used to correct the subject’s refractive error as accurately as possible before wavefront correction by the deformable mirror (DM) was implemented. Once the refractive error was at a suitable value, wavefront correction was performed by closing the adaptive optics loop. After a few iterations (typically less than 10), the best correction was reached and fixed to give static correction during movie capture. The second laser was switched on once the static correction had been fixed.
2.2 Typical result
Proc. of SPIE Vol. 6426 64261M-3
Downloaded from SPIE Digital Library on 26 May 2010 to 128.32.232.50. Terms of Use: http://spiedl.org/terms
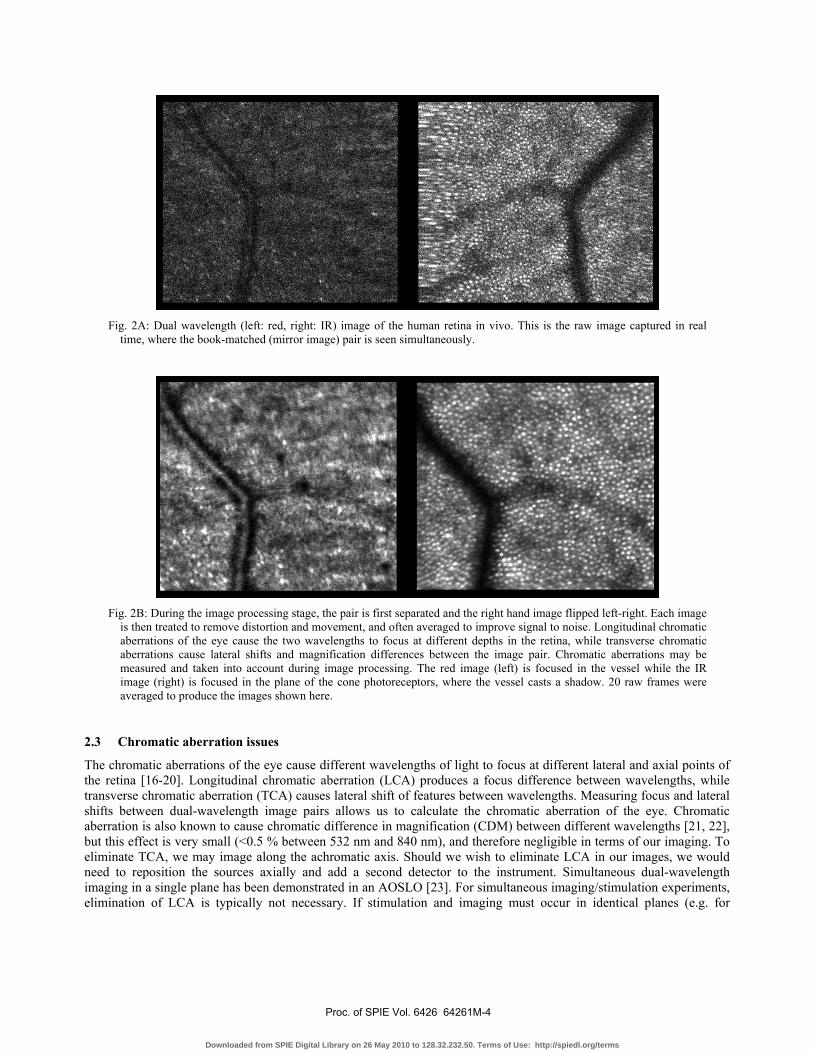
Fig. 2A: Dual wavelength (left: red, right: IR) image of the human retina in vivo. This is the raw image captured in real
time, where the book-matched (mirror image) pair is seen simultaneously.
Fig. 2B: During the image processing stage, the pair is first separated and the right hand image flipped left-right. Each image
is then treated to remove distortion and movement, and often averaged to improve signal to noise. Longitudinal chromatic aberrations of the eye cause the two wavelengths to focus at different depths in the retina, while transverse chromatic aberrations cause lateral shifts and magnification differences between the image pair. Chromatic aberrations may be measured and taken into account during image processing. The red image (left) is focused in the vessel while the IR image (right) is focused in the plane of the cone photoreceptors, where the vessel casts a shadow. 20 raw frames were averaged to produce the images shown here.
2.3 Chromatic aberration issues
The chromatic aberrations of the eye cause different wavelengths of light to focus at different lateral and axial points of the retina [16-20]. Longitudinal chromatic aberration (LCA) produces a focus difference between wavelengths, while transverse chromatic aberration (TCA) causes lateral shift of features between wavelengths. Measuring focus and lateral shifts between dual-wavelength image pairs allows us to calculate the chromatic aberration of the eye. Chromatic aberration is also known to cause chromatic difference in magnification (CDM) between different wavelengths [21, 22], but this effect is very small (<0.5 % between 532 nm and 840 nm), and therefore negligible in terms of our imaging. To eliminate TCA, we may image along the achromatic axis. Should we wish to eliminate LCA in our images, we would need to reposition the sources axially and add a second detector to the instrument. Simultaneous dual-wavelength imaging in a single plane has been demonstrated in an AOSLO [23]. For simultaneous imaging/stimulation experiments, elimination of LCA is typically not necessary. If stimulation and imaging must occur in identical planes (e.g. for
Proc. of SPIE Vol. 6426 64261M-4
Downloaded from SPIE Digital Library on 26 May 2010 to 128.32.232.50. Terms of Use: http://spiedl.org/terms

microperimetry), we can reposition only the sources and sacrifice optimum image quality in the stimulus channel, since the stimulus location is in any case marked in the image channel.
3. SIMULTANEOUS STIMULATION AND IMAGING
3.1 Methods
The most important feature of this instrument in terms of our research interests is the capacity to modulate each laser beam independently [3] at high frequency (50 MHz). In this way, we may present complex, patterned stimuli to the retina in visible light while simultaneously imaging the reaction to these stimuli under infrared light. Imaging in infrared carries the advantage of being comfortable for the subject since the retina is not sensitive to infrared wavelengths. A host of interesting experiments may be performed with this dual-frame simultaneous imaging and stimulation usage of the multi-wavelength AOSLO.
3.2 Example image
Figure 3 shows an example of a book-matched image pair in visible (left) and infrared (right) wavelengths, where the visible light shows a bright Snellen letter E on a dark background, and the exact location in which the E landed on the retina is recorded in the infrared image. Minimum stimulus size is limited only by pixel size of the frame grabber, so stimuli smaller than a single cone can be projected onto the retina to test individual cone function. The subject being imaged would see the stimulus shown in fig. 3 as a bright letter E superimposed on a dull red background (i.e. produced by the infrared imaging light). In our customized GUI we may project movies or sequences of images onto the retina, and the subject responds on a keyboard (e.g. to indicate the orientation of a visual acuity stimulus such as the E, or to indicate that he has seen a small dot stimulus).
Fig. 3: Simultaneous stimulation and imaging. The red image (left) is that used as stimulus, where the subject would see a bright E on a dark background. The IR image (right) records the precise location in which that stimulus landed on the retina. This is a single raw frame with no averaging.
Proc. of SPIE Vol. 6426 64261M-5
Downloaded from SPIE Digital Library on 26 May 2010 to 128.32.232.50. Terms of Use: http://spiedl.org/terms

4. APPLICATIONS
4.1 Introduction
A variety of new experiments are possible using this set-up, in the fields of visual acuity measurements, blood oximetry, and cone classification to offer a few examples. Here we will concentrate on two applications for which we have seen interesting preliminary results, namely microperimetry and intrinsic retinal signal detection. 4.2 Microperimetry
The principle of microperimetry experiments performed with the AOSLO is shown in Fig. 4. A small stimulus is projected onto a certain area of the retina, and the subject responds on a keyboard as to whether or not he has seen it. In retinal areas that show dysfunction, the subject will typically not respond as to having seen the stimulus. In Fig. 4, squares indicate successful detection of the stimulus by the patient, while crosses indicate stimuli that were not detected. This demonstration was prepared on a normal subject, and so crosses are more likely to indicate lapse in response attention than real lack of function of these retinal areas. We also obtain as a by-product of eye movement correction a precise fixation stability map (right hand side of Fig. 4), which indicates those measurements that must be discarded as the subject was not fixating at the foveal position (white markers on right hand image and corresponding white squares on the functional map).
This technique has been verified on normal subjects and tested on patients. We are currently in the process of implementing real-time image stabilization to our system which should greatly improve our ability to stimulate individual cones repeatably and accurately.
Fig. 4: Microperimetry demonstration. The left hand map shows the responses of the patient to stimuli placed at the locations marked. Squares indicate successfully detected stimuli, crosses are stimuli that were not detected. A fixational stability map is generated during the post-processing image stabilization process. This indicates which measurements
Proc. of SPIE Vol. 6426 64261M-6
Downloaded from SPIE Digital Library on 26 May 2010 to 128.32.232.50. Terms of Use: http://spiedl.org/terms

must be discarded as the subject was not fixating at the foveal position (white markers on right hand image and corresponding white squares on the functional map).
4.3 Intrinsic retinal signals
We have been looking at imaging of intrinsic retinal signals using the AOSLO, with the aim of assessing retinal function through the measurement of optical signals.
Other groups [6-12] have found an increase in backscattered infrared light from the retina in response to a visible light stimulus. This increase in scattered light in response to stimulation is what is meant by the term “intrinsic signal”.
Intrinsic retinal signals may be thought of as analogous to cortical functional imaging, where one sees scattering changes in the visual cortex in response to a visual stimulus. They are also somewhat analogous to ERG measurements, where an electrical signal is measured in response to a visible stimulus.
Intrinsic retinal signals have previously been detected with fundus imaging and OCT [6-12]. The origin of the signals detected is unclear. It has been suggested that they could be due to, for example, blood flow changes, blood oxygen content, cell swelling in response to stimulation, metabolism, or indeed a combination of such factors.
While fundus imaging gives a wide field lateral localization of these signals, and OCT gives a high depth resolution detection of the layer of signal origin, using AOSLO technology to investigate intrinsic signals may allow us to obtain a higher lateral resolution of the signal and a moderate depth resolution at the same time.
Most previous publications have used in vivo or in vitro animal models to look for intrinsic signals, while we are looking at the human retina in vivo. Other groups use white or green light stimuli while we use our red source as stimulus, to increase patient comfort and for convenient regulation of the power level through the red laser diode’s power supply. All previous publications perform imaging in infrared wavelengths. The stimulus strength (i.e. power and duration) varies considerably between groups.
We record 30 second movies, in which a brief flash stimulation occurs at 5 seconds. We typically average over 5 trials for each measurement. After correction for eye motion, data is displayed either as a difference image of the maximum response minus baseline (see Fig. 5) or as a plot of the cumulative mean of the mean ratio of the intensity of the stimulated region to that of the non-stimulated region.
Stimulus parameters such as duration, power, frequency, form, light versus dark adaptation, and lateral and depth location have been varied and the effects explored. In some observers, a robust response is obtained and the increase in light scattering in response to the stimulus is clearly visible (see Fig. 5). In others results were not repeatable, possibly due to eye movement artifacts or low signal to noise images in eyes with weakly scattering retinas. These possibilities are being investigated.
Fig. 5: The left hand column shows the form of the stimulus projected onto the retina through the visible wavelength channel. The right hand side shows a difference image of the infrared images of the retina at maximum response minus
Proc. of SPIE Vol. 6426 64261M-7
Downloaded from SPIE Digital Library on 26 May 2010 to 128.32.232.50. Terms of Use: http://spiedl.org/terms
baseline. The form of the stimulus is clearly revealed as an increase in scattered infrared light following stimulation. Field size was 3 degrees.
5. DISCUSSION We have demonstrated that with the multi-wavelength technology implemented in the AOSLO we are capable of testing retinal function at high resolution. Used in dual-frame mode with simultaneous imaging and stimulation, the AOSLO allows us to stimulate and gauge reaction to the stimulus in real time. Progress is currently being made in real time image stabilization techniques that will further increase our precision in stimulus delivery.
REFERENCES
1. A. Roorda, F. Romero-Borja, W. Donnelly, III, H. Queener, T. Hebert, and M. Campbell, “Adaptive optics scanning laser ophthalmoscopy,” Opt. Express 10 405-412 (2002) http://www.opticsinfobase.org/abstract.cfm?URI=oe-10-9-405 2. J. A. Martin. and A. Roorda, “Direct and Non-Invasive Assessment of Parafoveal Capillary Leukocyte Velocity” Ophthalmology 112 2219-2224 (2005). 3. S. Poonja, S. Patel., L. Henry, and A. Roorda, “Dynamic visual stimulus presentation in an adaptive optics scanning laser ophthalmoscope” Journal of Refractive Surgery 21: 575-580 (2005). 4. K. Grieve, P. Tiruveedhula, Y. Zhang, and A. Roorda, “Multi-wavelength imaging with the Adaptive Optics Scanning Laser Ophthalmoscope,” Opt. Express, in press. 5. F. Reinholz, R. A. Ashman, and R. H. Eikelboom, “Simultaneous Three Wavelength Imaging With a Scanning Laser Ophthalmoscope”, Cytometry 37:165-170 (1999). 6. K. Tsunoda, Y. Oguchi, G. Hanazono, M. Tanifuji, “Mapping Cone- and Rod-Induced Retinal Responsiveness in Macaque Retina by Optical Imaging,” IOVS 45:10, 3820-3826 (2004). 7. G. Hanazono, K. Tsunoda, M. Tanifuji, K. Shinoda, and Y. Miyake, “Fast and Slow Light Scattering Changes of Macaque Retina Observed by Intrinsic Signal Imaging,” Invest. Ophthalmol. Vis. Sci. (2006) 47: E-Abstract 3712. 8. M. D. Abramoff, Y.H. Kwon, D. Ts’o, P. Soliz, B. Zimmerman, J. Pokorny, R. Kardon, “Visual Stimulus-Induced Changes in Human Near-Infrared Fundus Reflectance,” IOVS 47:2, 715-721 (2006). 9. D. A. Nelson, S. Krupsky, A. Pollack, E. Aloni, M. Belkin, I. Vanzetta, M. Rosner, A. Grinvald, “Special Report: Noninvasive Multi-Parameter Functional Optical Imaging of the Eye,” Ophthalmic Surg. Lasers Imaging 36, 57-66 (2005). 10. K. Bizheva, R. Pflug, B. Hermann, B. Povazay, H. Sattmann, P. Qiu, E. Anger, H. Reitsamer, S. Popov, J. R. Taylor, A. Unterhuber, P. Ahnelt, W. Drexler, “Optophysiology: Depth-resolved probing of retinal physiology with functional ultrahigh-resolution optical coherence tomography,” PNAS 103:13, 5066-5071 (2006). 11.B. Hermann, B. Povazay, A. Unterhuber, M. Lessel, H. Sattmann, U. Schmidt–Erfurth, and W. Drexler, “Optophysiology of the Human RetinaWith Functional Ultrahigh Resolution Optical Coherence Tomography,” Invest. Ophthalmol. Vis. Sci. (2006) 47: E-Abstract 1672. 12. V. J. Srinivasan, M. Wojtkowski, J. G. Fujimoto, J. S. Duker, “In vivo measurement of retinal physiology with high-speed ultrahigh-resolution optical coherence tomography,” Opt. Lett 31:15, 2308-2310 (2006). 13. Safe Use of Lasers, ANSI Z136.1-1993. New York: American National Standards Institute (1993) and ANSI, American National Standard for the Safe Use of Lasers, ANSI Z136.1 (Laser Institute of America, Orlando, FL, 2000). 14. S. B. Stevenson, A. Roorda, “Correcting for Miniature Eye Movements in High Resolution Scanning Laser Ophthalmoscopy” in Ophthalmic Technologies XV, edited by Fabrice Manns, Per Soderberg, Arthur Ho, Proceedings of SPIE Vol. 5688A 145-151 (SPIE, Bellingham, WA, 2005). 15. C. R. Vogel, D. W. Arathorn, A. Roorda, and A. Parker, “Retinal Motion Estimation in Adaptive Optics Scanning Laser Ophthalmoscopy” Opt. Express 14: 487-497 (2006). 16. P. A. Howarth, and A. Bradley, “The Longitudinal Chromatic Aberration of the Human Eye, and its Correction” Vision Res. 26, 361-366 (1986). 17. L. N. Thibos, A. Bradley, D. L. Still, X. Zhang, and P. A. Howarth, “Theory and Measurement of Ocular Chromatic Aberration” Vision Res. 30 33-49 (1990). 18. P. Simonet, M.C.W. Campbell, “The Optical Transverse Chromatic Aberration on the Fovea of the Human Eye” Vision Res. 30 187-206 (1990).
Proc. of SPIE Vol. 6426 64261M-8
Downloaded from SPIE Digital Library on 26 May 2010 to 128.32.232.50. Terms of Use: http://spiedl.org/terms

19. C. Wildsoet, D. A. Atchison, and M. J. Collins, “Longitudinal chromatic aberration as a function of refractive error” Clin. Exper. Optom. 76 119-122 (1993). 20. E. Fernandez, A. Unterhuber, B. Povazay, B. Hermann, P. Artal, W. Drexler, “Chromatic aberration correction of the human eye for retinal imaging in the near infrared”, Opt. Express 14, 6213-6225 (2006). 21. X. Zhang, L. N. Thibos, and A. Bradley, “Relation between the Chromatic Difference of Refraction and the Chromatic Difference of Magnification for the Reduced Eye” Optom Vision Sci. 68, 456-8 (1991). 22. X. Zhang, A. Bradley, and L. N. Thibos, “Experimental determination of the chromatic difference of magnification of the human eye and the location of the anterior nodal point” J. Opt. Soc. Am. A 10, 213-220 (1993). 23. D. C. Gray, W. Merigan, J. I. Wolfing, B. P. Gee, J. Porter, A. Dubra, T. H. Twietmeyer, K. Ahamd, R. Tumbar, F. Reinholz, and D. R. Williams, "In vivo fluorescence imaging of primate retinal ganglion cells and retinal pigment epithelial cells," Opt. Express 14, 7144-7158 (2006) http://www.opticsinfobase.org/abstract.cfm?URI=oe-14-16-7144
Proc. of SPIE Vol. 6426 64261M-9
Downloaded from SPIE Digital Library on 26 May 2010 to 128.32.232.50. Terms of Use: http://spiedl.org/terms


![Live cell imaging: Visualization of [Ca 2+ ] i fluctuation Dual-wavelength methods –Alternating excitation wavelength with fixed emission observation (Fura)](https://img.pdfslide.us/doc/110x75/56649e855503460f94b87804/live-cell-imaging-visualization-of-ca-2-i-fluctuation-dual-wavelength.jpg)