Embed Size (px)
Citation preview

Instructions for use
Title Functional evaluation of bean husk as a new feed ingredient for monogastric animals
Author(s) Htun Myint
Citation 北海道大学. 博士(農学) 甲第13149号
Issue Date 2018-03-22
DOI 10.14943/doctoral.k13149
Doc URL http://hdl.handle.net/2115/73223
Type theses (doctoral)
File Information Htun_Myint.pdf
Hokkaido University Collection of Scholarly and Academic Papers : HUSCAP
Functional evaluation of bean husk as a new feed ingredient for
monogastric animals
(単胃動物のための新規飼料素材としてのマメ外皮の機能評価)
Doctor of Philosophy
in Division of Agrobiology, Graduate School of Agriculture
at Hokkaido University, Japan
Htun Myint
1
Abstract
Bean husk is an agricultural by-product that is generated from the processing of bean for
human consumption. Bean husk is rich in dietary fiber and phytochemicals such as polyphenols and
considered a new feed source candidate for various animals, but still underutilized. Bean husk fiber is
reported to selectively stimulate the growth of fiber-degrading bacteria in the gastrointestinal tract of
herbivorous livestock animals such as ruminants. Therefore, bean husk has gained attention as a new
possible source of functional fiber for other animals, in particular monogastrics. The objective of the
present study was to evaluate effect of bean husk on blood parameters, cecal fermentation and
microbial community in rats and dogs; the results are expected to provide insights into the future
development of functional foods for monogastric animals.
For evaluation of chickpea (Cicer arietinum) husk, feeding study using fifteen male SD rats (5
weeks of age) was conducted. Rats were divided into three groups; they were fed one of the following
diets for 3 weeks: purified diet (AIN 93G) containing 5% cellulose (CEL), an identical diet in which
cellulose was replaced by corn starch (STA) or by chickpea husk (CPH). Chickpea husk contained high
polyphenolic content and significant superoxide dismutase and 2,2-diphenyl-picrylhydrazyl
scavenging activities. In a feeding experiment, CPH showed lowered cholesterol levels and improved
antioxidant activity represented by reduced thiobarbituric acid reactive substances in blood. CPH
showed increased cecal levels of total short-chain fatty acids and butyrate. CPH presented with
lowered cecal indole and skatole concentrations, as did CEL. Cecal bacterial changes were notable in
CPH, evidenced by differences in denaturing gradient gel electrophoresis banding patterns. These
results indicate that chickpea husk feeding can improve the antioxidative status of rats through its
polyphenolic components and modulate the hindgut environment by its fibrous components.
For evaluation of lablab bean (Dolichos lablab) husk and soybean (Glycine max) husk, a feeding
study using twenty male SD rats (5 weeks of age) was conducted. Rats were divided into 4 groups and
fed one of the following diets for 3 weeks: purified diet (AIN 93G) containing 5% cellulose (CEL), or the
same diet in which cellulose was replaced by corn starch (STA), lablab bean husk (LBH), or soybean

2
husk (SBH). Feed intake, body weight, anatomical parameters, and cecal ammonia level did not differ
significantly among diets. Rats on LBH and SBH showed higher concentrations of cecal short-chain
fatty acid and lactate than those on CEL. Rats on CEL, SBH, and LBH exhibited decreased cecal indole
and skatole levels. LBH yielded increased cecal abundance of beneficial bacteria such as Akkermansia
muciniphila, bifidobacteria, and Oscillibacter relatives, as demonstrated by either quantitative real-
time PCR (qPCR), MiSeq, or clone library analysis. SBH favoured the growth of lactobacilli as assessed
by both qPCR and MiSeq, and favoured the growth of bifidobacteria as assessed by MiSeq. In
comparison with STA, LBH and SBH yielded decreased cecal abundance of bacteria related to Dorea
massiliensis, as demonstrated by qPCR, MiSeq, and clone library analysis. Both types of bean husk
were found to contain oligosaccharides that might selectively stimulate the growth of beneficial
bacteria. Based on these results, the two species of bean husk tested are considered functional for
promoting the gut health of monogastric animals.
For the confirmation of the functionality of soybean husk, a feeding study using four Shiba
dogs (7–48 months in age and 7.5 ± 1.7 kg in body weight) was conducted. Dogs fed a commercial diet
supplemented with 5.6% soybean husk after feeding control cellulose diet, showed an increase in
short-chain fatty acids, such as acetate and butyrate, and lactate, and a decrease in indole and skatole
in the feces compared to those fed a 5.6% cellulose diet. qPCR assay showed that soybean husk
supplementation stimulated the growth of lactobacilli, Clostridium cluster IV including Fecalibacterium
prausnitzii, Clostridium cluster XIVa, Bacteroides-Prevotella-Porphyromonas group but inhibited the
growth of Clostridium cluster XI. Therefore, soybean husk is suggested to be applicable as a functional
fiber in the formulation of canine diets.

3
Acknowledgements
At first, thanks go to my supervisor, Professor Yasuo Kobayashi. He supervised my academic
path in both master’s and PhD study. His observations and comments helped me to establish the
overall direction of my research and to move forward with it. He encouraged me to grow as a scientist.
His support, advice and guidance throughout my study has been crucial to complete it and his patience
and understanding to me, has been much appreciated.
Thanks also go to my co-supervisors, Professor Masashi Takahashi (Laboratory of Animal
Genetics and Reproduction), Associate Professor Satoshi Koike especially for his knowledge and advice
available to me and Assistant Professor Yutaka Suzuki. Their critical reviewing on this thesis is much
appreciated.
Thanks also go to Professor Tin Ngwe (Rector (Retired), University of Veterinary Science, Yezin,
Myanmar). His introduction with my supervisor, is highly appreciated. I have been fortunate to receive
vital support and encouragement from Professor Aung Aung and my teachers from the Department
of Physiology and Biochemistry, University of Veterinary Science, Yezin, Myanmar. I am grateful for
that.
Thanks also go to Japanese Government, Monbukagakusho (MEXT) Scholarship Program and
Myanmar Government, Ministry of Agriculture, Livestock and Irrigation. Their financial support and
official arrangement on my study are much appreciated.
Thanks also go to my tutor, Dr. Naoki Fukuma (Assistant Professor, Obihiro University of
Agriculture and Veterinary Medicine), my colleagues, Yu Iwahashi and Hiroyuki Kishi, and present and
past lab members. Their support and contribution are much appreciated.
Finally, to my parents and my wife Yi Yi Mon, thank you so much for your love that helped
keep me focussed on my study in Japan.

4
Table of contents
Page Abstract 1 Acknowledgements 3 Table of Contents 4 Chapter 1 Introduction and literature review 6
1.1 Health benefits of dietary fiber and polyphenols 6 1.2 Functional components of bean husk 8 1.3 Application of bean husk as feed ingredients 10
Chapter 2 Function of chickpea husk in rats 13 2.1 Introduction 13 2.2 Materials and methods 14 2.2.1 Animals and diets 14 2.2.2 Analysis of chemical compositions 14 2.2.3 Analysis of antioxidant activities 15 2.2.4 Analysis of blood and cecal parameters 16 2.2.5 Analysis of microbiota 16 2.2.6 Statistical analysis 18 2.3 Results 18 2.3.1 Components of chickpea husk and growth performance 18 2.3.2 Antioxidant activities of cecal digesta and blood 18 2.3.3 Cecal fermentation and blood parameters 19 2.3.4 Cecal microbiota 19 2.4 Discussion 19
Chapter 3 Function of lablab bean husk and soybean husk in rats 22 3.1 Introduction 22 3.2 Materials and methods 23 3.2.1 Animals and diets 23 3.2.2 Chemical analyses of bean husk 24 3.2.3 Measurement of blood parameters and cecal fermentation products 25 3.2.4 Microbiota analysis by qPCR 26 3.2.5 Microbiota analysis by 16S rDNA clone library 26 3.2.6 Microbiota analysis by MiSeq 27 3.2.7 Statistical analysis 28 3.3 Results 28 3.3.1 Nutritional composition of bean husk 28 3.3.2 Growth and cecal characteristics of rats 29 3.3.3 Microbiota 29 3.4 Discussion 31
Chapter 4 Function of soybean husk in dogs 36 4.1 Introduction 36 4.2 Materials and methods 37 4.2.1 In vitro fermentation experiment 37 4.2.2 In vivo feeding experiment 38 4.2.3 Chemical analysis 39 4.2.4 Microbial analysis 39 4.2.5 Statistical analysis 40 4.3 Results 40
5
4.3.1 In vitro fermentation experiment 40 4.3.2 In vivo feeding experiment 41 4.4 Discussion 42
Chapter 5 General discussion 45 Conclusion 47 Tables and figures 48 References 65
6
Chapter 1
Introduction and literature review
Agricultural by-products are considered as a source of functional food that are known for
prevention and treatment of various chronic diseases, such as constipation, heart diseases, diabetes,
obesity and some forms of cancer (Marlett et al. 2002). Due to the rising awareness of health and
nutrition, functional food such as prebiotics has been gained attention to innovate its production.
Development of new functional food from less expensive resources such as agricultural by-products
have been the focus of my research.
There are various types of agricultural by-products such as crop waste and residues, by-
products from fruit- and vegetable-processing industry, by-products from sugar, starch and
confectionary industry, by-products from grain- and legume-milling industry and oil industry, and by-
products from distilleries and breweries (Ajila et al. 2012). Those by-products contain functional
components having health benefits and are therefore valuable supply of nutrients to animals.
1.1 Health benefits of dietary fiber and polyphenols
Among functional components, dietary fiber has been known for its role playing in many
physiological functions and in the prevention of diseases such as cardiovascular disease, diabetes,
obesity and cancer (Slavin 2013). There are many plant sources rich in dietary fiber such as cereals,
legumes, vegetables, fruits and nuts. Dietary fiber is carbohydrate polymers with ten or more
monomeric units, which are neither digested nor absorbed in the human small intestine (Codex
Alimentarius 2010). Dietary fiber is generally classified into two main types including insoluble and
soluble dietary fiber depending on its solubility in water. Structural or nonviscous fiber such as
cellulose, some hemicelluloses and lignins is insoluble dietary fiber, whereas viscous fiber such as
pectins, arabinoxylan, glucans and algal polysaccharides is usually soluble dietary fiber (Williams et al.
2017). The insoluble fiber is related to both water absorption and intestinal regulation, whereas the
soluble fraction is associated with microbial regulation, reduction of cholesterol in blood and decrease

7
of glucose absorption by small intestine. Insoluble and soluble dietary fiber has been reported to be
able to bind bile acids while passing through small intestine without digestion. Bile acid is synthesized
in the liver and secreted in small intestine from the destruction of endogenous cholesterol. Soluble
dietary fiber due to its viscosity, creates thickening of the unstirred layer lining the intestinal lumen,
thereby reducing the flow of bile acids towards the epithelial cells for uptake. Insoluble fiber directly
binds to or entraps bile acids, thereby preventing re-absorption in small intestine and increasing their
excretion. Therefore, bile acids are end products of cholesterol catabolism which is the most
important route to eliminate surplus cholesterol from the blood circulation. Fermentation of particular
dietary fiber in large intestine produces short-chain fatty acid (SCFA). Those acids, in particular
propionate and acetate, can suppress endogenous cholesterol synthesis. Moreover, bacterial de-
conjugation of bile acids causes mass excretion of bile acids in the feces (Fechner et al. 2014, Gunness
et al. 2016, Andersson et al. 2013). Therefore, fiber, SCFAs and bacterial de-conjugation of bile acids
will concertedly induce new synthesis of bile acids from endogenous cholesterol in the liver,
contributing to the reduced blood cholesterol.
Dietary fiber selectively stimulate the growth and/or activity of intestinal bacteria, particularly
Bifidobacterium and Lactobacillus which plays an important role in protection against pathogens and
reduces the concentration of harmful fermentation products in the gastrointestinal tract (Gibson &
Roberfroid 1995). These prebiotic effect is due to the fermentation of dietary fiber, leading to the
production of SCFAs, principally acetate, propionate and butyrate. Acetate has been shown to
stimulate proliferation of normal crypt cell, enhance ileal motility, increase colonic blood flow and
involve in adipogenesis and host immune system (Ono et al. 2004, Hong et al. 2005, Brown et al. 2003).
Propionate has been shown to regulate hypocholesterolemic and anti-carcinogenic effects (Hosseini
et al. 2011, Martinez-Villaluenga et al. 2005, Xiong et al. 2004, Hinnebusch et al. 2002, Jan et al. 2002).
Butyrate is an energy source for enterocytes and has been found to act as a protectives against
experimental tumorogenesis cells and exhibit anti-inflammatory properties by the inhibition of TNF-
production in colonic epithelial cells (Bailon et al. 2010, Luhrs et al. 2002).
8
Apart from dietary fiber, polyphenols are another component of agricultural by-products
having potential health benefits. Low molecular weight polypnenols such as monomeric and dimeric
structures may be readily absorbed in the small intestine and distribute into body through systemic
circulation. Some polyphenols (oligomeric and polymeric polyphenols such as condensed or
hydrolysable tannins) associated with dietary fiber are not hydrolysable by digestive enzymes in the
upper intestinal tract. Once they reach to the large intestine, some of them get fermented along with
dietary fiber and are extensively metabolised by microbiota, leading to the formation of absorbable
metabolites such as phenylacetic, phenylpropionic, and phenylbutyric acids (Rechner et al. 2004).
These aromatic acids are well absorbed through the intestinal barrier and may actually be responsible
for systemic health effects. Bacteria belonging to Lactobacillus, Bifidobacterium, Bacteroides,
Eubacterium, Enterococcus and Blautia have been reported to be responsible for the breakdown and
biotransformation of polyphenols into low molecular weight metabolites in gastrointestinal tract
(Espin et al. 2017). On the other hand, non-fermentable and non-absorbable polyphenols present in
the large intestine may contribute to a healthy antioxidant environment by scavenging free radicals
and counteracting effects of dietary pro-oxidants. Therefore, dietary fiber associated with polyphenols
may exert beneficial effects by creating improved fermentation and antioxidant environment in large
intestine. Agricultural by-products rich in functional components such as dietary fiber and polyphenols,
could be added to different foods for animals as well as human, to yield beneficial effects. Bean husk
is one of such agro-byproduct and may have a potential to utilize in animal nutrition.
1.2 Functional component of bean husk
Among the agricultural by-products available, bean husk forms major feed resources. It is
available in plenty to the extent of over 2.0 million tonnes per annum in the world from over 26 million
tonnes of dry bean production (FAOSTATS 2014), since husk corresponds to 8-11% of whole seed
(Kanatt et al. 2011). Bean husk is rich in dietary fiber, ranging from dry weight contents of 75% in
chickpea husk to 87% in lentils husk and 89% in pea husk (Dalgetty & Baik 2003). Husk of pea, lupin
9
and soybean are reported to contain soluble and insoluble dietary fiber (Guillon & Champ 2002).
Indeed, the total dietary fiber accounts for 89%, 80% and 75% in the husk, respectively. Soluble dietary
fiber are contained at 7%, 8% and 10 %, respectively. Pea husk was characterized as rich in cellulosic
glucose, pectins and hemicellulose and identified to contain heteroxylans, glucans, and arabinans
(Renard et al. 1997). Le Goff et al. (2001) confirmed the presence of xylogalacturonans in the pectins
from pea husk. Both of bean and its husk (eg. soybean) contain raffinose family oligosaccharides, also
known as important group of α-galactooligosaccharides (Fan et al. 2015). The oligosaccharides in the
raffinose family include raffinose, stachyose, and verbascose. Raffinose is a trisaccharide, composed
of one galactose monomer attached to a sucrose molecule via α-(1-6) glycosidic linkage. The stachyose,
tetrasaccharide and verbascose, pentasaccharide are synthesized from raffinose by the addition of α-
D-linked galactosyl units. However, little information is accumulated for the detailed characterization
of dietary fiber in bean husk. Further characterization of saccharides in husk may elucidate their
functional properties in detail.
Carbohydrate fractions of bean husk including oligosaccharides, polysaccharides and other
fermentable non-starch polysaccharides are considered to modulate gastrointestinal fermentation
and microbial community in animals. In particular, raffinose family oligosaccharides have been
reported to be utilized by selected beneficial bacteria in in vitro and to influence growth of
Bifidobacterium in the colon of rats (Saito et al. 1992, Gulewicz et al. 2002). Thus, bean husk has a
great potential to be used as a new functional food due to its high content of both insoluble and
soluble dietary fiber. However, they are either underutilized or discarded as an agricultural waste.
Another functional component of bean husk is polyphenols which are one of the most
important groups of secondary metabolites in plants having antinutrient properties such as low
digestibility and inhibitory effect on absorption of protein and other nutrients in animals
(Sreerangaraju et al. 2000). On the other hand, polyphenols have to be found to possess beneficial
activities such as anti-diabetic, anticancer, anti-inflammatory, cardioprotective, osteoprotective,
neuroprotective, antiasthmatic, antihypertensive, antiageing, antiseptic, cerebrovascular protection,

10
cholesterol lowering, hepatoprotective, antifungal, antibacterial and antiviral properties (Ganesan &
Xu 2017, Daglia 2012). Polysaccharides and polyphenols were detected in the husk of chickpea, horse
gram, mung bean, black gram, green gram, pigeon pea, lentils and faba bean (Lai et al. 2010, Sreerama
et al. 2010a, Kanatt et al. 2011, Girish et al. 2012, Basha et al. 2017, Mirali et al. 2017, Karatas et al.
2017). The previous reports confirmed that all husk had good antioxidant potential protecting animal
body cells such as -DNA and red blood cell, against oxidative damage, and scavenging superoxide and
free radicals and also had good antibacterial activities against food borne pathogens such as Bacillus
cereus. Furthermore, phenolic substances including condensed tannin-, and lignin-concentrated bean
husk can bind considerable amount of bile acid (Karatas et al. 2017). Bean husk could therefore have
application in food of various animals including human in terms of health promotion. Therefore, it is
very important to consider about functional activities of a diet containing bean husk in gastrointestinal
tract of monogastric animals and to access its benefit. Bean husk can be exploited as a new source of
novel natural feed ingredient or additive to utilize their potential nutritional value.
1.3 Application of bean husk as feed ingredient
Bean husk has been basically used as ruminant feed. Faba bean husk was evaluated for
potential application in dairy cow and found that 30% inclusion of husk improved yield and fat content
of milk (Al-Saiady 1998). Chickpea husk and lablab bean husk were proposed to use as easily digestible
supplemental fiber that caused a positive associative effect on fiber digestion because they selectively
stimulated rumen microbiota (Ngwe et al. 2012, Fuma et al. 2012). Soybean husk has been widely
used in dairy cows as a replacement of grain in diet (Ipharraguerre & Clark 2003).
However, study on nutritional significance of bean husk in monogastric animal is limited
although it is evaluated to use as the ingredients in the formulation of various food products for human
health. For instance, mung bean husk incorporated in biscuits, was recommended for the people
suffering from diabetes and constipation due to its low glycemic index (Bora & Kulshrestha 2015).

11
Dietary fiber from soybean husk was shown for potential utilization in snacks with enrichment of fiber
for human health (Yang et al. 2014).
Bean husk application in monogastrics is related to animal health. For instance, van der
Meulen et al. (2010) demonstrated the effects of pea husk and faba bean husk as preventives of
enterotoxigenic Escherichia coli colonization in ileum which is an important etiological agent
responsible for post-weaning diarrhea in piglets. Both of bean husk diminish adhesion of E. coli to
epithelial cells by increasing intestinal water-holding capacity. Therefore, the reduction of intestinal
fluid loss by both of bean husk may contribute to prevent gastrointestinal disorders. In another study,
pea husk has been found to disturb the enterotoxigenic E. coli K88 cell adhesion, while faba bean husk
interfere with the enterotoxin, by binding to the intestinal receptor, leading to the reduction of the
numbers of E. coli attaching to the intestinal mucosa (Becker et al. 2012). Thus, bean husk has
functional properties to prevent colonization by potential pathogens and thereby reduces the risk of
infections in the gastrointestinal tract of monogastric animals.
Other biological properties of bean husk were also reported. When fermentation
characteristics of whole pea, pea husk and pea inner fiber were compared with wheat bran, sugar beet
pulp, and other feed ingredients in in vitro system using colonic bacteria from pigs, pea and pea husk
showed a higher fermentation rate and SCFA production than other substrates (Jha et al. 2011).
Dietary inclusion of pea husk enhanced bacterial fermentation and yielded highest SCFA production
especially butyrate in ileum and colon of growing pigs (Jha & Leterme 2012). Bean husk has the ability
in gut fermentation as its whole seed has. The supplementation of pea husk fiber in the diet of pigs
reduced the abundance of pathogens involved in irritable bowel syndrome such as Clostridium cluster
I and Enterobacteriaceae family and increased those of beneficial bacteria belonging to Lactobacillus
group and Clostridium cluster IV (Luo et al. 2017). Therefore, main health-promoting effects are
indicated to exist in bean husk.
However, it remains unclear whether other bean husks such as chickpea husk, lablab bean
husk and soybean husk possess functional activity in monogastric animal, while some of them have
12
been utilizing in ruminant animals. The objective of this study was to evaluate nutritional properties
of chickpea husk, lablab bean husk, and soybean husk as a new functional feed ingredient for
monogastric animals. Determination of changes in blood parameters, gastrointestinal fermentation
and microbial community by three different types of bean husk in rats as a model of monogastric
animals, is expected to understand the nutritional and health effects of each supplemented husk. Dogs
were also used as experimental animals to further evaluate functions of soybean husk that is most
abundantly available among husks tested. This study might give insights into understanding of
functionality and practical use of the husk in monogastric animals.
13
Chapter 2
Function of chickpea husk in rats
2.1 Introduction
Chickpea (Cicer arietinum), also called Bengal gram bean or garbanzo bean, is a member of
the Fabaceae family of legumes and its global production was over 14 million tons in 2014 (FAOSTATS
2014). Large quantities (over 907,000 tonnes) of chickpea husk accumulate annually as an agro-
byproduct after dehulling for human consumption. Chickpea husk is a new feed source for animals
and could be a potential source of dietary fiber, antioxidants and microbial modulators.
It has been reported that chickpea husk can be used as a source of dietary fiber (Dalgetty &
Baik 2003), in which pectins (Urias-Orona et al. 2010) and oligosaccharides such as raffinose, stachyose
and verbascose (Sreerama et al. 2010a) are constituents. Additionally, the presence of tannin
(Sreerangaraju et al. 2000), flavonoids, phenolic acids and anthocyanins (Sreerama et al. 2010b) in
chickpea husk were also reported. Chickpea husk possesses water-holding capacity (Dalgetty & Baik
2003), which plays an important physiological role in gut function and control of blood parameters. In
light of these components and physical function, chickpea husk is recommended for use as a fiber
supplement for ruminant animals (Sreerangaraju et al. 2000, Ngwe et al. 2012) and as a health inducer
for hypercholesterolemic rats (Mittal et al. 2009).
Most plants contain fiber and polyphenols, which are resistant to digestive enzymes of the
upper gastrointestinal tract. Therefore, they are transported to the large intestine, where they
undergo fermentation. Chickpea husk, rich in both dietary fiber and polyphenols, is expected to
favorably regulate metabolic activities, and may improve the health status of monogastric animals
through its physiological and functional properties. Therefore, this study was carried out to
functionally evaluate chickpea husk in association with antioxidant properties, blood parameters, gut
fermentation and microbiota of rats as a model of monogastric animals.
14
2.2 Materials and methods
2.2.1 Animals and diets
Fifteen male Sprague-Dawley rats (five weeks of age) were purchased from Japan SLC, Inc.,
Hamamatsu, Japan. They were individually housed in plastic cages in an environmentally controlled
room (temperature 23℃, light-dark cycle 12 h (12-24 hours for lighting), relative humidity 55-60%)
and grouped into three treatments (five rats/group) with an average body weight of 142.5±7.2 g. All
rats had free access to water and diet. One group was given a purified diet (AIN-93G; CLEA Japan Inc.,
Tokyo, Japan) containing 5% cellulose powder as a fiber source, which was used as the control diet
(CEL). The other two groups were given the same purified diet in which 5% cellulose was replaced with
either 5% corn starch (STA) or 5% chickpea husk (CPH). The starch diet did not contain any fiber source
and was regarded as a negative control. In preliminary experiment, 5% inclusion of chickpea husk did
not show any detrimental effect on health and growth performance. Therefore, 5% supplementation
was taken in the present evaluation. Corn starch was purchased from Wako, Osaka, Japan. Desi type
chickpea husk was imported from a pulse processing plant (Yezin, Nay Pyi Taw, Myanmar) via Prof. Tin
Ngwe, University of Veterinary Science, Myanmar. At the end of the 21-day feeding period, rats were
anaesthetized by xylazine·HCl injection. After laparotomy, blood samples were taken from the heart,
and the prepared blood plasma was kept at -30℃ until analysis. Cecal digesta were sampled and
stored at -80℃ until analysis.
The animal protocol used in this study was in accordance with the Guidelines for Animal
Experiments, Hokkaido University (2007) and the Act on Welfare and Management of Animal (2005).
2.2.2 Analysis of chemical composition
The proximate composition of chickpea husk was analyzed according to the methods of the
Association of Official Analytic Chemists (AOAC 1990). Neutral detergent fiber (NDF), acid detergent
fiber (ADF) and acid detergent lignin (ADL) were analyzed by the method of Goering and Van Soest
(1975). Total phenolic content, total flavonoids and condensed tannin were analyzed as follows. About

15
200 mg of chickpea husk was extracted with 10 mL of acetone/water (70:30, v/v). The mixture was
shaken at 130 rpm in a 30oC water bath for 3 h, and then kept overnight at room temperature. The
mixture was centrifuged (4oC, 3,000g, 10 min) and the supernatant was used in the analysis. The total
phenolic content was determined using Folin-Ciocalteu’s reagent as described by Makkar et al. (1993).
The results were reported as tannic acid equivalent (0.1 mg/mL) on a dry matter basis. Non-tannin
phenolic compounds were evaluated after removing phenolic compounds from the sample by
precipitation with polyvinyl polypyrrolidone. Total tannin was calculated by subtracting non-tannin
phenolic compounds from total phenolic compounds. Total flavonoids were assayed by the aluminum
chloride colorimetric method (Dewanto et al. 2002). The condensed tannin was determined using the
vanillin-HCl assay (Price et al. 1978). Total flavonoids and condensed tannin were reported as catechin
equivalent (0.3 mg/mL) on a dry matter basis.
2.2.3 Analysis of antioxidant activity
Antioxidant activity was determined by the following procedure. For chickpea husk, a ground
sample (200 mg) was soaked in 10 mL of acetone/water (70:30, v/v) for 15 min in a 70°C water bath.
During incubation, sample tubes were vortexed at 5-min intervals and then centrifuged (4°C, 3,000 × g,
20 min). The obtained supernatant was used for analysis of superoxide dismutase (SOD) enzyme
activity by a SOD Test Wako (Wako, Osaka, Japan), according to the manufacturer's instructions. The
2,2-diphenyl-picrylhydrazyl (DPPH) free radical scavenging activity was determined using the method
of Brand-Williams et al. (1995). The extracted sample (0.2 mL) was added to 500 µmol/L DPPH in
ethanol (1.8 mL) and thoroughly mixed. After 30-min incubation in the dark, the absorbance was
measured at 517 nm. The absorbance of the control was obtained by replacing the sample with
cellulose. Percent DPPH scavenging activity was calculated as: ((Control absorbance – Sample
absorbance)/(Control absorbance)) × 100. For cecal digesta, samples thawed on ice (1 g) were
suspended in 5 mL of 0.85% saline, vortexed, and centrifuged (4°C, 7,800 × g, 5 min). The supernatant
was used for analysis of SOD and DPPH radical scavenging activities. Water was used as the blank in

16
the DPPH assay. Lipid peroxidation products were assayed by quantifying the malondialdehyde
formed in terms of thiobarbituric acid-reactive substances (TBARS) by a TBARS Assay Kit (Cayman
Chemical, Ann Arbor, MI, USA). Plasma SOD, DPPH and TBARS were also determined after blood
plasma was diluted four-fold with water.
2.2.4 Analysis of blood and cecal parameters
Blood plasma thawed on ice was employed for the analysis of total cholesterol (T-Cho CII kit,
Wako) and glucose (Glu-E kit, Wako) according to the manufacturers’ instructions. The cecal digesta
supernatant was used for pH measurement, by an electrode (F-51; HORIBA, Kyoto, Japan), and also
for the analysis of SCFA, ammonia, indole and skatole. SCFA was determined by gas chromatography
(GC-14B; Shimadzu, Kyoto, Japan) equipped with a 0.53 mm × 30 m capillary column (ULBON HR-20 M;
Shimadzu) based on the procedure of Suto (1973). Ammonia nitrogen (NH3-N) was measured by the
phenol-hypochlorite reaction method (Weatherburn 1967) using a microplate reader at 660 nm
(ARVO MX, Perkin Elmer, Japan). Assays for indole and skatole were carried out by colorimetric
methods (Walstra et al. 1999).
2.2.5 Analysis of microbiota
DNA from cecal digesta was extracted and purified using the repeated bead beating plus
column (RBB + C) method (Yu & Morrison 2004) with a QIAamp DNA Stool Mini Kit (Qiagen, Hilden,
Germany). The concentration of purified DNA was quantified by a NanoDrop 2000 (Thermo Fisher
Scientific, Waltham, MA, USA). DNA samples were diluted to 10 ng/μL before being subjected to PCR
amplification.
Bacterial communities were analyzed by PCR-DGGE (denaturing gradient gel electrophoresis)
as described by Muyzer et al. (1993). The PCR reaction mixture (25 μL) contained 2.5 μL of 10× PCR
buffer, 2.0 μL of deoxynucleotide triphosphate, 0.5 μL of each primer (341f-GC and 534r, 20 pmol/μL),
18.375 μL of water, 0.125 μL of bovine serum albumin (20 mg/mL), 0.125 μL of TaKaRa Ex Taq®

17
polymerase (Takara Bio, Tokyo, Japan) and 1.0 μL of template DNA. Electrophoresis of PCR products
was performed using a DCode System (Bio-Rad, Hercules, CA, USA). PCR fragments were separated by
an 8% polyacrylamide gel using 1.0× TAE buffer (20 mmol/L Tris-acetate pH 7.4, 10 mmol/L sodium
acetate, 0.5 mmol/L Na2 ethylenediaminetetraacetic acid) with a linear 35-60% gradient of denaturant
(100% denaturant corresponds to 7 mol/L urea and 40% deionized formamide) at 60°C for 13 h at a
constant voltage of 90 V. DNA bands were visualized by silver staining (Muyzer et al. 1998) and
scanned (ES 2200; EPSON, Nagano, Japan). Cluster analysis was performed by the unweighted pair
group method with arithmetic mean algorithm (UPGMA) based on the Dice correlation coefficient
(BioNumerics software version 6.0; Applied Maths, Sint-Martens-Latem, Belgium). Banding pattern
similarities were analyzed by examination of clusters formed after creation of the algorithm-based
dendrogram.
Bacterial communities were also quantitatively characterized by real-time PCR (qPCR) assays
with species/group specific primers for the representative groups, such as total bacteria (Muyzer et
al. 1993), total lactobacilli (Walter et al. 2001; Heilig et al. 2002), four different Lactobacillus species
including Lactobacillus acidophilus (Haarman and Knol 2006), Lactobacillus gasseri (Song et al. 2000),
Lactobacillus johnsonii (Furet et al. 2004) and Lactobacillus reuteri (Dommels et al. 2009), total
bifidobacteria (Kok et al. 1996), Fecalibacterium prausnitzii, Eubacterium hallii (Ramirez et al. 2009),
Clostridium coccoides-Eubacterium rectale group (Rinttila et al. 2004), Escherichia coli (Malinen et al.
2003) and Clostridium perfringens (Wang et al. 1994). The qPCR was carried out on a Light Cycler 480
real-time PCR system (Roche Applied Science, Mannheim, Germany). The PCR reaction mixture (20 μL)
contained 10.0 μL of KAPA SYBR (Kapa Biosystems, Woburn, MA, USA), 0.2 μL of each primer, 8.6 μL
of water and 1.0 μL of template DNA. Results from samples in each group were averaged and reported
as a relative proportion of each species (group) in total bacteria.
18
2.2.6 Statistical analysis
All data were analyzed by one-way analysis of variance (ANOVA). Tukey’s multiple comparison
test was used to resolve differences among treatment means using SPSS 16.0 software (SPSS Inc.,
Chicago, IL, USA). Statistical differences were considered to be significant at P ˂ 0.05. Differences
between treatments at P ˂ 0.10 were considered as a trend toward significance.
2.3 Results
2.3.1 Components of chickpea husk and growth performance
Chemical composition and antioxidant status of chickpea husk are detailed in Table 1. Non-
structural carbohydrates or non-fibrous carbohydrates are soluble components that include starch,
soluble sugars and soluble fibers. Its calculated amount was 28.8%. Meanwhile, structural
carbohydrates are represented by cellulose (55.6%), lignin (3%) and hemicellulose (3%). Total phenolic
content reported as tannic acid equivalent, total flavonoids reported as catechin equivalent,
calculated total tannin and condensed tannin reported as catechin equivalent were 2.7%, 2.5%, 2.1%
and 1.0%, respectively. Chickpea husk possessed SOD enzyme activity and scavenged DPPH radicals
with the values of 32.0% and 31.0%, respectively. Rats fed the three different diets showed equal food
intake and growth without notable differences in feed conversion ratios. Weights of representative
organs, including digesta content, did not differ among groups (data not shown).
2.3.2 Antioxidant activities of cecal digesta and blood
SOD, DPPH and TBARS of cecal digesta and blood are shown in Table 2. SOD activity of cecal
digesta in CPH was lower (P < 0.05) than those in CEL and STA. CEL showed the highest SOD activity
among the groups. Diets did not affect DPPH scavenging activity in the cecal digesta. Higher TBARS
(P < 0.05) was found in the cecal digesta of CPH than those of CEL and STA. However, there was no
difference in TBARS of cecal digesta between CEL and STA. Although blood SOD and DPPH did not

19
differ among the groups, a significant reduction of plasma TBARS (P < 0.05) was found in CPH
compared to CEL and STA. No difference of plasma TBARS was found between CEL and STA.
2.3.3 Cecal fermentation and blood parameters
Cecal pH, cecal fermentation products and blood glucose and cholesterol are shown in Table 3.
A lower cecal pH (P < 0.05) was observed in CPH compared to CEL and STA. In comparison to CEL, CPH
showed increased (P < 0.05) total SCFA and butyrate concentrations. The ammonia concentration did
not differ among the diets. STA showed higher (P < 0.05) indole and skatole levels in comparison with
the other two diets containing fiber sources. The diets did not influence blood glucose concentrations.
CPH showed a lower level of total cholesterol (P < 0.05) in comparison with CEL and STA.
2.3.4 Cecal microbiota
Cluster analysis of PCR-DGGE banding profiles from the cecal digesta showed that CPH showed
altered cecal total microbiota, which was clustered in a single group (Figure. 1). However, none of the
diets affected bacteria assayed by quantitative PCR, including total bacteria, total lactobacilli, four
Lactobacillus species (L. acidophilus, L. gasseri, L. johnsonii and L. reuteri), total bifidobacteria, F.
prausnitzii, E. hallii, Clostridium coccoides-Eubacterium rectale and E.coli in the cecal digesta (Table 4).
2.4 Discussion
Plant phenolic compounds are considered to be powerful antioxidants because of their ability
to donate hydrogen or electrons to stable free radicals, leading to the formation of non-toxic species
and therefore inhibiting the propagation phase of lipid oxidation. Chickpea husk used in the present
study contained polyphenols and possessed antioxidant potential according to the in vitro evaluation
of SOD and DPPH free radical-scavenging activities (Table 1). Therefore, chickpea husk might be an
important feed source to improve the antioxidative status of animals. Although the cecal digesta did
not show any improvement of antioxidant activity, plasma TBARS was significantly reduced with
20
chickpea husk intake (Table 2). One possible mechanism for the reduced plasma TBARS may involve
the inhibitory action of polyphenols and their metabolites against oxidation reactions. Conjugated
forms of phenolic acids, flavonoids and bacterial metabolites of flavonoids can be absorbed by
intestinal cells into the circulation (Marin et al. 2015), where they might inhibit lipid oxidation caused
by oxidative stress. Thus, the phenolic compounds of chickpea husk or their metabolites may enhance
protection against blood lipid oxidation, which is a risk factor in cardiovascular disease induced by
oxidative stress.
Chickpea husk produced more SCFA in the cecum, especially butyrate, an important substrate
for the proliferation of intestinal epithelial cells and improvement of gut health, accompanied by a
lower pH compared to cellulose (Table 3). This may be due to the fermentation of insoluble and
soluble dietary fibers in chickpea husk that promote butyrate-producing bacteria. The most abundant
component in chickpea husk is insoluble fiber such as cellulose, lignin and hemicellulose. In particular,
soluble fiber in chickpea husk, represented by pectin, might become readily available for microbial
fermentation. On the other hand, polyphenols are potential modulators of cecal fermentation
because they or their metabolites affect cecal bacteria. The tannin in chickpea husk might reduce
indole and skatole formation by inhibiting either microbial activity directly or by reducing the
availability of proteins for bacterial metabolism. Lowering of indole and skatole, tryptophan
metabolites associated with odor, is a good index in the application of chickpea husk to feed for
companion animals, especially those kept indoors. This improved fermentation is related to
alterations in the cecal microbial community by chickpea husk feeding, evidenced by the different
DGGE banding patterns (Fig. 1) but not the qPCR assay results. It is possible that these bacterial
changes are mainly due to the soluble fiber fraction of chickpea husk. In our unpublished data, pure
culture study revealed that chickpea husk has lactogenic and bifidogenic effects, possibly caused by
the presence of oligosaccharides. Similarly, Madhukumar and Muralikrishna (2012) reported that xylo-
oligosaccharides derived from chickpea husk could be utilized by bifidobacteria, lactobacilli and
Pediococci spp in pure culture. Beside dietary fiber, it is also assumed that modification of the
21
microbiota might be due to polyphenols present in chickpea husk through inhibitory (Kanatt et al.
2011) or stimulatory (Pozuelo et al. 2012) effects. Such changes in the bacterial community in the
presence of both fibers and polyphenols in chickpea husk might contribute to the increase of SCFA
and the decrease of indole and skatole. Cecal samples were taken to evaluate the function of chickpea
husk in rat hindgut in the present study, because most of the previous studies on prebiotics have dealt
with cecal fermentation. We found some favorable actions of chickpea husk on cecal fermentation
(Table 3) and would expect similar ones in lower segment of the large intestine, based on the fact that
cecal, colonic and fecal samples of mice share essentially common bacterial operational taxonomic
units (Gu et al. 2013).
Notably, the lowest total cholesterol concentration was observed in rats fed chickpea husk
(Table 3). It can be speculated that such a beneficial effect is probably due to the tannin present in
chickpea husk. Tannin inhibits pancreatic lipase and increases fecal excretion of dietary lipids including
cholesterol, which indirectly lowers blood lipid and cholesterol levels. In fact, Zou et al. (2014)
reported hypolipidemic effect of persimmon tannin in rats. Another factor to lower blood cholesterol
is dietary fiber. Mallillin et al. (2008) point out that all fibers, both soluble and insoluble, can entrap
bile acid and prevent its re-absorption. Chickpea husk is rich in such fiber that accelerates excretion of
bile acids into feces. Consequently, endogenous cholesterol is utilized for bile acid synthesis in the
liver, possibly resulting in lowered blood cholesterol levels. Furthermore, SCFA, mainly propionate and
butyrate may suppress cholesterol synthesis in the liver (Beyer-Sehlmeyer et al. 2003). Therefore, the
above factors as a whole, that is the tannin, fiber and SCFA originating from chickpea husk, might be
responsible for the decrease of blood cholesterol in the present study.
The present study confirmed that chickpea husk is a potential source of dietary fiber,
antioxidants and cecal bacterial inhibitors or stimulants. Chickpea husk contains functional
polyphenols and fibers that could serve as an antioxidant and hindgut modulator in monogastric
animals. It is anticipated that more detailed analyses will be performed in future to confirm the
mechanisms proposed here.
22
Chapter 3
Function of lablab bean husk and soybean husk in rats
3.1 Introduction
Lablab bean (Dolichos lablab), commonly referred to as hyacinth bean or field bean, is a major
pulse crop in South and South East Asia. Feeding with lablab bean husk has been shown to lead to the
alteration of rumen microbiota and activity by selective stimulation of specific fibrolytic bacteria
(Fuma et al. 2012), and to facilitate increased fiber digestibility in sheep (Ngwe et al. 2012). These
results suggest that this material can be used as an easily digestible supplemental fiber for ruminant
animals. Lablab bean husk contains cellulose and hemicellulose (Fuma et al. 2012, Htay et al. 2014),
as well as pectic polysaccharides that incorporate arabinogalactan as a major sugar, including
arabinose and rhamnose (Muralikrishna & Tharanathan 1994). Therefore, lablab bean husk is worthy
of evaluation for its possible use as a feed ingredient not only for ruminants, but also for monogastric
animals.
Soybean (Glycine max) husk is widely used as a ruminant feed and has been proposed for use
as a feed for lactating dairy cows (Ipharraguerre & Clark 2003). Soybean husk contains complex
carbohydrates including pectin, hemicellulose, and cellulose; and 77-88% of the pectin content of
soybean husk is contained as galacturonic acid (Mullin & Xu 2001, Monsoor 2005, Karr-Lilienthal et al.
2005, Gnanasambandam & Proctor 1999). Specifically, the major cell wall polysaccharide in soybean
husk is galactomannan, which is composed of galactose, mannose, arabinose, and glucose (Hussein et
al. 1998). Soybean husk also has been proposed for use as an energy feed for ruminants (Ipharraguerre
& Clark 2003) based on the observation that this material modifies rumen fermentation by permitting
increases in the cellulolytic microbial population in dairy cows (Belanche et al. 2012), a property also
reported for lablab bean husk (Fuma et al. 2012, Ngwe et al. 2012). Soybean husk was suggested for
use as an ingredient in dog food that would not negatively affect nutrient digestion (Cole et al. 1999);
previous work has shown that consumption of soybean husk yields a decrease in the level of harmful
fecal fermentation products, including sulphide and indole, along with an increase in SCFAs with a
23
concomitant reduction of fecal pH (Simpson et al. 2002). Soybean husk feeding in pigs decreases fecal
pH and ammonia emission without negatively affecting growth performance (Wang et al. 2009); the
non-starch polysaccharide in soybean husk is believed to promote the activity of lactobacilli and
bifidobacteria that utilize ammonia. Recently, soybean husk fed to piglets has been reported to
improve intestinal anatomical morphology and microbial community due to decreased proliferation
of E. coli (Pascoal et al. 2015).
Bean husk is considered an efficient source of soluble and insoluble dietary fiber that could be
utilized as a feed supplement for the improvement of gastrointestinal health of monogastric animals.
Therefore, supplementation of animal diets with bean husk that contains such beneficial fiber is
expected to stimulate the generation of favourable fermentation products in the gastrointestinal tract
through microbial modulation. Such intestinal microbiota-mediated functionality of bean husk in
monogastric animals is still under investigation.
The objective of the present study was to evaluate the utility of lablab bean husk and soybean
husk in cecal fermentation and microbial community regulation in rats; these results are expected to
provide insights into the future development of functional foods for monogastric animals.
3.2 Materials and methods
3.2.1 Animals and diets
This feeding experiment was conducted using twenty male Sprague Dawley rats (Japan SLC,
Inc., Hamamatsu, Japan), aged 5 weeks old. Rats were housed individually in plastic cages in an
environmentally controlled room maintained at 23℃ with a 12-h/12-h light-dark cycle (lights on from
12:00-24:00) and 55-60% relative humidity. Rats were divided into four groups (n=5 per group) with
an average body weight of 159.1±5.1 g. Diet and water were provided ad libitum. One group was given
a purified diet (AIN 93G; CLEA Japan Inc., Tokyo. Japan) that contains 5% cellulose powder as a fiber
source. This feed (designated CEL) was used as the control diet. The other three groups were given
the same purified diet in which the 5% cellulose was replaced by either corn starch (STA), lablab bean

24
husk (LBH), or soybean husk (SBH). STA did not contain any fiber source and was regarded as a negative
control. Corn starch was purchased from Wako (Osaka, Japan). Lablab bean husk was kindly provided
by Professor Tin Ngwe (University of Veterinary Science, Myanmar), and was obtained from a local
pulse processing plant (Yezin, Nay Pyi Taw, Myanmar) where the beans had been soaked in water and
de-hulled by hand. Soybean husk (Japanese product) was obtained through ZEN-NOH (Tokyo, Japan).
All of the rats were measured for body weight weekly and for feed intake daily; the feed conversion
ratios were calculated from these data. After 3 weeks, rats were euthanized with xylanzine HCl. At
necropsy, gastrointestinal segments (oesophagus, stomach, small intestine, caecum, and colon) and
their contents were harvested and weighed. Cecal digesta was sampled and stored at -80°C for the
analysis of fermentation products and microbiota. Blood was sampled from the heart by syringe,
centrifuged to obtain plasma, and frozen as above. The animal experiment was carried out in
compliance with the Guidelines for Animal Experiments, Hokkaido University (2007) and the Act on
Welfare and Management of Animal (2005).
3.2.2 Chemical analyses of bean husk
The chemical composition of both types of bean husk was analysed in triplicate, including
testing for dry matter, crude protein, crude fat, and crude ash using the Association of Official Analytic
Chemists methods (AOAC 1990). NDF and ADF were determined using a fiber analyser (A200, ANKOM,
Fairport, NY). Heat stable amylase was used in the NDF determination; the resulting values are
inclusive of residual ash. Analysis of ADL was also performed (Goering & Van Soest 1975). For sugar
analysis, the soluble fraction of the bean husk was obtained by water extraction (100 g husk per litre
water for 24 h). The resulting extract was freeze-dried; a 500-mg aliquot was dissolved in 1.2 ml of
water and the sugar composition was analysed by thin-layer chromatography (TLC) using a silica gel
60 F254 plate (Merck, Darmstadt, Germany). The TLC developing solvent consisted of isopropanol/1-
butanol/water (12:3:4, v/v/v). Maltooligosaccharide mixture (2% w/v) was used as a standard. Sugars
were visualized by spraying the TLC plate with anisaldehyde-sulfuric acid reagent (1% anisaldehyde

25
and 2% sulfuric acid in acetic acid) followed by heating of the plate. To purify the oligosaccharides
included in the water extract, the extract was separated by gel-filtration column chromatography
using a Bio-gel P-2 Extra Fine column (Bio-Rad, Hercules, CA); 1.5 cm i.d. 100 cm). Water was used
as mobile phase with a flow rate of 3 ml/h. One hundred fractions (4 ml per tube) were collected, and
sugar concentrations were measured by the phenol-sulfuric acid method (Dubois et al. 1956) using
glucose as a standard. Fractions containing oligosaccharides, including fractions S1, S2, S3, L1, L2, and
L3 (see Results), were used for further analyses. Molecular masses of the purified oligosaccharides
were analysed by electrospray ionization mass spectrometry (ESI-MS) using an Exactive mass
spectrometer (Thermo Fisher Scientific, Waltham, MA). Structural characterization of fractions L1 and
L2 was performed by dissolving the samples in D2O and obtaining 13C-NMR spectra using a Bruker
AMX500 NMR spectrometer (Bruker, Germany).
3.2.3 Measurement of blood parameters and cecal fermentation products
Blood plasma was analysed for glucose and total cholesterol by using commercially available
kits (Wako). Cecal digesta (1 g) was suspended in saline (5 ml) and vortexed, and the mixture was then
centrifuged (4°C, 7,800 × g, 5 min). The resulting supernatant was used to measure pH by electrode
(F-51, HORIBA. Kyoto, Japan), and also subjected to the analysis of SCFA, lactate, succinate, ammonia,
indole, and skatole concentrations. SCFA was determined by gas chromatography (GC-14B, Shimadzu,
Kyoto, Japan) equipped with 0.53 mm × 30 m capillary column (ULBON HR-20M, Shimadzu) as
previously reported (Suto 1973). D-lactate, L-lactate, and succinate were measured by D/L Lactic Acid
Assay Kits and Succinic Acid Assay Kits (Megazyme, Bray, Ireland) according to manufacturer’s
instructions for the respective kits. Ammonia nitrogen (NH3-N) was measured by the phenol-
hypochlorite reaction method (Weatherburn 1969) using a microplate reader (ARVO MX; Perkin Elmer,
Waltham, MA) at 660 nm. Assays for indole and skatole were carried out by colorimetric methods
(Walstra et al. 1999).
26
3.2.4 Microbiota analysis by qPCR
Bacterial DNA from each cecal sample was extracted using the repeated bead beating plus
column method (Yu & Morrison, 2004) with a QIAamp DNA Stool Mini Kit (Qiagen, Hilden, Germany).
Purified DNA was diluted appropriately before further analysis (for qPCR and 16S rDNA clone library).
Bacterial communities were quantitatively characterized by qPCR assays with species/group-specific
primers for the representative groups, including total bacteria, total lactobacilli, different Lactobacillus
species (L. acidophilus, L. gasseri, L. johnsonii, L. reuteri), total bifidobacteria, F. prausnitzii, E. hallii,
Clostridium coccoides-Eubacterium rectale group, Bacteroides-Prevotella-Porphyromonas group
(Rinttila et al. 2004), E. coli, and C. perfringens, using a LightCycler 480 real-time PCR system (Roche
Applied Science, Mannheim, Germany). Primers for OTU 4, OTU 5, OTU 6, and OTU 10 (detected in the
16S rDNA library; see Results) were newly designed. The sequences of the primers (5´-3´) for these
assays were F: ACGCGAAGAACCTTACCTGA and R: GCACGTGTGTAGCCCTGG for OTU 4 (Dorea
massiliensis), F: ACGTGACGGTACCTGGA and R: GGGACACAGTTTTGAGAG for OTU 5 (Oscillibacter
relatives), F: GGACTCGCGTCCGATTAGT and R: ACTGGTGTTCCTCCCCATC for OTU 6 (Ruminococcus
bromii), and F: CAGCACGTGAAGGTGGGGAC and R: CCTTGCGGTTGGCTTCAGAT for OTU 10
(Akkermansia muciniphila). Primer specificity, quantification range, and other validation reactions
were performed as described by Koike et al. (2007). Results from samples were averaged among the
animals in each dietary group and reported as a log value (gene copy number per g digesta) for total
bacteria and also as a relative abundance (%) of each species or group in total bacteria.
3.2.5 Microbiota analysis by 16S rDNA clone library
Bacterial DNA from each cecal digesta was amplified by PCR with the primers 27F
(AGAGTTTGATCATGGCTCAGA) and 1525R (AAGGAGGTGWTCCARCC). The reaction mixture for library
construction consisted of 2.5 µl of 10 Ex-Taq buffer, 2.0 µl of 2 mM dNTP, 0.5 µl of each primer,
18.375 µl of water, 0.125 µl of Takara Ex-Taq polymerase, and 1.0 µl of template DNA. PCR conditions
(22 cycles) were as follows: initial denaturation at 94oC for 0.5 min, annealing at 58°C for 0.5 min, and
27
extension at 72°C for 1.5 min. Final extension was performed at 72°C for 7 min. The PCR product was
purified by a QIAquick Gel Extraction Kit (Qiagen, Hilden, Germany) after performing agarose gel
electrophoresis, then ligated with pGEM-T Easy Vector (Promega, Madison, WI) and transformed into
E. coli JM109 (Nippon Gene, Tokyo, Japan). White colonies that developed on ampicillin- and Xgal-
containing Luria-Bertani plates were employed for plasmid isolation using a QIAprep Spin Miniprep Kit
(Qiagen, Hilden, Germany); the purified plasmid DNA was subjected to sequence analysis (TAKARA,
Shiga, Japan). Sequence classification was conducted using Mothur ver. 1.29 software (Schloss et al.
2009). After removal of the chimeric sequences, sequences sharing ≥ 97% identity were grouped into
operational taxonomic units (OTUs). The nucleotide sequences were compared with known sequences
in the GenBank database using BLASTn (http://blast.ncbi.nlm.nih.gov/Blast.cgi) to obtain similarity
values. The Clustal X program(http://www.clustal.org/) for multiple sequence alignment and
phylogenetic analysis was used. A neighbour-joining tree with a Kimura-2 correction was created
(Collins et al. 1994). The sequences obtained were deposited in the DDBJ nucleotide sequence
database under the accession numbers AB969309 through AB969665.
3.2.6 Microbiota analysis by MiSeq
For the comprehensive analysis of microbial communities, MiSeq analysis was performed.
Hypervariable V3-V4 regions of 16S rDNA were amplified by using the universal bacterial primer set
(Herlemann et al., 2011), consisting of S-D-Bact-0341-b-S-17 (CCTACGGGNGGCWGCAG) and S-D-Bact-
0785-a-A-21 (GACTACHVGGGTATCTAATCC), where N stands for A, C, G or T, W for A or T, H for A, T or
C, and V for A, C or G. The PCR reaction mixture (50 µl) contained 10 µl of 5 PrimeSTAR buffer, 4.0 µl
of dNTP, 1.0 µl of each primer, 32.5 µl of water, 0.5 µl of PrimeSTAR polymerase, and 1.0 µl of template
DNA. PCR reaction conditions (30 cycles) were as follows: denaturation at 98°C for 10 sec, annealing
at 55°C for 15 sec, and extension at 72oC for 30 sec. Following amplification, DNA was purified using a
High Pure PCR Product Purification Kit (Roche) and sequenced (Illumina Miseq 2000, San Diego, CA).
28
Raw Illumina fastq files were demultiplexed, qualitatively checked, and analysed by Quantitative
Insights into Microbial Ecology (QIIME v1.9.0) as described previously (Caporaso et al., 2010).
3.2.7 Statistical analysis
All data were analysed by a one-way analysis of variance (ANOVA). Tukey’s procedure for
multiple comparison was used to resolve differences among treatment means by using SPSS 16.0
software (SPSS, Chicago, IL, USA). Differences were considered to be significant if P ˂ 0.05 and trend
if P ˂ 0.10.
3.3 Results
3.3.1 Nutritional composition of bean husk
Chemical composition of the two different types of bean husk tested is shown in Table 5.
Insoluble dietary fiber, represented by cellulose and hemicellulose, predominated in both types of
bean husk. Non-fibrous carbohydrates, consisting of soluble components such as starch, soluble
sugars, and soluble fibers, accounted for 23.6% in lablab bean husk and 24.0% in soybean husk. TLC
analysis indicated the presence of three different oligosaccharides in each type of husk (denoted as
L1, L2, and L3 for lablab bean husk, and S1, S2 and S3 for soybean husk, with respective degrees of
polymerization as shown in Figure. 2). After purification by gel-filtration, the molecular mass of the
individual oligosaccharides in sodiated form, determined by ESI-MS, were estimated as follows: L1 and
S1 had the same mass of 504 Da, while L2 and S2 shared the same mass of 666 Da. L3 and S3, whose
molecular mass was estimated as 794 Da, could not be further analysed, presumably due to
complexity of their structure. The 13C-NMR spectra of L1 and L2 coincided exactly with those of
authentic raffinose and stachyose, respectively. Therefore, L1 and L2 were identified as raffinose and
stachyose, respectively. Lablab bean husk was found to contain 0.24% oligosaccharides, in which
raffinose (0.04%), stachyose (0.12%), and unknown oligosaccharides (0.1%) were constituents. In the

29
same manner, soybean husk was found to contain 0.26% oligosaccharides, in which raffinose (0.03%),
stachyose (0.2%), and unknown oligosaccharides (0.03%) were constituents.
3.3.2 Growth and cecal characteristics of rats
Growth performance and cecal fermentation profiles are summarized in Table 6. For animals
maintained for 3 weeks on the diets, no significant difference was found among the groups for feed
intake, body weight gain, feed conversion ratio (all in Table 6), or weights of GI segments, contents,
and internal organs (data not shown). Rats fed LBH and SBH showed lower (P ˂ 0.05) cecal pH than
those fed CEL and STA. The total SCFA concentration in the cecum (P ˂ 0.05) was elevated in both the
LBH and SBH groups compared to those in the CEL and STA groups. Similarly, the cecal acetate
concentration was higher (P ˂ 0.05) in LBH and SBH than in CEL and STA. The butyrate concentration
in SBH was higher (P ˂ 0.05) than that in CEL and STA, but did not differ from that in LBH; butyrate in
LBH was higher (P ˂ 0.05) than that in STA but did not differ from that in CEL. Total lactate
concentration was higher in SBH and STA than in CEL, an effect that was largely due to the higher
concentration (P ˂ 0.05) of L-lactate. Succinate concentration in SBH was the highest among the
groups and significantly higher (P ˂ 0.05) than those in CEL and STA, but did not differ from that in LBH.
Ammonia concentration did not differ among the groups. Rats fed STA showed the highest
concentration of indole and skatole among the groups. For indole, LBH-fed rats exhibited the lowest
levels, followed by CEL and then SBH. However the SBH effect on indole did not achieve significance.
Skatole concentrations were lowest in rats fed LBH followed by CEL and SBH, and all of these were
lower (P ˂ 0.05) than STA.
3.3.3 Microbiota
A phylogenetic tree of clones derived from the bacterial 16S rDNA clone library analysis is
shown in Figure 3. A total of 503 clones having nearly full-length 16S rDNA sequences were obtained
and formed 39 OTUs. Lactobacillales, Clostridium cluster IV, and Clostridium cluster XIVa were the
30
major clusters, to which 434 of 503 clones and 29 of 39 OTUs belonged. Bacteria belonging to OTU 4
(Dorea massiliensis) were frequently detected in STA (85% in total clones) but not in LBH or SBH.
Bacteria belonging to OTU 5 (Oscillibacter relatives) were frequently seen in LBH (58%) and CEL (42%)
but not in SBH or STA. OTU 6 (Ruminococcus bromii) was detected in CEL (53%), LBH (16%), and SBH
(31%), but not in STA. OTU 10 (Akkermansia muciniphila) was detected only in LBH and SBH, in
proportions of 67 and 33%, respectively.
New qPCR assays for OTU 4 (Dorea massiliensis), OTU 5 (Oscillibacter relatives), OTU 6 (R.
bromii), and OTU 10 (A. muciniphila) were successfully established with amplification efficiencies of
1.866-1.982 within ranges of 102-109 copies of the respective target DNA. Each primer set had
specificity sufficient to identify the target bacteria, as validated by mini-clone library sequencing (24-
72 clones for each exhibited 100% identity in sequence). The qPCR assay values for representative
cecal bacteria are shown in Table 7. The Lactobacillus group was the dominant bacterial taxon in the
cecal digesta. In comparison with CEL and STA, SBH showed a higher (P ˂ 0.05) proportion of total
lactobacilli, L. acidophilus, and L. reuteri, but proportions in SBH did not differ significantly from those
in LBH. Rats fed LBH had higher (P ˂ 0.05) abundance of A. muciniphila than those fed CEL and STA.
However, the abundance of A. muciniphila did not differ significantly between rats fed LBH or SBH.
LBH also showed a higher (P ˂ 0.05) proportion of bacteria belonging to OTU 5 (Oscillibacter relatives)
in comparison with STA and SBH, but this proportion did not differ from that with CEL. Rats fed on STA
showed a higher (P ˂ 0.05) proportion of Dorea massiliensis compared to the rats fed LBH or SBH.
However this proportion did not differ significantly from that in rats fed CEL. The abundance of total
bacteria, L. gasseri, L. johnsonii, F. prausnitzii, E. hallii, total bifidobacteria, R. bromii, E. coli,
Bacteroides-Prevotella-Porphyromonas group, and Clostridium coccoides-Eubacterium rectale group
were not affected by diets.
After quality filtering of the MiSeq data, a total of 1,011,982 sequence reads (CEL: 234987,
STA: 290834, LBH: 251263, SBH: 234898) remained from 20 samples. Alpha diversity indices including
Chao 1, observed species, Shannon, and phylogenetic diversity, and relative abundance of microbial

31
taxa at phylum and genus level (> 0.01%) are shown in Table 8. No difference was found among the
groups for alpha diversity indices. The number of observed species ranged from 441-603. At the
phylum level, rats fed SBH showed a higher (P ˂ 0.05) abundance of Actinobacteria than those fed CEL
or STA, but the value in SBH did not differ significantly from that in LBH. Within the Actinobacteria
phylum, members of the genus Bifidobacterium showed different abundances, with LBH and SBH
showing higher (P ˂ 0.05) abundance than CEL and STA. The relative abundance of Bacteroidetes did
not differ among the diet groups. However, rats fed LBH or SBH showed higher (P ˂ 0.05) abundances
of genus Prevotella than did those fed CEL or STA. STA showed higher (P ˂ 0.05) relative abundance of
unclassified Rikenellaceae than did LBH and SBH, but the value did not differ significantly from that of
CEL. Firmicutes was the most abundant bacterial phylum detected in the cecum of the rats. In
comparison with CEL, LBH showed lower (P ˂ 0.05) abundance of Firmicutes, but the value did not
differ significantly from that of STA and SBH. Within this phylum, Lactobacillus was highest (P ˂ 0.05)
in SBH in terms of relative abundance. STA showed higher (P ˂ 0.05) relative abundance of genus
Dorea than did LBH and SBH, but the STA value did not differ significantly from that of CEL. The relative
abundance of unclassified Ruminococcaceae was found to be higher (P ˂ 0.05) in CEL than in SBH, but
the value was not significantly different from that in LBH or STA. Rats fed LBH had a higher (P ˂ 0.05)
abundance of phylum Verrucomicrobia than did rats fed CEL and STA, but LBH and SBH did not differ
significantly for this parameter. Almost all phylum Verrucomicrobia were constituted by genus
Akkermansia, the proportion of which was higher (P ˂ 0.05) in LBH than in CEL and STA.
3.4 Discussion
The addition of 5% bean husk to the diet of rats had no significant effect on feed intake, body
weight, feed conversion ratio, or anatomical data, including the weights of GI tract segments and
contents. Blood parameters such as glucose and cholesterol were within normal ranges and not
different among the groups maintained on distinct diets (data not shown). Therefore, either of two
different types of bean husk is proposed for use as a feed ingredient for monogastric animals;

32
supplementation of rat feed with 5% bean husk did not exhibit detrimental effects on growth
performance or general health status.
Since the husk of different beans contains different amount of dietary fiber (Table 5), their
functions may be inherently different in the cecum of rats. Also, separation of soluble sugars revealed
the presence of oligosaccharides, including raffinose, stachyose, and others, in the two tested species
of bean husk. Soybean husk contained higher level of stachyose, which is a non-reducing
tetrasaccharide composed of two galactoses, one glucose, and one fructose. Lablab bean husk feeding
yielded distinct effects in the cecum such as increases of SCFAs, especially acetate; soybean husk
feeding yielded similar effects but with a distinguishing feature of increased lactate (Table 6). The
increases of these beneficial organic acids with both types of bean husk were probably the main
reason for the decrease of pH, reflecting fermentation of bean husk fiber in the cecum. The increase
in the concentration of acetate by lablab bean husk feeding might correspond to the increase in the
proportion of acetate-producing bacteria, particularly Akkermansia, that was detected by the MiSeq,
clone library, and qPCR analyses; a similar effect on bifidobacteria was supported only by the MiSeq
data (Tables 7 and 8, Figure. 3). Previous studies in obese mice have suggested that dietary fibers such
as oligofructose favour the growth of Akkermansia in the cecum (Everard et al. 2011, Everard et al.
2013). The abundance of Akkermansia inversely correlates with body weight and type 1 diabetes in
mice and humans (Everard et al. 2013, Santacruz et al. 2010). Therefore, increased abundance of
Akkermansia by lablab bean husk feeding is expected to yield a beneficial health impact in animals.
On the other hand, soybean husk feeding yielded increases in acetate and lactate concentrations,
possibly as a result of the enrichment of total lactobacilli, including L. acidophilus and L. reuteri that
was detected by qPCR and MiSeq analyses. These lactobacilli, particularly L. reuteri, have been found
to initially utilize raffinose-family oligosaccharides, which are converted to α-galactooligosaccharide
(Teixeira et al. 2012). α-galactooligosaccharide is presumably further utilized by other acetate and
lactate producers such as bifidobacteria, as detected by the MiSeq analyses in the present study.
Lactobacilli and bifidobacteria are well known for their probiotic activities, increasing in abundance in

33
rats upon supplementation of feed with raffinose oligosaccharides (Dinoto et al. 2006) and pectic
arabinogalactan (Daguet et al. 2006). Lablab bean husk feeding was also distinguished from soybean
husk feeding by its stimulatory effect on bacteria belonging to OTU 5, a member of Clostridium cluster
IV and the closest relative to Oscillibacter valerigienes. Relatives of Oscillibacter were found to
increase in animals fed diets rich in fermentable polysaccharides such as resistant starch (Walker et al.
2011). Another distinct phenomenon in soybean husk feeding was the increased cecal level of
succinate, a precursor of propionate; this succinate may have been produced by Prevotella, a genus
whose abundance increased from 0 to 0.01% on feeding with husk-supplemented diets. Therefore, in
the present study, the raffinose family oligosaccharides and/or possibly pectin contained in both types
of bean husk are hypothesized to be a main cause for the observed lactogenic and bifidogenic effects,
and for the increased abundance of other beneficial bacteria.
Interestingly, bacteria related to Dorea spp. (a constituent of Clostridium cluster XIVa),
regarded as a potentially harmful group, were not found (as assessed by the clone library) in rats fed
either type of bean husk. Lower values of this group for both LBH and SBH than for STA in the qPCR
assay and in the MiSeq analysis, may suggest functional improvement of the gastrointestinal health of
the host. Hooda et al. (2012) reported that the fecal population of Dorea is decreased in healthy men
consuming soluble polysaccharides. If the same situation applies in the present study, the presence of
pectic polysaccharide in both of bean husk appears to have indirectly inhibited the growth of Dorea
spp. in the caecum of rats. Increased abundance of the members of Clostridium cluster XIVa, including
Dorea spp., has been observed in patients with irritable bowel syndrome (Rajilic-Stojanovic et al. 2011).
Thus, present findings indicated that having a diet without any fiber (for example starch) can create
health problems and may be a risk factor for intestinal health. Bacterial coverage in our clone library
was not sufficiently wide in the present study, given the small number of sequence reads (503 in total).
However, the sequences that were obtained showed changes in the clone libraries associated with
the various feeding regimens; these differences were useful for focusing attention on specific groups
of bacteria (Akkermansia, Dorea, etc.), thereby suggesting the development of primers for
34
quantification of those groups. In fact, qPCR assay values for these groups corresponded well with the
detection frequency of those groups in the MiSeq data.
The present study raised the possibility that there was a reduced population of opportunistic
and pathogenic bacteria in the low-pH condition of the cecum, such that production of harmful
fermentation products remained low as a result of the enhanced growth of beneficial bacteria such as
lactobacilli and bifidobacteria. In particular, the lowered indole and skatole in the cecum of rats fed
either type of bean husk might be due to fibers that regulate bacterial nitrogen metabolism (Xu et al.
2002). Additionally, the insoluble fibers are expected to adsorb these bacterial putrefactive
compounds, facilitating the excretion of those products. Similar findings were obtained in a previous
report (An et al. 2013), indicating that fermentable fibers (including oligosaccharides and
polysaccharides) suppress the accumulation of the bacterial putrefactive compounds that are
responsible for the malodour of flatus and feces. Therefore, we hypothesize that the formation of
indole and skatole in the cecum were suppressed primarily by the presence of dietary fibers in the
bean husks, which provide physical features such as increased adsorption ability, acceleration of
excretion, and other functional activities.
In conclusion, supplementation with bean husk promoted cecal fermentation in rats, as
indicated by higher concentrations of SCFAs and lactate, and decreased accumulation of bacterial
putrefactive compounds. Two types of husk were tested; both exhibited remarkable selectivity against
gut bacteria. Similar bifidogenic effects and suppressive effects on Dorea spp. were found with both
lablab and soybean husks.
With respect to specific effects on rat cecal microbiota, lablab bean husk stimulated the
growth of A. muciniphila and Oscillibacter-related bacteria, while soybean husk stimulated the growth
of members of the Lactobacillus group, including L. acidophilus and L. reuteri. Both types of bean husk
were shown to contain oligosaccharides that might enrich for these beneficial bacteria, thereby
inhibiting the colonization of the intestinal tract by potential pathogens. Therefore, either of the
35
tested bean husk types is expected to serve as a promoter of hindgut health and could find use as a
functional feed ingredient for monogastric animals.
36
Chapter 4
Function of soybean husk in dogs
4.1 Introduction
Soybean husk represents a large agro-byproduct and contains 63-81% total dietary fiber, of
which 4-12% is soluble fiber (Cole et al. 1999). Because of these dietary fibers and polyphenols (Zhang
et al. 2011), soybean husk can be considered as an alternative functional food supplement for
monogastric animals. Both soybean and its husk contain oligosaccharides such as raffinose (0.3-1%),
stachyose (0.8-4%) and verbascose (0.1-0.2%) (Fan et al. 2015). Recent study indicated that dietary
supplementation with soybean husk decreased E. coli numbers and increased acetate production in
the gastrointestinal (ileal) tract of piglets (Pascoal et al. 2015). More recently, in a rat study, soybean
husk was proposed as a functional food ingredient in light of its solubility, viscosity, water-holding
ability, cholesterol-binding and bile acid-binding capacities and hypocholesterolemic activity (Liu et al.
2016).
Accordingly, soybean husk is a potential health promoting additive not only for domestic
animals, but also for long-living monogastrics such as companion animals. In fact, dietary
supplementation with 16% soybean husk reduced the body weight of obese dogs by restricting energy
absorption without any changes in behavior or feed intake (Sabchuk et al. 2014). To the best of our
knowledge, little study on the effect of soybean husk supplementation of pet foods on intestinal
microbes has been conducted since Cole et al. (1999) reported that soybean husk (as an effective
dietary fiber source) did not negatively affect nutrient digestibility in dogs. A study employing dietary
supplementation with a combination of 5% each of soybean husk and beet pulp in dogs showed
improved fermentation; however, no specific changes in the microbiota as analyzed by denaturing
gradient gel electrophoresis were observed (Simpson et al. 2002). With its potential nutritive and
physiological effects, soybean husk should be investigated for its functional capacity relating to the
gastrointestinal microbiota and health of dogs.

37
Thus, the objective of this study was to obtain preliminary information regarding this
functional fiber source in improving the gastrointestinal health of dogs by focusing on fecal
fermentation characteristics and microbes.
4.2 Material and methods
4.2.1 In vitro fermentation experiment
Cellulose (Sigma-Aldrich, Tokyo, Japan), soybean husk (ZEN-NOH, Tokyo, Japan) (Table 9) and
enzyme-treated soybean husk were used as substrates for the in vitro fermentation experiments. In
comparison with pure cellulose as a control fiber, we expected to assess physicochemical functions
specific to soybean husk. Soybean husk was ground using a 1 mm sieve and employed in the
fermentation study. Enzyme-treated soybean husk (to simulate stomach and small intestinal
digestion) was prepared according to the method of Panasevich et al. (2013). Briefly, 1 g of soybean
husk for triplicate tubes was weighed and incubated for 6 h in 25 mL of 0.1 M phosphate buffer, 10
mL of 0.2 M hydrochloric acid and 1 mL of 1% pepsin solution (Wako, Osaka, Japan) at 39oC in a shaking
water bath to simulate gastric digestion. Then, the pH was adjusted to 6.8 by 6N NaOH (6M NaOH in
1 L water) and 1 mL of 5% pancreatin solution (Sigma-Aldrich) was added to each tube. Incubation
continued at 39oC for 18 h to simulate small intestinal digestion. Digesta samples were precipitated
by the addition of four volumes of 95% ethanol, allowed to stand for 1 h and filtered by suction.
Residues were dried to a constant weight and applied to the in vitro fermentation experiment as
enzyme-treated soybean husk. Cellulose was also treated in the same manner and used as a control
substrate.
Feces as the inoculum source were obtained from three Toy Poodle dogs (6.5 ± 3.5 months in
age, 2.9 ± 0.4 kg in body weight) in a pet shop (Petland, Sapporo, Japan). The animals were housed
individually and fed a commercially available dry diet (120 g/d, Royal Canin Mini Junior; ROYAL CANIN
JAPON, Tokyo, Japan, Table 9) twice daily (08.00 and 17.00 hours) with free access to drinking water.
Freshly voided feces (within 15 min of defecation) were collected. Equal amount of feces from three
38
dogs were mixed and diluted (1:10 w/v) with McDougall’s buffer (McDougall 1948), homogenized,
filtered through four layers of surgical gauze and sealed in a 125 mL serum bottle into which CO2 was
flushed. Two series of in vitro fermentation experiments, one for intact soybean husk and the other
for enzyme-treated soybean husk, were performed. A 0.1 g portion of substrate in triplicate Hungate
tubes was added to 10 mL of fecal inoculum under CO2 flushing and incubated at 39oC for 24 h.
Cellulose (Table 1) was used as a control substrate. After incubation, samples were analyzed for pH,
SCFA, lactate, ammonia, indole and skatole. The remaining samples were frozen at -80oC for microbial
analyses.
4.2.2 In vivo feeding experiment
Four healthy Shiba dogs (7−48 months in age and 7.5 ± 1.7 kg in body weight) reared by a dog
breeder (Shiroi, Chiba, Japan) were used. All dogs were housed individually and fed twice daily (08.00
and 17.00 hours) with commercial diet (170 g/day, three dogs fed Aikengenki; Unicharm, Tokyo, Japan,
or one dog fed Science Diet; Hill's Colgate, Tokyo, Japan, Table 9) to which 10 g cellulose powder or
soybean husk powder were supplemented (5.6% of total diet). The fiber sources were the same as
used for the in vitro experiment. The dogs were fed the cellulose-supplemented diet for the first 7 days,
and then were switched to the soybean husk-supplemented diet for another 7 days. On the 6th and
7th day of each dietary period, feces were collected a total of four times (morning and evening for
both days) and mixed. Mixed feces from individual dogs in each period (1 g) was suspended in 10 mL
of distilled water, homogenized, and centrifuged (4°C, 12,000 × g, 2 min), and the supernatants were
used for the analysis of fermentation metabolites. Fecal samples were also employed for DNA
extraction to monitor fecal microbes. The study protocol conformed to the Guidelines for Animal
Experiments, Hokkaido University (2007) and the Act on the Welfare and Management of Animals
(2005). Written informed consent was obtained from the owners of all animals used.

39
4.2.3 Chemical analysis
The proximate analysis of soybean husk was performed according to the methods of the
Association of Official Analytic Chemists (AOAC 1990). Fiber fractions including NDF, ADF and ADL were
determined according to the methods described by Goering and Van Soest (1975), where NDF was
assayed using a heat-stable amylase. The values were expressed inclusive of residual ash. Cellulose
was calculated as the difference between ADF and ADL. Hemicellulose was calculated as the difference
between NDF and ADF. Non-structural carbohydrate (NSC) or non-fibrous carbohydrate (NFC) were
calculated by subtracting the sum of NDF, ash, protein and fat from 100. Soluble dietary fiber was
determined using total dietary fiber assay kits K-TDFR (Megazyme International, Wicklow, Ireland)
according to the manufacturer's instructions. All analyses were performed in triplicate and the results
are reported on a dry matter basis. Determinations of total polyphenols, total flavonoids and total
tannin were performed.
Fecal pH was measured using a pH electrode (F-51; HORIBA, Kyoto, Japan), while ammonia
was determined by the phenol-hypochlorite reaction method, and indole and skatole by colorimetric
methods using a spectrophotometer (ARVO MX; Perkin Elmer, Yokohama, Japan). For SCFA and lactate,
0.2 g of feces were mixed with 600 μL of distilled water and 200 μL of 25% meta-phosphoric acid,
vortexed, kept at 4°C overnight, and centrifuged (4°C, 13,000 × g, 20 min). The supernatant obtained
was subjected to gas chromatographic analysis of SCFA (GC-14B; Shimadzu, Kyoto, Japan) using a
0.53 mm × 30 m capillary column (ULBON HR-20M; Shimadzu) and D/L-lactic acid assay of lactate
using a kit (Megazyme, Bray, Ireland) according to the manufacturer's instructions.
4.2.4 Microbial analysis
DNA was extracted from in vitro cultures and in vivo fecal samples and purified using the
repeated bead beating plus column (RBB+C) method (Yu & Morrison 2004) with QIAamp DNA Stool
Mini Kit (Qiagen, Hilden, Germany). The DNA concentration was quantified by a NanoDrop 2000
(Thermo Fisher Scientific, Waltham, MA, USA). Extracted fecal DNA was appropriately diluted and
40
subjected to qPCR assay to characterize the following representative bacterial species/groups: total
bacteria, total lactobacilli, four species of Lactobacillus (L. acidophilus, L. johnsonii, L. gasseri and L.
reuteri), total bifidobacteria, Clostridium cluster IV (Clostridium leptum subgroup) (Matsuki et al. 2004),
F. prausnitzii, Clostridium cluster XIVa (Clostridium coccoides group) (Song et al. 2004), E. hallii,
Clostridium cluster XI (Song et al. 2004), C. perfringens, Clostridium cluster I (Song et al. 2004),
Bacteroides-Prevotella-Porphyromonas group, Prevotella (Matsuki et al. 2002), Akkermansia
muciniphila (Png et al. 2010) and E. coli using specific primers. The qPCR assay was performed using a
Light Cycler 480 real-time PCR system (Roche Applied Science, Mannheim, Germany). Results are
reported as a log value of the gene copy number per gram feces for total bacteria and as a relative
proportion of each species/group in total bacteria for specific bacteria.
4.2.5 Statistical analysis
Student's t-test (SPSS 16.0 software; SPSS Inc., Chicago, IL, USA) was performed to determine
the significance of changes in the fermentation metabolites and bacterial species/groups in samples
from both in vitro and in vivo experiments. P-values of less than 0.05 and less than 0.1 were considered
as statistically significant and trend, respectively.
4.3 Results
4.3.1 In vitro fermentation experiment
Fermentation metabolites resulting from the in vitro fermentation with intact or enzyme-
treated soybean husk are presented in Table 10. Incubation with either intact soybean husk or
enzyme-treated soybean husk produced greater (P < 0.01) amounts of total SCFAs (including acetate,
propionate and butyrate) and lactate, with a significant reduction (P < 0.05) in pH compared with
cellulose. Only acetate was increased (P < 0.01) in enzyme-treated soybean husk compared with
cellulose in terms of the molar proportion. Lower (P < 0.01) amounts of indole and skatole were
detected for intact soybean husk than cellulose, whereas enzyme-treated soybean husk showed a

41
decreasing trend (P < 0.1) of indole production compared with cellulose. Neither intact nor enzyme-
treated soybean husk affected ammonia production.
The qPCR analysis of microbes in the in vitro fermentation with intact or enzyme-treated
soybean husk is presented in Table 11. Fermentation with either intact or enzyme-treated soybean
husk resulted in increased (P < 0.05) numbers of bifidobacteria as compared with cellulose. Levels of
total bacteria, total lactobacilli and E. coli were unaffected by supplementation with intact and
enzyme-treated soybean husk.
4.3.2 In vivo feeding experiment
Fecal fermentation metabolites of dogs fed diets supplemented with either soybean husk or
cellulose are presented in Table 12. Soybean husk supplementation significantly decreased (P < 0.01)
fecal pH compared with cellulose. Feces of dogs fed the soybean husk diet had higher (P < 0.05) levels
of total SCFAs, acetate, butyrate and lactate than those fed the cellulose diet. Propionate was
unaffected by soybean husk supplementation. Soybean husk had no effect on the molar proportion of
SCFA. The fecal concentrations of indole and skatole in dogs fed the soybean husk diet were lower
(P < 0.05) than those fed the cellulose diet. Fecal ammonia concentration was unaffected by soybean
husk supplementation.
Fecal microbiota of dogs fed a diet supplemented with either soybean husk or cellulose is
presented in Table 13. Soybean husk supplementation led to a greater (P < 0.05) relative proportion
of total lactobacilli than observed for cellulose supplementation. The levels of various Lactobacillus
species, including L. acidophilus, L. johnsonii, L. gasseri and L. reuteri were unaffected by soybean husk
supplementation. The levels of Clostridium cluster IV and its member F. prausnitzii were higher
(P < 0.05) in dogs fed the soybean husk diet than in those fed the cellulose diet. Dogs fed the soybean
husk diet showed a higher (P < 0.05) Clostridium cluster XIVa level than those fed the cellulose diet. In
contrast, there was a reduction (P < 0.01) in the proportion of Clostridium cluster XI in dogs fed
soybean husk diet compared with those fed cellulose diet. The proportion of Bacteroides-Prevotella-
42
Porphyromonas group was higher (P < 0.05) in dogs fed soybean husk diet than in those fed cellulose
diet. The levels of total bacteria, total bifidobacteria, E. hallii, C. perfringens, Clostridium cluster I,
Prevotella, A. muciniphila and E. coli were not affected by soybean husk supplementation.
4.4 Discussion
In vitro study revealed that soybean husk supplementation significantly increased
fermentation products such as SCFAs and lactate, indicating the fermentability of soybean husk, in
comparison with cellulose (Table 10). This was also confirmed by supplementation with enzyme-
treated soybean husk, although a smaller increase compared to intact soybean husk was observed.
This difference in fermentability between intact and treated soybean husk is due to the disappearance
of rapidly fermentable components during enzymatic digestion, leaving behind the more slowly
fermenting components such as cellulose. Because intact soybean husk is rich in both soluble and
insoluble dietary fiber, the microbiota in the culture could be modulated, leading to a decrease in
putrefactive compounds, such as indole and skatole, produced from the remaining fecal protein. The
pH-lowering and bifidogenic effects of soybean husk (Tables 10 and 11) are proposed to be key factors
for reducing the production of these bacterial putrefactive compounds. This has been suggested to
benefit gastrointestinal health (Jha and Berrocoso, 2016). However, this effect was not obvious in
enzyme-treated soybean husk, with the exception of the tendency toward decreased indole levels.
Overall, the in vitro fermentation study suggested that soybean husk can be favorably fermented in
the hindgut of dogs, possibly contributing to gut health.
Dietary supplementation of cellulose or soybean husk did not affect feed intake and body
weight, and showed no detrimental effects such as diarrhea and general illness in dogs used. Although
we did not collect nutritional data, adverse effect on growth performance of dogs might not be
expected by supplementing 5% soybean husk in the diet as suggested by Cole et al. (1999). The feces
of dogs on soybean husk diet had higher SCFAs including acetate and butyrate, and also lactate,
leading to a low pH (Table 12). These beneficial organic acids are indicative of increased microbial
43
activity, reflecting changes in specific groups of bacteria in dogs fed the soybean husk diet. Soybean
husk appears to be butyrigenic, since both the concentration and molar proportion of butyrate
increased. This might be attributable to the increased proportion of butyrate producers in Clostridium
clusters IV and XIVa (Table 13). The increased proportion of Clostridium cluster IV following soybean
husk supplementation is likely due to increased numbers of F. prausnitzii. Fecalibacterium spp. are
prominent in the feces of healthy dogs (Garcia-Mazcorro et al. 2012) and these species have been
shown to possess anti-inflammatory properties, evidenced by the protective effect of butyrate
production on inflammatory bowel disease in dogs (Suchodolski et al. 2012). The increase in such
butyrate producers could be explained by the increased abundance of total lactobacilli, as there is
cross-feeding mechanism between lactate producers and butyrate producers. In fact, the metabolic
mechanism of lactate to butyrate has been previously reported (Duncan et al. 2004).
It is possible that other specific Lactobacillus species may be stimulated by soybean husk
besides those assessed in the present study, in reference to the large difference in qPCR assay values
between total lactobacilli (14.2%) and the sum of the four Lactobacillus spp. determined (<0.60%)
(Table 13). Lactobacilli unquantified could be L. fermentum, L. rhamnosus, L. salivarius, L. murinus, L.
animalis, L. sanfranciscensis and L. paraplantarum detected in dogs (Grzeskowiak et al. 2015) and also
uncultivated ones. The bifidogenic effects of soybean husk supplementation observed in the in vitro
study (Table 11) were not confirmed by the in vivo feeding study. This can be partly explained by
differences in the microbiota between dog breeds and between the main diet compositions. Members
of Bacteroides-Prevotella-Porphyromonas are known as important fiber degraders, and pectin has
been reported to increase the numbers of this group (Ivarsson et al. 2014). Therefore, soybean husk
containing such components might contribute to the increase in Bacteroides-Prevotella-
Porphyromonas numbers.
In soybean husk supplementation, the fecal levels of indole and skatole as microbial
metabolites of tryptophan were decreased in the present feeding study (Table 12). This can be partly
explained by the decrease in Clostridium cluster XI numbers (Table 13), the growth of which was

44
negatively influenced by the low pH from organic acid production from soybean husk. Consequently,
this may have decreased the metabolism of undigested or endogenous proteins, since its members
are protein utilizers, although C. perfringens numbers were unchanged by soybean husk feeding.
Moreover, the polyphenol content and swelling property of soybean husk (Kosmala et al. 2014) might
be other reasons for the reduction in these putrefactive compounds responsible for fecal odor.
Sensory evaluation for fecal odor was not conducted in the present study. However, less unpleasant
odor of feces from dogs fed soybean husk could be noticed while handling and analyzing the samples.
The inhibitory effect of soybean husk on indole and skatole production is thought to be beneficial,
since these compounds are regarded as a risk factor for colon cancer (Windey et al. 2012). In this
regard, soybean husk supplementation could be useful for companion animals that are long-lived
and/or kept indoors.
The present studies are not considered to be of sufficient duration (7 days) to assess
adaptation of the hindgut microbiota. However, the observed beneficial shifts in lactobacilli,
Clostridium cluster IV including F. prausnitzii, Clostridium cluster XIVa, Bacteroides-Prevotella-
Porphyromonas and organic acid production suggest that soybean husk supplementation improves
gastrointestinal health in dogs. Further in vivo studies are needed to confirm this observation, using
long-term study with different levels of soybean husk in the feed formulation. Detailed evaluation of
soybean husk for nutrition, health and animal performance is possible in relation to microbial
modulation once optimal supplementation level is established.

45
Chapter 5
General discussion
In the present study, chickpea husk, lablab bean husk and soybean husk were found to contain
both of soluble (represented by non-structural carbohydrate) and insoluble (NDF) dietary fiber.
However, each bean husk contains different amounts of polyphenols and fiber. In particular, chickpea
husk was rich in tannin, resulting in high antioxidative effects. Meanwhile, soluble sugar from lablab
bean husk and soybean husk appeared as two main spots on thin layer chromatography, and were
identified as raffinose and stachyose. When these different types of bean husk were used in three
different feeding studies using rat and dogs, beneficial health effects were found. Main findings are
summarized in Table 14.
Functional property of chickpea husk was evaluated by using rats. The lower concentration of
total cholesterol was observed in rats fed chickpea husk diet in comparison with starch. Lower blood
cholesterol level is probably due to tannins and dietary fiber present in chickpea husk. Tannins of
chickpea husk can bind to bile acid in rat intestine and inhibit its reabsorption, facilitating bile acid
synthesis in the liver for which plasma cholesterol is used. This can promote the reduction of blood
cholesterol level. Beside tannins, both of soluble and insoluble fiber in chickpea husk might in part
inhibit absorption of cholesterol source from dietary lipids by acceleration of fecal lipid excretion
through lipid binding ability of tannins. Chickpea husk dietary supplementation showed the reduction
of TBARS in comparison with cellulose and starch supplementation. Tannins in chickpea husk might
be responsible for the prevention of superoxide formation and lipid peroxidation. In fact, TBARS
lowering effect of tannin has been demonstrated in serum of rabbits (Jurgonski et al. 2014). Tannin-
rich fiber found in tea was reported as a lipid binding agent that reduced blood cholesterol level and
improved antioxidant activity in mice, because tannins interfere with fatty acid metabolism and it
enhance endogenous antioxidant defense system or participate in the regeneration of other
antioxidant compounds (Guo et al. 2016). Cholesterol-lowering effect of chickpea husk and protective
46
effect of chickpea husk against lipid oxidation suggest the functional importance of this by-product in
prevention and care for cardiovascular diseases and overall health in animals.
Lablab bean husk feeding increased cecal level of total SCFA including acetate and butyrate
and lowered cecal pH, indicating improvement of hindgut fermentation. In particular, lablab bean husk
feeding showed higher acetate level that was related to increased abundance of Akkermansia
confirmed by both of qPCR and Miseq. This mucin degrading species is known to convert mucins to
acetate (Dao et al. 2016). Such prebiotics-like activity might be due to pectin or oligosaccharides
possibly contained in lablab bean husk. Consumption of pectin or guar gum was found to increase
Akkermansia in rats fed high-fat diets (Jakobsdottir et al. 2013) and its abundance has been negatively
associated with metabolic diseases such as obesity and diabetes (Everard et al. 2011, Santacruz et al.
2010). Therefore, increased abundance of Akkermansia by lablab bean husk feeding has a beneficial
health impact with respect to prevention and care for obesity, diabetes and their associated metabolic
disorders in monogastric animals, especially long-living animals including companion animals and even
humans.
Soybean husk feeding in rats increased total SCFA, acetate, butyrate in comparison with
cellulose and starch feeding. Major polysaccharides and oligosaccharides in soybean husk seem to be
utilized by cecal microbes and improved the cecal environment through organic acid production,
leading to low pH. The most favorable aspect of soybean husk feeding in rats was the increase of cecal
lactobacilli which were predominant acetate and lactate producers confirmed by both qPCR and
MiSeq. The presence of pectin or raffinose family oligosaccharides in soybean husk might be the main
factor to increase lactobacilli, because lactobacilli have the ability to break down raffinose and
stachyose by their α-galactosidase activity (Pan et al. 2017), leading greater SCFA production. Soybean
husk could possess a beneficial health impact in another aspect, since importance of lactobacilli have
been known for the immune development in the gastrointestinal tract (Van Baarlen et al. 2013).
Soybean husk was supplemented in the diet of dogs to evaluate its impact. Feces of dogs fed
on soybean husk diet had higher levels of total SCFA and lactate than those on cellulose diet. These

47
increases of beneficial organic acids with concomitant reduction of pH are indicative of increased
microbial growth and activities. Lactogenic effect of soybean husk found in rat study was confirmed
in dog. This caused increase of lactate that might be consumed by Clostridium cluster IV including F.
prausnitzii and Clostridium cluster XIVa to produce butyrate as demonstrated by Duncan et al. (2004).
Increased abundance of those butyrate producers are considered favorable, because these species
have been shown to possess anti-inflammatory properties due to their potential protective effect on
inflammatory bowel disease in dog by producing butyrate (Suchodolski et al. 2012). Therefore,
supplementation of soybean husk in the diet of dog has a beneficial health impact with respect to its
lactogenic effect and potential anti-inflammatory properties.
Conclusion
The results in first experiment indicate that chickpea husk dietary supplementation (5%)
improves cardiovascular health through lowering of blood cholesterol and lipid peroxidation product
(TBARS) by its polyphenols and dietary fibers in chickpea husk. The results in second experiment
indicate that 5 % inclusion of lablab bean husk and soybean husk in the diet promotes cecal
fermentation of rats, as represented by higher SCFA. Lablab bean husks exhibits a remarkable
selectivity against Akkermansia, while soybean husk particularly favors the growth of lactobacilli in the
cecum of rats. Improvement of hindgut fermentation and lactogenic effect by soybean husk were
confirmed in third experiment using dogs. The improvement of hindgut fermentation and increased
proportion of beneficial bacteria by supplementation of bean husk may be useful for promoting
gastrointestinal health of monogastric animals. However, further studies are needed to fully
understand the association of bean husk feeding with health of animals including humans. In this stage,
the characterization and purification of individual functional components from bean husk needs
further studies to confirm which one is responsible for the prebiotic effect and other health benefits
in animals as well as humans. Bean husk could be valuable in the development of nutritional and drug
therapies to combat different health ailments.
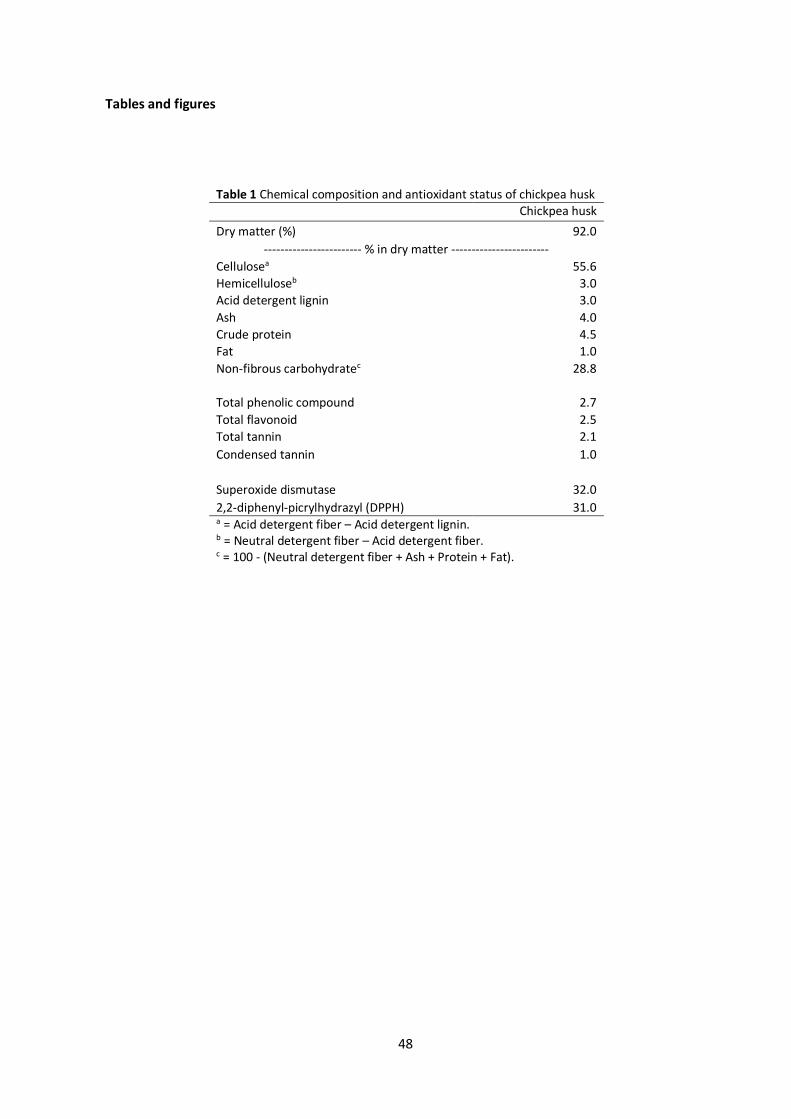
48
Tables and figures
Table 1 Chemical composition and antioxidant status of chickpea husk
Chickpea husk
Dry matter (%) 92.0
------------------------ % in dry matter ------------------------
Cellulosea 55.6
Hemicelluloseb 3.0
Acid detergent lignin 3.0
Ash 4.0
Crude protein 4.5
Fat 1.0
Non-fibrous carbohydratec 28.8
Total phenolic compound 2.7
Total flavonoid 2.5
Total tannin 2.1
Condensed tannin 1.0
Superoxide dismutase 32.0
2,2-diphenyl-picrylhydrazyl (DPPH) 31.0 a = Acid detergent fiber – Acid detergent lignin. b = Neutral detergent fiber – Acid detergent fiber. c = 100 - (Neutral detergent fiber + Ash + Protein + Fat).
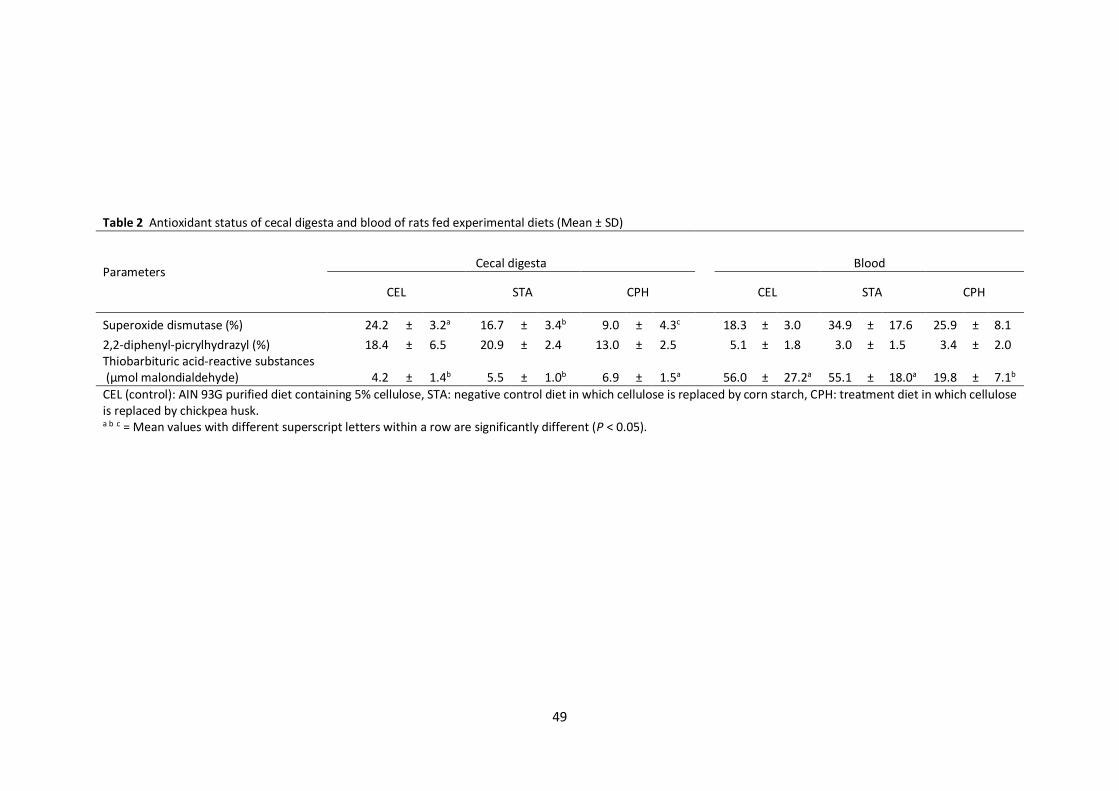
49
Table 2 Antioxidant status of cecal digesta and blood of rats fed experimental diets (Mean ± SD)
Parameters Cecal digesta Blood
CEL STA CPH CEL STA CPH
Superoxide dismutase (%) 24.2 ± 3.2a 16.7 ± 3.4b 9.0 ± 4.3c 18.3 ± 3.0 34.9 ± 17.6 25.9 ± 8.1
2,2-diphenyl-picrylhydrazyl (%) 18.4 ± 6.5 20.9 ± 2.4 13.0 ± 2.5 5.1 ± 1.8 3.0 ± 1.5 3.4 ± 2.0 Thiobarbituric acid-reactive substances (µmol malondialdehyde) 4.2 ± 1.4b 5.5 ± 1.0b 6.9 ± 1.5a 56.0 ± 27.2a 55.1 ± 18.0a 19.8 ± 7.1b
CEL (control): AIN 93G purified diet containing 5% cellulose, STA: negative control diet in which cellulose is replaced by corn starch, CPH: treatment diet in which cellulose is replaced by chickpea husk. a b c = Mean values with different superscript letters within a row are significantly different (P < 0.05).

50
Table 3 Cecal fermentation and blood parameters of rats fed experimental diets (Mean ± SD)
Parameters CEL STA CPH
Cecal digesta
pH 8.3 ± 0.1a 8.3 ± 0.2a 7.9 ± 0.1b
Total SCFA (µmol/g digesta) 37.6 ± 6.4b 46.8 ± 5.9a 46.1 ± 3.4a
Acetate (µmol/g digesta) 23.2 ± 2.3 27.1 ± 4.5 27.5 ± 1.9
Propionate (µmol/g digesta) 7.9 ± 2.9 10.4 ± 1.7 8.7 ± 1.7
Butyrate (µmol/g digesta) 3.1 ± 0.9b 5.4 ± 1.5a 6.5 ± 1.0a
Acetate (molar %) 62.4 ± 6.2 57.7 ± 5.4 59.8 ± 2.2
Propionate (molar %) 20.6 ± 4.9 21.9 ± 1.4 18.9 ± 2.7
Butyrate (molar %) 8.2 ± 1.3 11.8 ± 4.1 14.1 ± 1.9
Ammonia (µgN/g digesta) 131 ± 35.8 156.7 ± 26.6 137.4 ± 32.3
Indole (µg/g digesta) 14.6 ± 2.4b 32.2 ± 6.9a 17.5 ± 5.4b Skatole (µg/g digesta) 113 ± 35.0b 201.5 ± 94.6a 124.5 ± 36.2b
Blood Total glucose (mg/dl of plasma) 158.2 ± 69.2 191.4 ± 46.2 102.3 ± 20.4 Total cholesterol (mg/dl of plasma) 103.9 ± 5.8a 121.8 ± 11.3a 83.6 ± 3.3b
CEL (control): AIN 93G purified diet containing 5% cellulose; STA: negative control diet in which cellulose is replaced by corn starch; CPH: treatment diet in which cellulose is replaced by chickpea husk.
a b = Mean values with different superscript letters within a row are significantly different (P ˂ 0.05).

51
Rat number Similarity (%)
Figure 1 Similarity of DGGE banding profiles generated from DNA of cecal bacteria of rats fed experimental diets.
CEL (Control) (□): AIN 93G purified diet containing 5% cellulose, STA (▧): negative control diet in which cellulose is replaced by corn starch, CPH (■): treatment diet in which cellulose is replaced by chickpea husk.
▧
▧
□
□
▧
□
□
□
▧
▧
■
■
■
■
■
STA 10
STA 9
CEL 1
CEL 15
STA 4
CEL 5
CEL 3
CEL 6
STA 11
STA 12
CPH 13
CPH 2
CPH 8
CPH 7
CPH 14
Diet

52
Table 4 Cecal bacteria of rats fed experimental diets (Mean ± SD)
Bacteria CEL STA CPH
Total bacteria (Log copy/g digesta) 11.2 ± 0.1 11.2 ± 0.1 11.3 ± 0.1
Proportion (Relative % in total bacteria) Total lactobacilli 45.0 ± 10.6 46.0 ± 17.1 53.0 ± 4.6
Lactobacillus acidophilus 0.2 ± 0.04 0.2 ± 0.06 0.4 ± 0.08
Lactobcillus gasseri 0.001 ± 8E-04 0.0005 ± 1E-04 0.0003 ± 0.0001
Lactobacillus johnsonii 20.7 ± 5.5 16.3 ± 3.9 20.9 ± 4.7
Lactobacillus reuteri 2.4 ± 0.3 1.7 ± 0.4 2.8 ± 0.4
Total bifidobacteria 2.1 ± 1.4 0.1 ± 0.07 1.7 ± 1.2
Faecalibacterium prausnitzii 0.003 ± 7E-04 0.001 ± 4E-04 0.003 ± 0.0005
Eubacterium halli 0.001 ± 0.001 0.0005 ± 2E-04 0.0003 ± 0.0001
Clostridium perfringens ND ND ND Eschericheria coli 0.1 ± 0.07 0.2 ± 0.09 0.02 ± 0.01
Clostridium coccoides-Eubacterium rectale group 6.8 ± 1.5 4.6 ± 1.4 6 ± 1.5
CEL (control): AIN 93G purified diet containing 5% cellulose, STA: negative control diet in which cellulose is replaced by corn starch, CPH: treatment diet in which cellulose is replaced by chickpea husk. ND = not detected (not within quantifiable range).
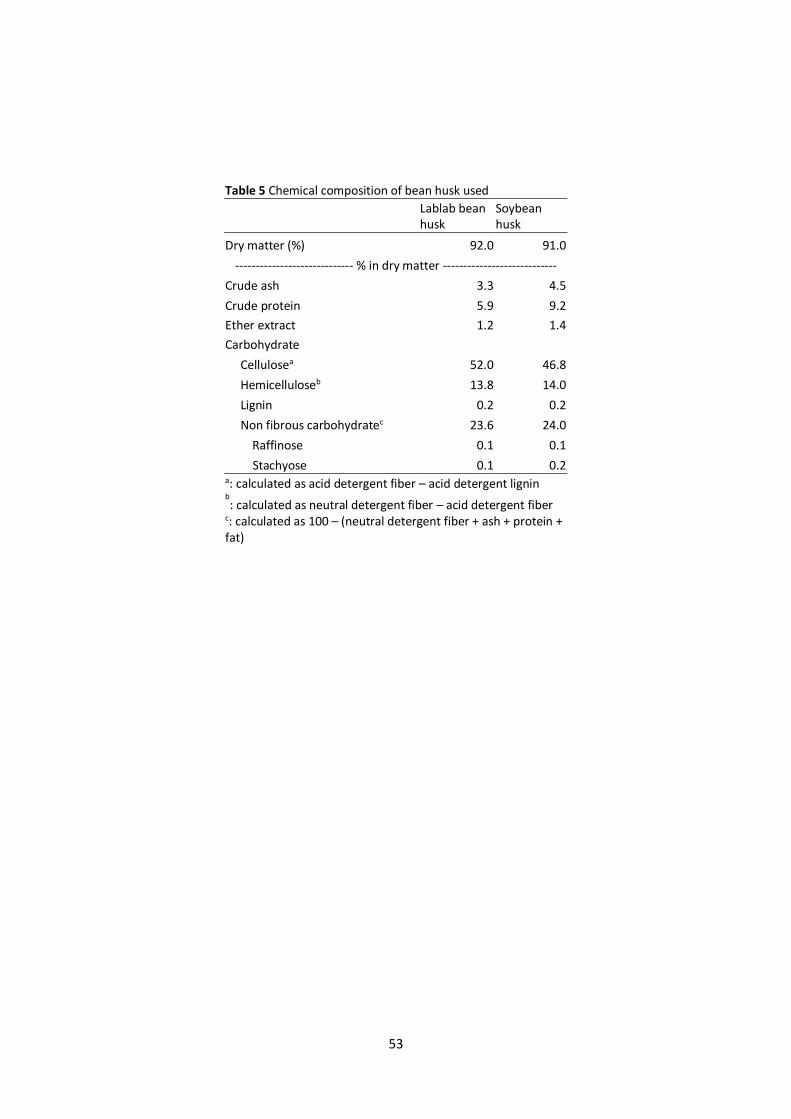
53
Table 5 Chemical composition of bean husk used
Lablab bean husk
Soybean husk
Dry matter (%) 92.0 91.0
----------------------------- % in dry matter ----------------------------
Crude ash 3.3 4.5
Crude protein 5.9 9.2
Ether extract 1.2 1.4
Carbohydrate
Cellulosea 52.0 46.8
Hemicelluloseb 13.8 14.0
Lignin 0.2 0.2
Non fibrous carbohydratec 23.6 24.0
Raffinose 0.1 0.1
Stachyose 0.1 0.2 a: calculated as acid detergent fiber – acid detergent lignin b: calculated as neutral detergent fiber – acid detergent fiber
c: calculated as 100 – (neutral detergent fiber + ash + protein + fat)

54
Standard Soya bean husk Lablab bean husk
1
2
3
4
5
6
7
9
10
S1 L1
L2
L3 S3
S2
Figure 2 Thin-layer chromatography of soluble sugars from soybean husk and lablab bean husk. L1, L2, L3, S1, S2, and S3 are prominent oligosaccharide fractions. DP: degree of polymerization
DP

55
Table 6 Growth performance and cecal fermentation products of rats fed experimental diets. (Mean ± SD)
Parameters CEL
STA
LBH
SBH
Feed intake (g) 426.8 ± 16.5 420.8 ± 8.4 459 ± 19.8 442.1 ± 27.4 Initial body weight (g) 159.3 ± 5.3 158.7 ± 6.4 159.3 ± 5.5 159.3 ± 5.1 Body weight gain (g) 153 ± 7.2 157.8 ± 24.3 170 ± 12.7 173.1 ± 11.6 Food conversion ratio (g feed/g gain) 2.7 ± 1.0 2.7 ± 1.0 2.7 ± 1.0 2.6 ± 0.9 Cecal fermentation profile
pH 7.7 ± 0.4 a 7.8 ± 0.4 a 7.3 ± 0.2 b 7.3 ± 0.2 b
Short chain fatty acid (SCFA)
Acetate (µmol/g digesta) 26.3 ± 4.4 b 27.5 ± 3.1 b 34.4 ± 2.8 a 33.8 ± 2.8 a
Propionate (µmol/g digesta) 8.4 ± 1.3 8.1 ± 5.5 9.3 ± 2.2 8.5 ± 0.4
Butyrate (µmol/g digesta) 5.9 ± 1.3 bc 4.2 ± 2.7 c 7.8 ± 0.9 ab 9.7 ± 0.6 a
Total SCFA (µmol/g digesta) 42.9 ± 6.6 b 40.5 ± 8.6 b 57.4 ± 10.2 a 54.4 ± 3.4 a
D-lactate (µmol/g digesta) 1.7 ± 2.1 3.4 ± 1.6 3.7 ± 1.1 4.0 ± 1.5
L-lactate (µmol/g digesta) 2.7 ± 1.3 b 5.4 ± 1.3 a 4.6 ± 1.1 ab 5.2 ± 1.7 a
Total lactate (µmol/g digesta) 4.4 ± 2.6 b 8.9 ± 2.5 a 8.4 ± 2.0 ab 9.2 ± 2.6 a
Succinate (µmol/g digesta) 0.1 ± 0.2 b 0.3 ± 0.5 b 1.1 ± 1.0 ab 2.1 ± 1.7 a Ammonia (µgN/g digesta) 82.1 ± 27 98.7 ± 25.4 90.1 ± 27.6 61.1 ± 39.2
Indole (µg/g digesta) 12.8 ± 3.1 bc 21.7 ± 2.5 a 11.3 ± 1.6 c 16.6 ± 2.4 ab
Skatole (µg/g digesta) 71.2 ± 24.5 b 174.3 ± 31.8 a 64.5 ± 12.3 b 94.1 ± 29.3 b
CEL (Control): AIN 93G purified diet containing 5 % cellulose, STA: negative control diet in which cellulose was replaced by corn starch, LBH: treatment diet in which cellulose was replaced by lablab bean husk, SBH: treatment diet in which cellulose was replaced by soya bean husk. a b c: Mean values within a row with superscript letters are significantly different (P < 0.05).

56
Table 7 Cecal bacterial species and groups in rats fed experimental diets analyzed by real-time PCR (Mean ± SD)
Species/group CEL
STA
LBH
SBH
Total bacteria (log copy/g digesta) 10.9 ± 0.2 11.1 ± 0.1 10.5 ± 0.1 10.5 ± 0.2 Proportion (Relative % in total bacteria)
Total lactobacilli 24.6 ± 10.7 b 27.5 ± 8.4 b 32.5 ± 7.1 ab 56.6 ± 4.3 a
Lactobacillus acidophilus 0.2 ± 0.1 b 0.2 ± 0.1 b 0.5 ± 0.1 ab 1.3 ± 0.4 a
Lactobacillus gasseri 9E-06 ± 5E-06 0.00001 ± 5E-06 0.00001 ± 1E-06 0.00001 ± 4E-06 Lactobacillus johnsonii 32.4 ± 11.1 28.5 ± 9.9 30.5 ± 7.2 41.5 ± 8.8 Lactobacillus reuteri 0.6 ± 0.3 b 0.5 ± 0.1 b 1.4 ± 0.7 ab 2.2 ± 0.8 a Faecalibacterium prausnitzii 0.1 ± 0.0 0.0 ± 0.0 0.0 ± 0.0 0.0 ± 0.0 Eubacterium hallii 0.0009 ± 0.0 0.0006 ± 0.0 0.0004 ± 0.0 0.02 ± 0.01 Total bifidobacteria 0.06 ± 0.02 0.03 ± 0.01 0.03 ± 0.01 0.01 ± 0.002 OTU 10 (Akkermansia muciniphila) 3.5 ± 1.6 b 4.1 ± 1.4 b 42.3 ± 9.4 a 15.9 ± 10.1 ab
OTU 4 (Dorea massiliensis) 3.2 ± 1.0 ab 6.9 ± 1.5 a 2.2 ± 0.2 b 1.8 ± 0.2 b OTU 5 (Oscillibacter relatives) 12.0 ± 3.5 ab 0.0 ± 0.0 b 27.5 ± 5.0 a 2.0 ± 0.5 b OTU 6 (Ruminococcus bromii) 4.2 ± 1.1 3.0 ± 0.7 4.5 ± 1.0 3.1 ± 0.8 Eschericheria coli 0.6 ± 0.5 0.7 ± 0.5 0.2 ± 0.1 0.03 ± 0.01 Bacteroidetes-Prevotella-Porphylomonus group 0.5 ± 0.4 1.3 ± 0.7 0.2 ± 0.1 0.02 ± 0.01 Clostridium coccoide-Eubacterium rectale group 10.2 ± 3.2 12.6 ± 2.8 5.0 ± 0.8 2.9 ± 1.7
CEL (Control): AIN 93G purified diet containing 5% cellulose, STA: negative control diet in which cellulose was replaced by corn starch, LBH: treatment diet in which cellulose was replaced by lablab bean husk, SBH: treatment diet in which cellulose was replaced by soybean husk. a b c: Mean values within a row with different superscript letters are significantly different (P < 0.05). OTU 4, 5, 6 and 10 refer to Fig. 3.
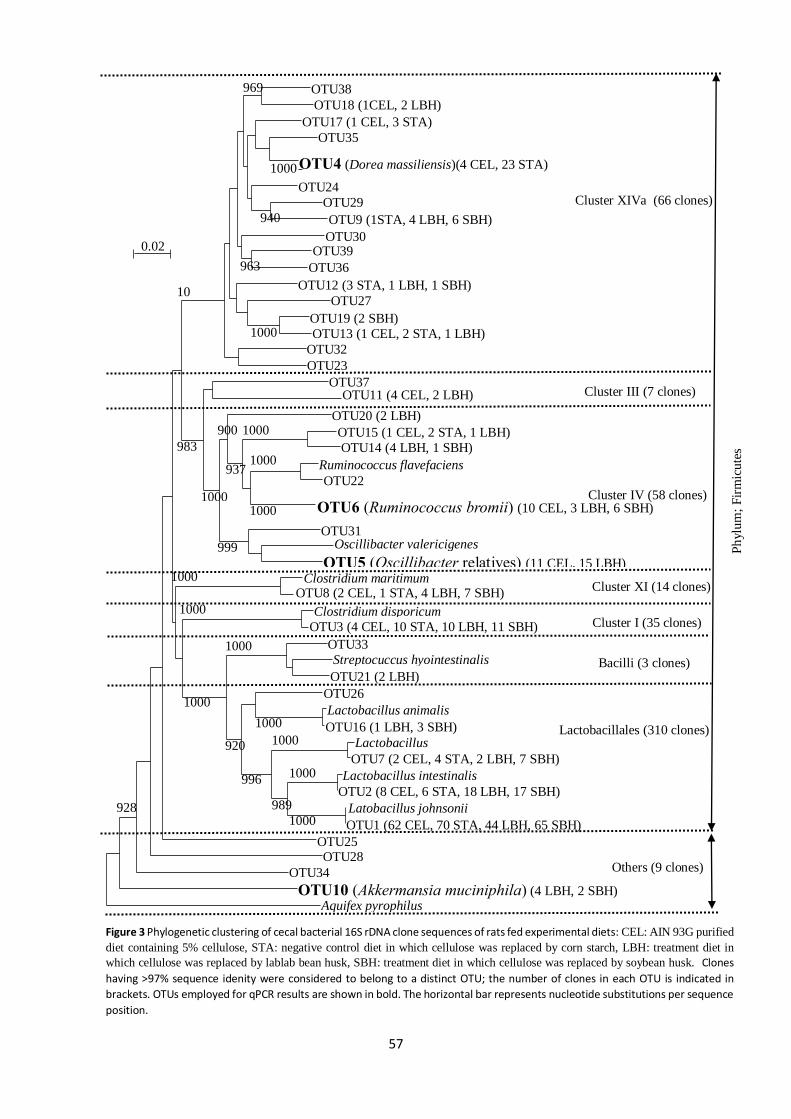
57
Aquifex pyrophilus OTU10 (Akkermansia muciniphila) (4 LBH, 2 SBH)
OTU34
OTU28 OTU25
OTU1 (62 CEL, 70 STA, 44 LBH, 65 SBH)
Latobacillus johnsonii
OTU2 (8 CEL, 6 STA, 18 LBH, 17 SBH)
Lactobacillus intestinalis
OTU7 (2 CEL, 4 STA, 2 LBH, 7 SBH)
Lactobacillus
vaginalis
OTU16 (1 LBH, 3 SBH)
Lactobacillus animalis
OTU26
OTU21 (2 LBH)
Streptocuccus hyointestinalis
OTU33
OTU3 (4 CEL, 10 STA, 10 LBH, 11 SBH)
Clostridium disporicum
OTU8 (2 CEL, 1 STA, 4 LBH, 7 SBH) Clostridium maritimum
OTU5 (Oscillibacter relatives) (11 CEL, 15 LBH)
Oscillibacter valericigenes OTU31
OTU6 (Ruminococcus bromii) (10 CEL, 3 LBH, 6 SBH)
OTU22
Ruminococcus flavefaciens
OTU14 (4 LBH, 1 SBH)
OTU15 (1 CEL, 2 STA, 1 LBH)
OTU20 (2 LBH)
OTU11 (4 CEL, 2 LBH) OTU37
OTU23
OTU32
OTU13 (1 CEL, 2 STA, 1 LBH)
OTU19 (2 SBH)
OTU27
OTU12 (3 STA, 1 LBH, 1 SBH)
OTU36
OTU39 OTU30
OTU9 (1STA, 4 LBH, 6 SBH)
OTU29
OTU24
OTU4 (Dorea massiliensis)(4 CEL, 23 STA)
OTU35
OTU17 (1 CEL, 3 STA)
OTU18 (1CEL, 2 LBH)
OTU38
1000
1000
989
1000
1000
996
920
1000
1000
1000
1000
1000
1000
1000
937
999
900
1000
1000
963
940
1000
969
983
10
00
928
0.02
Cluster XIVa (66 clones)
Cluster III (7 clones)
Cluster XI (14 clones)
Cluster IV (58 clones)
Cluster I (35 clones)
Lactobacillales (310 clones)
Others (9 clones)
Bacilli (3 clones)
Figure 3 Phylogenetic clustering of cecal bacterial 16S rDNA clone sequences of rats fed experimental diets: CEL: AIN 93G purified
diet containing 5% cellulose, STA: negative control diet in which cellulose was replaced by corn starch, LBH: treatment diet in
which cellulose was replaced by lablab bean husk, SBH: treatment diet in which cellulose was replaced by soybean husk. Clones
having >97% sequence idenity were considered to belong to a distinct OTU; the number of clones in each OTU is indicated in
brackets. OTUs employed for qPCR results are shown in bold. The horizontal bar represents nucleotide substitutions per sequence
position.
Ph
ylu
m;
Fir
mic
ute
s

58
Table 8 Biodiversity of cecal bacterial communities and relative abundance (%) of bacterial taxa at phylum and genus level in rats fed experimental diets (analyzed by MiSeq)
CEL STA LBH SBH
Alpha diversity
Chao1 857.64 1112.65 782.52 862.56
Observed species 441 603 464 508
Shannon 4.32 4.72 3.91 4.13
Phylogenetic diversity 31.18 39.44 34.03 35.16
Phylum/family/Genus
Actinobacteria 4.17 b 4.58 b 4.89 ab 7.98 a Micrococcaceae Rothia 0.45 0.58 0.9 0.66
Bifidobacteriaceae Bifidobacterium 0.15 b 0.12 b 1.65 a 2.64 a Coriobacteriaceae Unclassified 2.27 1.5 1.12 2.7
Adlercreutzia 1.26 2.3 1.16 1.85
Bacteroidetes 1.48 7.48 0.30 1.1
Bacteroidaceae Bacteroides 0.62 3.77 0.05 0.37
Porphyromonadaceae Parabacteroides 0.07 0.38 0.02 0.04 Prevotella 0 b 0 b 0.01 a 0.01 a Rikenellaceae Unclassified 0.19 ab 0.85 a 0.04 b 0.28 b S24-7 Unclassified 0.48 2.19 0.13 0.3
[Odoribacteraceae] Odoribacter 0.09 0.15 0.03 0.05
Firmicutes 88.02 a 81.69 ab 62.96 b 67.91 ab Lactobacillaceae Lactobacillus 3.93 b 6.94 b 3.67 b 13.49 a Streptococcaceae Lactococcus 0.89 1.01 0.71 0.78
Streptococcus 0.23 0.4 0.33 0.35
Turicibacteraceae Turicibacter 2.52 4.69 1.21 2.88
Unclassified Unclassified 12.62 9.22 8.81 8.01
Christensenellaceae Unclassified 0.18 0.17 0.06 0.06
Clostridiaceae Other 2.44 3.49 5.44 8.62
Unclassified 7.86 14.15 10.67 10.42
Lachnospiraceae Unclassified 5.8 2.53 1.32 1.44
Blautia 5.87 4.06 0.95 0.71
Coprococcus 0.37 0.35 0.65 0.33
Dorea 6.71 ab 15.04 a 0.91 b 3.41 b
[Ruminococcus] 0.23 0.36 0.42 0.54
Ruminococcaceae Unclassified 20.81 a 7.34 ab 14.62 ab 4.2 b
Oscillospira 0.9 2.43 1.79 1.9
Ruminococcus 10.45 4.71 9 7.73
Erysipelotrichaceae Unclassified 2.24 0.49 0.37 1.36
Allobaculum 3.23 2.54 1.61 0.91
Coprobacillus 0.21 0.27 0.01 0.32
[Eubacterium] 0.27 0.27 0 0.05
Verrucomicrobia 4.63 b 2.45 b 30.19 a 21.9 ab Verrucomicrobiaceae Akkermansia 4.63 b 2.45 b 30.19 a 21.9 ab
CEL (Control): AIN 93G purified diet containing 5% cellulose, STA: negative control diet in which cellulose was replaced by corn starch, LBH: treatment diet in which cellulose was replaced by lablab bean husk, SBH: treatment diet in which cellulose was replaced by soybean husk. a b c: Mean values within a row with superscript letters were significantly different (P < 0.05).

59
Table 9 Chemical composition of basal diets and dietary fiber supplements
items Basal commercial diet Supplemented fiber
Royal canin†
Aiken-genki†
Science diet†
Soybean husk
Cellulose#
Moisture % 10.5 10.0 10.0 9.0 7.8
-------------------- Dry matter basis --------------------
Crude protein % 29.0 23.0 25.0 9.2 nil
Ether extract % 18.0 10.0 17.0 1.4 nil
Crude ash % - 8.5 8.5 4.5 nil
Crude fiber % 6.4 4.5 3.0 47.0 100
Cellulose % - - - 46.8 100
Hemicellulose % - - - 14.0 nil
Lignin % - - - 0.2 nil
Non fibrous carbohydrate %‡ - - - 24.0 nil
Soluble fiber %§ - - - 6.1 nil
Total polyphenols (mg/g) - - - 2.0 nil
Total flavonoids (mg/g) - - - 0.9 nil
Tannin (mg/g) - - - 0.5 nil †: Nutritional facts available in products (for products, see text) are shown. ‡: Calculated as 100-(neutral detergent fiber+ash+protein+fat). §: Analyzed by dietary fiber assay kits. #: Sigma-Aldrich, Tokyo, Japan -: Not available.
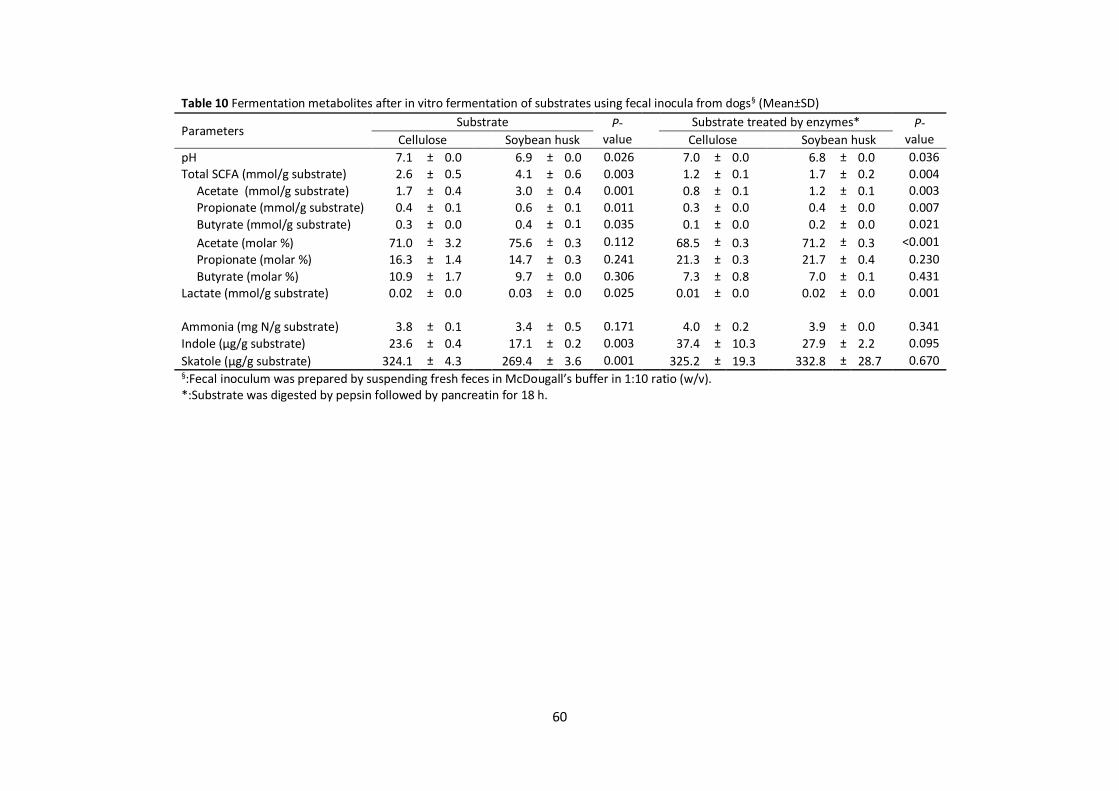
60
Table 10 Fermentation metabolites after in vitro fermentation of substrates using fecal inocula from dogs§ (Mean±SD)
Parameters Substrate P-
value Substrate treated by enzymes* P-
value Cellulose Soybean husk Cellulose Soybean husk
pH 7.1 ± 0.0 6.9 ± 0.0 0.026 7.0 ± 0.0 6.8 ± 0.0 0.036
Total SCFA (mmol/g substrate) 2.6 ± 0.5 4.1 ± 0.6 0.003 1.2 ± 0.1 1.7 ± 0.2 0.004
Acetate (mmol/g substrate) 1.7 ± 0.4 3.0 ± 0.4 0.001 0.8 ± 0.1 1.2 ± 0.1 0.003
Propionate (mmol/g substrate) 0.4 ± 0.1 0.6 ± 0.1 0.011 0.3 ± 0.0 0.4 ± 0.0 0.007
Butyrate (mmol/g substrate) 0.3 ± 0.0 0.4 ± 0.1 0.035 0.1 ± 0.0 0.2 ± 0.0 0.021
Acetate (molar %) 71.0 ± 3.2 75.6 ± 0.3 0.112 68.5 ± 0.3 71.2 ± 0.3 <0.001
Propionate (molar %) 16.3 ± 1.4 14.7 ± 0.3 0.241 21.3 ± 0.3 21.7 ± 0.4 0.230
Butyrate (molar %) 10.9 ± 1.7 9.7 ± 0.0 0.306 7.3 ± 0.8 7.0 ± 0.1 0.431
Lactate (mmol/g substrate) 0.02 ± 0.0 0.03 ± 0.0 0.025 0.01 ± 0.0 0.02 ± 0.0 0.001
Ammonia (mg N/g substrate) 3.8 ± 0.1 3.4 ± 0.5 0.171 4.0 ± 0.2 3.9 ± 0.0 0.341
Indole (µg/g substrate) 23.6 ± 0.4 17.1 ± 0.2 0.003 37.4 ± 10.3 27.9 ± 2.2 0.095
Skatole (µg/g substrate) 324.1 ± 4.3 269.4 ± 3.6 0.001 325.2 ± 19.3 332.8 ± 28.7 0.670 §:Fecal inoculum was prepared by suspending fresh feces in McDougall’s buffer in 1:10 ratio (w/v). *:Substrate was digested by pepsin followed by pancreatin for 18 h.

61
Table 11 Microbiota changes after in vitro fermentation of substrates using fecal inocula from dogs§ (Mean ± SD)
Bacteria Substrate P-
value Substrate treated by enzymes* P-
value Cellulose Soybean husk Cellulose Soybean husk
Total bacteria (Log copy/g substrate) 12.1 ± 0.0 12.0 ± 0.0 0.136 11.4 ± 0.1 11.5 ± 0.1 0.398 Proportion (Relative % in total bacteria)
Total lactobacilli 0.9 ± 0.1 0.8 ± 0.1 0.171 5.1E-05 ± 0.0 4.8E-05 ± 0.0 0.874 Total bifidobacteria 2.5 ± 0.2 4.4 ± 0.2 0.011 0.3 ± 0.0 0.6 ± 0.1 0.001 Eschericheria coli 1.5 ± 0.3 1.9 ± 0.6 0.431 3.3 ± 0.4 3.3 ± 0.2 0.860 §:Fecal inoculum was prepared by suspending fresh feces in McDougall’s buffer in 1:10 ratio (w/v). *:Substrate was digested by pepsin followed by pancreatin for 18 h.

62
Table 12 Fecal fermentation metabolites of dogs fed experimental diet (Mean±SD)
Parameters Diet supplemented with
P-value Cellulose1 Soybean husk2
pH 6.4 ± 0.6 5.9 ± 0.3 0.004
Total short chain fatty acid (µmol/g feces) 139.1 ± 28.4 158.3 ± 25.3 0.035
Acetate (µmol/g feces) 78.7 ± 14.5 91.2 ± 15.9 0.031
Propionate (µmol/g feces) 50.5 ± 14.8 54.5 ± 12.5 0.320
Butyrate (µmol/g feces) 6.8 ± 2.4 10.6 ± 2.9 <0.001
Acetate (molar %) 55.8 ± 4.9 57.6 ± 4.6 0.169
Propionate (molar %) 36.5 ± 5.7 34.7 ± 5.7 0.222
Butyrate (molar %) 5.5 ± 2.2 6.3 ± 1.7 0.063
Lactate (µmol/g feces) 13.9 ± 4.5 21.0 ± 7.4 0.007
Ammonia (µg N/g feces) 0.1 ± 0.1 0.1 ± 0.0 0.251
Indole (µg/g feces) 4.7 ± 0.7 4.1 ± 1.0 0.018
Skatole (µg/g feces) 5.2 ± 0.9 3.8 ± 1.1 0.001 1Cellulose: 170 g basal feed supplemented with 10 g cellulose was fed daily. 2Soybean husk: 170 g basal feed supplemented with 10 g soybean husk was fed daily.
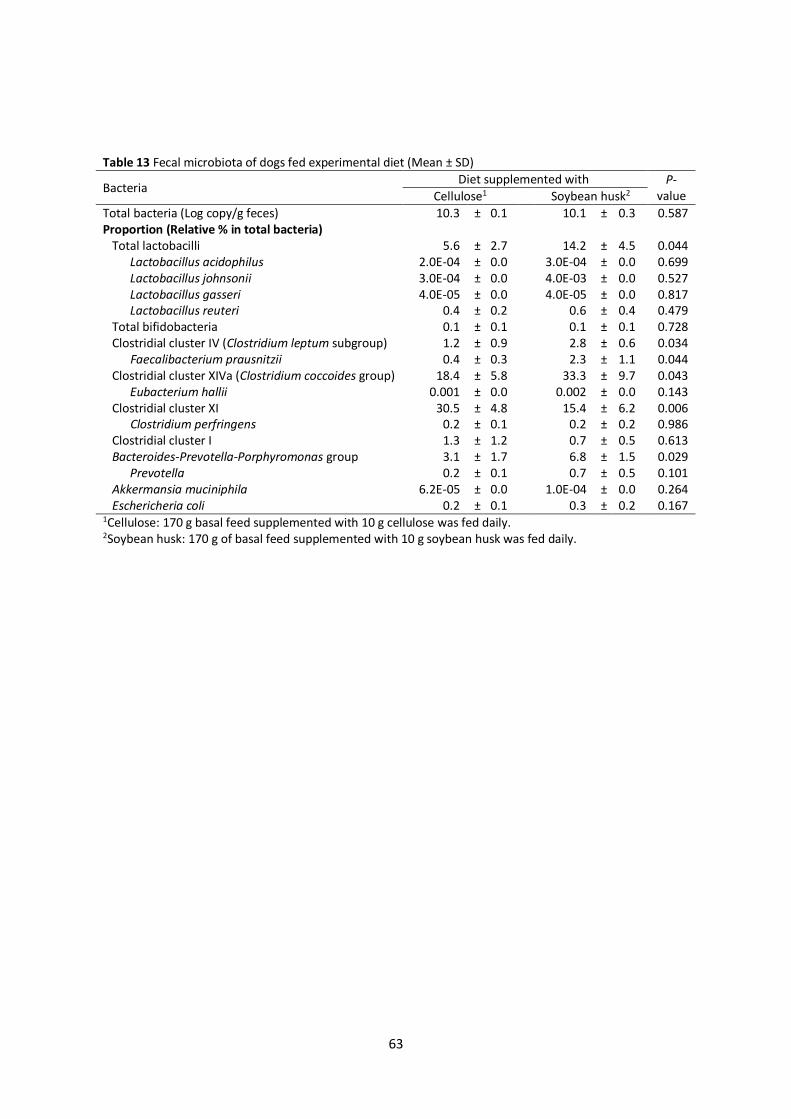
63
Table 13 Fecal microbiota of dogs fed experimental diet (Mean ± SD)
Bacteria Diet supplemented with P-
value Cellulose1 Soybean husk2
Total bacteria (Log copy/g feces) 10.3 ± 0.1 10.1 ± 0.3 0.587 Proportion (Relative % in total bacteria) Total lactobacilli 5.6 ± 2.7 14.2 ± 4.5 0.044 Lactobacillus acidophilus 2.0E-04 ± 0.0 3.0E-04 ± 0.0 0.699 Lactobacillus johnsonii 3.0E-04 ± 0.0 4.0E-03 ± 0.0 0.527 Lactobacillus gasseri 4.0E-05 ± 0.0 4.0E-05 ± 0.0 0.817 Lactobacillus reuteri 0.4 ± 0.2 0.6 ± 0.4 0.479 Total bifidobacteria 0.1 ± 0.1 0.1 ± 0.1 0.728 Clostridial cluster IV (Clostridium leptum subgroup) 1.2 ± 0.9 2.8 ± 0.6 0.034 Faecalibacterium prausnitzii 0.4 ± 0.3 2.3 ± 1.1 0.044 Clostridial cluster XIVa (Clostridium coccoides group) 18.4 ± 5.8 33.3 ± 9.7 0.043 Eubacterium hallii 0.001 ± 0.0 0.002 ± 0.0 0.143 Clostridial cluster XI 30.5 ± 4.8 15.4 ± 6.2 0.006 Clostridium perfringens 0.2 ± 0.1 0.2 ± 0.2 0.986 Clostridial cluster I 1.3 ± 1.2 0.7 ± 0.5 0.613 Bacteroides-Prevotella-Porphyromonas group 3.1 ± 1.7 6.8 ± 1.5 0.029 Prevotella 0.2 ± 0.1 0.7 ± 0.5 0.101 Akkermansia muciniphila 6.2E-05 ± 0.0 1.0E-04 ± 0.0 0.264 Eschericheria coli 0.2 ± 0.1 0.3 ± 0.2 0.167 1Cellulose: 170 g basal feed supplemented with 10 g cellulose was fed daily. 2Soybean husk: 170 g of basal feed supplemented with 10 g soybean husk was fed daily.
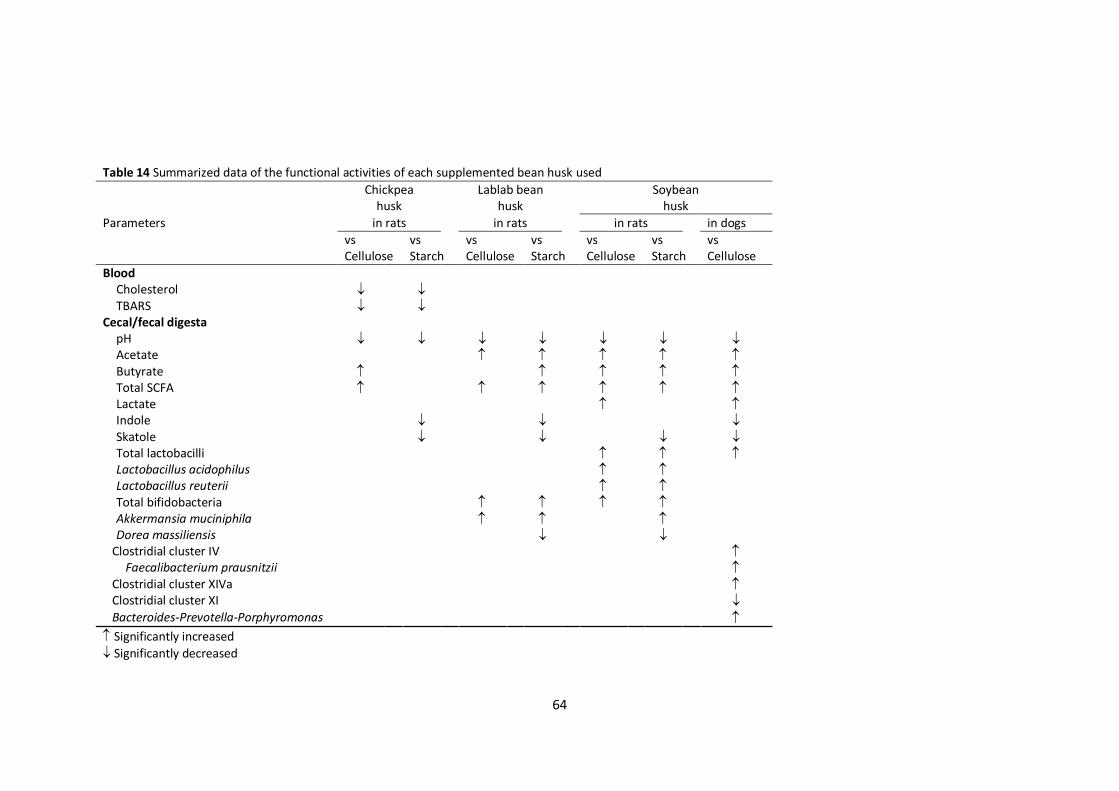
64
Table 14 Summarized data of the functional activities of each supplemented bean husk used
Parameters
Chickpea husk
Lablab bean
husk
Soybean husk
in rats in rats in rats in dogs
vs Cellulose
vs Starch
vs Cellulose
vs Starch
vs Cellulose
vs Starch
vs Cellulose
Blood Cholesterol TBARS
Cecal/fecal digesta pH Acetate Butyrate Total SCFA Lactate Indole Skatole Total lactobacilli Lactobacillus acidophilus Lactobacillus reuterii Total bifidobacteria Akkermansia muciniphila Dorea massiliensis
Clostridial cluster IV Faecalibacterium prausnitzii
Clostridial cluster XIVa Clostridial cluster XI Bacteroides-Prevotella-Porphyromonas
Significantly increased
Significantly decreased
65
References Ajila CM, Brar SK, Verma M, Tyagi RD, Godbout S, Valero JR. 2012. Bio-processing of agro-byproducts
to animal feed. Critical Reviews in Biotechnology 32, 382-400.
Al-Saiady MY. 1998. Utilization of faba bean (Ficia faba) by-products as feed ingredients for lactating
cows. Asian-australasian Journal of Animal Science 11, 255-259.
An C, Kuda T, Yazaki T, Takahashi H, Kimura B. 2013. FLX pyrosequencing analysis of the effects of the
brown-algal fermentable polysaccharides alginate and laminaran on rat cecal microbiotas. Applied and
Environmental Microbiology 79, 860–866.
Andersson KE, Axling U, Xu J, Sward K, Ahrne S, Molin G, Holm C, Hellstrand P. 2013. Diverse effects of
oats on cholesterol metabolism in C57BL/6 mice correlate with expression of hepatic bile acid-
producing enzymes. European Journal of Nutrition 52, 1755-1769.
AOAC. 1990. Official Methods of Analysis, 15th edn. Association of Official Analytical Chemistry, Virginia.
Bailon E, Cueto-Sola M, Utrilla P, Rodríguez-Cabezas ME, Garrido-Mesa N, Zarzuelo A, Xaus J, Gálvez J,
Comalada M. 2010. Butyrate in vitro immune-modulatory effects might be mediated through a
proliferation-related induction of apoptosis. Immunobiology 215, 863–873.
Basha SA, Prasada UJS. 2017. Bioactivities of fractions obtained from green gram (Vigna radiata) milled
by-products. Food Bioscience 19, 134-141.
Becker PM, van der Meulen J, Jansman AJM, van Wikselaar PG. 2012. In vitro inhibition of ETEC K88
adhesion by pea hulls and of LT enterotoxin binding by faba bean hulls. Journal of Animal Physiology
and Animal Nutrition 96, 1121-1126.
Belanche A, Doreau M, Edwards JE, Moorby JM, Pinloche E, Newbold CJ. 2012. Shifts in the rumen
microbiota due to the type of carbohydrate and level of protein ingested by dairy cattle are associated
with changes in rumen fermentation. The Journal of Nutrition 142, 1684-1692.
Beyer-Sehlmeyer G, Glei M, Hartmann E, Hughes R, Persin C, Bohm V, Rowland I, Schubert R, Jahreis
G, Pool-Zobel BL. 2003. Butyrate is only one of several growth inhibitors produced during gut flora-
mediated fermentation of dietary fiber sources. British Journal of Nutrition 90, 1057-1070.
Bora P, Kulshrestha K. 2015. Fiber rich snack food products incorporated with green gram husk and
their suitability for diabetics. Asian Journal of Dairy and Food Research 34, 300-306.
Brand-Williams W, Cuvelier ME, Berset C. 1995. Use of a free radical method to evaluate antioxidant
activity. Lebensmittel-Wissenschaft and Technologie 28, 25-30.
Brown AJ, Goldsworthy SM, Barnes AA, Eilert MM, Tcheang L, Daniels D, Muir AI, Wigglesworth MJ,
Kinghorn I, Fraser NJ, Pike NB, Strum JC, Steplewski KM, Murdock PR, Holder JC, Marshall FH, Szekeres
PG, Wilson S, Ignar DM, Foord SM, Wise A, Dowell SJ. 2003. The Orphan G protein-coupled receptors
GPR41 and GPR43 are activated by propionate and other short chain carboxylic acids. Journal of
Biology and Chemistry 278, 11312-11319.
Caporaso JG, Kuczynski J, Stombaugh J. Bittinger K. Bushman FD, Costello EK, Fierer N, Pena AG,
Goodrich JK, Gordon JI, Huttley GA, Kelley ST, Knights D, Koenig JE, Ley RE, Lozupone CA, McDonald D,
Muegge BD, Pirrung M, Reeder J, Sevinsky JR, Turnbaugh PJ, Walters WA, Widmann J, Yatsunenko T,

66
Zaneveld J, Knight R. 2010. QIIME allows analysis of high-throughput community sequencing data.
Nature Methods 7, 335-336.
Codex Alimentarius. 2010. Guidelines on nutrition labelling CAC/GL 2-1985. Joint FAO/WHO food
standards programm, secretariat of the Codex Alimentarius Commission, Rome, FAO.
Cole JT, Fahey CG, Merchen NR, Patil AR, Murray SM, Hussein HS, Brent JL Jr. 1999. Soybean hulls as a
dietary fiber source for dogs. Journal of Animal Science 77, 917-924.
Collins MD, Lawson PA, Willems A, Cordoba JJ, Fernandez-Garayzabal J, Carcia P, Cai J, Hippe H, Farrow
AE. 1994. The phylogeny of genus Clostridium: proposal of five new genera and eleven new species
combinations. International Journal of Systematic and Evolutionary Microbiology 44, 812-826.
Daglia M. 2012. Polyphenols as antimicrobial agents. Current Opinion in Biotechnology 23, 174-181.
Daguet D, Pinheiro I, Verhelst A, Possemiers S, Marzorat M. 2006. Arabinogalactan and
fructooligosaccharides improve the gut barrier function in distinct areas of the colon in the simulator
of the human intestinal microbial ecosystem. Journal of Functional Food 20, 369-379.
Dalgetty DD, Baik BK. 2003. Isolation and characterization of cotyledon fibers from peas, lentils, and
chickpea. Cereal Chemistry 80, 310-315.
Dao MC, Everard A, Aron-Wisnewsky J, Sokolovska N, Prifti E, Verger EO, kayser BD, Levenez F, Chilloux
J, Hoyles L, Consortium MO, Dumas ME, Rizkalla SW, Dore J, Cani PD, Clement K. 2016. Akkermansia
muciniphila and improved metabolic health during a dietary intervention in obesity: relationship with
gut microbiome richness and ecology. Gut 65, 429-436.
Dewanto X, Wu K, Adom K, Liu RH. 2002. Thermal processing enhances the nutritional value of
tomatoes by increasing total antioxidant activity. Journal of Agricultural and Food Chemistry 50, 3010-
3014.
Dinoto A, Suksomcheep A, Ishizuka S, Kimura H, Hanada S, Kamagata Y. Asano K, Tomita F, Yokota A.
2006. Modulation of rat cecal microbiota by administration of raffinose and encapsulated
Bifidobacterium breve. Applied and Environmental Microbiology 72, 784-792.
Dommels YE, Kemperman RA, Zebregs YEMP, Draaisma RB, Jol A, Wolvers DAW, Vaughan EE, Albers
R. 2009. Survival of Lactobacillus reuteri DSM17938 and Lactobacillus rhamnosus GG in the human
gastrointestinal tract with daily consumption of a low-fat probiotic spread. Applied and Environmental
Microbiology 75, 27-42.
DuBois M, Gilles K, Hamilton J, Rebers PA, Smith F. 1956. Colorimetric method for determination of
sugars and related substances. Analytical Chemistry 28, 350-356.
Duncan SH, Louis P, Flint HJ. 2004. Lactate-utilizing bacteria, isolated from human feces that produce
butyrate as a major fermentation product. Applied and Environmental Microbiology 70, 5810-5817.
Espin JC, Gonzalez-Sarrias A, Tomas-Barberan FA. 2017. The gut microbiota: a key factor in the
therapeutic effects of (poly)phenols. Biochemical Pharmacology 139, 82-93.
Everard A, Belzer C, Geurts L, Ouwerkerk JP, Druart C, Bindels LB, Guiot Y, Derrien M, Muccioli GG,
Delzenne NM, de Vos WM, Cani PD. 2013. Crosstalk between Akkermansia muciniphila and intestinal
epithelium controls diet-induced obesity. Proceedings of National Academy of Sciences of the USA 110,
9067-9071.

67
Everard A, Lazarevic V, Derrien M, Girard M, Muccioli GG, Neyrinck AM, Possemiers S, Van Holle A,
Francois P, de Vos WM, Delzenne NM, Schrenzel J, Cani PD. 2011. Responses of gut microbiota and
glucose and lipid metabolism to prebiotics in genetic obese and diet-induced leptin-resistant mice.
Diabetes 60, 2775-2786.
Fan PH, Zang MT, Xing J. 2015. Oligosaccharides composition in eight food legumes species as detected
by high resolution mass spectrometry. Journal of the Science of Food and Agriculture 95, 2228-2236.
FAOSTATS. 2014. http://faostat3.fao.org/browse/Q/QC/E (accessed on December, 2017).
Fechner A, Kiehntopf M, Jahreis G. 2014. The formation of short-chain fatty acids is positively
associated with the blood lipid-lowering effect of lupin kernel fiber in moderately
hypercholesterolemic adults. The Journal of Nutrition 144, 599-607.
Fuma R, Oyaizu S, Nukui Y, Ngwe T, Shinkai T, Koike S, Kobayashi Y. 2012. Use of bean husk as an easily
digestible fiber source for activating the fibrolytic rumen bacterium Fibrobacter succinogenes and rice
straw digestion. Animal Science Journal 83, 696-703.
Furet JP, Quenee P, Tailliez P. 2004. Molecular quantification of lactic acid bacteria in fermented milk
products using real-time quantitative PCR. International Journal of Food Microbiology 97, 197-207.
Ganesan K, Xu B. 2017. A critical review on polyphenols and health benefits of black soybeans.
Nutrients 9, 455-461.
Garcia-Mazcorro JD, Dowd SE, Poulsen J, Steiner JM, Suchodolski JS. 2012. Abundance and short-term
temporal variability of fecal microbiota in healthy dogs. Microbiology Open 1, 340–347.
Gibson GR, Roberfroid MB. 1995. Dietary modulation of the human colonic microbiota: Introducing
the concept of prebiotics. The Journal of Nutrition 125, 1401-1412.
Girish TK, Padmaraju V, Ummiti JS, Prasada R. 2012. Protection of DNA and erythrocytes from free
radical induced oxidative damage by black gram (Vigna mungo L.) husk extract. Food Chemistry and
Toxicology 50, 1690-1696.
Gnanasambandam R, Proctor A. 1999. Preparation of soy hull pectin. Food Chemistry 65, 461–467.
Goering HK, Van Soest PJ. 1975. Forage Fiber Analysis. Agricultural Research Service. Agricultural
handbook No. 379. US Department of Agriculture, Washington.
Grzeskowiak L, Endo A, Beasley S, Salminen S. 2015. Microbiota and probiotics in canine and feline
welfare. Anaerobe 34, 14-23.
Gu S, Chen D, Zhang JN, Lv X, Wang K, Duan LP, Nie Y, Wu XL. 2013. Bacterial community mapping of
the mouse gastrointestinal tract. PLoS ONE 8, e74957.
Guillon F, Champ MJ. 2002. Carbohydrate fractions of legumes: uses in human nutrition and potential
for health. British Journal of Nutrition 88, 293–306.
Gulewicz P, Szymaniec S, Bubak B, Frias J, Vidal-Valverde C, Trojanowska K. Gulewicz K. 2002. Biological
activity of –galactoside preparations from Lupinus angustifolius L and Pisum sativum L. seeds. Journal
of Agricultural and Food Chemistry 50, 384-389.
Gunness P, Williams BA, Gerrits WJJ, Bird AR, Kravchuk O. Gidley MJ. 2016. Circulating triglycerides
and bile acids are reduced by a soluble wheat arabinoxylan via modulation of bile concentration and
lipid digestion rates in a pig model. Molecular Nutrition and Food Research 60, 642-651.
68
Guo W, Shu Y, Yang X. 2016. Tea dietary fiber improves serum and hepatic lipid profiles in mice fed a
high cholesterol diet. Plant Foods and Human Nutrition 71, 145-150.
Haarman M, Knol J. 2006. Quantitative real-time PCR analysis of fecal Lactobacillus species in infants
receiving a prebiotic infant formula. Applied and Environmental Microbiology 72, 2359-2365.
Heilig HGHJ, Zoetendal EG, Vaughan EE, Marteau P, Akkermans ADL, de Vos WM. 2002. Molecular
diversity of Lactobacillus spp. and other lactic acid bacteria in the human intestine as determined by
specific amplification of 16S ribosomal DNA. Applied and Environmental Microbiology 68, 1114-1123.
Herlemann DP, Labrenz M, Jurgens, K, Bertilsson S, Waniek JJ, Andersson AF. 2011. Transitions in
bacterial communities along the 2000 km salinity gradient of the Baltic Sea. The ISME Journal 5, 1571–
1579.
Hinnebusch BF, Meng S, Wu JT, Archer SY, Hodin RA. 2002. The effects of short-chain fatty acids on
human colon cancer cell phenotype are associated with histone hyperacetylation. The Journal of
Nutrition 132, 1012-1017.
Hong YH, Nishimura Y, Hishikawa D, Tsuzuki H, Miyahara H, Gotoh C, Choi KC, Feng DD, Chen C, Lee
HG, Katoh K, Roh SG, Sasaki S. 2005. Acetate and propionate short chain fatty acids stimulate
adipogenesis via GPCR43. Endocrinology 146, 5092-5099.
Hooda S, Boler BM, Serao MC, Brulc JM, Staeger MA, Boileau TW, Dowd SE, Fahey Jr GC, Swanson KS.
2012. 454-pyrosequencing reveals a shift in fecal microbiota of healthy adult men consuming
polydextrose or soluble corn fiber. The Journal of Nutrition 142, 1259-1265.
Hosseini E, Grootaert C, Verstraete W, de Wiele V. 2011. Propionate as a health-promoting microbial
metabolite in the human gut. Nutrition Reviews 69, 245-258.
Htay KM , Moe TH, Khin SM, Aung A, Htin NN, Ngwe T. 2014. The study of the different bean husks as
the easily digestible fiber source on in vitro gas production of rice straw, urea-treated rice straw and
Napier grass. Myanmar Veterinary Journal 16, 113-124.
Hussein MMD, Helmy WA, Salem HM. 1998. Biological activities of some galactomannan and their
sulfated derivatives. Phytochemistry 48, 479–484.
Ipharraguerre IR, Clark JH. 2003. Soyhulls as an alternative feed for lactating dairy cows: A review.
Journal of Dairy Science 86, 1052-1073.
Ivarsson E, Roos S, Liu HY, Lindberg JE. 2014. Fermentable non-starch polysaccharides increases the
abundance of Bacteroides-Prevotella-Porphyromonas in ileal microbial community of growing pigs.
Animal 8, 1777-1787.
Jakobsdottir G, Xu J, Molin g, Ahrne S, Byman M. 2013. High-fat diet reduces the formation of butyrate,
but increases succinate, inflammation, liver fat and cholesterol in rats, while dietary fiber counteracts
these effects. PLoS One 8, e80476.
Jan G, Belzacq AS, Haouzi D, Rouault A, Métivier D, Kroemer G, Brenner C. 2002. Propionibacteria
induce apoptosis of colorectal carcinoma cells via short-chain fatty acids acting on mitochondria. Cell
Death and Differentiation 9, 179-188.
Jansman AJM, van der Meulen J. 2010. Response of weaned piglets to a challenge with enterotoxigenic
Escherichia coli (ETEC) when fed diets with pea or pea fractions. Livestock Science 133, 229-231.
69
Jha R, Berrocoso JFD. 2016. Dietary fiber and protein fermentation in the intestine of swine and their
interactive effects on gut health and on the environment: A review. Animal Feed Science and
Technology 212, 18-26.
Jha R, Bindelle J, van Kessel A, Leterme P. 2011. In vitro fiber fermentation of feed ingredients with
varying fermentable carbohhdrate and protein levels and protein synthesis by colonic bacteria isolated
from pigs. Animal Feed Science and Technology 165, 191-200.
Jha R, Leterme P. 2012. Feed ingredients differing in fermentable fiber and indigestible protein content
affect fermentation metabolites and fecal nitrogen excretion in growing pigs. Animal 6, 603-611.
Jurgonski A, Juskiewicz J, Zdunczyk Z, Matusevicius P, Kolodziejczyk K. 2014. Polyphenol-rich extract
from blackcurrant pomace attenuates the intestinal tract and serum lipid changes induced by a high-
fat diet in rabbits. European Journal of Nutrition 53, 1603-1613.
Kanatt SR, Arjun K, Sharma A. 2011. Antioxidant and antimicrobial activity of legume hulls. Food
Research International 44, 3182-3187.
Karatas SC, Gunay D, Sayar S. 2017. In vitro evaluation of whole faba bean and its seed coat as a
potential source of functional food components. Food Chemistry 230, 182-188.
Karr-Lilienthal LK, Kadzere CT, Grieshop CM, Fahey Jr GC. 2005. Chemical and nutritional properties
of soybean carbohydrates as related to nonruminants: A review. Livestock Production Science 97, 1-
12.
Koike S, Yabuki H, Kobayashi Y. 2007. Validation and application of real-time polymerase chain
reaction assays for representative rumen bacteria. Animal Science Journal 78, 135-141.
Kok RG, de Waal A, Schut F, Welling GW, Weenk G, Hellingwerf KJ. .1996. Specific detection and
analysis of a probiotic Bifidobacterium strain in infant feces. Applied and Environmental Microbiology
62, 3668-3672.
Kosmala M, Zdunczyk Z, Karlinska E, Juskiewicz J. 2014. The effects of strawberry, black currant, and
chokeberry extracts in a grain dietary fiber matrix on intestinal fermentation in rats. Food Research
International 64, 752-761.
Lai FR, Wen QBA, Li L, Wu H, Li XF. 2010. Antioxidant activities of water-soluble polysaccharide
extracted from mung bean (Vigna radiate L.) hull with ultrasonic assisted treatment. Carbohydrate
Polymers 81, 323-329.
Le Goff A, Renard CMGC, Bonnin E, Thibault JF. 2001. Extraction, purification and chemical
characterization of xylogalacturonans from pea hulls. Carbohydrate Polymers 45, 325-334.
Liu C, Lin XL, Wan Z, Zou Y, Cheng FF, Yang XQ. 2016. The physicochemical properties, in vitro binding
capacities and in vivo hypocholesterolemic activity of soluble dietary fiber extracted from soy hulls.
Food and Function 7, 4830-4840.
Luhrs H, Gerke T, Müller JG, Melcher R, Schauber J, Boxberge F, Scheppach W, Menzel T. 2002.
Butyrate inhibits NF-kappaB activation in lamina propria macrophages of patients with ulcerative
colitis. Scandinavian Journal of Gastroenterology 37, 458–466.
Luo Y, Chen H, Yu B, He J, Zheng P, Mao X, Yu J. Luo J, Huang Z, Chen D. 2017. Dietary pea fiber alters
the microbial community and fermentation with increase in fiber degradation-associated bacterial

70
groups in the colon of pigs. Journal of Animal Physiology and Animal Nutrition 00, 1-8. Doi:
10.1111/jpn.12736.
Madhukumar MS, Muralikrishna G. 2012. Fermentation of xylo-oligosaccharides obtained from wheat
bran and Bengal gram husk by lactic acid bacteria and bifidobacteria. Journal of Food Science and
Technology 49, 745-752.
Makkar HPS, Blummel M, Borowy NK, Becker K. 1993. Gravimetric determination of tannins and their
correlations with chemical and protein precipitation methods. Journal of the Science of Food and
Agriculture 61, 161-165.
Malinen E, Kassinen A, Rinttila T, Palva A. 2003. Comparison of real-time PCR with SYBR green I or 5′-
nuclease assays and dot-blot hybridization with rDNA-targeted oligonucleotide probes in
quantification of selected fecal bacteria. Microbiology 149, 269-277.
Mallillin AC, Trinidad TP, Raterta R, Dagbay K, Loyola AS. 2008. Dietary fiber and fermentability
characteristics of root crops and legumes. British Journal of Nutrition 100, 485-488.
Marin L, Miguelez EM, Villar CJ, Lombo F. 2015. Bioavailability of dietary polyphenols and gut
microbiota metabolism: Antimicrobial properties. BioMed Research International Article ID 905215,
doi:10.1155/2015/905215.
Marlett JA, McBurney MI, Slavin JL. 2002. Position of the American Dietetic Association: health
implications of dietary fiber. Journal of American Dietetic Association 102, 993-1000.
Martinez-Villaluenga C, Frias J, Vidal-Valverde C. 2005. Raffinose family oligosaccharides and sucrose
contents in 13 Spanish lupin cultivars. Food Chemistry 91, 645-649.
Matsuki T, Watanabe K, Fujimoto J, Takada T, Tanaka R. 2002. Development of 16S rRNA gene-
targeted groups specific primers for the detection and identification of predominant bacterial in
human feces. Applied and Environmental Microbiology 68, 544–5451.
Matsuki T, Watanabe K, Fujimoto J, Takada T. Tanaka R. 2004. Use of 16S rRNA gene-targeted group-
specific primers for real-time PCR analysis of predominant bacteria in human feces. Applied and
Environmental Microbiology 70, 7220–7228.
McDougall EJ. 1948. Studies on ruminant saliva. 1. The composition and output of sheep’s saliva.
Biochemical Journal 43, 99-109.
Mirali M, Purves RW, Vandenberg A. 2017. Profiling the phenolic compounds of the four major seed
coat types and their relation to color genes in lentil. Journal of Natural Products 80, 1310-1317.
Mittal G, Vadhera S, Brar APS, Soni G. 2009. Protective role of chickpea seed coat fiber on N-
nitrosodiethylamine-induce toxicity in hypercholsesterolemic rats. Experimental Toxicologic
Pathology 61, 363-370.
Monsoor MA. 2005. Effect of drying methods on the functional properties of soy hull pectin.
Carbohydrate Polymers 61, 362-367.
Mullin WJ, Xu W. 2001. Study of soybean seed coat components and their relationship to water
absorption. Journal of Agricultural and Food Chemistry 49, 5331-5335.
Muralikrishna G and Tharanathan RN. 1994. Characterization of pectic polysaccharides from pulse
husks. Food Chemistry 50, 87-89.

71
Muyzer G, Brinkhoff T, Nubel U, Santegoeds C, Schafer H, Wawer C. 1998. Denaturing gradient gel
electrophoresis (DGGE) in microbial ecology. In: A Akkermars, J D Van Elsas, F de Bruijn (eds) Molecular
microbial ecology manual, vol 3.4.4. Kluwer Academic Publishers, Boston, pp 1-27.
Muyzer G, De Waal EC, Uitterlinden AG. 1993. Profiling of complex microbial populations by
denaturing gradient gel electrophoresis analysis of polymerase chain reaction-amplified genes coding
for 16S rRNA. Applied and Environmental Microbiology 59, 3695-3700.
Ngwe T, Nukui Y, Oyaizu S, Takamoto G, Koike S, Ueda K, Nakatsuji H, Kondo S, Kobayashi Y. 2012.
Bean husks as a supplemental fiber for ruminants: potential use for activation of fibrolytic rumen
bacteria to improve main forage digestion. Animal Science Journal 83, 43-49.
Ono S, Karaki S, Kuwahara A. 2004. Short-chain fatty acids decrease the frequency of spontaneous
contractions of longitudinal muscle via enteric nerves in rat distal colon. Japanese Journal of
Physiology 54, 483-93.
Pan Q, Zeng X, Pan D, Peng L. Wu Z, Sun Y, Wei Y. 2017. The proliferation mechanism of Lactobacillus
plantarum RBi stimulated by stachyose. Current Microbiology 74, 732-738.
Panasevich MR, Rossoni Serao MC, de Godoy MRC, Swanson KS, Guerin-Deremaux L, Lynch L, Wils d,
Fahey GC, Dilger RN. 2013. Potato fiber as a dietary fiber source in dog foods. Journal of Animal Science
91, 5344-5352.
Pascoal LAF, Thomaz MC, Watanabe PH, Ruiz US, Amorim AB, Daniel E, da Silva SZ. 2015. Purified
cellulose, soybean hulls and citrus pulp as a source of fiber for weaned piglets. Scientia Agricola 72,
400-410.
Png CW, Linden SK, Gilshenan KS, Zoetendal EG, McSweeney CS, Sly LI, Mc Guckin MA, Florin TH. 2010.
Mucolytic bacteria with increased prevalence in IBD mucosa augment in vitro utilization of mucin by
other bacteria. American Journal of Gastroenterology 105, 2420-2428.
Pozuelo MJ, Agis-Torres A, Hervert-Hernandez D, Lopez-Oliva E, Munoz-Martinez E, Rotger R, Goni I.
2012. Grape antioxidant dietary fiber stimulates Lactobacillus growth in rat cecum. Journal of Food
Science 77, 59-62.
Price ML, Van Scoyoc S, Butler LG. 1978. A critical evaluation of the Vanillin reaction as an assay for
tannin in sorghum grain. Journal of Agricultural and Food Chemistry 26, 1214-1218.
Rajilic-Stojanovic M, Biagi E, Heilig HGHJ, Kajander K, Kekkonen RA, Tims S, de Vos WM. 2011. Global
and deep molecular analysis of microbiota signatures in fecal samples from patients with irritable
bowel syndrome. Gastroenterology 141, 1792-1801.
Ramirez CF, Slezak K, Fuller Z, Duncan A, Holtrop G, Louis P. 2009. Effect of inulin on the human gut
microbiota: stimulation of Bifidobacterium adolescentis and Fecalibacterium prausnitzii. British
Journal of Nutrition 101, 541-550.
Rechner A, Smith MA, Kuhnle G, Gibson GR, Debnam ES, Stai SK, Moore KP, Rice-Evans CA. 2004.
Colonic metabolism of dietary polyphenols: influence of structure on microbial fermentation products.
Free Radical Biology and Medicine 36, 212-225.
Renard CMGC, Weightman RM, Thibault JF. 1997. The xylose-rich pectins from pea hulls. International
Journal of Biological Macromolecules 21, 155-162.

72
Rinttila T, Kassinen A, Malinen E, Krogius L, Palva A. 2004. Development of an extensive set of 16S
rDNA-targeted primers for quantification of pathogenic and indigenous bacteria in fecal samples by
real-time PCR. Journal of Applied Microbiology 97, 1166-1177.
Sabchuk, TT, Silva JR, Marx FO, Felix AP, Maiorka A, Oliveira SG. 2014. Effect of feeding frequency of a
diet containing soya hulls on the food intake and behaviour of dogs. Journal of Nutritional Science 3,
doi: 10.1017/jns.2014.34.
Saito Y, Takano T, Rowland I. 1992. Effects of soybean oligosaccharides on the human gut microflora
in In vitro culture. Microbial Ecology in Health and Disease 5, 105-110.
Santacruz A, Collado MC, Garcia-Valdes L, Segura MT, Martin-Lagos JA, Anjos T, Marti- Romero M,
Lopez RM, Florido J, Campoy C, Sanz Y. 2010. Gut microbiota composition is associated with body
weight, weight gain and biochemical parameters in pregnant women. British Journal of Nutrition 104,
83-92.
Schloss PD, Westcott SL, Ryabin T, Hall JR, Hartmann M, Hollister EB, Lesniewski RA, Oakley BB, Parks
DH, Robinson CJ, Sahl JW, Stres B, Thallinger GG, van Horn DJ, Weber CF. 2009. Introducing mothur:
open-source, platform-independent, community-supported software for describing and comparing
microbial communities. Applied and Environmental Microbiology 75, 7537-7541.
Simpson JM, Martineau B, Jones WE, Ballam JM, Mackie RI. 2002. Characterization of fecal bacterial
populations in canines: Effects of age, breed and dietary fiber. Microbial Ecology 44, 186-197.
Slavin J. 2013. Fiber and prebiotics: Mechanisms and Health Benefits. Nutrients 5, 1417-1435.
Song Y, Liu C, Finefold SM. 2004. Real-time PCR quantitation of Clostridia in feces of autistic children.
Applied and Environmental Microbiology 70, 6459-6465.
Song YL, Kato N, Liu CX, Matsumiya Y, Kato H, Watanabe K. 2000. Rapid identification of 11 human
intestinal Lactobacillus species by multiplex PCR assays using group- and species-specific primers
derived from the 16S-23S rRNA intergenic spacer region and its flanking 23S rRNA. FEMS Microbiology
Letters 187, 167-173.
Sreerama YN, Neelam DA, Sashikala VB, Pratape VM. 2010a. Distribution of nutrients and antinutrients
in milled fractions of chickpea and horse gram: seed coat phenolics and their distinct modes of enzyme
inhibition. Journal of Agricultural and Food Chemistry 58, 4322-4330.
Sreerama YN, Sashikala VB, Pratape VM. 2010b. Variability in the distribution of phenolic compounds
in milled fractions of chickpea and horse gram: Evaluation of their antioxidant properties. Journal of
Agricultural and Food Chemistry 58, 8322-8330.
Sreerangaraju G, Krishnamoorthy U, Kailas MM. 2000. Evaluation of Bengal gram (Cicer arietinum)
husk as a source of tannin and its interference in rumen and post-rumen nutrient digestion in sheep.
Animal Feed Science and Technology 85, 131-138.
Suchodolski JS, Markel ME, Garcia-Mazcorro JF, Unterer S, Heilmann RM, Dowd SE, Kachroo P, Ivanov
I, Minamoto Y, Dillman EM, Steiner JM, Cook AK, Toresson L. 2012. The fecal microbiome in dogs with
acute diarrhea and idiopathic inflammatory bowel disease. PLoS ONE 7, e51907.
Suto T. 1973. Examination of the rumen. In: Nakamura R, Yonemura T, Suto T (eds), Methods in the
clinical examination of the bovine, pp. 39-42. Nosan Gyoson Bunka Kyokai, Tokyo.

73
Teixeira JS, McNeill V, Ganzle MG. 2012. Levansucrase and sucrose phoshorylase contribute to
raffinose, stachyose, and verbascose metabolism by lactobacilli. Food Microbiology 31, 278-284.
Urias-Orona V, Huerta-Oros J, Carvajal-Millan C, Lizardi-Mendoza J, Rascon-Chu A, Gardea AA. 2010.
Component analysis and free radicals scavenging activity of Cicer arietinum L. husk pectin. Molecules
15, 6948-6955.
Van Baarlen P, Wells JM, Kleerebezem M. 2013. Regulation of intestinal homeostasis and immunity
with probiotic lactobacilli. Trends in Immunology 34, 208-215.
Van der Meulen J, Panneman H, Jansman AJM. 2010. Effect of pea, pea hulls, faba beans and faba
bean hulls on the ileal microbial composition in weaned piglets. Livestock Science 133, 135-137.
Walker AW, Ince J, Duncan SH, Webster LM, Holtrop G, Ze X, Brown D, Stares MD, Scott P, Bergerat A,
Louis P, Mclntosh F, Johnstone AM, Lobley GE, Parkhill J, Flint HJ. 2011. Dominant and diet responsive
groups of bacteria within the human colonic microbiota. The ISME Journal 5, 220-230.
Walstra P, Claudi-Magnussen C, Chevillon P, von Seth G, Diestre A, Matthews R, Homer DB, Bonneau
M. 1999. An international study on the importance of androstenone and skatole for boar taint: levels
of androstenone and skatole by country and season. Livestock Production Science 82, 15–28.
Walter J, Hertel C, Tannock GW, Lis CM, Munro K, Hammes WP. 2001. Detection of Lactobacillus,
Pediococcus, Leuconostoc, and Weissella species in human feces by using group-specific PCR primers
and denaturing gradient gel electrophoresis. Applied and Environmental Microbiology 67, 2578-2585.
Wang RF, Cao WW, Franklin W, Campbell W, Cerniglia CE. 1994. A 16S rDNA-based PCR method for
rapid and specific detection of Clostridium perfringens in food. Molecular and Cellular Probes 8, 131-
137.
Wang Y, Chen Y, Cho J, Yoo JS, Huang Y, Kim HJ, Shin SO, Zhou TX, Kim IH. 2009. Effect of soybean hull
supplementation to finishing pigs on the emission of noxious gases from slurry. Animal Science Journal
80, 316-321.
Weatherburn M W. 1967. Phenol-hypochlorite reaction for determination of ammonia. Analytical
Chemistry 39, 971-974.
Williams BA, Grant LJ, Gidley MJ, Mikkelsen D. 2017. Gut fermentation of dietary fibers: Physico-
chemistry of plant cell walls and implications for health. International Journal of Molecular Science 18,
2203-2228.
Windey K, Preter D, Verbeke K. 2012. Relevance of protein fermentation to intestinal health.
Molecular Nutrition and Food Research 56, 184-196.
Xiong Y, Miyamoto N, Shibata K, Valasek MA, Motoike T, Kedzierski RM, Yanagisawa M. 2004. Short-
chain fatty acids stimulate leptin production in adipocytes through the G protein-coupled receptor
GPR41. Proceeding of National Academy of Science USA 101, 1045-4050.
Xu ZR, Hu CH, Wang MQ. 2002. Effects of fructooligosaccharide on conversion of l-tryptophan to
skatole and indole by mixed populations of pig fecal bacteria. The Journal of General and Applied
Microbiology 48, 83-89.
Yang J, Xiao a, wang C. 2014. Novel development and characterisation of dietary fiber from yellow
soybean hulls. Food Chemistry 161, 367-375.
74
Yu Z, Morrison M. 2004. Improved extraction of PCR-quality community DNA from digesta and fecal
samples. BioTechniques 36, 808-812.
Zhang RF, Zhang FX, Zhang MW, Wei ZC, Yang CY, Zhang Y, Tang XJ, Deng YY, Chi JW. 2011. Phenolic
composition and antioxidant activity in seed coats of 60 Chinese black soybean (Glycine max L. Merr.)
varieties. Journal of Agricultural and Food Chemistry 59, 5935-5944.
Zou B, Ge Z, Zhang Y, Du Jing, Xu Z, Li C. 2014. Persimmon tannin accounts for hypolipidemic effects
of persimmon through activating of AMPK and suppressing NF-kB activation and inflammatory
responses in high-fat diet rats. Food and Function 5, 1536-1546.