Embed Size (px)
Citation preview
Functional diversity exhibits a diverse relationship with area,
even a decreasing one.
Elpida K. Karadimou, Athanasios S. Kallimanis, Ioannis Tsiripidis and
Panayotis Dimopoulos
Supplementary information
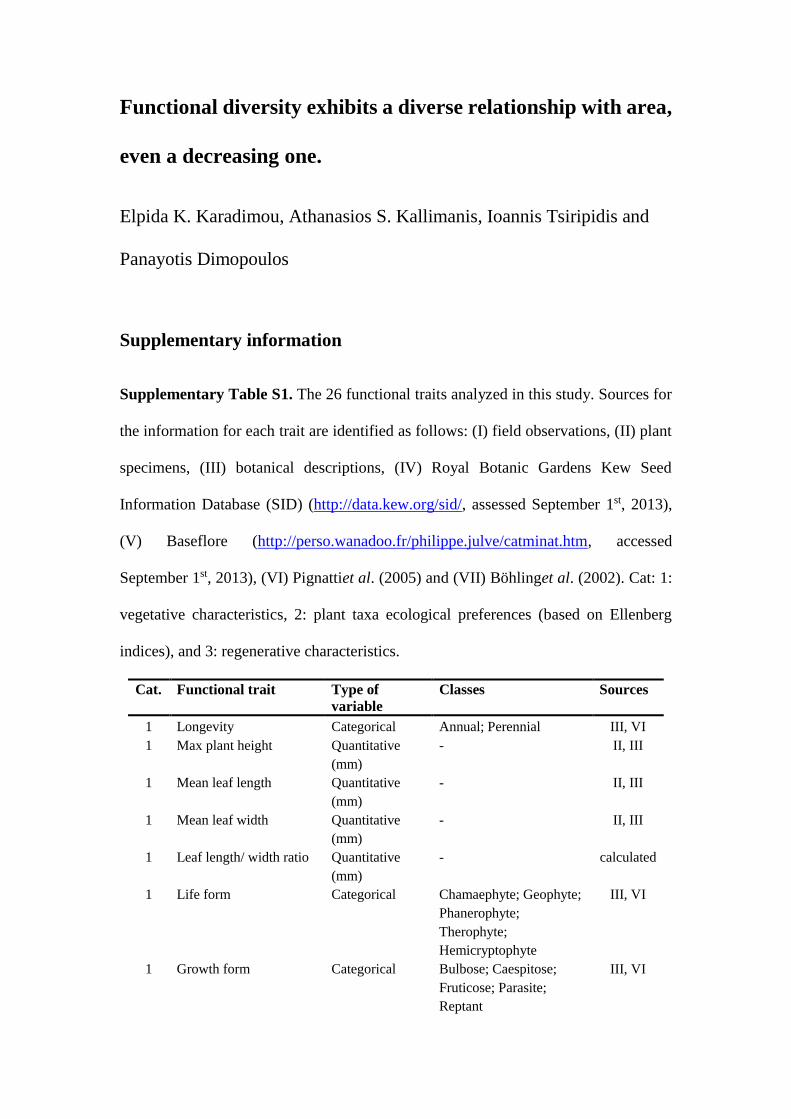
Supplementary Table S1. The 26 functional traits analyzed in this study. Sources for
the information for each trait are identified as follows: (I) field observations, (II) plant
specimens, (III) botanical descriptions, (IV) Royal Botanic Gardens Kew Seed
Information Database (SID) (http://data.kew.org/sid/, assessed September 1st, 2013),
(V) Baseflore (http://perso.wanadoo.fr/philippe.julve/catminat.htm, accessed
September 1st, 2013), (VI) Pignattiet al. (2005) and (VII) Böhlinget al. (2002). Cat: 1:
vegetative characteristics, 2: plant taxa ecological preferences (based on Ellenberg
indices), and 3: regenerative characteristics.
Cat. Functional trait Type of
variable
Classes Sources
1 Longevity Categorical Annual; Perennial III, VI
1 Max plant height Quantitative
(mm)
- II, III
1 Mean leaf length Quantitative
(mm)
- II, III
1 Mean leaf width Quantitative
(mm)
- II, III
1 Leaf length/ width ratio Quantitative
(mm)
- calculated
1 Life form Categorical Chamaephyte; Geophyte;
Phanerophyte;
Therophyte;
Hemicryptophyte
III, VI
1 Growth form Categorical Bulbose; Caespitose;
Fruticose; Parasite;
Reptant
III, VI
Rosulate; Scapose
1 Leaf surface texture Categorical Glabrous; Pubescent II, III
1 Canopy structure Categorical
No leaves; basal leaves;
leafy stem; parasite;
semibasal (according to
Hӧdgson et al., 1995)
II, III
2 Ellenberg’s indicators
values for soil acidity,
soil nutrient content, soil
humidity, continentality,
soil salt content, light,
temperature
Ordinal - VII
3 Flowering period start treated as
quantitative
- I, III
3 Flowering period end treated as
quantitative
- I, III
3 Flowering period length treated as
quantitative
- I, III
3 Seed production Ordinal Low (< 25 seeds per
plant); Medium (25 – 100
seeds per plant); High
(> 100 seeds per plant)
I, III
3 Seed weight Quantitative (g) - IV
3 Flower size Categorical Big (>10 mm); Medium
(5-10 mm); Small
(<5 mm); No flower
(Graminae)
III
3 Flower sex Categorical Monosexual;
Hermaphrodite
V
3 Pollination type Categorical Anemogamy; Autogamy;
Entomogamy;
Hydrogamy
V
3 Fruit type Categorical Achene; Berry; Capsule;
Caryopsis; Follicle;
Legume; Siliqula; Spores
III, V
3 Dispersal mode Categorical Anemochory; Zoochory;
Hydrochory; Barochory
ΙΙΙ, V
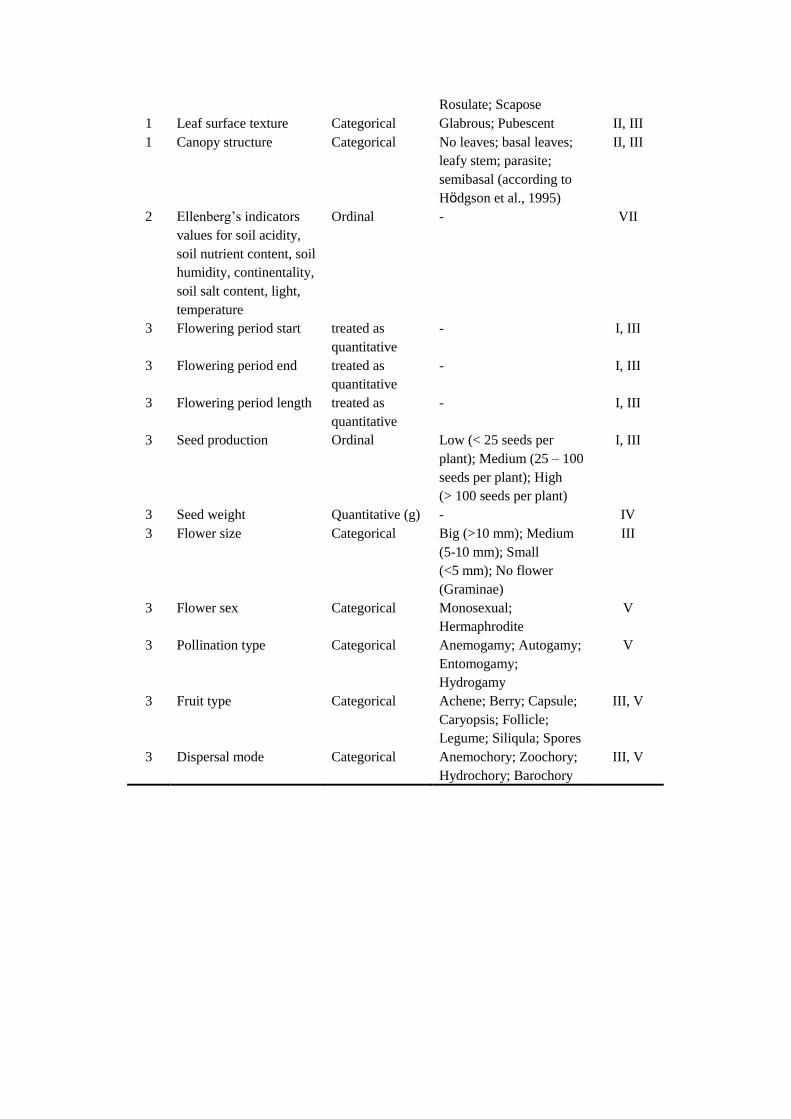
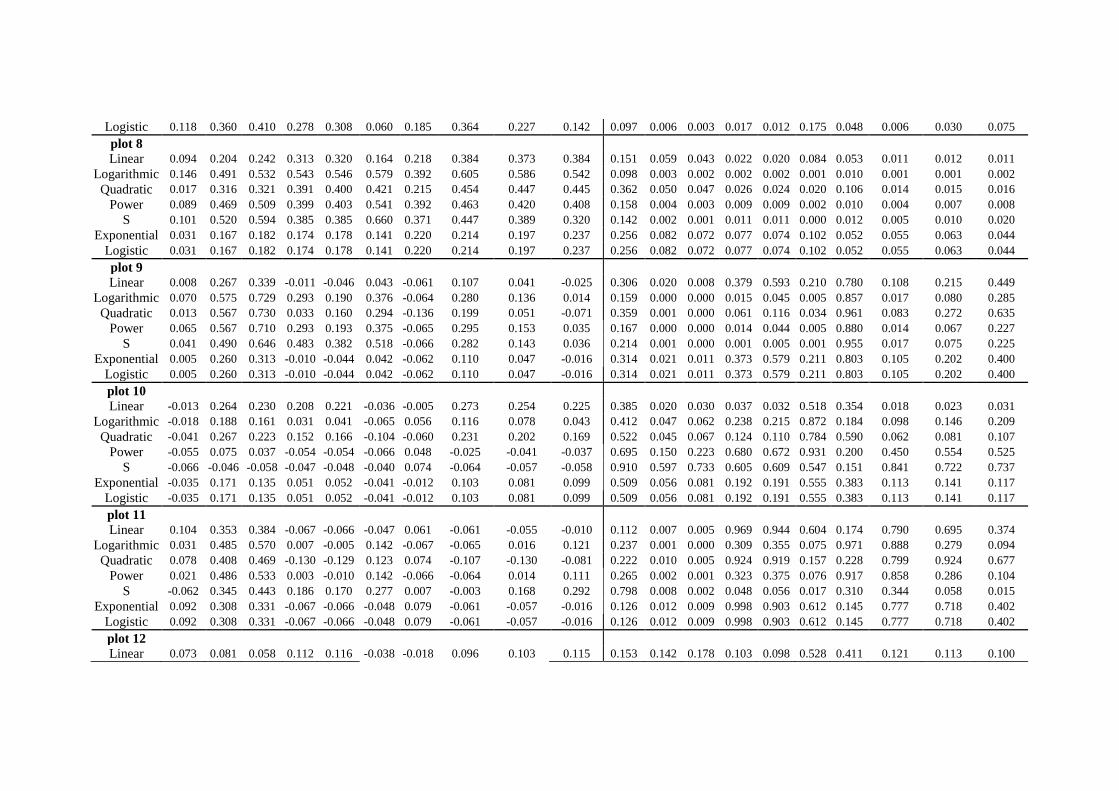
Supplementary Table S2. Adjusted R square and P values of the seven models examined: Linear, Logarithmic, Quadratic, Power, Sigmoid (S)
and Logistic, for the functional diversity accumulation curve (FDAC) of each of the six functional diversity indices. Plots 1, 6, 7, 16 belong to
Lupinus angustifolius - Hyparrhenia hirta community, plots 2, 3, 4, 5 belong to Lupinus angustifolius - Helichrysum italicum community, plots 8,
10, 12, 14 to Pistacia lentiscus community and plots 9, 11, 13, 15 to Lupinus angustifolius - Tolpis barbata community.
R2adj P values
FD Indices FRic FDen SR FDis RaoQ FEve FDiv Shannon Simpson Pielou's
evenness FRic FDen SR FDis RaoQ FEve FDiv Shannon Simpson
Pielou's
evenness
plot 1
Linear 0.522 0.550 0.500 0.700 0.817 0.752 0.081 0.776 0.637 -0.116 0.028 0.021 0.030 0.006 0.001 0.003 0.253 0.002 0.011 0.612
Logarithmic 0.850 0.895 0.965 0.349 0.612 0.838 0.526 0.462 0.258 0.250 0.001 0.000 0.000 0.072 0.013 0.001 0.026 0.038 0.113 0.118
Quadratic 0.810 0.826 0.811 0.655 0.862 0.928 0.354 0.765 0.568 0.027 0.007 0.005 0.007 0.030 0.003 0.001 0.147 0.012 0.053 0.402
Power 0.830 0.891 0.947 0.328 0.613 0.852 0.500 0.451 0.230 0.220 0.001 0.000 0.000 0.080 0.013 0.001 0.031 0.041 0.129 0.135
S 0.761 0.618 0.800 -0.088 0.075 0.369 0.473 -0.016 -0.115 0.495 0.003 0.013 0.002 0.535 0.257 0.065 0.036 0.381 0.618 0.031
Exponential 0.357 0.511 0.444 0.647 0.804 0.733 0.063 0.764 0.605 -0.126 0.069 0.028 0.043 0.008 0.002 0.004 0.271 0.003 0.014 0.658
Logistic 0.357 0.511 0.444 0.647 0.804 0.733 0.063 0.764 0.605 -0.126 0.069 0.028 0.043 0.008 0.002 0.004 0.271 0.003 0.014 0.658
plot 2
Linear 0.715 0.743 0.778 0.118 0.145 0.663 0.100 0.218 -0.140 0.607 0.005 0.004 0.002 0.215 0.190 0.008 0.231 0.137 0.721 0.014
Logarithmic 0.980 0.987 0.987 0.559 0.586 0.863 0.541 0.787 0.250 0.972 0.000 0.000 0.000 0.020 0.016 0.001 0.023 0.002 0.118 0.000
Quadratic 0.828 0.890 0.905 0.225 0.234 0.969 0.170 0.610 0.340 0.829 0.005 0.002 0.001 0.228 0.221 0.000 0.271 0.041 0.153 0.005
Power 0.957 0.990 0.991 0.553 0.554 0.851 0.515 0.783 0.251 0.973 0.000 0.000 0.000 0.021 0.021 0.001 0.027 0.002 0.117 0.000
S 0.819 0.726 0.761 0.709 0.883 0.312 0.892 0.725 0.490 0.601 0.001 0.004 0.003 0.005 0.000 0.087 0.000 0.005 0.032 0.015
Exponential 0.555 0.619 0.607 0.117 0.118 0.695 0.081 0.215 -0.139 0.633 0.021 0.013 0.014 0.215 0.213 0.006 0.251 0.139 0.718 0.011
Logistic 0.555 0.619 0.607 0.117 0.118 0.695 0.081 0.215 -0.139 0.633 0.021 0.013 0.014 0.215 0.213 0.006 0.251 0.139 0.718 0.011
plot 3
Linear 0.563 0.556 0.642 0.474 0.399 0.530 0.725 0.085 0.633 0.667 0.019 0.020 0.010 0.035 0.055 0.024 0.005 0.246 0.011 0.008
Logarithmic 0.957 0.965 0.982 0.700 0.659 0.966 0.559 -0.061 0.670 0.929 0.000 0.000 0.000 0.006 0.009 0.000 0.020 0.469 0.008 0.000
Quadratic 0.792 0.817 0.920 0.790 0.694 0.833 0.817 -0.097 0.683 0.901 0.008 0.006 0.001 0.009 0.022 0.005 0.006 0.544 0.024 0.001
Power 0.694 0.913 0.973 0.700 0.659 0.970 0.545 -0.058 0.667 0.923 0.006 0.000 0.000 0.006 0.009 0.000 0.023 0.461 0.008 0.000
S 0.958 0.878 0.782 0.354 0.421 0.686 -0.026 -0.160 0.279 0.501 0.000 0.000 0.002 0.070 0.048 0.007 0.399 0.858 0.103 0.030
Exponential 0.217 0.428 0.518 0.473 0.395 0.588 0.700 0.086 0.642 0.701 0.137 0.047 0.027 0.036 0.056 0.016 0.006 0.245 0.010 0.006
Logistic 0.217 0.428 0.518 0.473 0.395 0.588 0.700 0.086 0.642 0.701 0.137 0.047 0.027 0.036 0.056 0.016 0.006 0.245 0.010 0.006
plot 4

Linear 0.733 0.545 0.663 0.549 0.481 0.344 -0.109 0.588 -0.119 0.198 0.004 0.022 0.009 0.022 0.034 0.075 0.619 0.016 0.630 0.149
Logarithmic 0.921 0.953 0.984 0.908 0.923 0.796 -0.165 0.332 -0.154 0.652 0.000 0.000 0.000 0.000 0.000 0.002 0.913 0.079 0.805 0.009
Quadratic 0.739 0.661 0.786 0.897 0.813 0.441 -0.323 0.508 -0.173 0.436 0.015 0.029 0.009 0.001 0.007 0.102 0.882 0.073 0.643 0.103
Power 0.892 0.916 0.965 0.909 0.920 0.833 -0.165 0.330 -0.156 0.673 0.000 0.000 0.000 0.000 0.000 0.001 0.917 0.080 0.818 0.008
S 0.860 0.862 0.796 0.563 0.674 0.884 -0.032 0.026 -0.110 0.510 0.001 0.001 0.002 0.019 0.008 0.000 0.411 0.318 0.601 0.028
Exponential 0.468 0.440 0.533 0.546 0.474 0.398 -0.108 0.572 -0.113 0.210 0.037 0.043 0.024 0.022 0.035 0.055 0.954 0.018 0.612 0.142
Logistic 0.468 0.440 0.533 0.546 0.474 0.398 -0.108 0.572 -0.113 0.210 0.037 0.043 0.024 0.022 0.035 0.055 0.954 0.018 0.612 0.142
plot 5
Linear 0.663 0.548 0.657 0.385 0.372 0.704 0.259 0.696 0.358 -0.166 0.009 0.022 0.009 0.064 0.064 0.006 0.113 0.006 0.069 0.972
Logarithmic 0.948 0.962 0.992 0.803 0.789 0.896 0.598 0.498 0.040 0.016 0.000 0.000 0.000 0.002 0.002 0.000 0.015 0.030 0.300 0.332
Quadratic 0.911 0.787 0.879 0.625 0.620 0.943 0.425 0.714 0.232 -0.233 0.001 0.009 0.002 0.038 0.038 0.000 0.108 0.019 0.223 0.728
Power 0.936 0.941 0.983 0.800 0.782 0.878 0.602 0.377 0.006 -0.047 0.000 0.000 0.000 0.002 0.002 0.000 0.014 0.062 0.346 0.439
S 0.709 0.709 0.755 0.506 0.486 0.383 0.307 -0.076 -0.161 0.423 0.005 0.005 0.003 0.029 0.033 0.060 0.089 0.504 0.872 0.048
Exponential 0.487 0.480 0.571 0.379 0.361 0.755 0.262 0.511 0.247 -0.159 0.033 0.034 0.018 0.061 0.067 0.003 0.111 0.028 0.119 0.848
Logistic 0.487 0.480 0.571 0.379 0.361 0.755 0.262 0.511 0.247 -0.159 0.033 0.034 0.018 0.061 0.067 0.003 0.111 0.028 0.119 0.848
plot 6
Linear 0.580 0.670 0.742 0.592 0.429 0.495 0.071 0.285 0.108 -0.133 0.017 0.008 0.004 0.016 0.046 0.031 0.261 0.099 0.223 0.688
Logarithmic 0.906 0.933 0.958 0.548 0.242 0.712 0.310 0.752 0.559 0.085 0.000 0.000 0.000 0.022 0.122 0.005 0.088 0.003 0.020 0.246
Quadratic 0.885 0.940 0.967 0.591 0.333 0.827 -0.092 0.428 0.200 -0.215 0.002 0.000 0.000 0.046 0.157 0.005 0.537 0.090 0.247 0.701
Power 0.852 0.946 0.981 0.550 0.253 0.675 0.294 0.699 0.535 0.115 0.001 0.000 0.000 0.021 0.116 0.008 0.095 0.006 0.024 0.216
S 0.813 0.584 0.607 0.181 -0.046 0.243 0.527 0.914 0.881 0.550 0.001 0.017 0.014 0.161 0.438 0.122 0.025 0.000 0.000 0.021
Exponential 0.373 0.608 0.670 0.600 0.442 0.460 0.067 0.223 0.087 -0.124 0.063 0.014 0.008 0.015 0.043 0.039 0.266 0.133 0.244 0.649
Logistic 0.373 0.608 0.670 0.600 0.442 0.460 0.067 0.223 0.087 -0.124 0.063 0.014 0.008 0.015 0.043 0.039 0.266 0.133 0.244 0.649
plot 7
Linear 0.567 0.724 0.765 -0.018 0.058 0.068 0.598 -0.015 0.077 0.710 0.019 0.005 0.003 0.386 0.277 0.266 0.015 0.380 0.255 0.005
Logarithmic 0.869 0.959 0.977 -0.167 -0.159 0.526 0.925 0.534 -0.166 0.640 0.000 0.000 0.000 0.978 0.844 0.025 0.000 0.024 0.955 0.000
Quadratic 0.872 0.933 0.917 -0.084 -0.005 0.283 0.849 0.227 0.106 0.881 0.003 0.000 0.001 0.527 0.437 0.188 0.004 0.113 0.326 0.002
Power 0.868 0.965 0.990 -0.166 -0.158 0.510 0.922 0.543 -0.166 0.933 0.000 0.000 0.000 0.970 0.841 0.028 0.000 0.022 0.960 0.000
S 0.467 0.554 0.698 -0.118 -0.131 0.482 0.640 0.883 0.065 0.582 0.037 0.021 0.006 0.629 0.678 0.034 0.010 0.000 0.269 0.017
Exponential 0.501 0.638 0.632 -0.013 0.060 0.049 0.556 -0.007 0.080 0.744 0.030 0.011 0.011 0.378 0.274 0.288 0.020 0.368 0.251 0.004
Logistic 0.501 0.638 0.632 -0.013 0.060 0.049 0.556 -0.007 0.080 0.744 0.030 0.011 0.011 0.378 0.274 0.288 0.020 0.368 0.251 0.004
plot 8
Linear 0.735 0.699 0.716 0.315 0.292 0.205 0.472 0.421 0.399 -0.045 0.004 0.006 0.005 0.086 0.096 0.145 0.036 0.049 0.055 0.435
Logarithmic 0.935 0.939 0.962 0.013 -0.008 0.443 0.075 0.908 0.868 -0.110 0.000 0.000 0.000 0.336 0.369 0.043 0.257 0.000 0.000 0.600
Quadratic 0.893 0.925 0.918 0.180 0.151 0.328 0.372 0.696 0.662 -0.250 0.002 0.001 0.002 0.263 0.286 0.159 0.135 0.022 0.029 0.754
Power 0.894 0.935 0.947 -0.012 -0.027 0.436 0.077 0.901 0.864 -0.108 0.000 0.000 0.000 0.375 0.401 0.045 0.255 0.000 0.001 0.594
S 0.591 0.588 0.780 -0.158 -0.153 0.154 -0.166 0.727 0.642 -0.143 0.016 0.016 0.002 0.839 0.801 0.183 0.966 0.004 0.010 0.739
Exponential 0.484 0.550 0.469 0.217 0.202 0.200 0.475 0.403 0.390 -0.044 0.033 0.021 0.037 0.137 0.147 0.148 0.035 0.054 0.058 0.434
Logistic 0.484 0.550 0.469 0.217 0.202 0.200 0.475 0.403 0.390 -0.044 0.033 0.021 0.037 0.137 0.147 0.148 0.035 0.054 0.058 0.434

plot 9
Linear 0.521 0.367 0.716 0.358 0.383 0.257 0.434 0.209 0.030 -0.096 0.026 0.065 0.005 0.069 0.060 0.114 0.045 0.142 0.312 0.557
Logarithmic 0.945 0.911 0.962 0.844 0.829 0.781 0.711 0.730 0.496 0.260 0.000 0.000 0.000 0.001 0.001 0.002 0.005 0.004 0.031 0.112
Quadratic 0.817 0.667 0.918 0.646 0.675 0.599 0.660 0.347 0.077 -0.145 0.006 0.028 0.001 0.032 0.026 0.044 0.029 0.149 0.353 0.605
Power 0.934 0.877 0.947 0.842 0.826 0.762 0.716 0.695 0.482 0.261 0.000 0.000 0.000 0.001 0.001 0.003 0.005 0.006 0.034 0.111
S 0.696 0.896 0.780 0.647 0.560 0.599 0.264 0.994 0.956 0.838 0.006 0.000 0.002 0.010 0.020 0.015 0.110 0.000 0.000 0.001
Exponential 0.464 0.316 0.469 0.355 0.378 0.249 0.440 0.182 0.024 -0.094 0.038 0.085 0.037 0.070 0.062 0.188 0.044 0.161 0.320 0.550
Logistic 0.464 0.316 0.469 0.355 0.378 0.249 0.440 0.182 0.024 -0.094 0.038 0.085 0.037 0.070 0.062 0.188 0.044 0.161 0.320 0.550
plot 10
Linear 0.615 0.672 0.608 -0.165 -0.165 0.517 -0.166 0.120 -0.065 0.370 0.013 0.008 0.014 0.925 0.934 0.027 0.957 0.212 0.921 0.065
Logarithmic 0.935 0.978 0.992 -0.163 -0.163 0.843 -0.163 0.351 -0.146 0.738 0.000 0.000 0.000 0.901 0.900 0.001 0.895 0.071 0.751 0.004
Quadratic 0.773 0.843 0.849 -0.287 -0.285 0.931 -0.306 -0.048 -0.307 0.812 0.019 0.004 0.006 0.811 0.806 0.001 0.580 0.615 0.612 0.005
Power 0.697 0.955 0.958 -0.160 -0.160 0.828 -0.163 0.344 -0.138 0.744 0.006 0.000 0.000 0.862 0.861 0.001 0.900 0.074 0.712 0.004
S 0.920 0.824 0.838 0.063 0.060 0.393 0.029 0.688 0.125 0.370 0.000 0.001 0.001 0.271 0.274 0.057 0.314 0.007 0.207 0.064
Exponential 0.260 0.547 0.483 -0.166 -0.166 0.516 -0.166 0.099 -0.163 0.379 0.112 0.022 0.033 0.949 0.658 0.027 0.954 0.232 0.898 0.062
Logistic 0.260 0.547 0.483 -0.166 -0.166 0.516 -0.166 0.099 -0.163 0.379 0.112 0.022 0.033 0.949 0.658 0.027 0.954 0.232 0.898 0.062
plot 11
Linear 0.142 0.313 0.461 0.065 -0.051 0.258 -0.167 0.825 0.822 0.715 0.192 0.087 0.038 0.268 0.447 0.113 0.995 0.001 0.001 0.005
Logarithmic 0.686 0.860 0.950 -0.157 -0.161 0.824 0.049 0.850 0.807 0.531 0.007 0.001 0.000 0.835 0.866 0.001 0.288 0.001 0.002 0.024
Quadratic 0.314 0.541 0.700 -0.061 -0.150 0.644 -0.223 0.971 0.955 0.757 0.168 0.062 0.021 0.500 0.611 0.033 0.713 0.000 0.001 0.048
Power 0.656 0.831 0.914 -0.157 -0.161 0.829 0.042 0.839 0.766 0.455 0.009 0.001 0.000 0.828 0.871 0.001 0.297 0.001 0.003 0.040
S 0.873 0.897 0.892 -0.131 -0.046 0.769 0.513 0.291 0.199 -0.066 0.000 0.000 0.000 0.677 0.438 0.438 0.003 0.097 0.149 0.481
Exponential 0.121 0.278 0.394 0.068 -0.050 0.270 -0.167 0.684 0.670 0.580 0.210 0.103 0.056 0.265 0.445 0.445 0.107 0.007 0.008 0.017
Logistic 0.121 0.278 0.394 0.068 -0.050 0.270 -0.167 0.684 0.670 0.580 0.210 0.103 0.056 0.265 0.445 0.445 0.107 0.007 0.008 0.017
plot 12
Linear 0.697 0.702 0.767 0.685 0.685 0.280 0.212 -0.090 0.315 0.608 0.006 0.006 0.003 0.007 0.007 0.102 0.141 0.539 0.086 0.014
Logarithmic 0.890 0.944 0.939 0.350 0.348 0.536 0.009 0.359 -0.056 0.955 0.000 0.000 0.000 0.072 0.072 0.024 0.342 0.068 0.457 0.000
Quadratic 0.979 0.955 0.978 0.683 0.982 0.392 0.091 0.089 0.203 0.789 0.000 0.000 0.000 0.024 0.025 0.124 0.339 0.168 0.903 0.015
Power 0.942 0.956 0.979 0.288 0.285 0.541 0.009 0.365 -0.054 0.956 0.000 0.000 0.000 0.098 0.099 0.023 0.341 0.066 0.454 0.000
S 0.621 0.678 0.711 -0.135 -0.136 0.443 -0.163 0.577 -0.166 0.733 0.012 0.007 0.005 0.697 0.703 0.043 0.901 0.018 0.958 0.004
Exponential 0.549 0.593 0.616 0.616 0.615 0.288 0.212 -0.087 0.318 0.624 0.022 0.015 0.013 0.013 0.013 0.098 0.140 0.532 0.085 0.012
Logistic 0.549 0.593 0.616 0.616 0.615 0.288 0.212 -0.087 0.318 0.624 0.022 0.015 0.013 0.013 0.013 0.098 0.140 0.532 0.085 0.012
plot 13
Linear 0.926 0.607 0.548 -0.150 -0.165 0.129 -0.061 0.660 0.377 -0.166 0.000 0.014 0.022 0.780 0.928 0.203 0.469 0.009 0.062 0.945
Logarithmic 0.695 0.985 0.979 0.084 -0.073 0.617 0.408 0.763 0.552 -0.046 0.006 0.000 0.000 0.248 0.496 0.013 0.052 0.003 0.021 0.438
Quadratic 0.916 0.792 0.789 -0.082 -0.177 0.221 0.024 0.722 0.350 -0.098 0.001 0.008 0.011 0.525 0.648 0.231 0.405 0.049 0.213 0.544
Power 0.823 0.970 0.952 0.082 -0.075 0.629 0.406 0.763 0.547 -0.049 0.001 0.000 0.000 0.250 0.501 0.012 0.053 0.003 0.022 0.443
S 0.362 0.805 0.842 0.140 -0.030 0.923 0.908 0.503 0.577 -0.038 0.067 0.002 0.001 0.194 0.407 0.000 0.000 0.029 0.018 0.422
Exponential 0.890 0.548 0.471 -0.151 -0.164 0.141 -0.063 0.639 0.363 -0.166 0.000 0.022 0.036 0.786 0.918 0.193 0.474 0.011 0.067 0.957

Logistic 0.890 0.548 0.471 -0.151 -0.164 0.141 -0.063 0.639 0.363 -0.166 0.000 0.022 0.036 0.786 0.918 0.193 0.474 0.011 0.067 0.957
plot 14
Linear 0.785 0.693 0.741 0.813 0.815 0.079 0.628 0.780 0.696 0.059 0.002 0.006 0.004 0.001 0.001 0.252 0.012 0.002 0.006 0.275
Logarithmic 0.937 0.988 0.972 0.806 0.819 -0.124 0.491 0.557 0.363 -0.164 0.000 0.000 0.000 0.002 0.001 0.651 0.032 0.020 0.067 0.918
Quadratic 0.951 0.923 0.954 0.951 0.955 -0.083 0.633 0.852 0.696 -0.106 0.000 0.001 0.000 0.000 0.000 0.526 0.035 0.016 0.094 0.989
Power 0.806 0.979 0.982 0.760 0.779 -0.123 0.492 0.522 0.301 -0.163 0.002 0.000 0.000 0.003 0.002 0.648 0.032 0.026 0.092 0.895
S 0.932 0.763 0.761 0.194 0.219 -0.097 -0.037 -0.010 -0.130 0.055 0.000 0.003 0.003 0.152 0.136 0.560 0.419 0.372 0.674 0.280
Exponential 0.253 0.537 0.556 0.662 0.664 0.081 0.630 0.733 0.628 0.069 0.116 0.023 0.021 0.009 0.008 0.251 0.011 0.004 0.012 0.264
Logistic 0.253 0.537 0.556 0.662 0.664 0.081 0.630 0.733 0.628 0.069 0.116 0.023 0.021 0.009 0.008 0.251 0.011 0.004 0.012 0.264
plot 15
Linear 0.426 0.550 0.601 -0.008 0.194 0.387 0.259 0.852 0.845 0.738 0.047 0.021 0.015 0.369 0.152 0.059 0.113 0.001 0.001 0.004
Logarithmic 0.917 0.931 0.990 0.089 0.289 0.857 0.804 0.881 0.857 0.396 0.000 0.000 0.000 0.242 0.098 0.001 0.002 0.000 0.001 0.056
Quadratic 0.770 0.875 0.852 -0.152 0.122 0.788 0.614 0.972 0.948 0.699 0.011 0.002 0.005 0.614 0.312 0.009 0.040 0.000 0.000 0.021
Power 0.907 0.932 0.974 0.088 0.282 0.845 0.808 0.904 0.874 0.382 0.000 0.000 0.000 0.243 0.101 0.001 0.001 0.000 0.000 0.060
S 0.795 0.622 0.796 -0.027 0.038 0.539 0.824 0.440 0.431 -0.036 0.002 0.012 0.002 0.402 0.301 0.023 0.001 0.043 0.046 0.418
Exponential 0.373 0.511 0.522 -0.009 0.185 0.399 0.264 0.819 0.816 0.716 0.063 0.028 0.026 0.371 0.159 0.055 0.110 0.001 0.001 0.005
Logistic 0.373 0.511 0.522 -0.009 0.185 0.399 0.264 0.819 0.816 0.716 0.063 0.028 0.026 0.371 0.159 0.055 0.110 0.001 0.001 0.005
plot 16
Linear 0.705 0.623 0.604 0.815 0.829 0.869 -0.093 -0.048 0.015 0.830 0.006 0.012 0.014 0.001 0.001 0.000 0.550 0.442 0.333 0.001
Logarithmic 0.941 0.982 0.988 0.859 0.816 0.538 -0.158 0.449 -0.163 0.941 0.000 0.000 0.000 0.001 0.001 0.023 0.840 0.041 0.892 0.000
Quadratic 0.951 0.870 0.813 0.903 0.880 0.847 -0.307 0.044 -0.060 0.937 0.000 0.003 0.007 0.001 0.002 0.004 0.843 0.209 0.663 0.000
Power 0.965 0.976 0.935 0.869 0.825 0.539 -0.155 0.458 -0.163 0.931 0.000 0.000 0.000 0.000 0.001 0.023 0.815 0.039 0.892 0.000
S 0.631 0.722 0.873 0.483 0.444 0.040 0.170 0.859 0.102 0.496 0.011 0.005 0.000 0.033 0.042 0.299 0.170 0.001 0.229 0.031
Exponential 0.593 0.552 0.447 0.784 0.795 0.899 -0.099 -0.043 0.016 0.849 0.015 0.021 0.042 0.002 0.002 0.000 0.567 0. 431 0.332 0.001
Logistic 0.593 0.552 0.447 0.784 0.795 0.899 -0.099 -0.043 0.016 0.849 0.015 0.021 0.042 0.002 0.002 0.000 0.567 0. 431 0.332 0.001

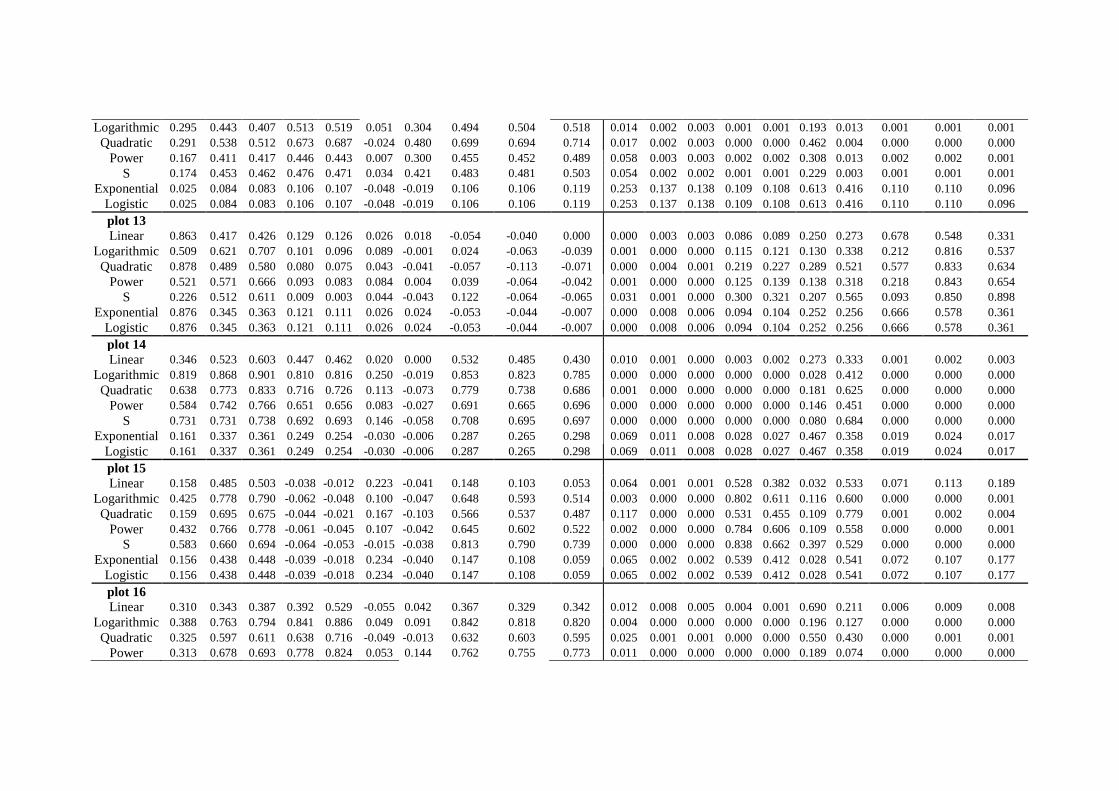
Supplementary Table S3. R square and P values of the six models examined: Linear, Logarithmic, Quadratic, Power, Sigmoid (S), Exponential
and Logistic, for the functional diversity area relationship (FDAR) of each of the six functional diversity indices. Plots 1, 6, 7, 16 belong to Lupinus
angustifolius - Hyparrhenia hirta community, plots 2, 3, 4, 5 belong to Lupinus angustifolius - Helichrysum italicum community, plots 8, 10, 12,
14 to Pistacia lentiscus community and plots 9, 11, 13, 15 to Lupinus angustifolius - Tolpis barbata community.
R2adj P values
FD Indices FRic FDen SR FDis RaoQ FEve FDiv Shannon Simpson Pielou's
evenness FRic FDen SR FDis RaoQ FEve FDiv Shannon Simpson
Pielou's
evenness
plot 1
Linear -0,059 0.077 0.105 0.152 0.122 -0.008 -0.058 0.172 0.167 -0.022 0,739 0.147 0.111 0.068 0.093 0.365 0.728 0.055 0.053 0.430
Logarithmic 0.032 0.245 0.285 0.453 0.475 -0.023 -0.043 0.503 0.467 0.068 0.236 0.025 0.016 0.002 0.001 0.436 0.571 0.001 0.001 0.162
Quadratic -0.085 0.114 0.153 0.305 0.267 -0.077 -0.132 0.346 0.328 -0.041 0.964 0.168 0.123 0.031 0.045 0.660 0.936 0.027 0.024 0.520
Power 0.083 0.247 0.281 0.453 0.498 -0.016 -0.043 0.477 0.433 0. 0.138 0.025 0.017 0.002 0.001 0.402 0.565 0.001 0.002 0.151
S 0.197 0.281 0.309 0.515 0.660 -0.049 -0.037 0.568 0.469 0.112 0.042 0.017 0.012 0.001 0.000 0.612 0.522 0.000 0.001 0.103
Exponential -0.43 0.073 0.096 0.148 0.127 -0.003 -0.054 0.154 0.155 -0.017 0.570 0.153 0.112 0.071 0.088 0.346 0.674 0.067 0.066 0.406.
Logistic -0.43 0.073 0.096 0.148 0.127 -0.003 -0.054 0.154 0.155 -0.017 0.570 0.153 0.112 0.071 0.088 0.346 0.674 0.067 0.066 0.406.
plot 2
Linear 0.064 0.518 0.563 -0.013 0.003 -0.001 -0.016 0.014 -0.066 -0.041 0.168 0.001 0.000 0.385 0.323 0.337 0.398 0.286 0.942 0.553
Logarithmic 0.318 0.808 0.824 0.008 0.051 -0.067 0.080 0.059 -0.140 0.003 0.011 0.000 0.000 0.304 0.193 0.969 0.143 0.177 0.983 0.324
Quadratic 0.144 0.681 0.708 -0.047 -0.011 -0.015 -0.049 0.015 -0.067 -0.109 0.132 0.000 0.000 0.541 0.423 0.437 0.549 0.354 0.978 0.811
Power 0.267 0.714 0.712 -0.001 0.041 -0.067 0.092 0.035 -0.059 -0.020 0.020 0.000 0.000 0.338 0.214 0.984 0.126 0.227 0.752 0.420
S 0.382 0.689 0.678 -0.029 0.014 -0.031 0.150 -0.002 -0.065 0.016 0.005 0.000 0.000 0.470 0.284 0.482 0.069 0.342 0.876 0.280
Exponential 0.037 0.364 0.373 -0.017 0.000 -0.003 -0.011 0.005 -0.065 -0.053 0.222 0.006 0.005 0.404 0.334 0.343 0.376 0.317 0.876 0.664
Logistic 0.037. 0.364 0.373 -0.017 0.000 -0.003 -0.011 0.005 -0.065 -0.053 0.222 0.006 0.005 0.404 0.334 0.343 0.376 0.317 0.876 0.664
plot 3
Linear 0.015 0.192 0.238 0.072 0.051 -0.061 0.267 0.015 0.205 0.288 0.283 0.045 0.027 0.156 0.193 0.784 0.020 0.282 0.039 0.015
Logarithmic 0.303 0.597 0.709 0.148 0.107 -0.066 0.657 -0.032 0.315 0.526 0.013 0.000 0.000 0.071 0.108 0.903 0.000 0.493 0.011 0.001
Quadratic 0.151 0.414 0.542 0.154 0.115 -0.082 0.603 -0.018 0.387 0.580 0.125 0.009 0.002 0.122 0.167 0.681 0.001 0.446 0.013 0.001

Power 0.235 0.571 0.679 0.147 0.113 -0.066 0.641 -0.020 0.307 0.497 0.028 0.000 0.000 0.072 0.101 0.901 0.000 0.421 0.012 0.001
S 0.376 0.693 0.814 0.075 0.041 -0.061 0.639 -0.066 0.169 0.356 0.005 0.000 0.000 0.150 0.214 0.780 0.000 0.919 0.057 0.007
Exponential 0.005 0.172 0.208 0.065 0.050 -0.061 0.248 0.012 0.182 0.263 0.317 0.055 0.038 0.167 0.195 0.776 0.024 0.291 0.050 0.021
Logistic 0.005 0.172 0.208 0.065 0.050 -0.061 0.248. 0.012 0.182 0.263 0.317 0.055 0.038 0.167 0.195 0.776 0.024 0.291 0.050 0.021
plot 4
Linear 0.635 0.619 0.651 -0.028 -0.050 0.016 -0.027 -0.049 0.151 0.260 0.000 0.000 0.000 0.462 0.632 0.280 0.460 0.619 0.069 0.021
Logarithmic 0.535 0.778 0.800 -0.051 -0.065 0.173 0.131 -0.016 0.333 0.478 0.001 0.000 0.000 0.641 0.882 0.054 0.084 0.400 0.009 0.001
Quadratic 0.609 0.668 0.760 -0.055 -0.123 0.026 0.232 0.088 0.451 0.556 0.001 0.000 0.000 0.572 0.885 0.327 0.062 0.206 0.006 0.001
Power 0.523 0.757 0.763 -0.050 -0.065 0.169 0.131 -0.009 0.328 0.470 0.001 0.000 0.000 0.637 0.871 0.057 0.085 0.370 0.010 0.001
S 0.356 0.647 0.583 -0.064 -0.002 0.250 0.143 -0.044 0.209 0.318 0.007 0.000 0.000 0.845 0.342 0.024 0.075 0.576 0.037 0.011
Exponential 0.552 0.524 0.539 -0.029 -0.052 0.014 -0.026 -0.050 0.140 0.250 0.000 0.001 0.000 0.469 0.651 0.286 0.453 0.631 0.077 0.024
Logistic 0.552 0.524 0.539 -0.029 -0.052 0.014 -0.026 -0.050 0.140 0.250 0.000 0.001 0.000 0.469 0.651 0.286 0.453 0.631 0.077 0.024
plot 5
Linear -0.023 0.141 0.114 -0.067 -0.047 0.082 0.227 0.082 0.225 0.294 0.437 0.076 0.101 0.977 0.602 0.141 0.031 0.140 0.031 0.014
Logarithmic 0.049 0.199 0.139 0.098 0.193 0.108 0.006 -0.066 -0.017 0.061 0.196 0.041 0.078 0.119 0.044 0.107 0.311 0.959 0.407 0.173
Quadratic -0.037 0.167 0.129 0.437 0.469 0.165 0.194 0.278 0.295 0.274 0.506 0.101 0.149 0.007 0.005 0.112 0.087 0.040 0.034 0.042
Power 0.020 0.199 0.157 0.091 0.181 0.113 0.008 -0.066 -0.020 0.042 0.267 0.042 0.064 0.128 0.050 0.102 0.306 0.918 0.422 0.213
S 0.41 0.120 0.068 0.204 0.264 0.003 -0.066 -0.022 -0.065 -0.060 0.215 0.094 0.162 0.039 0.020 0.322 0.948 0.433 0.896 0.765
Exponential -0.038 0.124 0.110 -0.067 -0.047 0.083 0.226 0.094 0.213 0.268 0.529 0.091 0.105 0.981 0.604 0.138 0.031 0.124 0.036 0.019
Logistic -0.038 0.124 0.110 -0.067 -0.047 0.083 0.226 0.094 0.213 0.268 0.529 0.091 0.105 0.981 0.604 0.138 0.031 0.124 0.036 0.019
plot 6
Linear 0.218 0.304 0.326 -0.038 -0.040 -0.016 -0.045 -0.066 -0.036 0.005 0.034 0.013 0.010 0.532 0.545 0.401 0.584 0.936 0.514 0.316
Logarithmic 0.399 0.719 0.749 0.185 0.155 0.286 0.115 0.047 0.226 0.356 0.004 0.000 0.000 0.048 0.066 0.016 0.099 0.200 0.031 0.007
Quadratic 0.345 0.736 0.755 0.021 0.010 0.308 -0.054 -0.070 0.051 0.181 0.020 0.000 0.000 0.338 0.365 0.030 0.569 0.629 0.272 0.097
Power 0.303 0.699 0.726 0.166 0.141 0.282 0.083 0.038 0.198 0.325 0.013 0.000 0.000 0.059 0.077 0.016 0.138 0.221 0.042 0.010
S 0.272 0.662 0.689 0.414 0.355 0.443 0.275 0.256 0.483 0.613 0.018 0.000 0.000 0.003 0.007 0.002 0.018 0.022 0.001 0.000
Exponential 0.129 0.279 0.297 -0.046 -0.048 -0.018 -0.055 -0.067 -0.045 -0.009 0.087 0.017 0.014 0.595 0.615 0.410 0.686 0.665 0.583 0.369
Logistic 0.129 0.279 0.297 -0.046 -0.048 -0.018 -0.055 -0.067 -0.045 -0.009 0.087 0.017 0.014 0.595 0.615 0.410 0.686 0.665 0.583 0.369
plot 7
Linear 0.175 0.438 0.528 0.331 0.398 0.061 0.219 0.448 0.255 0.135 0.053 0.002 0.001 0.009 0.004 0.173 0.033 0.002 0.022 0.081
Logarithmic 0.441 0.830 0.845 0.472 0.544 0.093 0.396 0.636 0.361 0.153 0.002 0.000 0.000 0.001 0.000 0.126 0.004 0.000 0.006 0.067
Quadratic 0.323 0.647 0.660 0.407 0.476 0.022 0.325 0.546 0.295 0.112 0.025 0.000 0.000 0.010 0.004 0.336 0.025 0.002 0.034 0.170
Power 0.357 0.789 0.794 0.450 0.503 0.093 0.388 0.591 0.361 0.184 0.007 0.000 0.000 0.002 0.001 0.125 0.004 0.000 0.006 0.049
S 0.388 0.820 0.796 0.358 0.414 0.050 0.346 0.497 0.277 0.099 0.004 0.000 0.000 0.007 0.003 0.194 0.008 0.001 0.017 0.117
Exponential 0.118 0.360 0.410 0.278 0.308 0.060 0.185 0.364 0.227 0.142 0.097 0.006 0.003 0.017 0.012 0.175 0.048 0.006 0.030 0.075
Logistic 0.118 0.360 0.410 0.278 0.308 0.060 0.185 0.364 0.227 0.142 0.097 0.006 0.003 0.017 0.012 0.175 0.048 0.006 0.030 0.075
plot 8
Linear 0.094 0.204 0.242 0.313 0.320 0.164 0.218 0.384 0.373 0.384 0.151 0.059 0.043 0.022 0.020 0.084 0.053 0.011 0.012 0.011
Logarithmic 0.146 0.491 0.532 0.543 0.546 0.579 0.392 0.605 0.586 0.542 0.098 0.003 0.002 0.002 0.002 0.001 0.010 0.001 0.001 0.002
Quadratic 0.017 0.316 0.321 0.391 0.400 0.421 0.215 0.454 0.447 0.445 0.362 0.050 0.047 0.026 0.024 0.020 0.106 0.014 0.015 0.016
Power 0.089 0.469 0.509 0.399 0.403 0.541 0.392 0.463 0.420 0.408 0.158 0.004 0.003 0.009 0.009 0.002 0.010 0.004 0.007 0.008
S 0.101 0.520 0.594 0.385 0.385 0.660 0.371 0.447 0.389 0.320 0.142 0.002 0.001 0.011 0.011 0.000 0.012 0.005 0.010 0.020
Exponential 0.031 0.167 0.182 0.174 0.178 0.141 0.220 0.214 0.197 0.237 0.256 0.082 0.072 0.077 0.074 0.102 0.052 0.055 0.063 0.044
Logistic 0.031 0.167 0.182 0.174 0.178 0.141 0.220 0.214 0.197 0.237 0.256 0.082 0.072 0.077 0.074 0.102 0.052 0.055 0.063 0.044
plot 9
Linear 0.008 0.267 0.339 -0.011 -0.046 0.043 -0.061 0.107 0.041 -0.025 0.306 0.020 0.008 0.379 0.593 0.210 0.780 0.108 0.215 0.449
Logarithmic 0.070 0.575 0.729 0.293 0.190 0.376 -0.064 0.280 0.136 0.014 0.159 0.000 0.000 0.015 0.045 0.005 0.857 0.017 0.080 0.285
Quadratic 0.013 0.567 0.730 0.033 0.160 0.294 -0.136 0.199 0.051 -0.071 0.359 0.001 0.000 0.061 0.116 0.034 0.961 0.083 0.272 0.635
Power 0.065 0.567 0.710 0.293 0.193 0.375 -0.065 0.295 0.153 0.035 0.167 0.000 0.000 0.014 0.044 0.005 0.880 0.014 0.067 0.227
S 0.041 0.490 0.646 0.483 0.382 0.518 -0.066 0.282 0.143 0.036 0.214 0.001 0.000 0.001 0.005 0.001 0.955 0.017 0.075 0.225
Exponential 0.005 0.260 0.313 -0.010 -0.044 0.042 -0.062 0.110 0.047 -0.016 0.314 0.021 0.011 0.373 0.579 0.211 0.803 0.105 0.202 0.400
Logistic 0.005 0.260 0.313 -0.010 -0.044 0.042 -0.062 0.110 0.047 -0.016 0.314 0.021 0.011 0.373 0.579 0.211 0.803 0.105 0.202 0.400
plot 10
Linear -0.013 0.264 0.230 0.208 0.221 -0.036 -0.005 0.273 0.254 0.225 0.385 0.020 0.030 0.037 0.032 0.518 0.354 0.018 0.023 0.031
Logarithmic -0.018 0.188 0.161 0.031 0.041 -0.065 0.056 0.116 0.078 0.043 0.412 0.047 0.062 0.238 0.215 0.872 0.184 0.098 0.146 0.209
Quadratic -0.041 0.267 0.223 0.152 0.166 -0.104 -0.060 0.231 0.202 0.169 0.522 0.045 0.067 0.124 0.110 0.784 0.590 0.062 0.081 0.107
Power -0.055 0.075 0.037 -0.054 -0.054 -0.066 0.048 -0.025 -0.041 -0.037 0.695 0.150 0.223 0.680 0.672 0.931 0.200 0.450 0.554 0.525
S -0.066 -0.046 -0.058 -0.047 -0.048 -0.040 0.074 -0.064 -0.057 -0.058 0.910 0.597 0.733 0.605 0.609 0.547 0.151 0.841 0.722 0.737
Exponential -0.035 0.171 0.135 0.051 0.052 -0.041 -0.012 0.103 0.081 0.099 0.509 0.056 0.081 0.192 0.191 0.555 0.383 0.113 0.141 0.117
Logistic -0.035 0.171 0.135 0.051 0.052 -0.041 -0.012 0.103 0.081 0.099 0.509 0.056 0.081 0.192 0.191 0.555 0.383 0.113 0.141 0.117
plot 11
Linear 0.104 0.353 0.384 -0.067 -0.066 -0.047 0.061 -0.061 -0.055 -0.010 0.112 0.007 0.005 0.969 0.944 0.604 0.174 0.790 0.695 0.374
Logarithmic 0.031 0.485 0.570 0.007 -0.005 0.142 -0.067 -0.065 0.016 0.121 0.237 0.001 0.000 0.309 0.355 0.075 0.971 0.888 0.279 0.094
Quadratic 0.078 0.408 0.469 -0.130 -0.129 0.123 0.074 -0.107 -0.130 -0.081 0.222 0.010 0.005 0.924 0.919 0.157 0.228 0.799 0.924 0.677
Power 0.021 0.486 0.533 0.003 -0.010 0.142 -0.066 -0.064 0.014 0.111 0.265 0.002 0.001 0.323 0.375 0.076 0.917 0.858 0.286 0.104
S -0.062 0.345 0.443 0.186 0.170 0.277 0.007 -0.003 0.168 0.292 0.798 0.008 0.002 0.048 0.056 0.017 0.310 0.344 0.058 0.015
Exponential 0.092 0.308 0.331 -0.067 -0.066 -0.048 0.079 -0.061 -0.057 -0.016 0.126 0.012 0.009 0.998 0.903 0.612 0.145 0.777 0.718 0.402
Logistic 0.092 0.308 0.331 -0.067 -0.066 -0.048 0.079 -0.061 -0.057 -0.016 0.126 0.012 0.009 0.998 0.903 0.612 0.145 0.777 0.718 0.402
plot 12
Linear 0.073 0.081 0.058 0.112 0.116 -0.038 -0.018 0.096 0.103 0.115 0.153 0.142 0.178 0.103 0.098 0.528 0.411 0.121 0.113 0.100
Logarithmic 0.295 0.443 0.407 0.513 0.519 0.051 0.304 0.494 0.504 0.518 0.014 0.002 0.003 0.001 0.001 0.193 0.013 0.001 0.001 0.001
Quadratic 0.291 0.538 0.512 0.673 0.687 -0.024 0.480 0.699 0.694 0.714 0.017 0.002 0.003 0.000 0.000 0.462 0.004 0.000 0.000 0.000
Power 0.167 0.411 0.417 0.446 0.443 0.007 0.300 0.455 0.452 0.489 0.058 0.003 0.003 0.002 0.002 0.308 0.013 0.002 0.002 0.001
S 0.174 0.453 0.462 0.476 0.471 0.034 0.421 0.483 0.481 0.503 0.054 0.002 0.002 0.001 0.001 0.229 0.003 0.001 0.001 0.001
Exponential 0.025 0.084 0.083 0.106 0.107 -0.048 -0.019 0.106 0.106 0.119 0.253 0.137 0.138 0.109 0.108 0.613 0.416 0.110 0.110 0.096
Logistic 0.025 0.084 0.083 0.106 0.107 -0.048 -0.019 0.106 0.106 0.119 0.253 0.137 0.138 0.109 0.108 0.613 0.416 0.110 0.110 0.096
plot 13
Linear 0.863 0.417 0.426 0.129 0.126 0.026 0.018 -0.054 -0.040 0.000 0.000 0.003 0.003 0.086 0.089 0.250 0.273 0.678 0.548 0.331
Logarithmic 0.509 0.621 0.707 0.101 0.096 0.089 -0.001 0.024 -0.063 -0.039 0.001 0.000 0.000 0.115 0.121 0.130 0.338 0.212 0.816 0.537
Quadratic 0.878 0.489 0.580 0.080 0.075 0.043 -0.041 -0.057 -0.113 -0.071 0.000 0.004 0.001 0.219 0.227 0.289 0.521 0.577 0.833 0.634
Power 0.521 0.571 0.666 0.093 0.083 0.084 0.004 0.039 -0.064 -0.042 0.001 0.000 0.000 0.125 0.139 0.138 0.318 0.218 0.843 0.654
S 0.226 0.512 0.611 0.009 0.003 0.044 -0.043 0.122 -0.064 -0.065 0.031 0.001 0.000 0.300 0.321 0.207 0.565 0.093 0.850 0.898
Exponential 0.876 0.345 0.363 0.121 0.111 0.026 0.024 -0.053 -0.044 -0.007 0.000 0.008 0.006 0.094 0.104 0.252 0.256 0.666 0.578 0.361
Logistic 0.876 0.345 0.363 0.121 0.111 0.026 0.024 -0.053 -0.044 -0.007 0.000 0.008 0.006 0.094 0.104 0.252 0.256 0.666 0.578 0.361
plot 14
Linear 0.346 0.523 0.603 0.447 0.462 0.020 0.000 0.532 0.485 0.430 0.010 0.001 0.000 0.003 0.002 0.273 0.333 0.001 0.002 0.003
Logarithmic 0.819 0.868 0.901 0.810 0.816 0.250 -0.019 0.853 0.823 0.785 0.000 0.000 0.000 0.000 0.000 0.028 0.412 0.000 0.000 0.000
Quadratic 0.638 0.773 0.833 0.716 0.726 0.113 -0.073 0.779 0.738 0.686 0.001 0.000 0.000 0.000 0.000 0.181 0.625 0.000 0.000 0.000
Power 0.584 0.742 0.766 0.651 0.656 0.083 -0.027 0.691 0.665 0.696 0.000 0.000 0.000 0.000 0.000 0.146 0.451 0.000 0.000 0.000
S 0.731 0.731 0.738 0.692 0.693 0.146 -0.058 0.708 0.695 0.697 0.000 0.000 0.000 0.000 0.000 0.080 0.684 0.000 0.000 0.000
Exponential 0.161 0.337 0.361 0.249 0.254 -0.030 -0.006 0.287 0.265 0.298 0.069 0.011 0.008 0.028 0.027 0.467 0.358 0.019 0.024 0.017
Logistic 0.161 0.337 0.361 0.249 0.254 -0.030 -0.006 0.287 0.265 0.298 0.069 0.011 0.008 0.028 0.027 0.467 0.358 0.019 0.024 0.017
plot 15
Linear 0.158 0.485 0.503 -0.038 -0.012 0.223 -0.041 0.148 0.103 0.053 0.064 0.001 0.001 0.528 0.382 0.032 0.533 0.071 0.113 0.189
Logarithmic 0.425 0.778 0.790 -0.062 -0.048 0.100 -0.047 0.648 0.593 0.514 0.003 0.000 0.000 0.802 0.611 0.116 0.600 0.000 0.000 0.001
Quadratic 0.159 0.695 0.675 -0.044 -0.021 0.167 -0.103 0.566 0.537 0.487 0.117 0.000 0.000 0.531 0.455 0.109 0.779 0.001 0.002 0.004
Power 0.432 0.766 0.778 -0.061 -0.045 0.107 -0.042 0.645 0.602 0.522 0.002 0.000 0.000 0.784 0.606 0.109 0.558 0.000 0.000 0.001
S 0.583 0.660 0.694 -0.064 -0.053 -0.015 -0.038 0.813 0.790 0.739 0.000 0.000 0.000 0.838 0.662 0.397 0.529 0.000 0.000 0.000
Exponential 0.156 0.438 0.448 -0.039 -0.018 0.234 -0.040 0.147 0.108 0.059 0.065 0.002 0.002 0.539 0.412 0.028 0.541 0.072 0.107 0.177
Logistic 0.156 0.438 0.448 -0.039 -0.018 0.234 -0.040 0.147 0.108 0.059 0.065 0.002 0.002 0.539 0.412 0.028 0.541 0.072 0.107 0.177
plot 16
Linear 0.310 0.343 0.387 0.392 0.529 -0.055 0.042 0.367 0.329 0.342 0.012 0.008 0.005 0.004 0.001 0.690 0.211 0.006 0.009 0.008
Logarithmic 0.388 0.763 0.794 0.841 0.886 0.049 0.091 0.842 0.818 0.820 0.004 0.000 0.000 0.000 0.000 0.196 0.127 0.000 0.000 0.000
Quadratic 0.325 0.597 0.611 0.638 0.716 -0.049 -0.013 0.632 0.603 0.595 0.025 0.001 0.001 0.000 0.000 0.550 0.430 0.000 0.001 0.001
Power 0.313 0.678 0.693 0.778 0.824 0.053 0.144 0.762 0.755 0.773 0.011 0.000 0.000 0.000 0.000 0.189 0.074 0.000 0.000 0.000

S 0.254 0.757 0.774 0.859 0.829 0.147 0.157 0.883 0.890 0.892 0.023 0.000 0.000 0.000 0.000 0.072 0.064 0.000 0.000 0.000
Exponential 0.192 0.253 0.267 0.314 0.405 -0.052 0.052 0.275 0.263 0.288 0.044 0.023 0.020 0.011 0.004 0.650 0.190 0.018 0.020 0.015
Logistic 0.192 0.253 0.267 0.314 0.405 -0.052 0.052 0.275 0.263 0.288 0.044 0.023 0.020 0.011 0.004 0.650 0.190 0.018 0.020 0.015

Supplementary Table S4. Spearman's rank correlation coefficients among the values
of the functional and species diversity indices FRic, FEve, FDiv, FDis, RaoQ, FDen,
Species richness (SR), Shannon, Simpson and Pielou's evenness for the values of the
accumulative plots. FRic is positively highly correlated (p>0.01) with RaoQ and FDen
and negatively correlated with FEve. FEve is positively highly correlated with FDiv
and negatively with FDen, while FDiv is negatively correlated with the all the three
compositional diversity indices. FDis is positively correlated with RaoQ, as expected,
as well as with FDen. RaoQ and FDen are also positively correlated with the three
compositional diversity indices, while these three indices are also positively correlated
(see Supplementary Table S3).
Index FRic FEve FDiv FDis RaoQ FDen Shannon Simpson
Pielou's
evenness
Sp
earm
an
's r
ho
co
rrel
ati
on
co
effi
cien
t
SR 0.723** -0.231** 0.031 0.581** 0.618** 0.987** 0.658** 0.464** 0.246**
FRic -0.327** 0.114 0.137 0.225* 0.795** 0.168 0.043 -0.148
FEve 0.420** -0.016 0.03 -0.254** -0.127 -0.087 0.080
FDiv -0.129 0.015 0.061 -0.321** -0.419** -0.459**
FDis 0.976** 0.487** 0.900** 0.814** 0.744**
RaoQ 0.536** 0.850** 0.754** 0.669**
FDen 0.574** 0.383** 0.160
Shannon 0.946** 0.842**
Simpson 0.945**
*Correlation significant at 0.05 level (two-tailed).
**Correlation significant at 0.01 level (two-tailed).
Supplementary Table S5. Spearman's rank correlation coefficients among the values
of the six first axis of PCoA analysis and the initial values of the 26 traits for each
species. *: Correlation is significant at the 0.05 level (2-tailed), **: Correlation
significant at the 0.01 level (2-tailed).

*Correlation significant at 0.05 level (two-tailed).
**Correlation significant at 0.01 level (two-tailed).
Sp
earm
an's
rh
o c
orr
elat
ion
coef
fici
ent
Traits
PCoA axis
1st 2nd 3rd 4th 5th 6th
Longevity 0.492** 0.526** -.238* -0.078 0.249* 0.006
Max Plant height
(mm) 0.134 0.253* 0.202 0.130 -0.145 0.032
Mean Leaf length
(mm) 0.192 0.099 0.603** 0.233* -0.154 -0.112
Mean Leaf width
(mm) -0.292** 0.443** 0.303** 0.320** -0.226* -0.064
Mean leaf
lenght/width 0.423** -0.375** 0.318** -0.039 0.101 -0.061
Life form -0.485** -0.527** 0.247* 0.088 -0.271** 0.001
Growth form -0.721** 0.108 -0.113 -0.144 -0.197 0.089
Leaf surface texture -0.361** -0.202 0.166 0.017 -0.171 0.524**
Canopy structure 0.229* -0.416** 0.349** 0.182 -0.016 -0.145
Soil acidity -0.028 -0.319** 0.350** -0.480** 0.171 -0.017
Soil nutrient content 0.236* -0.112 0.282** -0.621** -0.125 -0.090
Soil humidity 0.239* -0.131 -0.061 -0.532** 0.018 0.038
Continentality -0.458** 0.209* 0.131 0.157 -0.432** -0.304**
Soil salt content 0.069 -0.154 0.322** -0.642** -0.152 0.085
Light -0.311** 0.022 0.457** -0.061 -0.442** -0.153
Temperature 0.272** 0.076 0.304** -0.482** 0.208* 0.043
Flowering period
start (month) 0.100 0.065 0.192 0.108 0.232* 0.251*
Flowering period end
(month) 0.155 0.280** 0.410** 0.012 0.045 0.356**
Flowering period
length -0.089 0.410** 0.411** 0.120 0.255* 0.417**
Seed production -0.080 0.380** 0.190 -0.420** -0.074 -0.277**
Seed weight (g) 0.109 -0.109 0.117 -0.017 -0.152 0.217*
Seed weight (g) -0.690** 0.377** -0.182 -0.050 0.188 -0.147
Flower size -0.216* -0.336** 0.241* -0.060 0.330** -0.098
Flower sex -0.621** 0.508** -0.091 -0.005 0.143 -0.065
Pollination type -0.069 -0.620** -0.334** 0.162 0.048 -0.173
Dispersal mode 0.057 -0.313** -0.060 0.189 -0.239* 0.316**


Supplementary Figure S1. The relationship between functional diversity indices
values FRic, FDen and area for the four plant communities (Lupinus angustifolius -
Hyparrhenia hirta, Lupinus angustifolus - Helichrysum italicum, Pistacia lentiscus,
Lupinus angustifolius - Tolpis barbata), where each data point represents an
accumulative plot (FDACs). The plots’ axes are represented in a log-log scale.
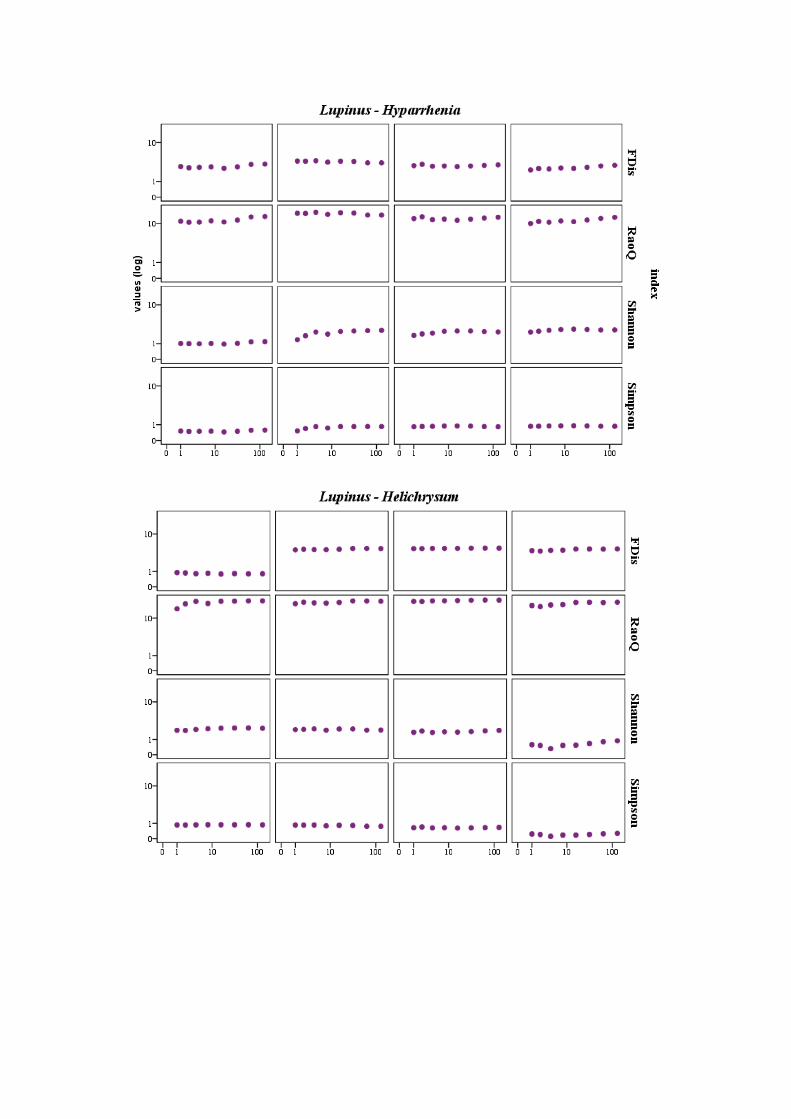
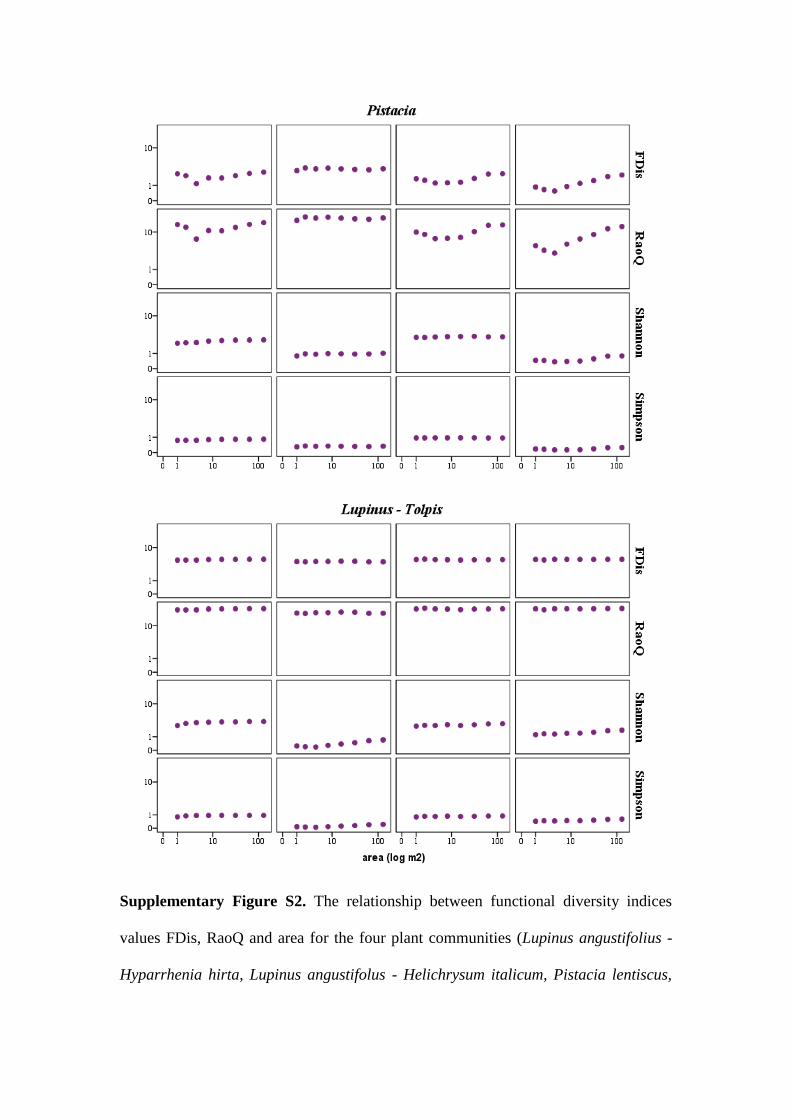
Supplementary Figure S2. The relationship between functional diversity indices
values FDis, RaoQ and area for the four plant communities (Lupinus angustifolius -
Hyparrhenia hirta, Lupinus angustifolus - Helichrysum italicum, Pistacia lentiscus,
Lupinus angustifolius - Tolpis barbata), where each data point represents an
accumulative plot (FDACs). The plots’ axes are represented in a log-log scale.

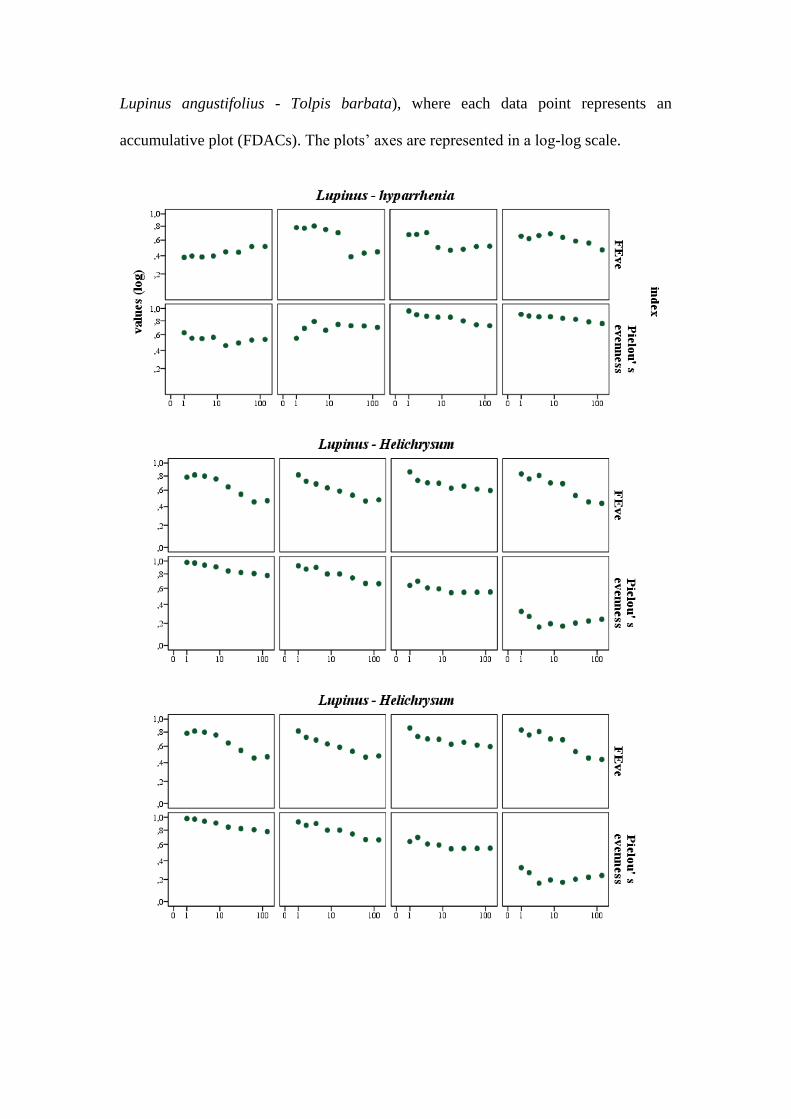
Supplementary Figure S3. The relationship between functional diversity indices
values FEve, FDis and area for the four plant communities (Lupinus angustifolius -
Hyparrhenia hirta, Lupinus angustifolus - Helichrysum italicum, Pistacia lentiscus,
Lupinus angustifolius - Tolpis barbata), where each data point represents an
accumulative plot (FDACs). The plots’ axes are represented in a log-log scale.
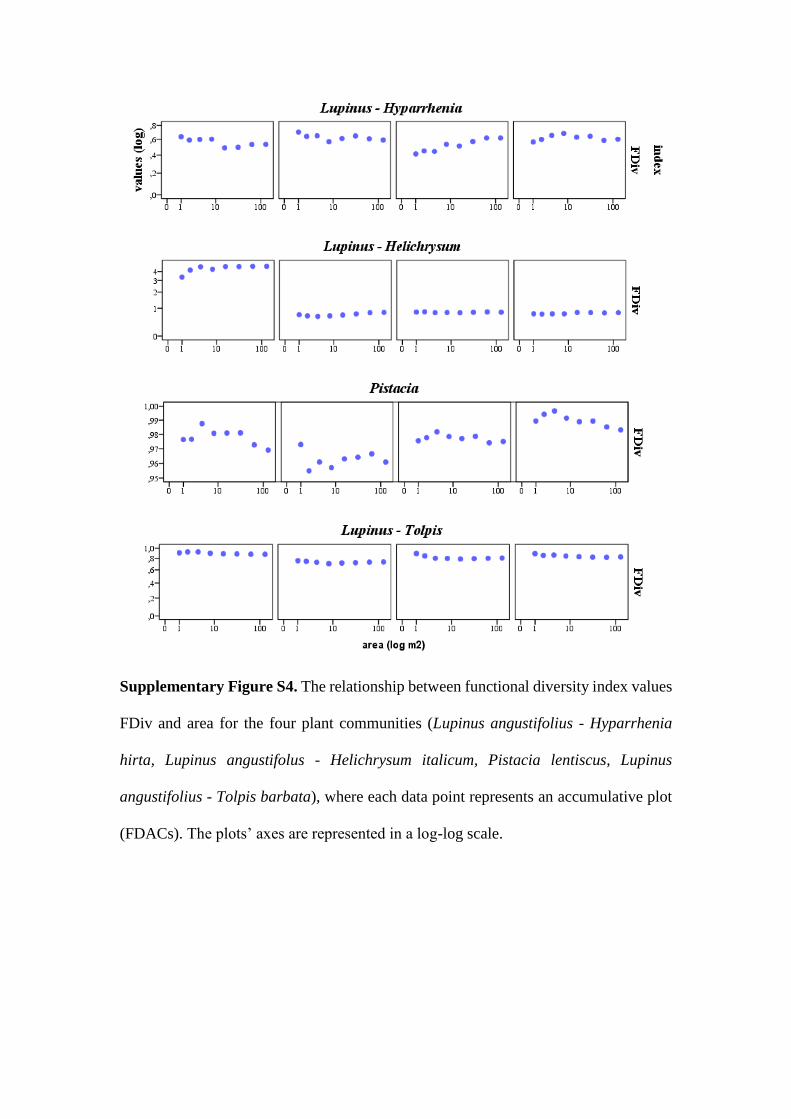
Supplementary Figure S4. The relationship between functional diversity index values
FDiv and area for the four plant communities (Lupinus angustifolius - Hyparrhenia
hirta, Lupinus angustifolus - Helichrysum italicum, Pistacia lentiscus, Lupinus
angustifolius - Tolpis barbata), where each data point represents an accumulative plot
(FDACs). The plots’ axes are represented in a log-log scale.
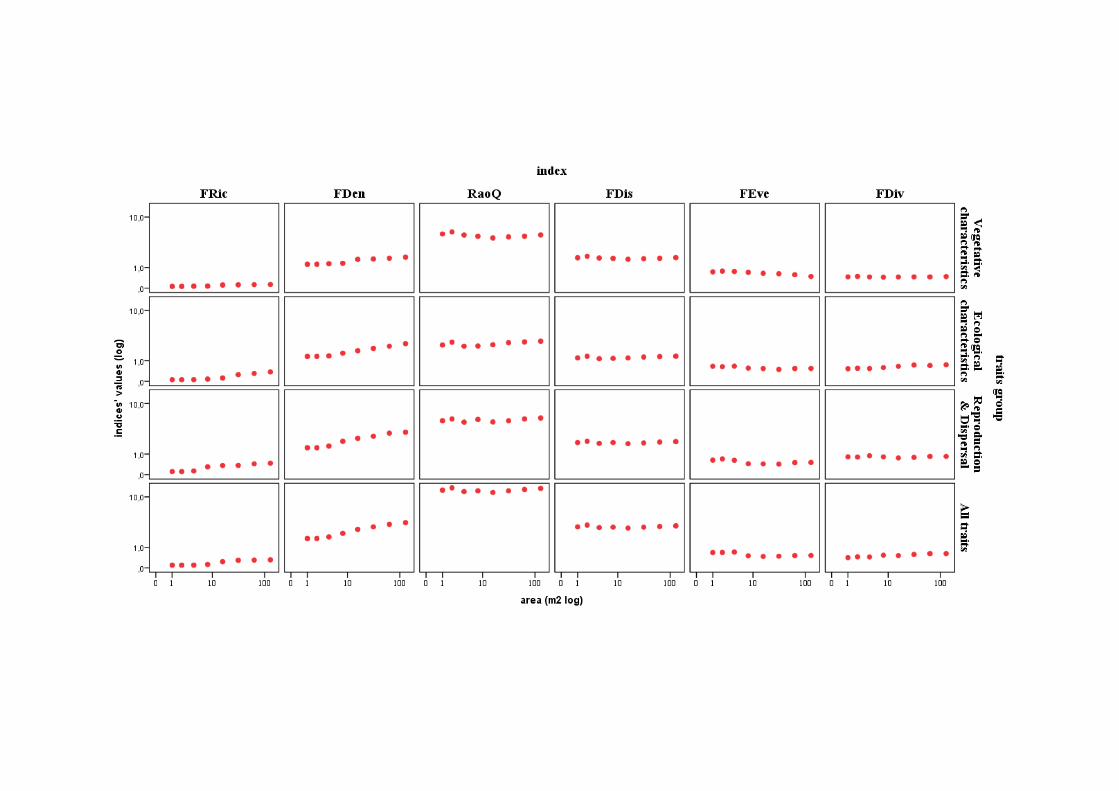

Supplementary Figure S5. The trait – based functional diversity – area relationship for the six functional diversity indices used in our analysis.
In order to investigate the effect of different types and number of traits that can be used in calculating functional diversity, we used four different
traits data sets to calculate the FD indices. The first group consisted of the vegetative characteristics, the second of the ecological characteristics,
the third group consisted of the reproduction and dispersal characteristics and the last one included all functional traits. We found no significant
differentiation in the FDAR pattern, with the exception of the FDiv index that displayed some variation in small scales. The plots’ axes are
represented in a log-log scale.