Embed Size (px)
Citation preview
9th International Scientific Conference
“Business and Management 2016” May 12–13, 2016, Vilnius, LITHUANIA
http://www.bm.vgtu.lt
eISSN 2029-929X
eISBN 978-609-457-921-9
Article ID: bm.2016.38
http://dx.doi.org/10.3846/bm.2016.38
© 2016 The Authors. Published by VGTU Press. This is an open-access article distributed under the terms of the Creative Com-mons Attribution License (CC-BY 4.0), which permits unrestricted use, distribution, and reproduction in any medium, provided the original author and source are credited.
FUNCTIONAL AND PERSONAL INCOME DISTRIBUTION IN THE BALTICS:
COMPARISON OF NATIONAL AND HOUSEHOLDS ACCOUNTS
Jekaterina Navickė1, Romas Lazutka2
1Faculty of Philosophy, Vilnius University, Universiteto g. 9/1, Vilnius, Lithuania 2Faculty of Economics, Vilnius University, Saulėtekio al. 9, Vilnius, Lithuania
E-mails: [email protected] (corresponding author); [email protected]
Abstract. In this paper we aim to cover the gap in analysis of functional distribution of National income at
the macroeconomic level and personal income distribution at the microlevel. We compare the information
provided in the National Accounts and in the EU Survey on Income and Living Conditions (EU-SILC) for
the three Baltic states and in a wider EU context to establish the links between the economic prosperity at
the macro level and income distribution at individual level. Comparative design helps identify differences
in income structure and inequality within similar socio-economic conditions. As demonstrated, similar
levels of per capita disposable incomes in the National Accounts in the Baltics hide higher levels of in-
come inequality than conventionally shown in the EU-SILC. This is to a large degree due to high level of
under-reporting of property income and is most acute for Lithuania.
Keywords: income distribution, National accounts, household income, SILC, Baltics, property income.
JEL Classification: D31; D63; E01; O11; O12.
1. Introduction
The Report of the Commission on the Measure-
ment of Economic Performance and Social Pro-
gress (Stiglitz et al. 2010) provided 14 recommen-
dations to improve the measurement of societal
progress. It argued for moving away from existing
narrow economic measures such as Gross Domes-
tic Product (GDP) to a broader range of indicators
that better reflect multi-dimensional aspects of
quality of life and well-being. The above men-
tioned Stiglitz Report recommends to “emphasise
the household perspective” and to “give more
prominence to the distribution of income, con-
sumption and wealth”. Arguably, the national ag-
gregates and per capita averages of economic
growth may mask the rise in living standards for
some population groups and no change or declin-
ing living standards for others. The idea of linking
functional and personal distributions of income
was endorsed by major institutions such as the
OECD (Fesseau et al. 2013) and the European
Commission (Eurostat 2013a) and was widely sup-
ported within the academic field (see Section 2).
Three Baltic countries are the examples of suc-
cessful economic integration into the richest part of
the world. Their GDPs per capita in purchasing pow-
er parities have grown within the last two decades
from around ½ to ¾ of the EU average.1 Neverthe-
less, these countries remain among those with the
lowest wages, pensions and disposable household
income. These are also among the EU countries with
highest rates of income inequality and poverty (So-
cial Situation Monitor 2016). Hence, the case of the
Baltics is particularly topical in the context of the
Stiglitz Report and recommendations.
In this paper we aim to cover gaps in analysis of
the functional and personal income distribution in the
Baltics by comparing national and household-level
accounts.
We compare the data on the functional income
distribution from the National Accounts (NA) with
the information on the personal income distribution
available in the main synchronized source of micro
level information at the EU level – EU Survey on
Income and Living Conditions (EU-SILC). By unit-
ing those two data sources the links between the eco-
nomic growth on the macro level and income distri-
bution on individual level can be revealed and
analysed. Comparative design of the study helps
identify differences in structure and dynamics of in-
come on macro and micro level within similar socio-
economic contexts. We use cross-country and de-
composition analysis for evaluation.
1 Calculations by the authors based on Eurostat (2016a).

J. Navickė, R. Lazutka
2
The structure of the paper is as follows. In Sec-
tion 2 we review the literature and previous studies
on the functional and personal distribution of in-
comes. Next, methodological issues related to the
comparison of the data provided by NA and EU-
SILC are presented. The results of the analysis are
presented in Section 4. Paper concludes with the dis-
cussion of the main findings and both substantial and
technical implications of reconciling micro and mac-
ro level accounts of income.
2. Links between functional and personal in-
come distribution
The inquiry into the functional distribution of in-
come – a topic investigated by the classics in eco-
nomics A.Smith, D.Ricardo, T.R. Malthus (Atkin-
son 2009) – has come back on the economic
research agenda with significant contributions by
Glyn (2009), Dagum (1999), Bentolila and Saint
Paul (2003), Gollin (2002), Feldstein (2008),
Dafermosa and Papatheodoroub (2015), but also
with the papers of IMF (2007) and the European
Commission (2007). Equally, those concerned with
the personal distribution have emphasized that
there is no direct link of personal income accounts
with factor shares. Atkinson (2009) agreed with
Glyn (2009) in arguing why functional distribution
of incomes is on today’s research agenda, i.e.:
− to make a link between incomes at the
macroeconomic level (national accounts)
and incomes at the level of the household;
− to help understand inequality in the per-
sonal distribution of income;
− to address the concern of social justice
with the fairness of different sources of in-
come.
Functional income distribution is reflected in
the estimates of the National Income (NI) and
GDP. It is understood as incomes that are shared
between the owners of production factors, i.e. la-
bour, capital and land (Atkinson 2009). At a micro
level personal incomes are measured using repre-
sentative surveys on household incomes and living
conditions (e.g. EU-SILC), or household budget
surveys. However it has been noticed that incomes
of populations subgroups, even the large ones, of-
ten diverge and lag behind the economic growth
reflected at the macro level through GDP and NI
(Bivens et al. 2014). As prompted by Atkinson:
“The link between macro and micro is essential,
and economics has suffered from allowing these to
go their separate ways. Empirically, the national
accounts need to be brought closer to micro-data
on households” (Atkinson 2009).
The inconsistencies between the macro and
micro level accounts on income are both technical
and substantial. Technically, over the years macro
and micro statisticians have tended to work sepa-
rately leading to sometimes divergent results which
can cause problem to users. The recent studies
conducted by OECD (Fesseau et al. 2013) and
Eurostat (2013a) highlight non-negligible differ-
ences between National accounts and survey data
in terms of concepts and due to different data col-
lection methods. Substantially, there is a question
on the relation between the personal and functional
income distribution. The question on how the eco-
nomic growth is distributed and redistributed
among households is both of academic and politi-
cal interest and concern (Atkinson et al. 2011;
Cingano 2014; Davis, Mishel 2014; Atkinson et al.
2011; Halter et al. 2014; OECD 2013; Ostry et al.
2014).
Indeed, inconsistencies and relation between the
functional and personal income distribution is not
only academically, but also politically relevant and
sensitive. The NA framework provides no distribu-
tional information on income, critical for the design
of economic and social policies. Surveys, such as the
EU-SILC serve as main tool for social policy analy-
sis, providing information about the distribution of
income on the individual level. Hence the study of
the income differences observed at the macro and
micro levels may contribute to better informed deci-
sions on the development of socio-economic policies.
In this article we focus on making a link be-
tween incomes at the macroeconomic level and
incomes at the level of the household. Two reports
of international institutions are essential for that.
First, OECD publication “A Cross-Country Com-
parison of Household Income, Consumption and
Wealth Between Micro Sources and National Ac-
counts Aggregates” (Fesseau et al. 2013) and sec-
ond – Eurostat report “The distribution of house-
hold sector accounts by category of household”
(Eurostat 2013a).
OECD (Fesseau et al. 2013) paper presents a
detailed picture of the extent to which statistical in-
formation derived from micro sources can be aligned
to three national accounts aggregates (income, con-
sumptions and wealth); 20 countries studied all (or
part) of the components of adjusted disposable in-
come. It showed that although micro data sources did
not provide information for all components of house-
hold economic resources as defined in the NA, they
provide information for most of the major compo-
nents of the national accounts aggregates; although
with some major gaps. As stated in the report: “Re-
sults show that there are a number of identified rea-
FUNCTIONAL AND PERSONAL INCOME DISTRIBUTION IN THE BALTICS:
COMPARISON OF NATIONAL AND HOUSEHOLDS ACCOUNTS
3
sons that can explain differences between micro and
macro sources. Some of them were quantified and
isolated showing finally that for most countries micro
sources provide distributive information for most of
the national accounts components but for some of
them with quite significant gaps in total amounts”.
(Fesseau et al. 2013)
Eurostat report (2013a) provides results of simi-
lar exercise for the EU countries. The objective was
to develop comparable indicators of the distribution
of income, consumption and wealth that are con-
sistent with the national-level information in the NA.
The report by Eurostat focussed on the use of harmo-
nised sources from within the European Statistical
System. It investigated the similarities and differ-
ences between EU-SILC and NA data for household
income. The breakdown exercise used data from EU-
SILC and the NA for one income reference year
(2008) to produce results for 26 of the EU-27 mem-
ber states (Eurostat 2013a).
The latter study also revealed gaps and dispari-
ties between NA and survey estimates of incomes
differed by source, across countries and income quin-
tiles. By income source fair degree of alignment was
noted between micro and macro totals for wages,
salaries and cash social benefits. Highest inconsisten-
cies and limited alignment was stressed for property
income, while mixed income, taxes and social insur-
ance contributions enjoyed a moderate degree of fit.
Property income was demonstrated to be substantial-
ly under-reported in the survey data compared to the
NA. Same concerns mixed incomes, taxes and social
insurance contributions, although to a lesser extent.
These findings are consistent with the results reported
by the OECD. Importantly, Lithuania and Latvia
stood out as the countries with the highest average
gaps in the income aggregates as depicted in SILC
versus NA; Lithuania also ranked worst according to
disparity of the two data sources by income quintile.
Estonia was among countries with moderate dispari-
ties between SILC and NA estimates and among 10
EU countries with lowest gap in the NA income ag-
gregate derived based on SILC (at around 15%, ver-
sus around 23% in Latvia and 36% in Lithuania).
The above results raise a number of further
questions. First, different degree of alignment of in-
comes by source and substantial under-reporting of
property and mixed income at micro level may have
a substantial impact on cross-country comparisons.
For example, the share of the compensation for capi-
tal versus labour is known to be substantially higher
in the Baltics compared to the old EU-member states
(Razgūnė, Lazutka 2015). Hence the Baltics may be
better-off at the household level than it is reflected in
the surveys. It would be interesting to know how the
countries rank according to micro versus macro per
capita income estimates. Second, the previous studies
only included separate data points in time. It would
be important to see if the gaps and disparities in the
micro-macro estimates are stable across years or are
subject to year-on-year change. This would give an
impression of either the differences in the micro-
macro estimates are systematic (and hence can be
adjusted for) or random (e.g. due to survey errors or
changes in data collection and estimation proce-
dures). Finally, ways to adjust for disparities would
be both of academic interest and political relevance.
The raised questions are further analysed aiming to
expand previous findings and cover the gaps in the
existing knowledge on functional and personal in-
come distribution in the Baltics.
3. Data and methodology
EU-SILC is a multi-purpose instrument launched in
2003, which focuses mainly on income on micro lev-
el. Detailed data are collected on income components
with a target population of non-institutional house-
holds. EU-SILC is not specifically a survey, rather it
relies on the idea of a “framework” and the underpin-
ning legislation common guidelines, procedures and
classifications define the harmonised lists of target
variables to be transmitted to Eurostat (2016b). EU-
SILC is the main source of data for constructing har-
monized socio-economic indicators and distributional
statistics across the EU.
National Accounts are statistics focusing on the
structure and evolution of national economies. They
provide a framework for numerically describing and
analysing, in an accessible and reliable way, the large
number of economic interactions within an economy
as a whole and for different sectors, including the
“household sector”.2 In Europe, the international
standards for national accounting are defined in the
European System of Accounts (ESA). This analysis
refers to ESA 2010 definitions (Eurostat 2013b).
We reconciled EU-SILC and NA data following
methodology described in Eurostat (2013a) and in
line with a methodological study by OECD (2015),
albite with some exceptions. The reconciliation pro-
cedure included:
a. In EU-SILC, the income reference period is
the year prior to the data collection for most
countries (except Ireland and UK), Hence in-
formation on income in EU-SILC was
2 In National Accounts the economy is divided into five mutu-
ally exclusive institutional sectors: a) Non-financial corpora-
tions sector, b) Financial corporations sector, c) General gov-
ernment sector, d) Household sector and, e) Non-profit
institutions serving households (NPISHs) sector.
J. Navickė, R. Lazutka
4
lagged by one year when comparing to NA
data.
b. EU-SILC per capita values were produced
by dividing aggregate values by the weighted
EU-SILC target population number. While
the reference populations differ in the two
data sources, no adjustments were performed
to correct for this. SILC data excludes popu-
lation living in institutional and collective
accommodation. As reported by Eurostat
(2013a) the share of institutional population
is at around or below 2% in the vast majority
of the EU member. For the Baltics, this share
was reported to be 0.7% for Lithuania, 1%
for Latvia and 1.2% for Estonia. Hence, the
resulting discrepancy is expected to be non-
significant.
c. Reconciliation by income component was
carried in five categories as identified in Eu-
rostat (2013a): gross wages and salaries;
mixed income and operating surplus; proper-
ty income; social benefits in cash; current
taxes and social insurance contributions. In
order to reconcile with NA estimates, the in-
come concepts include components that have
been excluded from the standard EU-SILC
income concept, i.e.: imputed rents (part of
gross operating surplus in the NANA); non-
cash employee income other than company
car (part of compensation for employees in
the NA); value of goods produced for own
consumption (part of mixed income in the
NA); interest payments on mortgage (part of
property income paid in the NA). For de-
tailed list of variables under each income
component see Eurostat (2013a).
Two main indicators are used for looking at
coverage and discrepancies between the two data
sources. First, the coverage rate (CR) shows the
extent to which the total amounts from the EU-
SILC and the NA match with each other, when
using similar definitions. For each NA income
component x and country z the coverage rate is
calculated as follows:
, _ _
,
,
· *100
x z weighted totalx t
x z
EU SILCCR
NA= , (1)
where the weighted total of the formula refers to
variables grossed-up to the EU-SILC target popu-
lation.
At the aggregate level a simple coverage rate
can be of little help in quantifying the extent of the
match between EU-SILC and NA because of the
possibility of some income components with a
negative difference offsetting other income com-
ponents with a positive difference. To quantify dif-
ferences at the level of NA aggregates, the average
gap indicator (AGI) is estimated. Following Euro-
stat (2013a) this indicator is computed as weighted
average of the differences between the micro and
macro amounts across the different components of
the NA aggregate. With the same notation as used
for coverage rates, the average gap indicator AGI
for the country z is calculated as follows:
,
,
1 ,1
* 100
kx z
z x zk
x x zx
NA
AGI CR
NA=
=
= −∑∑
, (2)
where: the NA aggregate is made up of a given
number of components k and ,
,1
x z
k
x zx
NA
NA=∑
is a
weight for each of the components.
4. Findings
Below the main findings are presented on the three
questions raised after discussing the current state
of research on reconciliation of micro and micro
data on income distribution. First, we look at how
the countries rank according to micro versus macro
per capita income estimates. Second, the analysis
looks at whether the gaps and disparities in the mi-
cro-macro income estimates are stable or volatile
across years. Finally, we look at ways to adjust for
disparities of income at micro and macro level and
its impact on inequality measures and cross coun-
try orderings of the three Baltic countries.
4.1. Differences in country orderings: a macro-
micro divide?
Within the EU context the two most common
measures used for measuring and comparing eco-
nomic performance at the national and personal
levels are, correspondingly, the GDP per capita
presented in NA and disposable income calculated
based on the EU-SILC. GDP per capita is a much
wider concept of income compared to disposable
income, i.e. incorporating depreciation, indirect ta-
xes, employer contributions, etc. Figure 1 demon-
strates how these two micro and macro level
measures compare.
As shown in Figure 1, there is a wide gap
comparing the GDP per capita and mean net dis-
posable income. The latter estimate is at a level
around twice below the GDP per capita (coverage
rate at 47.5% on average). Nevertheless, the ranking
FUNCTIONAL AND PERSONAL INCOME DISTRIBUTION IN THE BALTICS:
COMPARISON OF NATIONAL AND HOUSEHOLDS ACCOUNTS
5
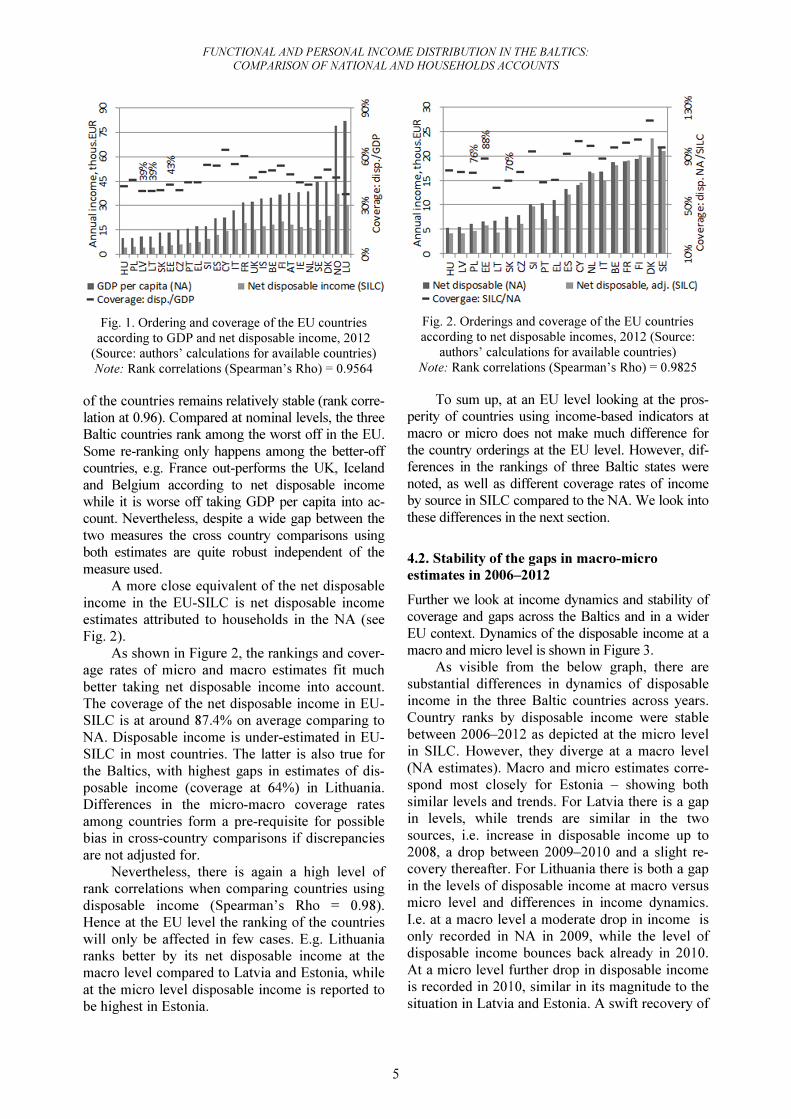
Fig. 1. Ordering and coverage of the EU countries
according to GDP and net disposable income, 2012
(Source: authors’ calculations for available countries)
Note: Rank correlations (Spearman’s Rho) = 0.9564
of the countries remains relatively stable (rank corre-
lation at 0.96). Compared at nominal levels, the three
Baltic countries rank among the worst off in the EU.
Some re-ranking only happens among the better-off
countries, e.g. France out-performs the UK, Iceland
and Belgium according to net disposable income
while it is worse off taking GDP per capita into ac-
count. Nevertheless, despite a wide gap between the
two measures the cross country comparisons using
both estimates are quite robust independent of the
measure used.
A more close equivalent of the net disposable
income in the EU-SILC is net disposable income
estimates attributed to households in the NA (see
Fig. 2).
As shown in Figure 2, the rankings and cover-
age rates of micro and macro estimates fit much
better taking net disposable income into account.
The coverage of the net disposable income in EU-
SILC is at around 87.4% on average comparing to
NA. Disposable income is under-estimated in EU-
SILC in most countries. The latter is also true for
the Baltics, with highest gaps in estimates of dis-
posable income (coverage at 64%) in Lithuania.
Differences in the micro-macro coverage rates
among countries form a pre-requisite for possible
bias in cross-country comparisons if discrepancies
are not adjusted for.
Nevertheless, there is again a high level of
rank correlations when comparing countries using
disposable income (Spearman’s Rho = 0.98).
Hence at the EU level the ranking of the countries
will only be affected in few cases. E.g. Lithuania
ranks better by its net disposable income at the
macro level compared to Latvia and Estonia, while
at the micro level disposable income is reported to
be highest in Estonia.
Fig. 2. Orderings and coverage of the EU countries
according to net disposable incomes, 2012 (Source:
authors’ calculations for available countries)
Note: Rank correlations (Spearman’s Rho) = 0.9825
To sum up, at an EU level looking at the pros-
perity of countries using income-based indicators at
macro or micro does not make much difference for
the country orderings at the EU level. However, dif-
ferences in the rankings of three Baltic states were
noted, as well as different coverage rates of income
by source in SILC compared to the NA. We look into
these differences in the next section.
4.2. Stability of the gaps in macro-micro
estimates in 2006–2012
Further we look at income dynamics and stability of
coverage and gaps across the Baltics and in a wider
EU context. Dynamics of the disposable income at a
macro and micro level is shown in Figure 3.
As visible from the below graph, there are
substantial differences in dynamics of disposable
income in the three Baltic countries across years.
Country ranks by disposable income were stable
between 2006–2012 as depicted at the micro level
in SILC. However, they diverge at a macro level
(NA estimates). Macro and micro estimates corre-
spond most closely for Estonia – showing both
similar levels and trends. For Latvia there is a gap
in levels, while trends are similar in the two
sources, i.e. increase in disposable income up to
2008, a drop between 2009–2010 and a slight re-
covery thereafter. For Lithuania there is both a gap
in the levels of disposable income at macro versus
micro level and differences in income dynamics.
I.e. at a macro level a moderate drop in income is
only recorded in NA in 2009, while the level of
disposable income bounces back already in 2010.
At a micro level further drop in disposable income
is recorded in 2010, similar in its magnitude to the
situation in Latvia and Estonia. A swift recovery of
J. Navickė, R. Lazutka
6
income recoded in NA for Latvia and Lithuania
result in the re-ranking of the country to perform
best among the three Baltic States, while at a micro
level this is not the case.
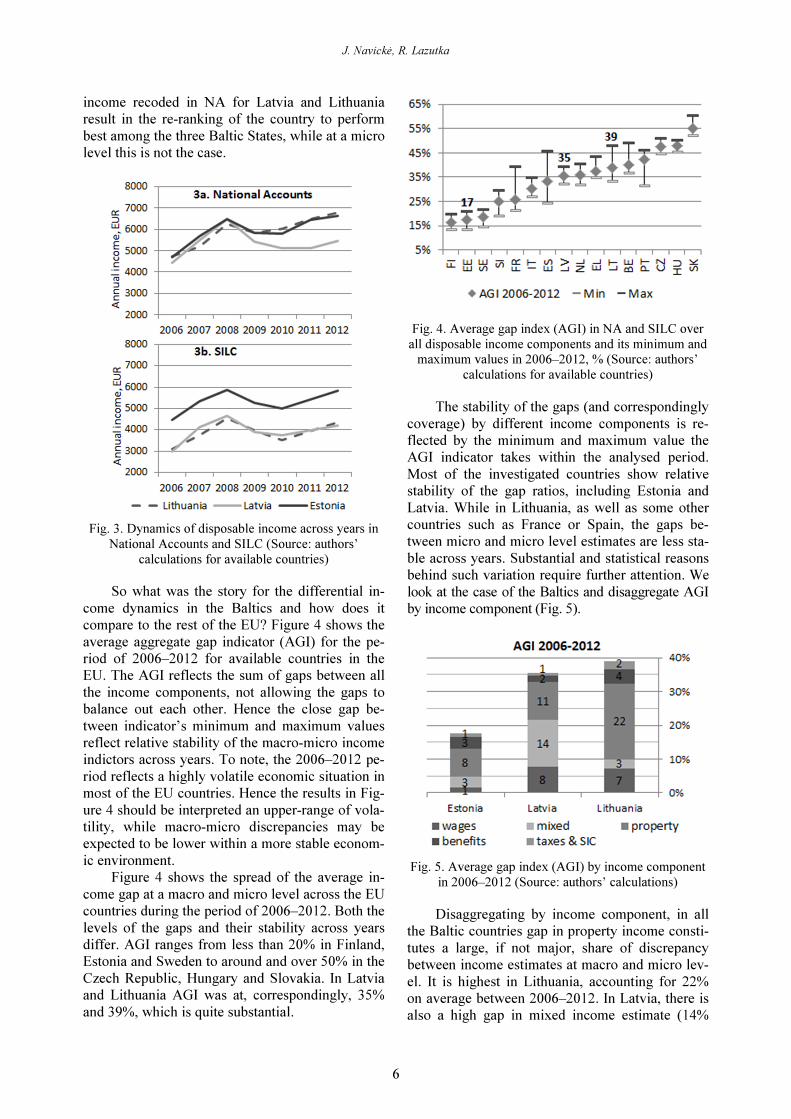
Fig. 3. Dynamics of disposable income across years in
National Accounts and SILC (Source: authors’
calculations for available countries)
So what was the story for the differential in-
come dynamics in the Baltics and how does it
compare to the rest of the EU? Figure 4 shows the
average aggregate gap indicator (AGI) for the pe-
riod of 2006–2012 for available countries in the
EU. The AGI reflects the sum of gaps between all
the income components, not allowing the gaps to
balance out each other. Hence the close gap be-
tween indicator’s minimum and maximum values
reflect relative stability of the macro-micro income
indictors across years. To note, the 2006–2012 pe-
riod reflects a highly volatile economic situation in
most of the EU countries. Hence the results in Fig-
ure 4 should be interpreted an upper-range of vola-
tility, while macro-micro discrepancies may be
expected to be lower within a more stable econom-
ic environment.
Figure 4 shows the spread of the average in-
come gap at a macro and micro level across the EU
countries during the period of 2006–2012. Both the
levels of the gaps and their stability across years
differ. AGI ranges from less than 20% in Finland,
Estonia and Sweden to around and over 50% in the
Czech Republic, Hungary and Slovakia. In Latvia
and Lithuania AGI was at, correspondingly, 35%
and 39%, which is quite substantial.
Fig. 4. Average gap index (AGI) in NA and SILC over
all disposable income components and its minimum and
maximum values in 2006–2012, % (Source: authors’
calculations for available countries)
The stability of the gaps (and correspondingly
coverage) by different income components is re-
flected by the minimum and maximum value the
AGI indicator takes within the analysed period.
Most of the investigated countries show relative
stability of the gap ratios, including Estonia and
Latvia. While in Lithuania, as well as some other
countries such as France or Spain, the gaps be-
tween micro and micro level estimates are less sta-
ble across years. Substantial and statistical reasons
behind such variation require further attention. We
look at the case of the Baltics and disaggregate AGI
by income component (Fig. 5).
Fig. 5. Average gap index (AGI) by income component
in 2006–2012 (Source: authors’ calculations)
Disaggregating by income component, in all
the Baltic countries gap in property income consti-
tutes a large, if not major, share of discrepancy
between income estimates at macro and micro lev-
el. It is highest in Lithuania, accounting for 22%
on average between 2006–2012. In Latvia, there is
also a high gap in mixed income estimate (14%
FUNCTIONAL AND PERSONAL INCOME DISTRIBUTION IN THE BALTICS:
COMPARISON OF NATIONAL AND HOUSEHOLDS ACCOUNTS
7
between 2006–2012). Furthermore wages, taxes
and social insurance contributions are underesti-
mated in Lithuania and Latvia by further 9% on
average between 2006–2012. Benefits are reflected
most accurately in all three countries with a dis-
crepancy of 2–4%. The fact that property income is
poorly reflected in the micro level surveys has pre-
viously been documented both for the Baltics and
in a wider EU context (e.g. Eurostat 2013a). Simi-
lar, but to a lesser extend concerns self-employ-
ment income. So what if we adjust for discrepan-
cies? And how would it help explain the macro-
micro divide in income based indicators of eco-
nomic performance across the three Baltic states?
4.3. Distributional implications of adjusting
micro-level income towards NA
There is little if no research on a distributionally
sensitive way to align income as reported at micro
and macro levels. Previous attempts by Eurostat
(2013a) and OECD (2013) were performed in a
distributionally neutral proportional way, aligning
incomes by population groups in some cases. Dis-
tributionally neutral adjustments are transparent
and easy to implement. However, they may not
account for different degree of inequality of in-
come by source. E.g. property income is known to
be distributed more unequally compared to wages
and salaries. While more research is needed to per-
form distributionally sensitive adjustments, we
further adjust incomes as reported in the EU-SILC
to cover the gaps with the macro level aggregates.
All income components in the EU-SILC are ad-
justed proportionally across the board to match the
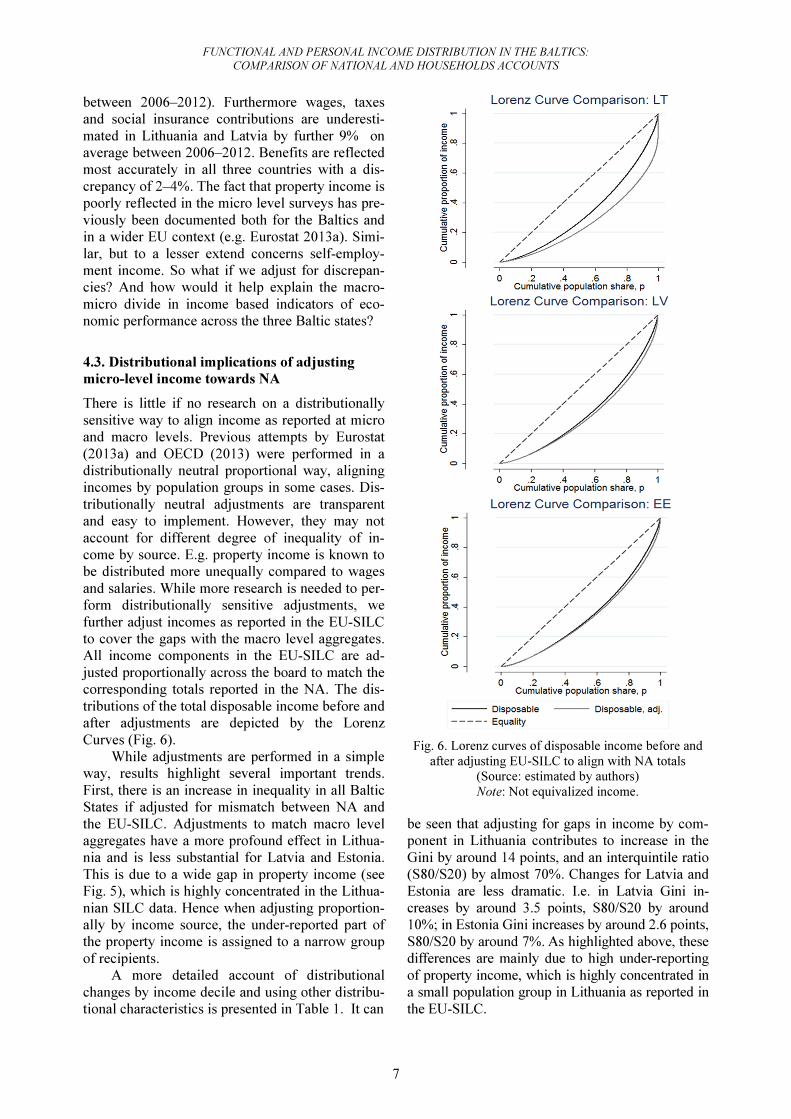
corresponding totals reported in the NA. The dis-
tributions of the total disposable income before and
after adjustments are depicted by the Lorenz
Curves (Fig. 6).
While adjustments are performed in a simple
way, results highlight several important trends.
First, there is an increase in inequality in all Baltic
States if adjusted for mismatch between NA and
the EU-SILC. Adjustments to match macro level
aggregates have a more profound effect in Lithua-
nia and is less substantial for Latvia and Estonia.
This is due to a wide gap in property income (see
Fig. 5), which is highly concentrated in the Lithua-
nian SILC data. Hence when adjusting proportion-
ally by income source, the under-reported part of
the property income is assigned to a narrow group
of recipients.
A more detailed account of distributional
changes by income decile and using other distribu-
tional characteristics is presented in Table 1. It can
Fig. 6. Lorenz curves of disposable income before and
after adjusting EU-SILC to align with NA totals
(Source: estimated by authors)
Note: Not equivalized income.
be seen that adjusting for gaps in income by com-
ponent in Lithuania contributes to increase in the
Gini by around 14 points, and an interquintile ratio
(S80/S20) by almost 70%. Changes for Latvia and
Estonia are less dramatic. I.e. in Latvia Gini in-
creases by around 3.5 points, S80/S20 by around
10%; in Estonia Gini increases by around 2.6 points,
S80/S20 by around 7%. As highlighted above, these
differences are mainly due to high under-reporting
of property income, which is highly concentrated in
a small population group in Lithuania as reported in
the EU-SILC.
J. Navickė, R. Lazutka
8
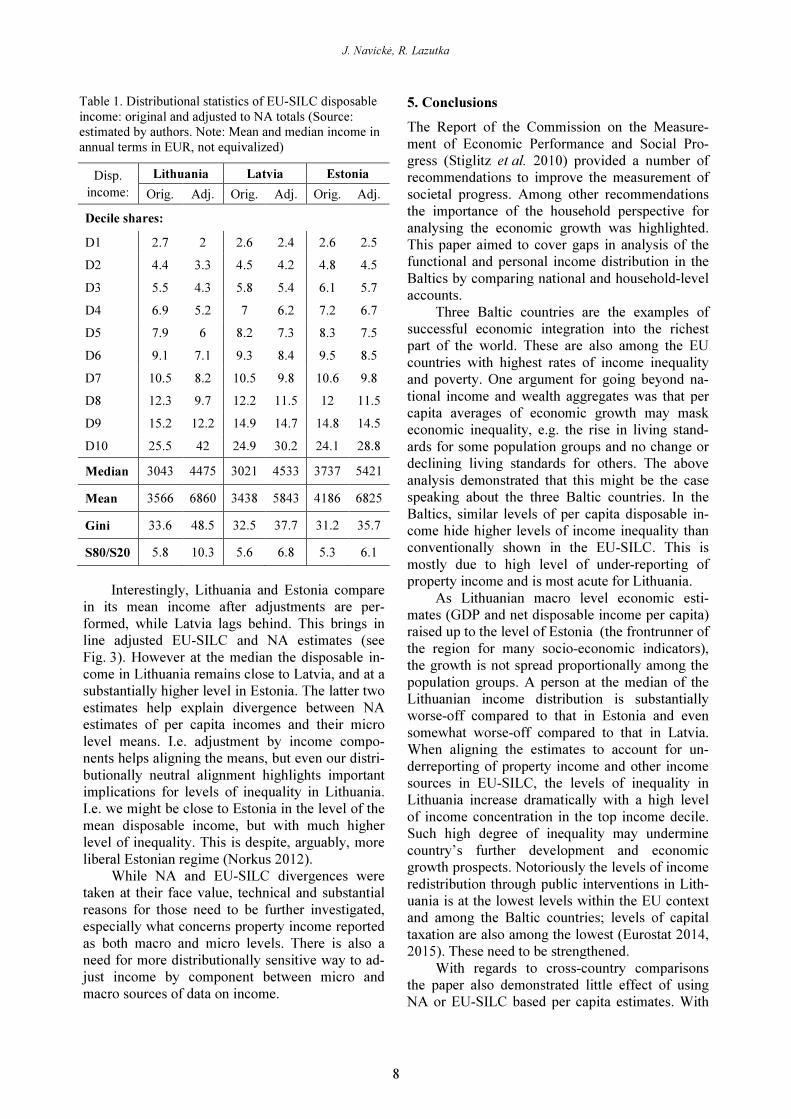
Table 1. Distributional statistics of EU-SILC disposable
income: original and adjusted to NA totals (Source:
estimated by authors. Note: Mean and median income in
annual terms in EUR, not equivalized)
Disp.
income:
Lithuania Latvia Estonia
Orig. Adj. Orig. Adj. Orig. Adj.
Decile shares:
D1 2.7 2 2.6 2.4 2.6 2.5
D2 4.4 3.3 4.5 4.2 4.8 4.5
D3 5.5 4.3 5.8 5.4 6.1 5.7
D4 6.9 5.2 7 6.2 7.2 6.7
D5 7.9 6 8.2 7.3 8.3 7.5
D6 9.1 7.1 9.3 8.4 9.5 8.5
D7 10.5 8.2 10.5 9.8 10.6 9.8
D8 12.3 9.7 12.2 11.5 12 11.5
D9 15.2 12.2 14.9 14.7 14.8 14.5
D10 25.5 42 24.9 30.2 24.1 28.8
Median 3043 4475 3021 4533 3737 5421
Mean 3566 6860 3438 5843 4186 6825
Gini 33.6 48.5 32.5 37.7 31.2 35.7
S80/S20 5.8 10.3 5.6 6.8 5.3 6.1
Interestingly, Lithuania and Estonia compare
in its mean income after adjustments are per-
formed, while Latvia lags behind. This brings in
line adjusted EU-SILC and NA estimates (see
Fig. 3). However at the median the disposable in-
come in Lithuania remains close to Latvia, and at a
substantially higher level in Estonia. The latter two
estimates help explain divergence between NA
estimates of per capita incomes and their micro
level means. I.e. adjustment by income compo-
nents helps aligning the means, but even our distri-
butionally neutral alignment highlights important
implications for levels of inequality in Lithuania.
I.e. we might be close to Estonia in the level of the
mean disposable income, but with much higher
level of inequality. This is despite, arguably, more
liberal Estonian regime (Norkus 2012).
While NA and EU-SILC divergences were
taken at their face value, technical and substantial
reasons for those need to be further investigated,
especially what concerns property income reported
as both macro and micro levels. There is also a
need for more distributionally sensitive way to ad-
just income by component between micro and
macro sources of data on income.
5. Conclusions
The Report of the Commission on the Measure-
ment of Economic Performance and Social Pro-
gress (Stiglitz et al. 2010) provided a number of
recommendations to improve the measurement of
societal progress. Among other recommendations
the importance of the household perspective for
analysing the economic growth was highlighted.
This paper aimed to cover gaps in analysis of the
functional and personal income distribution in the
Baltics by comparing national and household-level
accounts.
Three Baltic countries are the examples of
successful economic integration into the richest
part of the world. These are also among the EU
countries with highest rates of income inequality
and poverty. One argument for going beyond na-
tional income and wealth aggregates was that per
capita averages of economic growth may mask
economic inequality, e.g. the rise in living stand-
ards for some population groups and no change or
declining living standards for others. The above
analysis demonstrated that this might be the case
speaking about the three Baltic countries. In the
Baltics, similar levels of per capita disposable in-
come hide higher levels of income inequality than
conventionally shown in the EU-SILC. This is
mostly due to high level of under-reporting of
property income and is most acute for Lithuania.
As Lithuanian macro level economic esti-
mates (GDP and net disposable income per capita)
raised up to the level of Estonia (the frontrunner of
the region for many socio-economic indicators),
the growth is not spread proportionally among the
population groups. A person at the median of the
Lithuanian income distribution is substantially
worse-off compared to that in Estonia and even
somewhat worse-off compared to that in Latvia.
When aligning the estimates to account for un-
derreporting of property income and other income
sources in EU-SILC, the levels of inequality in
Lithuania increase dramatically with a high level
of income concentration in the top income decile.
Such high degree of inequality may undermine
country’s further development and economic
growth prospects. Notoriously the levels of income
redistribution through public interventions in Lith-
uania is at the lowest levels within the EU context
and among the Baltic countries; levels of capital
taxation are also among the lowest (Eurostat 2014,
2015). These need to be strengthened.
With regards to cross-country comparisons
the paper also demonstrated little effect of using
NA or EU-SILC based per capita estimates. With
FUNCTIONAL AND PERSONAL INCOME DISTRIBUTION IN THE BALTICS:
COMPARISON OF NATIONAL AND HOUSEHOLDS ACCOUNTS
9
regards to the prosperity of countries across the EU
using income-based indicators at macro or micro
does not make much difference. However, differ-
ent coverage rates of income by source were noted
in the EU-SILC compared to the NA. Accounting
for gaps in coverage of income components in EU-
SILC may substantially change the picture of the
socio-economic progress in the EU, especially for
countries with higher shares of capital and property
income. Detailed study of the income differences
observed at the macro and micro levels may con-
tribute to better informed decisions on the devel-
opment of socio-economic policies.
From a methodological point of view there is
a need to gather more robust detailed information
on property income in the EU-SILC. Within the
Baltic context this is especially topical for Lithua-
nia. Also alignment of EU-SILC components with
NA aggregates should be considered, e.g. when
constructing survey population weights. Proce-
dures to adjust micro and macro data in distribu-
tionally sensitive way should be developed.
Funding
This research was funded by a grant (No. GER –
007/2015) from the Research Council of Lithuania.
References
Atkinson, A.; Piketty, T.; Saez, E. 2011. Top incomes in
the long run of history, Journal of Economic Liter-ature 49(1): 3–71.
http://dx.doi.org/10.1257/jel.49.1.3
Atkinson, A. B. 2009. Factor shares: the principal prob-
lem of political economy?, Oxford Review of Eco-nomic Policy 25(1): 3–16.
http://dx.doi.org/10.1093/oxrep/grp007
Bentolila, S.; Saint Paul, G. 2003. Explaining move-
ments in the labor share, The B.E. Journal of Mac-roeconomics 3(1).
http://dx.doi.org/10.2202/1534-6005.1103
Bivens, J.; Gould, E.; Mishel, L. Shierholz, H. 2014.
Raising America’s pay: why it’s our central eco-nomic policy challenge. Economic Policy Institute.
Cingano, F. 2014. Trends in income inequality and its impact on economic growth. OECD Social, Em-
ployment and Migration Working Papers, No. 163.
OECD Publishing.
Dafermosa, Y.; Papatheodoroub, Ch. 2015. Linking
functional with personal income distribution: a
stock-flow consistent approach, International Review of Applied Economics 29(6): 787–815.
http://dx.doi.org/10.1080/02692171.2015.1054365
Dagum, C. 1999. Linking functional and personal dis-
tribution of income, in J. Silber (Ed.). Handbook of
income inequality measurement. Kluwer Academic
Publishers.
Davis, A.; Mishel, L. 2014. CEO pay continues to rise as typical workers are paid less. Economic Policy
Institute, Washington, DC [online], [cited 13 Feb-
ruary 2016]. Available from Internet:
http://www.epi.org/publication/ceo-paycontinues-
to-rise/
European Commission. 2007. The labour income share in the European Union. Employment in Europe
2007. European Commission, Brussels.
Eurostat. 2013a. European household income by groups of households. Eurostat methodologies and work-
ing papers [online], [cited 6 February 2016].
Available from Internet:
http://ec.europa.eu/eurostat/documents/3888793/58
58173/KS-RA-13-023-EN.PDF
Eurostat. 2013b. European system of accounts ESA2010. Manual and guidelines [online], [cited 3
February 2016].
http://www.lb.lt/n22873/esa_2010-en_book.pdf
Eurostat. 2014. Taxation trends in the European Union.
Data for the EU Member States, Iceland and Nor-
way.
Eurostat. 2015. Taxation trends in the European Union.
Data for the EU Member States, Iceland and Nor-
way.
Eurostat. 2016a. Main GDP aggregates per capita [na-
ma_10_pc]. Database [online], [cited 12 March
2016]. Available from Internet:
http://ec.europa.eu/eurostat/data/database
Eurostat. 2016b. Statistics on income, social inclusion and living conditions. Statistics Illustrated [online],
[cited 10 February 2016]. Available from Internet:
http://ec.europa.eu/eurostat/web/income-and-
living-conditions/overview
Feldstein, M. S. 2008. Did wages reflect the growth in productivity? NBER Working Paper 13953.
Fesseau, M.; Wolff, F.; Mattonetti, M. L. 2013. A cross-country comparison of household income, con-sumption and wealth between micro sources and national accounts aggregates. OECD.
Glyn, A. 2009. Functional distribution and inequality, in
W. Salverda, B. Nolan, T. M. Smeeding (Eds.).
Oxford handbook of economic inequality. Oxford:
Oxford University Press.
Gollin, D. 2002. Getting income shares right, Journal of Political Economy 110(2): 458–474.
http://dx.doi.org/10.1086/338747
Halter, D.; Oechslin, M.; Zweimüller, J. 2014. Inequali-
ty and growth: the neglected time dimension,
Journal of Economic Growth 19(1): 81–104.
International Monetary Fund (IMF). 2007. The globali-
zation of labor, Chapter 5, in World Economic Outlook. IMF.
Norkus, Z. 2012. On Baltic Slovenia and Adriatic Lith-uania: a qualitative comparative analysis of pat-terns in post-communist transformation. Vilnius,
J. Navickė, R. Lazutka
10
Budapest: Apostrofa / Central European University
Press.
OECD. 2013. Crisis squeezes income and puts pressure on inequality and poverty – Results from the OECD Income Distribution Database (May 2013).
Paris: OECD Publishing [online], [cited 11 Janu-
ary 2016]. Available from Internet:
http://www.oecd.org/els/soc/OECD2013-
Inequality-and-Poverty-8p.pdf
OECD. 2015. The distribution of household income consumption and savings, an OECD study. Office
for National Statistics. 30 November 2015
[online], [cited 23 January 2016]. Available from
Internet:
http://www.ons.gov.uk/economy/nationalaccounts/
uksectorac-
counts/articles/thedistributionofhouseholdincomec
onsumptionandsavingsanoecdstudy/2015-11-30
Ostry, J.; Berg, A.; Tsangarides, C. 2014. Redistribu-
tion, inequality, and growth / IMF Staff discussion
note, February [online], [cited 23 January 2016].
Available from Internet: https://www.imf.org/
external/pubs/ft/sdn/2014/sdn1402.pdf
Razgūnė, A.; Lazutka, R. 2015. Labor share trends in
three Baltic countries: literature review and empir-
ical evidence, Ekonomika 94(1): 97–116.
Social Situation Monitor. 2016. European Commission employment, social affairs & inclusion [online],
[cited 10 February 2016]. Available from Internet:
http://ec.europa.eu/social/main.jsp?catId=1049&la
ngId=en
Stiglitz, J.; Sen, A.; Fitoussi, J-P. 2010. Report by the Commission on the measurement of economic per-formance and social progress [online], [cited 15
February 2016]. Available from Internet:
http://www.stiglitz-sen-fitoussi.fr/