Embed Size (px)
Citation preview

Function Point Analysis for Software Maintenance
Anandi Hira and Barry Boehm
CREST Open Workshop – Predictive Models in Software Engineering: Measures, Models, and
Benchmark

Outline
2
Introduction
Metrics
Baseline SLOC Model
Analyses Results
Validity Considerations
Conclusions
Motivation
Goal
Dataset
Motivation
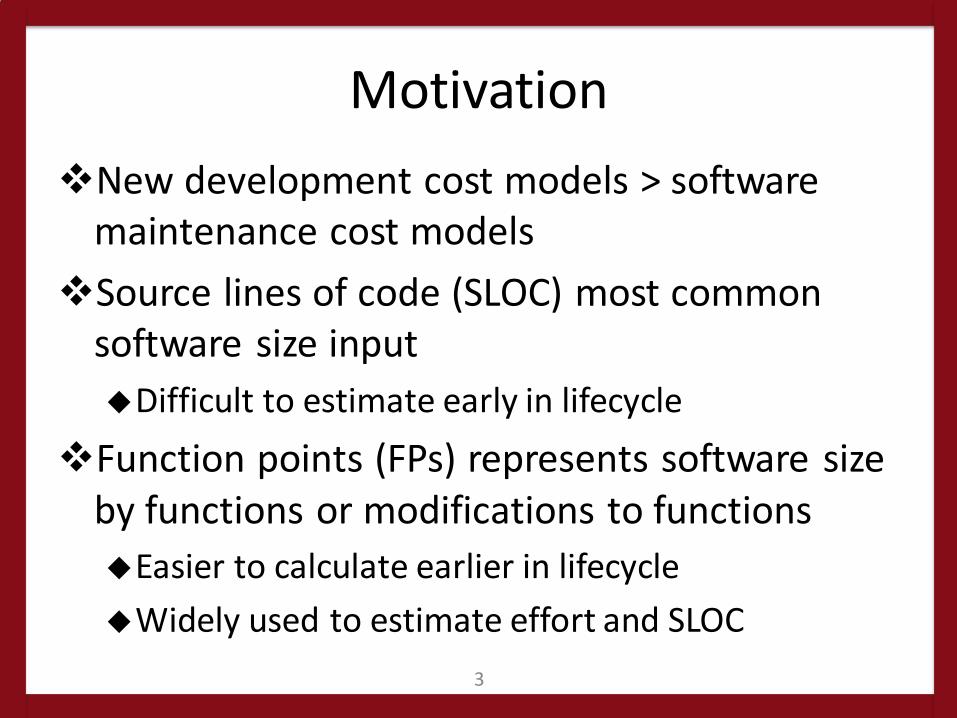
❖New development cost models > software maintenance cost models
❖Source lines of code (SLOC) most common software size input
Difficult to estimate early in lifecycle
❖Function points (FPs) represents software size by functions or modifications to functions
Easier to calculate earlier in lifecycle
Widely used to estimate effort and SLOC
3

Goal
Answer following questions with empirical analysis:
1. Can Function Points effectively estimate effort for software maintenance projects?
2. Does using a Function Points to SLOC ratio add a layer of uncertainty to estimates?
4

Dataset: Unified Code Count (UCC)
Project Description
• Maintained at University of Southern California (USC)
• Code metrics tool (logical SLOC, cyclomatic complexity)
• Implemented in C++
• 45 to 1425 logical SLOC
• 2010 to 2014
• Modularized architecture
• 4-month time-boxed increments
Project Types
• Add Functions
o New language parsers
o New features, such as GUI front-end
• Modify functions
o Cyclomatic complexity support (modify existing language parsers with mathematical operation and algorithms)
5

Outline
6
Introduction
Metrics
Baseline SLOC Model
Analyses Results
Validity Considerations
Conclusions
Function Points
Normalized Effort
Equivalent SLOC

Function Points – 1/2
TypeofComponent
ComplexityofComponents
MultiplierFactor
Low Average High Total
ExternalInputs 3 4 6
ExternalOutputs 4 5 7
ExternalInquiries 3 4 6
InternalLogicalFiles 7 10 15
ExternalInterfaceFiles 5 7 10
TotalNumberofUnadjustedFunctionPoints
7

Function Points – 2/2
General System Characteristics
• Data communications
• Distributed data processing
• Performance
• Heavily used configuration
• Transaction rate
• Online data entry
• End-user efficiency
• Online update
• Complex processing
• Reusability
Equations: Value Adjustment Factor (VAF), Enhancement Project FP (EFP)
• Installation ease
• Operational ease
• Multiple sites
• Facilitate change
8
General System Characteristics Cntd.
VAF=0.65+( C
iå )
100
EFP=[(ADD+CHGA) VAFA]
+(DEL VAFB)

Normalized Effort
COCOMO model:
9
Effort(PM)=2.94´Size1.0997 ´ EMi
i=1
17
Õ
PM=152hours
NormalizedEffort(hours)=TotalEffort(hours)
EMiÕ( )

Equivalent SLOC (ESLOC)
10
AAF =0.4*DM+CM+0.3*IM
AAM =
AA+AAF + 1- 1-AAF
100
æ
èç
ö
ø÷
2é
ë
êê
ù
û
úú*SU*UNFM
100
ifAAF£ 100
AA+AAF + SU*UNFM
100ifAAF>100
ì
í
ïïïïïïï
î
ïïïïïïï
ESLOC = SLOCadded
+(ASLOC*AAM)
DM Design Modification
CM Code Modification
IM Integration and Test
SU Software Understanding
UNFM Programmer Unfamiliarity
AA Assessment and Assimilation

Outline
11
Introduction
Metrics
Baseline SLOC Model
Analyses Results
Validity Considerations
Conclusions
Baseline SLOC Model
12
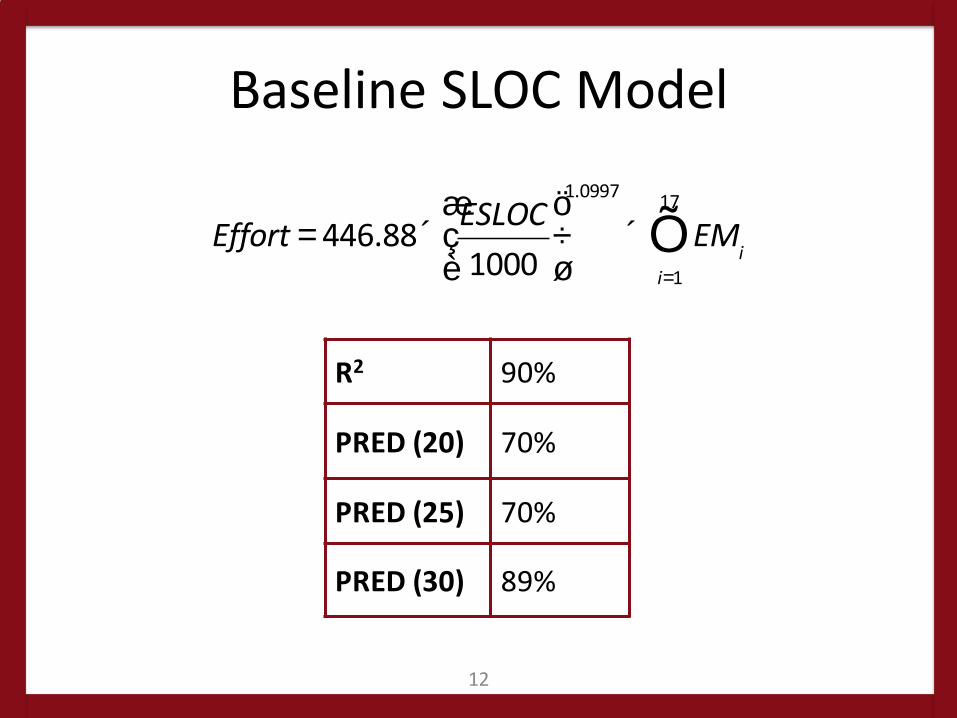
Effort = 446.88´ESLOC
1000
æ
èç
ö
ø÷
1.0997
´ EMi
i=1
17
Õ
R2 90%
PRED (20) 70%
PRED (25) 70%
PRED (30) 89%

Outline
13
Introduction
Metrics
Baseline SLOC Model
Analyses Results
Validity Considerations
Conclusions
Adding Functions
Modifying Functions

RESULTS: ADDING FUNCTIONS
14

FPs vs Normalized Effort
Normalized Effort = 302.06 + (17.312 × EFP )
15
0
200
400
600
800
1000
1200
0 10 20 30 40
No
rmal
ize
d E
ffo
rt (
ho
urs
)
Enhancement Project Function Points (EFPs)
R2 80%
PRED (20) 82%
PRED (25) 82%
PRED (30) 100%
FPs vs ESLOC
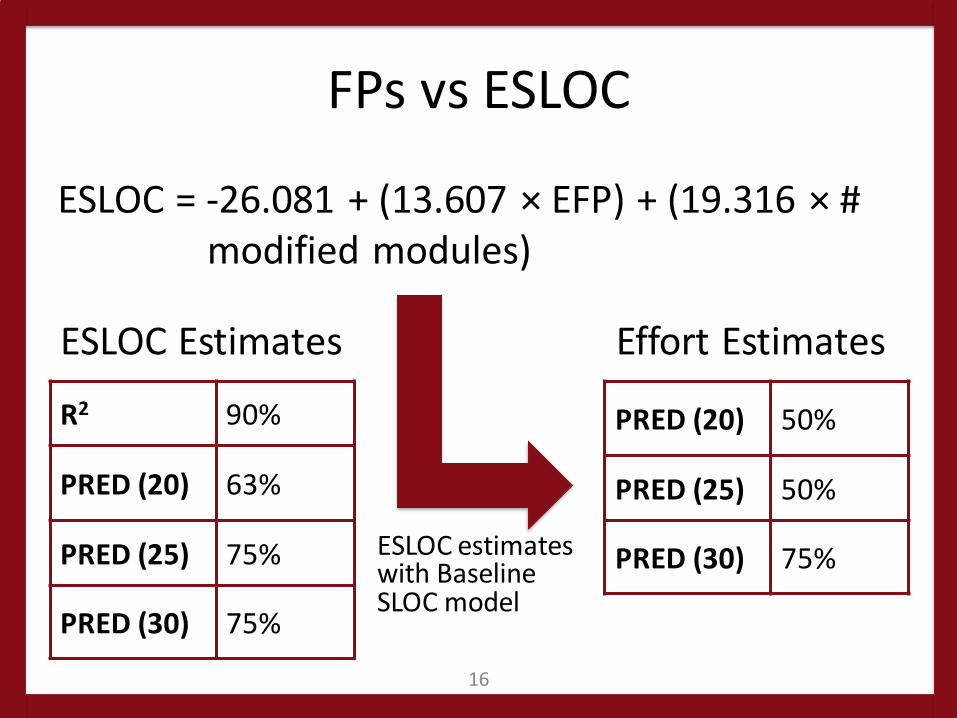
ESLOC = -26.081 + (13.607 × EFP) + (19.316 × # modified modules)
16
R2 90%
PRED (20) 63%
PRED (25) 75%
PRED (30) 75%
PRED (20) 50%
PRED (25) 50%
PRED (30) 75%
ESLOC Estimates Effort Estimates
ESLOC estimates with Baseline SLOC model

RESULTS: MODIFYING FUNCTIONS
17

FPs vs Normalized Effort
Normalized Effort (hours) = 80.987
– (1.027 × CHGA)
+ (2.433 × CHGB)
– (22.485 × # modified files)
+ (20.703 × # new modules)
+ (24.909 × # modified modules)
18
R2 73%
PRED (20) 21%
PRED (25) 47%
PRED (30) 63%

FPs vs ESLOC
ESLOC = 103.630+0.396 ×
EFP[1.336 + (-0.039 × #modified files) + (0.088 × # new modules)]
19
R2 71%
PRED (20) 38%
PRED (25) 38%
PRED (30) 62%
PRED (20) 19%
PRED (25) 19%
PRED (30) 24%
ESLOC Estimates Effort Estimates
ESLOC estimates with Baseline SLOC model
Outline
20
Introduction
Metrics
Baseline SLOC Model
Analyses Results
Validity Considerations
Conclusions

Validity Considerations
Internal
❖ Reported effort may not be accurate
Forget to update timesheets
Show high productivity
Show excessive hours
External
❖ Segregation between adding functions and modifying functions Test and verify on other
datasets
❖ Linear relationship does not account for diseconomies of scale Analyze on datasets with
larger projects for scalable results
21
Mitigation
❖ Members evaluated on ability to meet deadlines, adapt to problems, communicate clearly

Conclusions
❖Function Points effective to estimate affect?
Add functions: Yes!
Modify functions: No (even with additional metrics)
❖Function Points to SLOC ratio effective for effort estimates?
Adds layer of uncertainty
Resulting effort accuracy unsatisfactory
22