Embed Size (px)
Citation preview
Fully-refereed paper presented at AARE Brisbane December 1-5, 2002
LINKING CLASSROOM ENVIRONMENT WITH EDUCATIONAL OUTCOMES USING A RASCH MEASUREMENT MODEL
Russell F. Waugh
Edith Cowan University
and
Robert F. Cavanagh
Curtin University of Technology
Key words: classroom environment, attitudes, behaviours, educational outcomes, secondary students, Rasch measurement
Running head: CLASSROOM ENVIRONMENT
4 April 2002
Address correspondence to Dr Russell F. Waugh at
Edith Cowan University, School of Education, Pearson Street, Churchlands,
Western Australia, 6018
Abstract
Background: There are many studies relating the classroom environment to student outcomes as part of the pursuit of what makes an effective school. An eight-factor model involving Classroom Learning, Classroom Support, Student Discussion, Student Planning, student views of Teacher's Decision-Making, Teacher's Caring, Teacher's Expectations, and Parental Attitudes with student self-reported Educational Values and Formal Learning Outcomes has been proposed, but has never been investigated by measuring all these factors on the same scale.
Aim: This study aimed to create an interval-level, unidimensional scale of student self-reported Classroom Environment, based on the hypothesised classroom model involving eight-factors, with two-factor classroom outcomes. It aimed to calibrate item difficulties and student self-reported Classroom Environment measures on the same scale.
Sample: The person sample was 521 students from two secondary schools in Western Australia and the item sample was 66.
Method: Items were written in Guttman patterns for each factor, in line with a conceptualised measurement model. Data were analysed with a Rasch Unidimensional Measurement Model computer program (Andrich, Sheridan, Lyne & Luo, 2000).
Results: The proportion of observed variance considered true was 0.96 (Cronbach Alpha was 0.96). The eight Classroom Environment factors were found to be linked to the two student outcome factors. Nearly all items for each factor were found to be ordered from 'easy' to 'hard' in line with the hypothesised model.
Conclusion: The Rasch model was very useful in creating a scale of classroom factors and student outcomes in which student measures and item difficulties are calibrated on the same scale. The Classroom Environment is linked to student outcomes.
LINKING CLASSROOM ENVIRONMENT WITH EDUCATIONAL OUTCOMES USING A RASCH MEASUREMENT MODEL
Secondary school student educational outcomes and their links with the classroom environment are important topics. They are important because educators and the community want schools to be effective and parents want their children to achieve as best as they are able. The research on effective schools and classroom environments is voluminous, and there has been some good reviews of parts of the literature. Stoll and Mortimer (1995) evaluated the research findings on school effectiveness and improvement and identified eleven factors requiring consideration in the design of school improvement programs. These were participatory leadership, shared vision and goals, teamwork, a learning environment, emphasis on teaching and learning, high expectations, positive reinforcement, monitoring and inquiry, pupil rights and responsibilities, learning for all and partnerships and support. Wang (1997) reviewed the findings of 25 years of school effects research in North American urban schools. Strong instructional leadership, high expectations for all students, clear goals for students' academic and behavioural performance, maximisation of students' time on task and an academic emphasis were all found to affect student outcomes. The majority of factors acknowledged in school effectiveness literature are of a socio-psychological nature concerning the influence of individuals, groups and interpersonal relationships on improving student learning. Such factors can be viewed as the vehicles for improving school effectiveness and are the elements of a learning community culture.
School effectiveness research typically treats student learning outcomes as the dependent variable and uses various correlation techniques to link outcomes with aspects of the classroom. For example, Samdal, Wold and Bronis (1999) conducted an international study of students' perceptions of school environment, their satisfaction with school and perceived academic achievement. They found perceived academic achievement strongly correlated with satisfaction with school. This was explained as a cyclical relationship between academic achievement, satisfaction, motivation and subsequent academic achievement. The study also identified autonomy and control, aspects of classroom management, social relationships and satisfaction with school as dimensions of the school/work climate. The learning outcomes achieved by students are part of the overall environment.
With regard to the classroom environment, the research literature on effective teaching and learning is 'vast and highly complex' (Harris, 1995 p.1). The relationship between specific teaching styles and student achievement has been extensively researched with inconclusive results concerning the relative merits of different styles (Merson, 1990). Harris (1995) proposed that this finding was due to the difficulty of categorising specific styles and the diversity of teaching situations and contexts. Notwithstanding this dilemma, the constructivist approach to student learning and teaching provides a general framework for examining classroom conditions (McCarthy, 1994). In particular, social constructivism emphasises the importance of the classroom social environment on the acquisition and development of knowledge (Cole, 1991; Olsen, 1999). Adoption of a social constructivist view of learning reaffirms the importance of social processes within the school and the pre-existing values of students on future learning.
Re-conceptualisation of the nature of schools is evidenced by a move away from an organisational perspective to a learning community and cultural conceptions (Sergiovanni, 1993, 2000). Cavanagh and Dellar (1997) described the culture of a learning community as being manifested by the sharing of values and norms amongst teachers resulting in commonality of purpose and actions intended to improve the learning of students. The culture of the individual school is then characterised by the perceived extent of participation in the interactive social processes that develop, maintain and transform the culture. This description was based in part upon organisational theory and conceptions of school culture that focus upon the influence of the school staff on school culture. However, a learning community includes teachers, students and parents. The study of learning environments would then need to give consideration to the contribution of all three learning community groups in influencing the culture of the community and the attainment of community expectations. Recently, Coleman (1998a, 1998b) suggested that school improvement needs a triad comprising a collaborative partnership between parents, students and teachers. From a cultural orientation, the relationship between the members of the triad and learning community is more complex and deeper than collaboration. The cohesion of the learning community then derives from bonding between individuals, based upon collective beliefs, values, attitudes and aspirations. Common expectations concerning improving the educational outcomes of students and the means of accomplishing this mission lie at the core of the shared value system. Supportive interpersonal relationships accommodative of personal dispositions also provide the community with cohesion and resilience to fragmentary pressures.
The learning environment is considered to be perceptual and to be both characterised and shaped by the perceptions of parents, students and teachers. Comprehensive investigation of school-wide learning environments would then require collection of data about all three groups, but the primary sources of data are the specific combination of class members and the teacher within the classroom.
Adoption of a learning community conception of schools has two major implications for the design of learning environment instrumentation. These are a consideration (1) of the processes by which the culture of the community develops, is maintained and can be transformed, and (2) of the mission of the school and the attributes of schools and classrooms that are effective in improving student learning.
Research on school culture and school improvement typically emphasises collaborative and collegiate staff cultures (Fullan & Hargreaves, 1992). Collaboration and collegiality can be viewed as vehicles for cultural development and maintenance (Cavanagh & Dellar, 1997). Similarly, other attributes of school cultures that have been identified as being conducive for school improvement can also facilitate discourse, dialogue, sharing and support amongst teachers. A leadership approach, particularly transformational leadership with shared planning and organisation, has culture building capacity (Ellett, Rugutt & Cavanagh, 1999). It is likely that the processes providing the unity and bonding between teachers are also present in the school-wide environment and occur in classrooms and in interaction with parents. For example, within the classroom, teacher behaviour is analogous to leadership, collegiality amongst students develops positive interpersonal relationships and collaboration facilitates discussion of instructional matters. Similarly, high levels of parental involvement with teachers and students could be examined within this framework.
School, classroom and teacher effectiveness research has identified conditions conducive to improving student educational outcomes (Stoll & Fink, 1996). However, the notion of a learning environment as applied in contemporary learning classroom research suggests that no distinction be made between the outcomes of the school and classroom environments, and the conditions within these environments that may facilitate improved student learning. The literature (see Coleman, 1998a, 1998b) suggests that there are five main components: the individual student, parental involvement, the classroom, the teacher and the outcomes of learning. It suggests that the educational values of the individual student, the involvement of parents in a child's schooling, the classroom group, attributes of the teacher and learning outcomes are mutually dependent. Each of the five components is characterised by a combination of traits, dispositions and behaviour. The extent of the presence of each component is expected to influence the educational outcomes of students. Also, the nature of interaction between the components is also expected to influence the educational outcomes. Consistency between the components provides cohesion within the total system, mutual reinforcement of the individual components and a resonance increasing the effectiveness of the complete classroom environment system.
Problems with current research
There are at least five aspects of recent Classroom Environment and Classroom Outcome studies that are called into question. First, an interval-level scale of Classroom Environment (and Classroom Outcomes) has not been constructed. The Classroom Environment items have not been calibrated and ordered from 'easy' to 'hard' on the same scale as the student measures have been calibrated from 'low' to 'high'. Second, no scale of Classroom Environment has been constructed in which items are selected to fit a measurement model and form a unidimensional scale in which the items can be said to be affected by one dominant trait. Third, Classroom Environment and Classroom Outcomes have not been measured on the same scale. Measuring Classroom Environment and Classroom Outcomes separately, and then correlating them, is not the most satisfactory method of testing the relationship between them for at least two reasons. Measuring the two aspects separately using Classical Test Theory leaves other aspects or 'noise' in the measures, distorting the relationship (compare the Cronbach Alphas of about 0.7 in other studies with 0.96 in the present study). A Rasch model analysis tests that the Classroom Environment items and the Classroom Outcome items link together on the same scale through both being affected by
the same dominant trait, something that correlation methods do not check. Four, many assessments of Classroom Environment (but not all) employ Likert or Likert-type response categories. These can provide measurement problems because of the discontinuity between (strongly) agree and (strongly) disagree, and the neutral category that attracts different responses like don't know, unsure, don't want to answer, and neutral, that cannot be easily interpreted. The Rasch model checks that Likert type categories are answered consistently and logically; that is, that they provide an ordered set of responses from 'easy' to 'hard' (items with disordered response sets are discarded). Classical Test Theory does not make this test. Five, Classroom Environment and Classroom Outcomes have not been measured using a conceptual design of items in each factor based on a Guttman type pattern from 'easy' to 'hard'. This design sets the items like a ruler and the design can be tested using a Rasch model. Classical Test Theory tries to have all items of 'similar difficulty' and does not have a conceptual measurement design in the preparation of the items.
One way forward is to create some Classroom Environment and Classroom Outcome items arranged in Guttman patterns from 'easy' to 'hard' for the sub-aspects within each factor of the eight-factor Classroom Environment model and the two-factor Classroom Outcome model. Then the 'difficulties' of the items and the student measures have to be calibrated on the same scale. This can be done with the computer program Rasch Unidimensional Measurement Models (Andrich, Sheridan, Lyne & Luo, 2000) (see Andrich, 1988a, 1988b, 1985, 1982; Rasch, 1960/1980: Waugh, 2002, 2001, 2000, 1999) to be explained later. The items, arranged in their conceptual design from 'easy' to 'hard', are set out in Appendix A.
Aims
The aims of this study are to:
1. Devise items in Guttman patterns to measure Classroom Environment, based on eight Student Self-Reported aspects, (1) Classroom Learning Attitudes and Behaviours (Class emphasis on learning, Class learning with peers, and Class emphasis on performing well), (2) Classroom Support Attitudes and Behaviours (Helping each other, Getting along together, and Caring about each other), (3) Classroom Discussion Behaviour, (4) Classroom Planning Behaviour, (5) Student Views of Teachers' Classroom Behaviour to Decision-Making, (6) Student Views of Teacher's Behaviour to Caring, (7) Student Views of Teachers' Expectations for Students, and (8) Student Views of Parental Attitudes and Behaviours to Student Classroom Work, and two Student Self-Reported Classroom Outcomes, (1) Educational Values (Importance of Schooling views, Goal orientation views, and Desire to learn) and (2) Formal Learning Outcomes (Formal achievement views, Experiencing success views, and Engaging in school work views);
2. Create a new scale of Classroom Environment using the computer program RUMM (Andrich, Sheridan, Lyne & Luo, 2000) in which the item 'difficulties' are calibrated on the same scale as the student measures;
3. Investigate the psychometric properties of the new scale; and 4. Interpret the meaning of the new scale.
Model of the Scale: Classroom Environment
A scale of Classroom Environment was conceptualised as items arranged in Guttman patterns from 'easy' to 'hard' for each factor from the eight-factor model with the two-factor model of Classroom Outcomes (see Table 1). All the items were created and written especially for the present study, based on ideas from some of the classroom environment literature. An initial conceptualisation involved 143 items with 697 students. However, an initial Rasch analysis did not support the conceptualisation with all these items, at least
partly because the Likert response patterns (SA, A, DA, SDA) were not answered consistently and logically by some students and because some of the Guttman patterns were not sufficiently clear. (The conceptualisation may be supported with other created items or a better response set that is ordered from low to high). The present study proceeded with the 66 items in ordered Guttman patterns for each sub-aspect, and four response categories, Strongly agree, Agree, Disagree, Strongly disagree.
-------------------------------
Place Table 1 about here
------------------------------
Self-Reported Educational Values (Higher Order Outcomes)
There are three sub-factors: Importance of schooling, Goal orientation, and Desire to learn. It is argued that these are higher order outcomes that we wish all students to acquire from their Classroom Environment. Indeed, it would be strange if students attended secondary school and left with a view that schooling, achieving goals and having a desire to learn were unimportant. We would certainly think that classrooms had failed, in that case. So these are set as Classroom Environment Outcomes. The following sets out the item patterns for the first sub-factor of outcomes. The other patterns for Classroom Outcomes are not reported below to save space. They can easily be worked out by the reader by examining the items that are set out in Guttman patterns in Appendix A.
Sub-factor: Importance of Schooling
It was conceptualised that most students would find it 'very easy' to report that My education is important to me (item 1) and it was expected that there would be some variation around this. It was conceptualised that they would find it 'harder' than in item 1, but still 'easy', to report that School is important to me (item 2) because school is more specific than education. It is conceptually 'harder' to agree with item 2 than with item 1. If one agrees with item 2, one will most likely agree with item 1. It was conceptualised that they would find it 'harder' than in item 2, but still 'easy', to report that I am comfortable in class (item 3) because class is more specific than school. It is conceptually 'harder' to agree with item 3 than with item 2. If one agrees with item 3, one will agree with item 2. It was conceptualised that they would find it 'harder' than in item 3, but still 'easy', to report that I feel confident about my education (item 4) because it is conceptually 'harder' to agree with item 4 than with item 3. If one agrees with item 4, it is likely that one will agree with item 3. So it was expected that items 1 to 4 would form a Guttman pattern of responses, on average, from 'easy' to 'harder', 'harder still' and 'hardest' (although still overall 'easy') by the secondary school students.
Self-Reported Student Classroom Learning Attitudes and Behaviours
There are three sub-factors: Class emphasis on learning, Class learning with peers, and Class emphasis on performing well. It is argued that these are learning attitudes and behaviours that we wish all students to acquire from their Classroom Environment. It would be strange if students attended secondary school and left with attitudes and behaviours relating to classroom learning, learning with peers and performing well that indicated these were unimportant. We would certainly think that classrooms had failed, in that case. So these are set as Classroom Environment attitudes and behaviours on learning. The following sets out the item patterns for the first sub-factor. The other patterns for Classroom
Environment are not reported below to save space. They can easily be worked out by the reader by examining the items that are set out in Guttman patterns in Appendix A.
Sub-factor: Class Emphasis on learning
It was conceptualised that most students would find it 'very easy' to report that Learning is really important in this class (item 23) and that there would be some variation around this. It was conceptualised that they would find it 'harder' than in item 23, but still 'easy', to report that I find new ways to learn in this class (item 24) because finding new ways to learn implies learning is a behaviour that requires more effort than holding an attitude (item 23). It is conceptually 'harder' to agree with item 24 than with item 23 and if one agrees with item 24, one will most likely agree with item 23. It was conceptualised that they would find it 'harder' than in item 24 (and 'hard') to report that We spend time thinking about how our studies are going (item 25) because this requires a lot more effort. It is conceptually 'harder' behaviour to agree with item 25 than with item 24. It was conceptualised that they would find it 'harder' than in item 25, and 'very hard', to report that We don't waste time in this class (item 26) because it is a conceptually 'harder' behaviour than that with item 25. So it was expected that items 1 to 4 would form a Guttman pattern of responses, on average, from 'easy' to 'harder', 'harder still' and 'hardest' (with the last one being very 'hard') by the secondary school students.
Expected Guttman Patterns for the other Aspects
The conceptualised Guttman patterns for the other aspects follow a similar line to that reported above and are not reported here to avoid repetition and save space. A reader can easily work out the conceptualised patterns of the other aspects from the items in Appendix A. In Appendix A, the stem-items are placed in order from 'easy' to 'hard' in each aspect. Item 'difficulties' are reported in logits, based on the Rasch created scale, are placed in Appendix A next to the items. This is the test of the model.
Method
Administration and sample
The initial item-sample consisted of 143 items. This was reduced to 66 items in Guttman patterns after an initial Rasch analysis. The student-sample consisted of 697 students in 38 classes at two secondary schools in Perth, Western Australia. As the questionnaires were all answered on a voluntary basis and there can be no compulsion to answer every question, some students omitted some questions. When these incomplete data sets were discarded, there were 521 complete data sets available for use in the final analysis. The 697 sample was about 90% of the students enrolled in the selected classes from Year 8 (12 year olds) to Year 11 (16 year olds) and they covered a variety of subject areas including English, Maths, Science and Social Studies.
The administration was done by one of the authors who explained the questionnaire to the students, its purpose and anonymity, and remained with the students to answer any questions. A one-hour period was allotted to explain, answer and collect the questionnaires.
Measurement Model
The Extended Logistic Model of Rasch (Andrich, 1988a; Rasch, 1960/1980) was used with the computer program Rasch Unidimensional Measurement Models (RUMM) (Andrich, Sheridan, Lyne & Luo, 2000) to create a scale of Classroom Environment. Items fitting the model were calibrated from 'easy' to 'hard' and student measures were aligned from 'low' to
'high' on the same scale. The Rasch method produces scale-free student measures and sample-free item 'difficulties' (Andrich, 1988b; Wright & Masters, 1982). This means that the differences between pairs of student measures and pairs of item 'difficulties' are expected to be sample independent - one of the requirements of measurement.
The Rasch model requires that data must fit the measurement model (see Andrich, 1989). This follows from the requirements needed to create a proper scale. This is contrary to Classical Test Theory where one tries to model the data. There are three main scale requirements (not assumptions of the measurement model). One is that of scale additivity. Equal differences between two sets of item 'difficulties' on the scale must equal differences between the two corresponding sets of measures on the scale. In a Science test where item scores are added to give a percentage, the difference between 50% and 60% doesn't equal the same amount of Science understanding as between 70% and 80%; that is, there is no additivity and simply adding marks on a number of items doesn't mean one has a proper scale. A second is that it should be possible to omit some items without affecting a student's measure on the scale. A third is that the created scale should not be affected by the opinions of students whose answers are used to construct it. That is, a proper scale is invariant across groups for which it is used. This means that, for the Rasch model, all the items contributing to the scale must have the same discrimination parameter. In contrast in Classical Test Theory, item discriminations can vary considerably.
The RUMM program (2000) calculates standard errors of measurement for the student measures of Classroom Environment and for the item 'difficulties', as well as a Student Separability Index. The equations for these are given in Wright and Masters (1982). The Index shows the proportion of observed variance considered true.
The zero point on the scale does not represent zero Classroom Environment. It is an artificial point representing the mean of the item 'difficulties', calibrated to be zero. It is possible to calibrate a true zero point, if it can be shown that an item represents zero Classroom Environment. There is no true zero point of Classroom Environment in the present study.
The RUMM program (2000) parameterizes an ordered threshold structure, corresponding with the ordered response categories of the items from Strongly Disagree, to Disagree, to Agree, to Strongly Agree (see Andrich & van Schoubroeck, 1989; Andrich, 1988a). The responses to the categories were checked to ensure that discrimination was satisfactory and that student responses were logical and consistent in relation to measurement on the Classroom Environment scale. Discrimination is satisfactory when the thresholds are ordered in correspondence with the ordering of the response categories. In Rasch measurement, threshold values are calculated so that there are odds of 1:1 for students answering in adjacent response categories. If thresholds are disordered, items are discarded because it means that the response categories are not answered logically or consistently. In the present study, there are four categories and hence three thresholds per item that should be ordered.
The RUMM program substitutes the parameter estimates back into the model and examines the difference between the expected values predicted from the model and the observed values using two tests-of-fit: one is the item-trait interaction and the second is the item-student interaction. The item-trait test-of-fit (a chi-square) examines the consistency of the item parameters across the student measures for each item and data are combined across all items to give an overall test-of-fit (see Andrich and van Schoubroeck, 1989, pp.479-480 for the equations). This shows the collective agreement for all items across students of different Classroom Environment measures. The item-student test-of-fit examines both the response patterns for students across items and for items across students. It examines the
residual between the expected estimate and the actual values for each student-item summed over all items for each student and summed over all students for each item (see Styles and Andrich, 1993, p.914 or Andrich and van Schoubroeck, 1989, p.482 for the equations). The fit statistics approximate a t-distribution with a mean near zero and a standard deviation near one, when the data fit the measurement model. Negative values indicate a response pattern that fits the model too closely (probably because response dependencies are present, see Andrich, 1985) and positive values indicate a poor fit to the model (probably because other measures -'noise'- are present).
There are at least three reasons why items may not fit the Rasch measurement model in the present study. One, the response categories may not be answered consistently and logically. An example would be where a student with a high measure answers a low category for an easy item and a higher category for a harder item. The RUMM program creates item thresholds and produces a Category Characteristic Curve for each item. This allows the researcher to check how the categories are answered. Two, students may not be able to agree on the 'difficulty' of an item on the scale. This may indicate, for example, that half the students with high measures answer an item positively and the other half answer negatively. Three, the residuals may be too large indicating that there is too big a difference between the actual and expected values according to the measurement model. This could arise for a number of reasons such as the item not being affected by the same dominant trait as the other items, or a particular group of students responding differently to one response category of the item than would be expected for their overall score on the scale.
-------------------------------
Place Table 2 about here
------------------------------------
Results
The results are set out in two Appendices, one Figure and one Table. Appendix A shows the item 'difficulties' in logits. Appendix B shows the item 'difficulties', the standard error, and the residual for each item. Figure 1 shows a graph of the item threshold values on the same scale as the student measures of Classroom Environment. Table 2 provides a summary of the psychometric characteristics of the Classroom Environment scale.
--------------------------------
Place Figure 1 about here
---------------------------------
Psychometric characteristics of the Scale
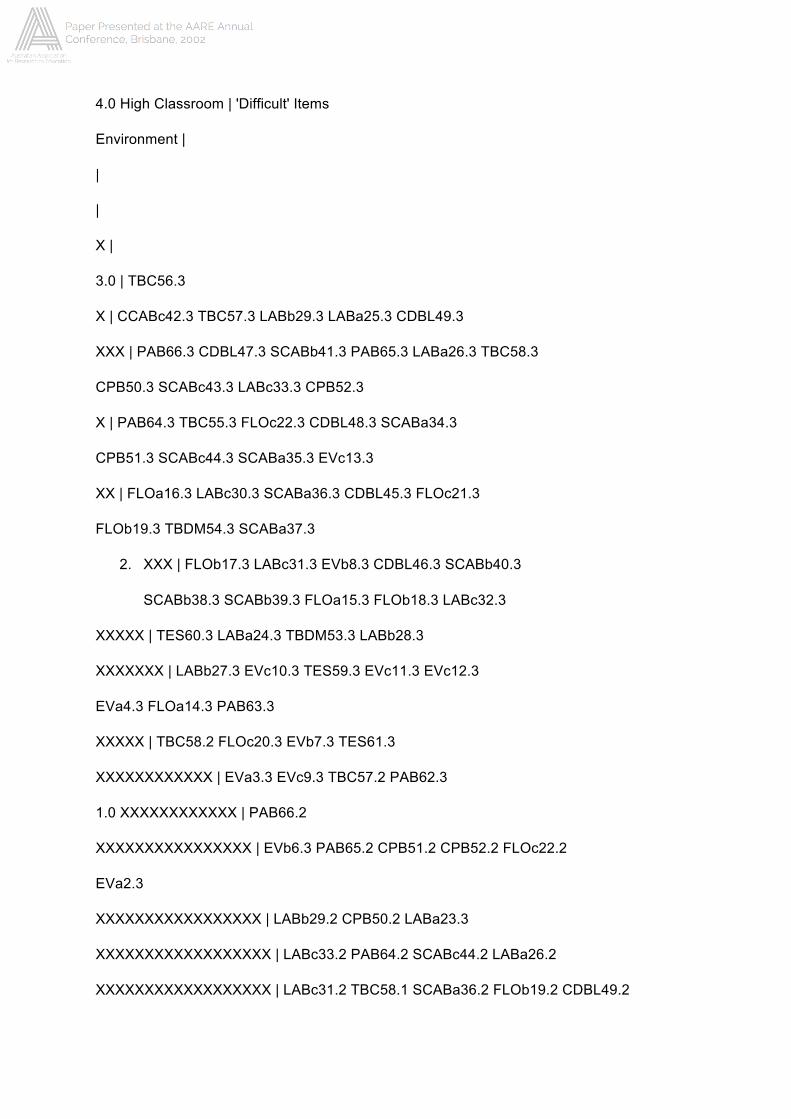
The Classroom Environment scale is set out in Figure 1 and its measures are calibrated from low to high on the left hand side. The 'difficulties' of the items are calibrated from 'easy' to 'hard' on the same scale and placed on the right hand side. Students with the same Classroom Environment measure as the item 'difficulty' have odds of 1:1 of answering the item 'correctly'. Students with higher Classroom Environment measures than the item 'difficulty' have greater odds of answering 'correctly' and students with lower Classroom Environment measures have lower odds of answering 'correctly'. Equal 'amounts' of Classroom Environment on the scale represent equal 'amounts' of item 'difficulty' on the same scale. These are parts of the requirements for measurement.
The Index of Student Separability for the 66-item scale with four response categories is 0.96. This means that the proportion of observed variance considered true is 96% and that the errors in the Classroom Environment measures are small in relation to the separation of the Classroom Environment measures along the scale.
The 66 items of the Classroom Environment Scale have a good fit to the measurement model, indicating that there is a strong agreement between all 521 students as to the different 'difficulties' of the items on the scale (see Table 2). The item-trait tests-of-fit indicate that the values of the item 'difficulties' along the scale are strongly consistent across the range of student Classroom Environment scores (p<0.001), see Table 2). The item-student tests-of-fit (see Table 2) indicate that there is good consistency of student and item response patterns. This is strong evidence for the construct validity of the Classroom Environment data.
The 'difficulties' of the items are well targeted against the students and 'cover' the range of student Classroom Environment measures adequately. The student Classroom Environment measures range from -2.7 to +3.2 logits. The item thresholds range from -4.6 to +3.0 logits (see Figure 1). There may be a few too many 'very easy' items.
These data on reliability, fit to the measurement model, construct validity and targeting of items against measures indicate that a good scale of Classroom Environment has been constructed, although it could be improved. The standard errors are small (about 0.06 to 0.08, see Appendix B) in relation to the spread of scores on the scale (about 6 logits, see Figure 1). The student Separability Index (internal reliability) is excellent and the power of the tests-of-fit are excellent.
Discussion of the Meaning of the Classroom Environment Scale
Interpretation of the scale
The scale for measuring Classroom Environment was based on two Student Self-Reported Classroom Outcomes, (1) Educational Values (Importance of Schooling views, Goal orientation views, and Desire to learn) and (2) Formal Learning Outcomes (Formal achievement views, Experiencing success views, and Engaging in school work views) and eight Student Self-Reported aspects, (1) Classroom Learning Attitudes and Behaviours (Class emphasis on learning, Class learning with peers, and Class emphais on performing well), (2) Classroom Support Attitudes and Behaviours (Helping each other, Getting along together, and Caring about each other), (3) Classroom Discussion Behaviour, (4) Classroom Planning Behaviour, (5) Student Views of Teachers' Classroom Behaviour to Decision-Making, (6) Student Views of Teacher's Behaviour to Caring, (7) Student Views of Teachers' Expectations for Students, and (8) Student Views of Parental Attitudes and Behaviours to Student Classroom Work. The results supported this model and structure.
There are four items for Importance of Schooling views, four items for Goal orientation views, and five items for Desire to learn, and three items for Formal achievement views, three items for Experiencing success views, and three items for Engaging in school work views. They were all created in sub-sets as Guttman patterns to measure Classroom Environment outcomes.
There are four items for Class emphasis on learning, three items for Class learning with peers, and four items for Class emphasis on performing well; four items for Helping each other, four items for Getting along together, and three items for Caring about each other; five items for Classroom Discussion Behaviour; three items for Classroom Planning Behaviour; two items for Student Views of Teachers' Classroom Behaviour to Decision-Making; four
items for Student Views of Teacher's Behaviour to Caring; three items for Student Views of Teachers' Expectations for Students, and five items for Student Views of Parental Attitudes and Behaviours to Student Classroom Work. They were all created in sub-sets as Guttman patterns to measure Classroom Environment attitudes.
All the items are calibrated on the same scale together so that their 'difficulties' in relation to one another can be seen (see Appendix A) and so that the relationships between the aspects can be tested and explained. The results supported nearly all the Guttman patterns in this model. Equal differences on the scale between the measures of Classroom Environment represent equal differences in item 'difficulty'. However, there is no true zero point of item 'difficulty' or Classroom Environment and the scale is at the interval level. The 66 items of the scale are ordered from 'easy' to 'hard' (see Figure 1). Nearly all the students answered the 'easy' items positively (for example, see items 1, 5, 6, 9, 10, 2). As the item 'difficulty' becomes progressively higher on the scale, the students need a corresponding higher Classroom Environment measure to answer them positively. The 'hardest' items are only answered positively by students who have high Classroom Environment measures (for example, items 58, 57, 52, 56, 66, 51, 65, 33). Students with low measures of Classroom Environment cannot answer these 'difficult' items positively.
The four 'easiest' Classroom Environment outcomes are, in order, My education is important to me ('easiest' and 'very easy'), I want to be successful, I work towards achieving my goals, and I enjoy finding out how things work ('hardest', but still 'easy'). The three 'hardest' Classroom Environment outcomes are, in order, I enjoy learning ('hardest', but ' moderately easy'), I ask for help from my teachers when required, and I like to do my work thoroughly ('easiest' and 'moderately easy').
The four 'easiest' Classroom Environment aspects are, in order, Learning is really important in this class ('easiest' and 'moderately easy'), The teacher expects all students to be fully committed to their work, I find new ways to learn in this class, and I understand the work well ('hardest', but still ' moderately easy'). The three 'hardest' Classroom Environment attitudes are, in order, At times the teacher seems more like a mum or a dad ('hardest', but ' very hard'), The teacher helps students with family problems, and We set deadlines with the teacher for completing work ('easiest', but 'still very hard').
Discussion about Classroom Environment Outcomes
Educational Values
Importance of Schooling
The wording for the four items under Importance of Schooling was created as a Guttman pattern. My education is important to me (item 1) was conceptualised as 'very easy'. School is important to me (item 2) was conceptualised as 'harder, but still 'easy' because it includes item 1 (education) and schooling. I am comfortable in class(item 3) was conceptualised as 'harder still, but still easy' because it includes item 2 (schooling) and more. I feel confident about my education (item 4) was conceptualised as 'harder again, but still easy' because it includes item 3 and more. The results (see Appendix A) show that the 'difficulties' of items 1 to 4 are in this conceptualised order.
Goal Orientation
The wording for the four items under Goal Orientation was created as a Guttman pattern. I want to be successful (item 5) was conceptualised as a 'very easy' attitude to hold. I work towards achieving my goals (item 6) was conceptualised as 'harder, but still 'easy' because it
includes item 1 and more (a behaviour). I feel in control of my own learning (item 7) was conceptualised as 'harder still, but still easy' because it includes item 6 and more. I like to do my work thoroughly (item 8) was conceptualised as 'harder again, but still easy' because it includes item 7 and more. The results (see Appendix A) show that the 'difficulties' of items 5 to 8 are in this conceptualised order.
Desire to Learn
The wording for the five items under Desire to Learn was created as a Guttman pattern. I enjoy finding out how things work (item 9) was conceptualised as 'very easy'.Finding new ways to do things is important to me (item 10) was conceptualised as 'a little harder, but still 'easy' because it includes the meaning of item 9 and more. I gain satisfaction from learning new things (item 11) was conceptualised as 'harder still, but still easy' because it includes the meaning of item 10 and some more. I ask for help from my teachers when required (item 12) was conceptualised as 'harder again, but still moderately easy' because it includes item 11 and some more. I enjoy learning (item 13) was conceptualised as 'harder still'. The results (see Appendix A) show that the 'difficulties' of items 9 to 13 are in this conceptualised order, except for items 9 and 10 which are the same within their standard errors.
Formal Learning Outcomes
Formal Achievement
The wording for the three items under Formal Achievement was created as a Guttman pattern. I understand the work well (item 14) was conceptualised as 'easy'. I gain high grades on assignments (item 15) was conceptualised as 'harder' because it includes the meaning of item 14 and more. My test scores are high (item 16) was conceptualised as 'harder still'. The results (see Appendix A) show that the 'difficulties' of items 14 to 16 are in this conceptualised order.
Experiencing Success
The wording for the three items under Experiencing Success was created as a Guttman pattern. I do well at school (item 17) was conceptualised as 'easy'. I am a successful student (item 18) was conceptualised as 'harder' because it includes the meaning of item 17 and more. The work is easy (item 19) was conceptualised as 'harder still'. The results (see Appendix A) show that the 'difficulties' of items 17 to 19 are in this conceptualised order.
Engaging in School Work
The wording for the three items under Engaging in School Work was created as a Guttman pattern. I perform to the best of my ability (item 20) was conceptualised as 'easy'. I meet homework requirements (item 21) was conceptualised as 'harder' to achieve. I start work as soon as I enter the room (item 22) was conceptualised as 'harder still' to achieve. The results (see Appendix A) show that the 'difficulties' of items 20 to 22 are in this conceptualised order.
Discussion about Classroom Environment Attitudes and Behaviours
Classroom Learning
Class Emphasis on Learning
The wording for the four items under Class Emphasis on Learning was created as a Guttman pattern. Learning is really important in this class (item 23) was conceptualised as 'very easy'. I find new ways to learn in this class (item 24) was conceptualised as 'harder, but still 'easy' because it includes item 23 and more. We spend time thinking about how our classes are going (item 25) was conceptualised as 'harder still' because it includes items 23 and 24, and an evaluation of them. We don't waste time in this class (item 26) was conceptualised as 'harder again'. The results (see Appendix A) show that the 'difficulties' of items 23 to 26 are in this conceptualised order.
Class Learning with Peers
The wording for the three items under Class Learning with Peers was created as a Guttman pattern. Students learn from each other (item 27) was conceptualised as 'easy'. I take notice of what my classmates have to say about our learning (item 28) was conceptualised as 'harder' to achieve. Students do not stop others from working(item 29) was conceptualised as 'very much harder' to achieve. The results (see Appendix A) show that the 'difficulties' of items 27 to 29 are in this conceptualised order.
Class Emphasis on Performing Well
The wording for the four items under Class Emphasis on Performing Well was created as a Guttman pattern. We expect our test scores and/or grades to be high (item 30) was conceptualised as 'moderately easy' to agree with. Our work is marked quickly (item 31) was conceptualised as 'harder' to agree with. We are rewarded for doing well (item 32) was conceptualised as 'harder still' to agree with. The top students in this class are respected by others (item 33) was conceptualised as 'very hard' to agree with. The results (see Appendix A) show that the 'difficulties' of items 30 to 33 are in this conceptualised order.
Classroom Support
Helping Each Other
The wording for the four items under Helping Each Other was created as a Guttman pattern. Students support each other (item 34) was conceptualised as 'not very hard'.Students are willing to help each other when problems arise (item 35) was conceptualised as 'as slightly harder' because it involves item 34 and some more. Students always encourage each other to express our opinions (item 36) was conceptualised as 'harder still'. Students have problems with each other (item 37) was conceptualised as 'harder again'. The results (see Appendix A) show that the 'difficulties' of items 34 and 35 are the same within the error of measurement, and that items 36 and 37 are the same within the error of measurement, but 'harder' than items 34 and 35. So the conceptualised order was only partly supported and these items need to be re-worded.
Getting Along with Together
The wording for the four items under Getting Along Together was created as a Guttman pattern. Students look forward to being together (item 38) was conceptualised as 'not too hard'. Students make an effort to get on well with each other (item 39) was conceptualised as 'a little harder' to achieve. Our class is a happy place (item 40) was conceptualised as 'harder still' to achieve because it involves item 39 and some more. My views are supported by my classmates (item 41) was conceptualised as 'harder still'. The results (see Appendix A) show that the 'difficulties' of items 38 to 41 are in this conceptualised order, except that items 40 and 41 are the same within the error of measurement.
Caring About Each Other
The wording for the three items under Caring About Each Other was created as a Guttman pattern. Students are tolerant of one another (item 42) was conceptualised as 'hard' to agree with. Students care for each other (item 43) was conceptualised as 'harder' to agree with because it involves item 42 and some more. Students are not nasty towards each other (item 44) was conceptualised as 'very hard' to agree with. The results (see Appendix A) show that the 'difficulties' of items 42 to 44 are in this conceptualised order, except for items 42 and 43 which are the same within the error of measurement.
Classroom Discussion Behaviour
Discussion About Learning
The wording for the five items under Discussion About Learning was created as a Guttman pattern. There is a lot of talk about important matters (item 45) was conceptualised as 'slightly hard'. We talk about our test scores and grades (item 46) was conceptualised as 'as slightly harder'. We spend time discussing what should happen in this class (item 47) was conceptualised as 'harder still'. We have discussions about what we should be learning (item 48) was conceptualised as 'harder again'.We talk about our progress (item 49) was conceptualised as 'reasonably hard and hard'. The results (see Appendix A) show that the 'difficulties' of items 45 to 49 are in this conceptualised order.
Classroom Planning Behaviour
Sharing Classroom Planning with the Teacher
The wording for the three items under Sharing Classroom Planning with the Teacher was created as a Guttman pattern. We are involved in deciding how our progress will be assessed (item 50) was conceptualised as 'very hard' because it wasn't expected to happen very often. We are given assessment tasks or tests when we are ready(item 51) was conceptualised as 'harder still and hard' because it was expected to happen less often than item 50. We set the deadlines with the teacher for completing work (item 52) was conceptualised as 'very hard' because it was expected to happen leass often than in item 51. The results (see Appendix A) show that the 'difficulties' of items 50 to 52 are in this conceptualised order.
Student Views of Teacher's Behaviour to Decision-Making
The wording for the two items under Student Views of Teacher's Behaviour to Decision-Making was created as a Guttman pattern. The teacher does not dominate us(item 53) was conceptualised as 'hard' because it was expected this is what happened often. The teacher asks our advice (item 54) was conceptualised as 'harder still and hard' because it was expected to happen less often than item 53. The results (see Appendix A) show that the 'difficulties' of items 53 to 54 are in this conceptualised order.
Student Views of Teacher's Behaviour to Caring
The wording for the four items under Student Views of Teacher's Behaviour to Caring was created as a Guttman pattern. The teacher takes the side of students who are treated unfairly by others (item 55) was conceptualised as 'hard'. The teacher helps students who get into trouble around the school (item 56) was conceptualised as 'harder' to achieve. The teacher helps students with family problems (item 57) was conceptualised as 'harder still' to achieve because it involves more work and contact than in item 56. At times, the teacher
seems more like a mum or dad than a teacher (item 58) was conceptualised as 'very hard' because this would involve even more extra time, work and contact. The results (see Appendix A) show that the 'difficulties' of items 55 to 58 are in this conceptualised order.
Student Views of Teacher's Expectations for Students
The wording for the three items under Student Views of Teacher's Expectations for Students was created as a Guttman pattern. The teacher expects all students to be fully commited to their work (item 59) was conceptualised as 'very easy' to agree with. The teacher sets high standards (item 60) was conceptualised as 'harder, but still easy'. The teacher has high expectations of us (item 61) was conceptualised as 'harder still, but moderately easy'. The results (see Appendix A) show that the 'difficulties' of items 59 to 61 are in this conceptualised order.
Student Views of Parents' Attitudes and Behaviour
The wording for the five items under Student Views of Parents' Attitudes and Behaviour was created as a Guttman pattern. My parents take an interest in my progress(item 62) was conceptualised as 'moderately easy'. My parents are not critical of the teacher (item 63) was conceptualised as 'as slightly harder'. My parents are informed when I produce excellent work (item 64) was conceptualised as 'harder still', because it wasn't expected to happen much. My parents are given frequent information on my progress (item 65) was conceptualised as 'harder again and hard'. My parents communicate with the teacher (item 66) was conceptualised as 'harder still and hard'. The results (see Appendix A) show that the 'difficulties' of items 62 to 66 are in this conceptualised order.
Implications
The computer program RUMM (Andrich, Lyne, Sheridan & Luo, 2000), based on a Rasch measurement model (Andrich, 1988a; Rasch, 1960/1980), proved very useful in analysing the data to create an interval-level scale of Classroom Environment and in testing that the items fitted the measurement model. The scale had good psychometric properties. Student measures were calibrated on the same scale as the item 'difficulties'. This test has supported the ten-factor model of Classroom Environment and nearly all the Guttman patterns for the items of the ten factors. The measure of Classroom Environment has shown that educational outcomes are linked to the classroom environment. The measure implies that student self-reported higher order outcomes and formal learning outcomes are linked to student classroom learning attitudes and behaviours, student support, discussion about learning, planning on student progress, teachers' caring, teachers' expectations, and parents' attitudes and behaviours. This supports research by Coleman (1998a, 1998b), Stoll and Mortimore (1995), and Wang (1997) and goes further by making a direct measure of all the factors on the same scale.
An implication for researchers is that there should be more educational studies in which proper interval-scale measures are made of important variables. It is possible that useful relationships between variables can be made in educational psychology as they are in physics (see Wright, 1999, who argues this case). An example is now given. It is a little complicated because the present measure has no true zero. The difference between students caring for each other and their belief in the importance of education is about 1.4 times 'harder' than the difference between performing to the best of their ability and their belief in the importance of education [(+0.28) - (-2.04)]/[(-0.41) - (-2.04)] = 1.4. The difference between top students not being respected by others and their belief in the importance of education is about 1.8 times 'harder' than the difference between performing
to the best of their ability and their belief in the importance of education [(+0.84) - (-2.04)]/[(-0.41) - (-2.04)] = 1.8.
There are implications for teachers from the measurement of Classroom Environment reported by the students. The results imply that teachers at the two schools are imparting higher order outcomes to the students, such as the importance of education, of working towards educational goals, and of a desire to learn, and the students know this. There is an implication that teachers are setting and expecting high standards from the students, and that the students are committed to their educational work because of this. There is a focus on learning and developing good attitudes to learning, implying that the teachers are making this happen in the classrooms. These results support previous studies on effective schools (Stoll & Mortimer, 1995; Wang, 1997) and go further by making the measurement on a proper scale so that it can be clearly seen that the students report these factors as 'easy' in comparison to other factors (such as teachers' caring behaviour and classroom planning).
The measure implies that the teachers are making the planning decisions in regard to assessing progress and setting deadlines for completing work. The teachers do not ask advice of students very much and the students are not much involved in the decisions of assessment. The teachers are taking control of assessment. This complements the teachers' perceived focus on high standards, developing good attitudes and learning in the classroom. Despite this, students found it 'hard' to report that they are rewarded for doing well academically and that the top academic students are respected by other students. Although it wasn't asked, the implication is that top sporting students are more respected than top academic students. An implication for teachers and school administration is to change this.
The measure implies that teachers are not communicating enough with parents and parents are not communicating enough with teachers, in regards to student performance at school. For example, the students report that parents are not informed when their children perform well at school and that the parents are not given frequent information on their progress. Communication is a two-way process and there is an implication that both teachers and parents need to allocate more priority (than they currently do) to communicating with each other about their children's progress at school. A further implication is that the principals of the two schools need to provide leadership in terms of making communication with parents more of a priority. This is supported by previous research (Coleman, 1998a, 1998b) which suggests that schools are more effective when there is a partnership between teachers, parents and students.
The present study also found that students don't talk much between themselves, about their academic progress. The implication is that to be more effective, students should talk more about their academic progress.
There are implications in regard to student attitudes towards each other. The measure showed that students found it 'hard' to say that students are not nasty to each other, and 'moderately hard' to say that they tolerate and care for each other. It was 'hard' for students to report that they are rewarded for doing well in class and an implication is that teachers and schools do not provide sufficient rewards for high academic achievement. A further implication is that being kind, tolerating and caring for others is a learned behaviour and that these two schools are not teaching these behaviours as well as they could in their classrooms. The further implication is that this is an example of the lack of a triad link in effective schools between teachers, parents and students, as postulated by Coleman (1998a, 1998b). The principals could show their leadership by improving the communication between teachers, parents and students on these points, as well as academic progress, and making them an issue in the classrooms.
References
Andrich, D. (1989) Distinctions between assumptions and requirements in measurement in the social sciences,in: J.A.Keats, R.Taft, R.A.Heath, & S.Lovibond (Eds.), pp. 7-16, Mathematical and Theoretical Systems. Amsterdam, North-Holland: Elsevier Science Publishers.
Andrich, D. (1988a) A General Form of Rasch's Extended Logistic Model for Partial Credit Scoring, Applied Measurement in Education, 1 (4), pp. 363-378.
Andrich, D. (1988b) Rasch Models for Measurement . Sage university paper on quantitative applications in the social sciences, series number 07/068. Newbury Park, CA: Sage Publications.
Andrich, D. (1985) A latent trait model for items with response dependencies: Implications for test construction and analysis, in: S.E. Embretson (Ed.), Test Design: Developments in Psychology and Psychometrics (pp. 245-275). Orlando: Academic Press.
Andrich, D. (1982) Using latent trait measurement to analyse attitudinal
data: a synthesis of viewpoints, in: D. Spearitt (Ed.), The Improvement of Measurement in Education and Psychology, pp. 89-126. Melbourne: Australian Council for Educational Research.
Andrich, D., Sheridan, B., Lyne, A. & Luo, G. (2000). RUMM: A windows-based item analysis program employing Rasch unidimensional measurement models. Perth: Murdoch University.
Andrich, D. & van Schoubroeck, L. (1989). The General Health Questionnaire: a psychometric analysis using latent trait theory, Psychological Medicine, 19, pp. 469-485.
Cavanagh, R. F. & Dellar, G. B. (1997). Towards a model of school
culture, Paper presented at the 1997 Annual Meeting of the American
Educational Research Association in Chicago.
Cavanagh, R. F., Dellar, G. B. & Ellett, C. D. (1998). Changing the
context of learning environment research, Paper presented at the 1998 Annual Meeting of the American Educational Research Association in San Diego.
Cole, M. (1991) Conclusion, in: L. Resnick, J. Levine, and S. Teasley
(Eds.), Perspectives on socially shared cognition .Washington DC, American
Psychological Association.
Coleman, P. (1998a). Parent, student and teacher collaboration: The
Power of three. San Francisco, CA:Corwin Press Inc..
Coleman, P. (1998b). Triad influence: Shaping student commitment to
school, Paper presented at the 1998 Annual Meeting of the American Educational
Research Association in San Diego.
Curriculum Council (1998). Curriculum Framework. Perth:
Curriculum Council of Western Australia.
Ellett, C. D., Rugutt, J. K., Cavanagh, R.F. (1999). Context considerations in
conceptualising and measuring school culture: A comparison of teachers' perceptions
by school level. Paper presented at the Annual Meeting of the American Educational
Research Association in Montreal.
Fullan, M. G., Bennett, B. and Rolheiser-Bennett, C. (1990). Linking classroom
and school improvement, Educational Leadership, 47(8), pp. 13-19.
Fullan, M. G. and Hargreaves, A. (1992). What's worth fighting for
In your school? Buckingham: Open University Press.
Harris, A. (1995). Effective teaching. SIN Research Matters No. 3. London:
London Institute of Education.
Hillman, J. & Stoll, L. (1994). Research matters No. 1: Understanding
school improvement. London: London Institute of Education.
Hopkins, D., Ainscow, M. and West, M. (1994). School improvement in
An era of change. London: Cassell.
McCarthy, S. (1994). Authors, text and talk: The internalisation of dialogue
from social interaction during writing. Reading Research Quarterly, 29, pp. 201-231.
Merson, M. (1990).The problem of teaching style in TVEI, in: D Hopkins
(Ed.). TVEI at the change of life. Bristol: Multilingual Matters.
Olsen, D.G. (1999). Constructivist principles of learning and teaching
methods, Education, 120 (2), pp. 347-357.
Samdal, O., Wold, B. & Bronis, M. (1999). Relationship between
students' perceptions of school environment, their satisfaction with school and
perceived academic achievement: An international study, School Effectiveness and
School Improvement, 10 (3), pp. 296-320.
Sergiovanni, T. J. (2000). The lifeworld of leadership: Creating culture,
community and personal meaning in our schools. San Francisco, CA: Jossey-Bass.
Sergiovanni, T. J. (1993).Organisations or communities? Changing the
metaphor changes the theory, Invited address, American Educational Research
Association, Atlanta, Georgia.
Stoll, L. & Fink, D. (1996). Changing our schools. Buckingham, UK: Open
University Press.
Stoll, L. and Mortimore, P. (1995). Viewpoint no 2: School effectiveness
and school improvement. London: London Institute of Education.
Wang, M. C. (1997). Research on school effects in urban schools. National
Research Centre on Education in the Inner Cities, Philadelphia, PA. ED406504.
Rasch, G. (1960/1980). Probabilistic models for intelligence and attainment tests (expanded edition). Chicago, IL: The University of Chicago Press (original work published in 1960).
Styles, I. & Andrich, D. (1993) Linking the standard and advanced forms of the Raven's Progressive Matrices in both the pencil-and-paper and computer-adaptive testing formats, Educational and Psychological Measurement, 53 (4), pp. 905-925.
Waugh, R.F. (2002, in press) Creating a scale to measure Motivation to achieve academically: Linking attitudes and behaviours using Rasch measurement, British Journal of Educational Psychology.
Waugh, R. F. (2001) Measuring ideal and real self-concept on the same scale based on a multifaceted, hierarchical model of self-concept, Educational and Psychological Measurement, 61 (1), pp. 85-101.
Waugh, R.F. (2000) Self-Concept: Multidimensional or multifaceted, unidimensional? Education Research & Perspectives, 27 (2), pp.75-94.
Waugh, R. F. (1999) Approaches to Studying Inventory for students in higher education: A Rasch measurement model analysis, British Journal of Educational Psychology, 69, pp. 63-79.
Wright, B. D. (1999). Fundamental measurement in psychology. In, The new rules of measurement, S.E. Embretson & S. L. Hershberger (Eds.) (pp. 65-104). Mahwah, NJ: Lawrence Erlbaum Associates.
Wright, B.D. & Masters, G.N. (1982). Rating scale analysis: Rasch measurement. Chicago. IL, MESA.
Appendix A
THIS QUESTIONNAIRE IS ANONYMOUS. PLEASE DON'T PUT YOUR NAME OR ANY IDENTIFICATION ON IT.
PLEASE READ THE CONSENT AND COVER PAGE.
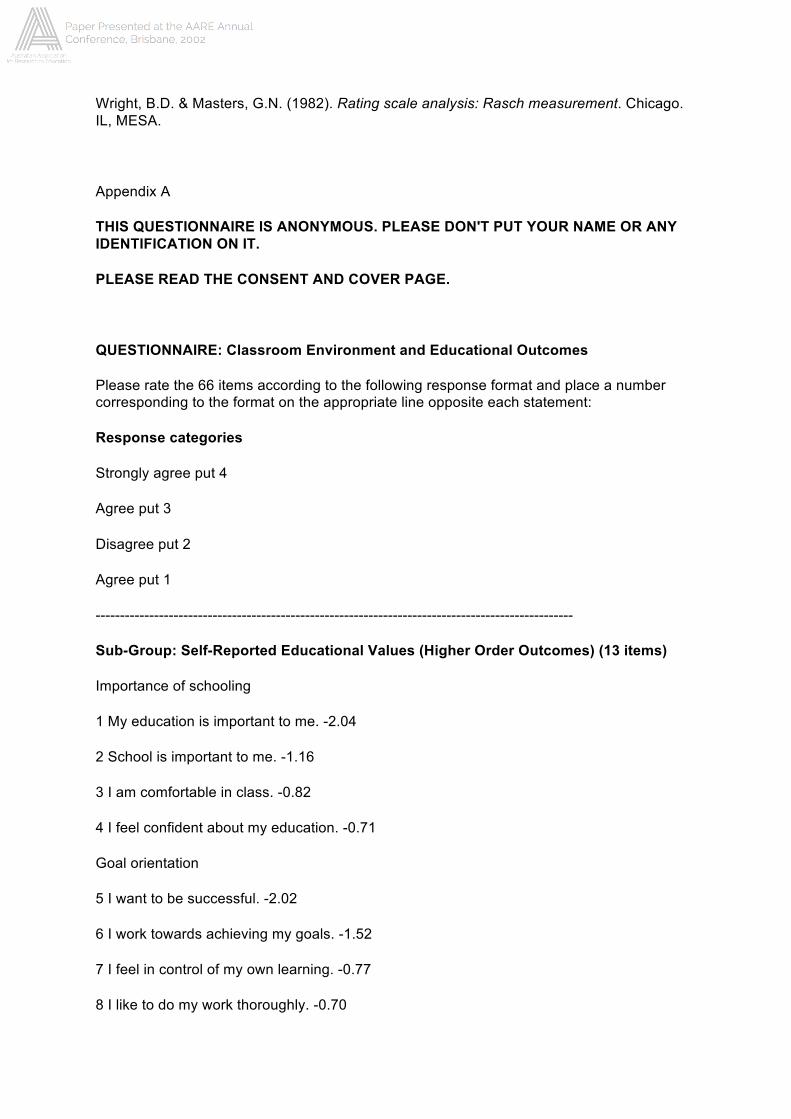
QUESTIONNAIRE: Classroom Environment and Educational Outcomes
Please rate the 66 items according to the following response format and place a number corresponding to the format on the appropriate line opposite each statement:
Response categories
Strongly agree put 4
Agree put 3
Disagree put 2
Agree put 1
--------------------------------------------------------------------------------------------------
Sub-Group: Self-Reported Educational Values (Higher Order Outcomes) (13 items)
Importance of schooling
1 My education is important to me. -2.04
2 School is important to me. -1.16
3 I am comfortable in class. -0.82
4 I feel confident about my education. -0.71
Goal orientation
5 I want to be successful. -2.02
6 I work towards achieving my goals. -1.52
7 I feel in control of my own learning. -0.77
8 I like to do my work thoroughly. -0.70
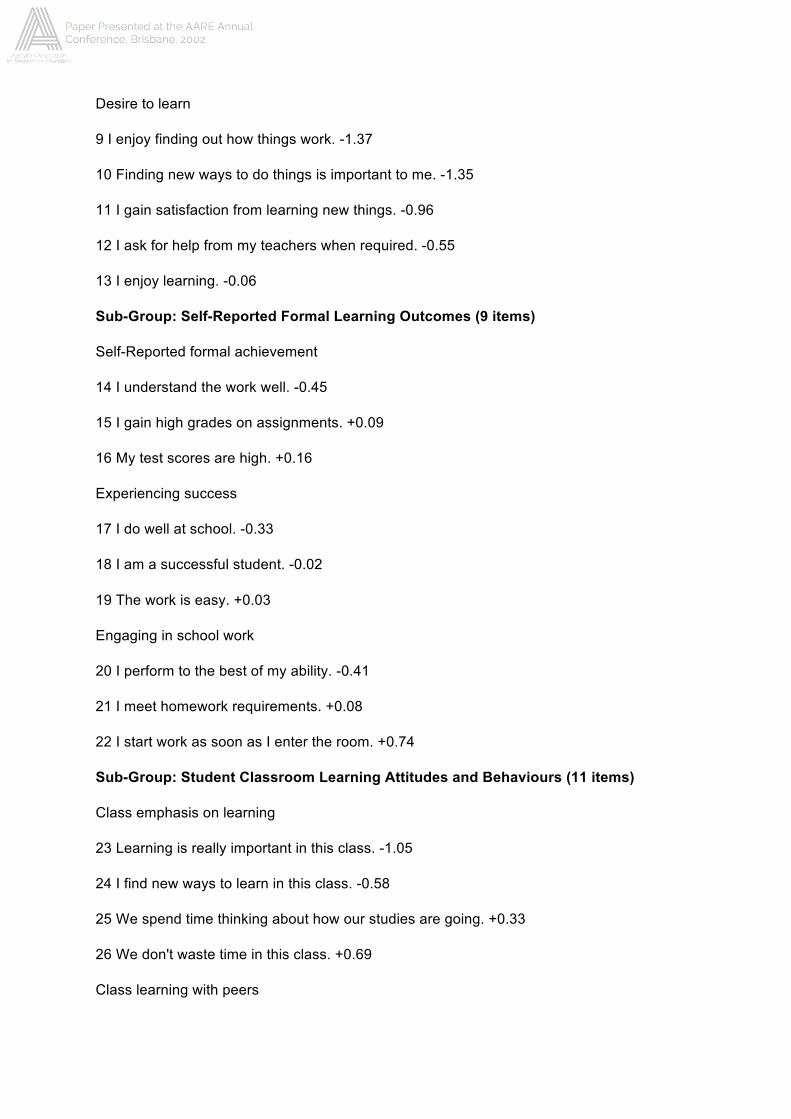
Desire to learn
9 I enjoy finding out how things work. -1.37
10 Finding new ways to do things is important to me. -1.35
11 I gain satisfaction from learning new things. -0.96
12 I ask for help from my teachers when required. -0.55
13 I enjoy learning. -0.06
Sub-Group: Self-Reported Formal Learning Outcomes (9 items)
Self-Reported formal achievement
14 I understand the work well. -0.45
15 I gain high grades on assignments. +0.09
16 My test scores are high. +0.16
Experiencing success
17 I do well at school. -0.33
18 I am a successful student. -0.02
19 The work is easy. +0.03
Engaging in school work
20 I perform to the best of my ability. -0.41
21 I meet homework requirements. +0.08
22 I start work as soon as I enter the room. +0.74
Sub-Group: Student Classroom Learning Attitudes and Behaviours (11 items)
Class emphasis on learning
23 Learning is really important in this class. -1.05
24 I find new ways to learn in this class. -0.58
25 We spend time thinking about how our studies are going. +0.33
26 We don't waste time in this class. +0.69
Class learning with peers
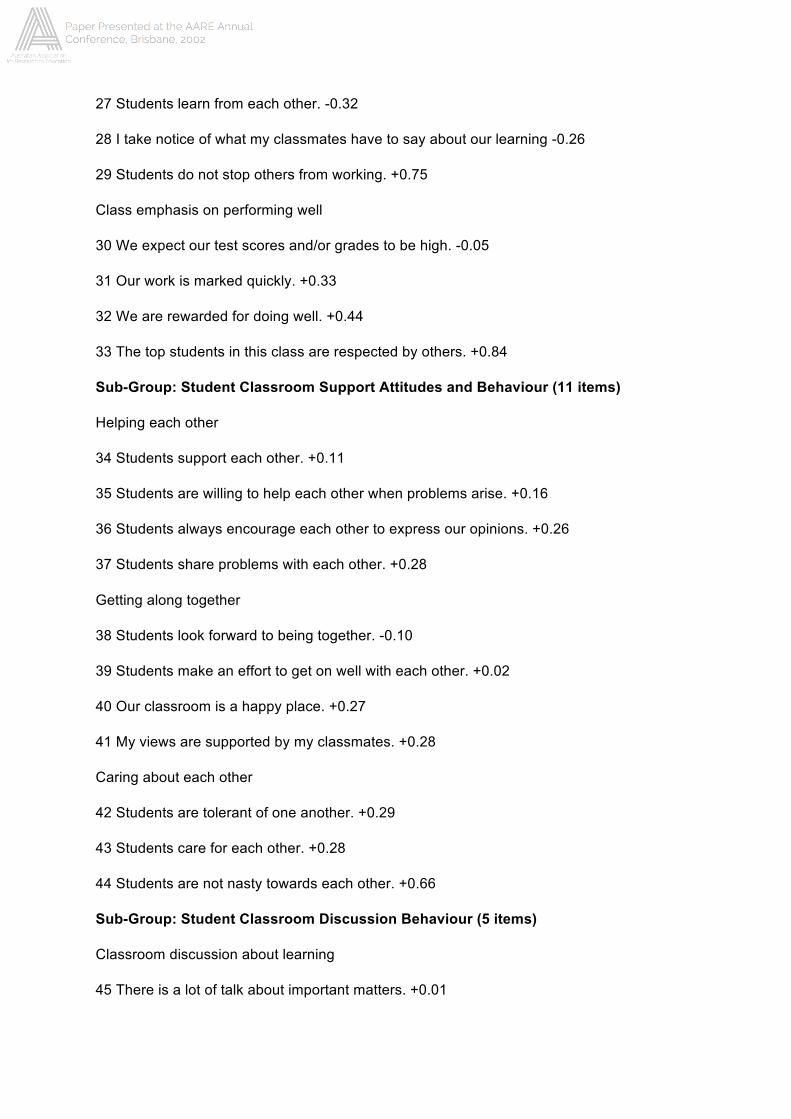
27 Students learn from each other. -0.32
28 I take notice of what my classmates have to say about our learning -0.26
29 Students do not stop others from working. +0.75
Class emphasis on performing well
30 We expect our test scores and/or grades to be high. -0.05
31 Our work is marked quickly. +0.33
32 We are rewarded for doing well. +0.44
33 The top students in this class are respected by others. +0.84
Sub-Group: Student Classroom Support Attitudes and Behaviour (11 items)
Helping each other
34 Students support each other. +0.11
35 Students are willing to help each other when problems arise. +0.16
36 Students always encourage each other to express our opinions. +0.26
37 Students share problems with each other. +0.28
Getting along together
38 Students look forward to being together. -0.10
39 Students make an effort to get on well with each other. +0.02
40 Our classroom is a happy place. +0.27
41 My views are supported by my classmates. +0.28
Caring about each other
42 Students are tolerant of one another. +0.29
43 Students care for each other. +0.28
44 Students are not nasty towards each other. +0.66
Sub-Group: Student Classroom Discussion Behaviour (5 items)
Classroom discussion about learning
45 There is a lot of talk about important matters. +0.01
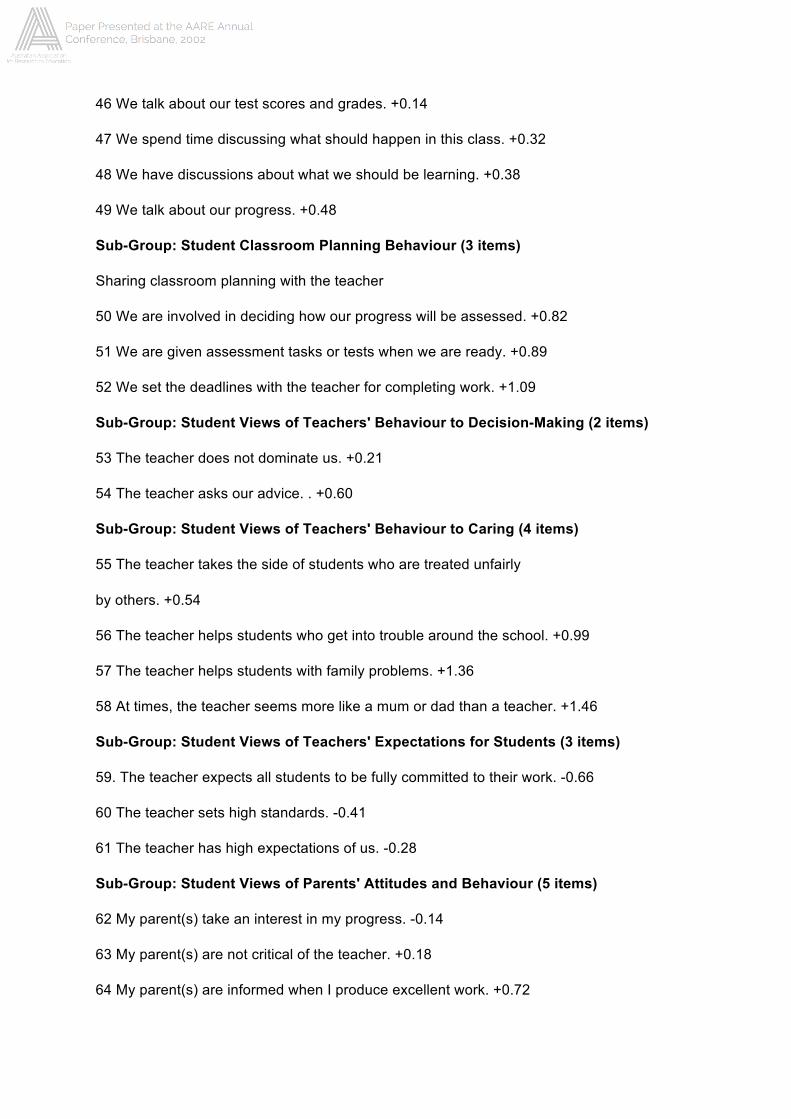
46 We talk about our test scores and grades. +0.14
47 We spend time discussing what should happen in this class. +0.32
48 We have discussions about what we should be learning. +0.38
49 We talk about our progress. +0.48
Sub-Group: Student Classroom Planning Behaviour (3 items)
Sharing classroom planning with the teacher
50 We are involved in deciding how our progress will be assessed. +0.82
51 We are given assessment tasks or tests when we are ready. +0.89
52 We set the deadlines with the teacher for completing work. +1.09
Sub-Group: Student Views of Teachers' Behaviour to Decision-Making (2 items)
53 The teacher does not dominate us. +0.21
54 The teacher asks our advice. . +0.60
Sub-Group: Student Views of Teachers' Behaviour to Caring (4 items)
55 The teacher takes the side of students who are treated unfairly
by others. +0.54
56 The teacher helps students who get into trouble around the school. +0.99
57 The teacher helps students with family problems. +1.36
58 At times, the teacher seems more like a mum or dad than a teacher. +1.46
Sub-Group: Student Views of Teachers' Expectations for Students (3 items)
59. The teacher expects all students to be fully committed to their work. -0.66
60 The teacher sets high standards. -0.41
61 The teacher has high expectations of us. -0.28
Sub-Group: Student Views of Parents' Attitudes and Behaviour (5 items)
62 My parent(s) take an interest in my progress. -0.14
63 My parent(s) are not critical of the teacher. +0.18
64 My parent(s) are informed when I produce excellent work. +0.72
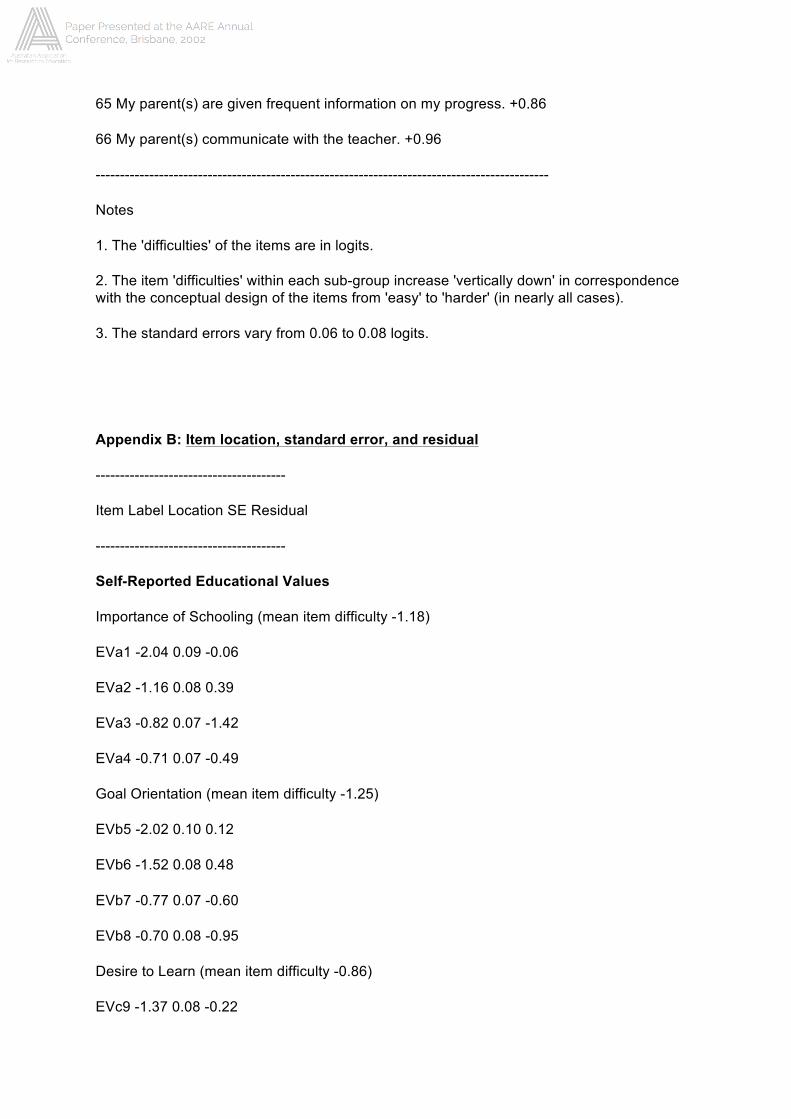
65 My parent(s) are given frequent information on my progress. +0.86
66 My parent(s) communicate with the teacher. +0.96
---------------------------------------------------------------------------------------------
Notes
1. The 'difficulties' of the items are in logits.
2. The item 'difficulties' within each sub-group increase 'vertically down' in correspondence with the conceptual design of the items from 'easy' to 'harder' (in nearly all cases).
3. The standard errors vary from 0.06 to 0.08 logits.
Appendix B: Item location, standard error, and residual
---------------------------------------
Item Label Location SE Residual
---------------------------------------
Self-Reported Educational Values
Importance of Schooling (mean item difficulty -1.18)
EVa1 -2.04 0.09 -0.06
EVa2 -1.16 0.08 0.39
EVa3 -0.82 0.07 -1.42
EVa4 -0.71 0.07 -0.49
Goal Orientation (mean item difficulty -1.25)
EVb5 -2.02 0.10 0.12
EVb6 -1.52 0.08 0.48
EVb7 -0.77 0.07 -0.60
EVb8 -0.70 0.08 -0.95
Desire to Learn (mean item difficulty -0.86)
EVc9 -1.37 0.08 -0.22
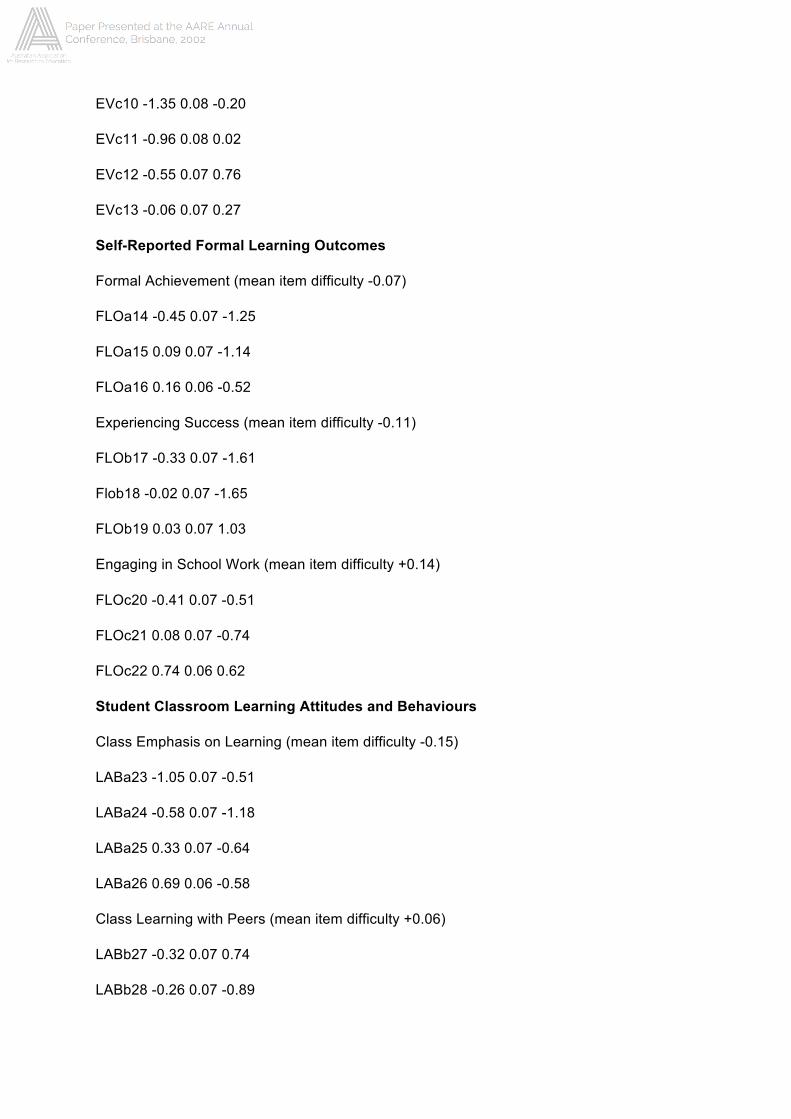
EVc10 -1.35 0.08 -0.20
EVc11 -0.96 0.08 0.02
EVc12 -0.55 0.07 0.76
EVc13 -0.06 0.07 0.27
Self-Reported Formal Learning Outcomes
Formal Achievement (mean item difficulty -0.07)
FLOa14 -0.45 0.07 -1.25
FLOa15 0.09 0.07 -1.14
FLOa16 0.16 0.06 -0.52
Experiencing Success (mean item difficulty -0.11)
FLOb17 -0.33 0.07 -1.61
Flob18 -0.02 0.07 -1.65
FLOb19 0.03 0.07 1.03
Engaging in School Work (mean item difficulty +0.14)
FLOc20 -0.41 0.07 -0.51
FLOc21 0.08 0.07 -0.74
FLOc22 0.74 0.06 0.62
Student Classroom Learning Attitudes and Behaviours
Class Emphasis on Learning (mean item difficulty -0.15)
LABa23 -1.05 0.07 -0.51
LABa24 -0.58 0.07 -1.18
LABa25 0.33 0.07 -0.64
LABa26 0.69 0.06 -0.58
Class Learning with Peers (mean item difficulty +0.06)
LABb27 -0.32 0.07 0.74
LABb28 -0.26 0.07 -0.89
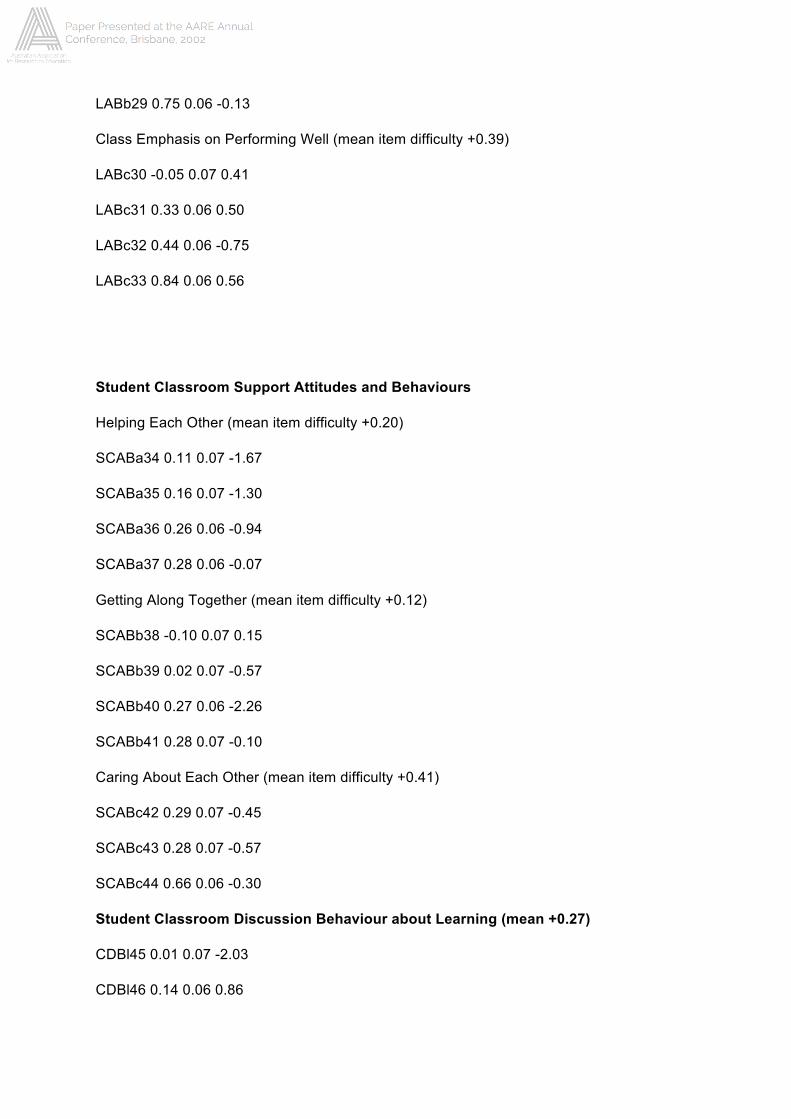
LABb29 0.75 0.06 -0.13
Class Emphasis on Performing Well (mean item difficulty +0.39)
LABc30 -0.05 0.07 0.41
LABc31 0.33 0.06 0.50
LABc32 0.44 0.06 -0.75
LABc33 0.84 0.06 0.56
Student Classroom Support Attitudes and Behaviours
Helping Each Other (mean item difficulty +0.20)
SCABa34 0.11 0.07 -1.67
SCABa35 0.16 0.07 -1.30
SCABa36 0.26 0.06 -0.94
SCABa37 0.28 0.06 -0.07
Getting Along Together (mean item difficulty +0.12)
SCABb38 -0.10 0.07 0.15
SCABb39 0.02 0.07 -0.57
SCABb40 0.27 0.06 -2.26
SCABb41 0.28 0.07 -0.10
Caring About Each Other (mean item difficulty +0.41)
SCABc42 0.29 0.07 -0.45
SCABc43 0.28 0.07 -0.57
SCABc44 0.66 0.06 -0.30
Student Classroom Discussion Behaviour about Learning (mean +0.27)
CDBl45 0.01 0.07 -2.03
CDBl46 0.14 0.06 0.86
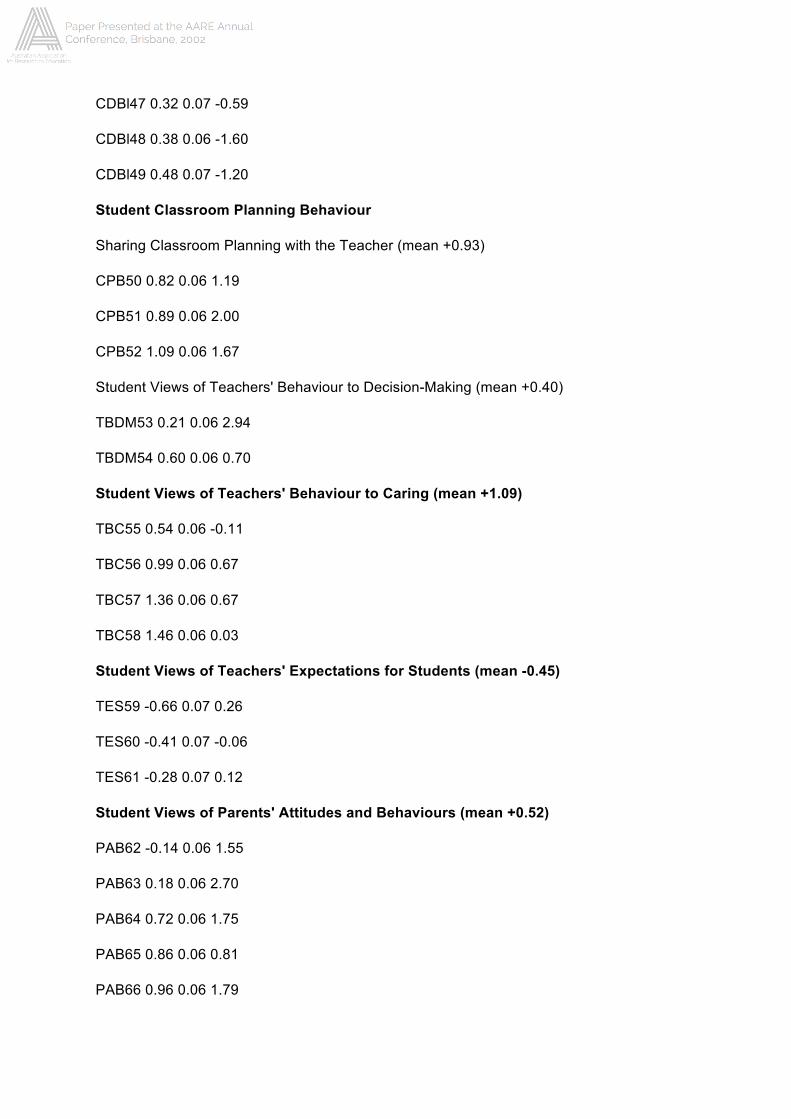
CDBl47 0.32 0.07 -0.59
CDBl48 0.38 0.06 -1.60
CDBl49 0.48 0.07 -1.20
Student Classroom Planning Behaviour
Sharing Classroom Planning with the Teacher (mean +0.93)
CPB50 0.82 0.06 1.19
CPB51 0.89 0.06 2.00
CPB52 1.09 0.06 1.67
Student Views of Teachers' Behaviour to Decision-Making (mean +0.40)
TBDM53 0.21 0.06 2.94
TBDM54 0.60 0.06 0.70
Student Views of Teachers' Behaviour to Caring (mean +1.09)
TBC55 0.54 0.06 -0.11
TBC56 0.99 0.06 0.67
TBC57 1.36 0.06 0.67
TBC58 1.46 0.06 0.03
Student Views of Teachers' Expectations for Students (mean -0.45)
TES59 -0.66 0.07 0.26
TES60 -0.41 0.07 -0.06
TES61 -0.28 0.07 0.12
Student Views of Parents' Attitudes and Behaviours (mean +0.52)
PAB62 -0.14 0.06 1.55
PAB63 0.18 0.06 2.70
PAB64 0.72 0.06 1.75
PAB65 0.86 0.06 0.81
PAB66 0.96 0.06 1.79
-----------------------------------------------------
Notes
1. Location (item 'difficulty') is measured in logits (log odds of answering positively). 2. SE is the standard error in logits. 3. Residual is the item-student interaction test-of-fit statistic for each item.
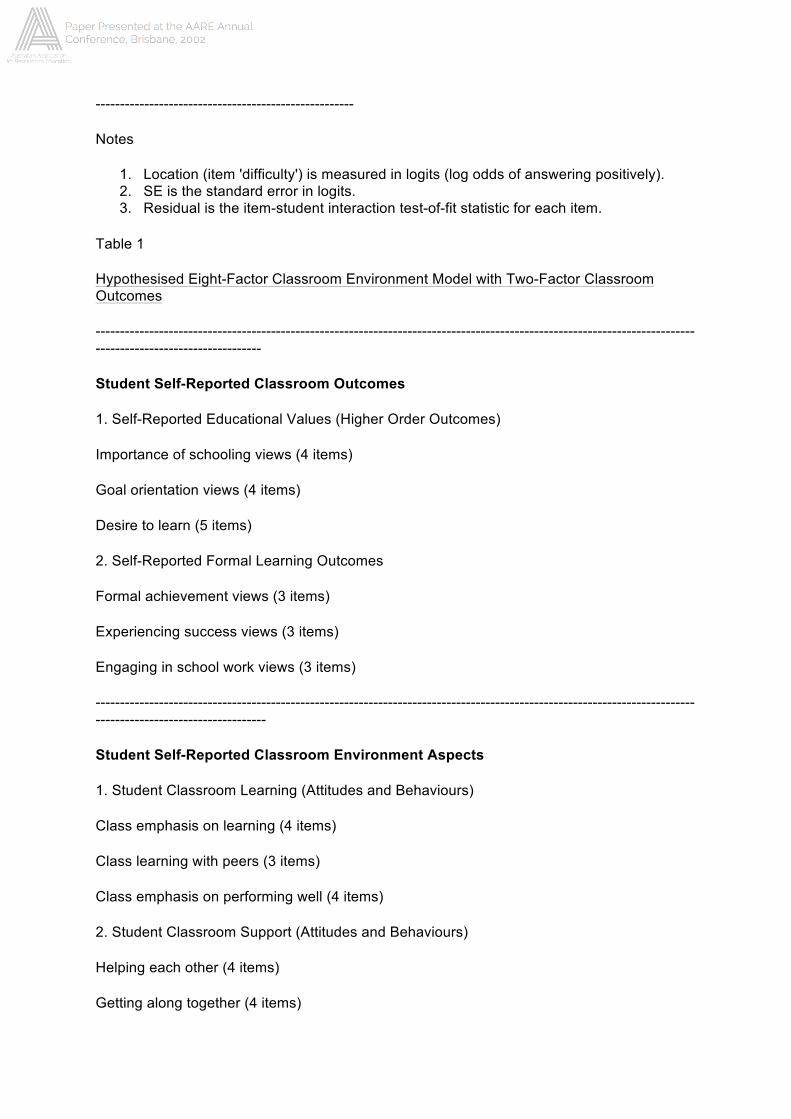
Table 1
Hypothesised Eight-Factor Classroom Environment Model with Two-Factor Classroom Outcomes
-------------------------------------------------------------------------------------------------------------------------------------------------------------
Student Self-Reported Classroom Outcomes
1. Self-Reported Educational Values (Higher Order Outcomes)
Importance of schooling views (4 items)
Goal orientation views (4 items)
Desire to learn (5 items)
2. Self-Reported Formal Learning Outcomes
Formal achievement views (3 items)
Experiencing success views (3 items)
Engaging in school work views (3 items)
--------------------------------------------------------------------------------------------------------------------------------------------------------------
Student Self-Reported Classroom Environment Aspects
1. Student Classroom Learning (Attitudes and Behaviours)
Class emphasis on learning (4 items)
Class learning with peers (3 items)
Class emphasis on performing well (4 items)
2. Student Classroom Support (Attitudes and Behaviours)
Helping each other (4 items)
Getting along together (4 items)
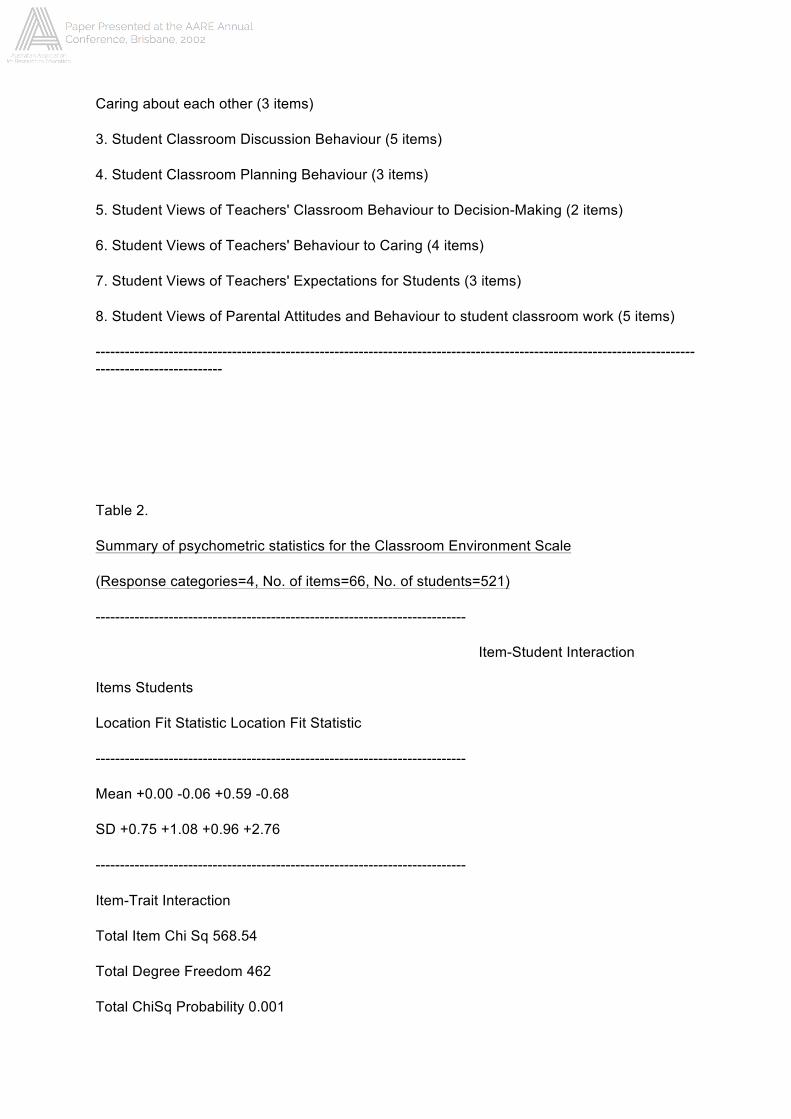
Caring about each other (3 items)
3. Student Classroom Discussion Behaviour (5 items)
4. Student Classroom Planning Behaviour (3 items)
5. Student Views of Teachers' Classroom Behaviour to Decision-Making (2 items)
6. Student Views of Teachers' Behaviour to Caring (4 items)
7. Student Views of Teachers' Expectations for Students (3 items)
8. Student Views of Parental Attitudes and Behaviour to student classroom work (5 items)
-----------------------------------------------------------------------------------------------------------------------------------------------------
Table 2.
Summary of psychometric statistics for the Classroom Environment Scale
(Response categories=4, No. of items=66, No. of students=521)
----------------------------------------------------------------------------
Item-Student Interaction
Items Students
Location Fit Statistic Location Fit Statistic
----------------------------------------------------------------------------
Mean +0.00 -0.06 +0.59 -0.68
SD +0.75 +1.08 +0.96 +2.76
----------------------------------------------------------------------------
Item-Trait Interaction
Total Item Chi Sq 568.54
Total Degree Freedom 462
Total ChiSq Probability 0.001
----------------------------------------------------------------------------
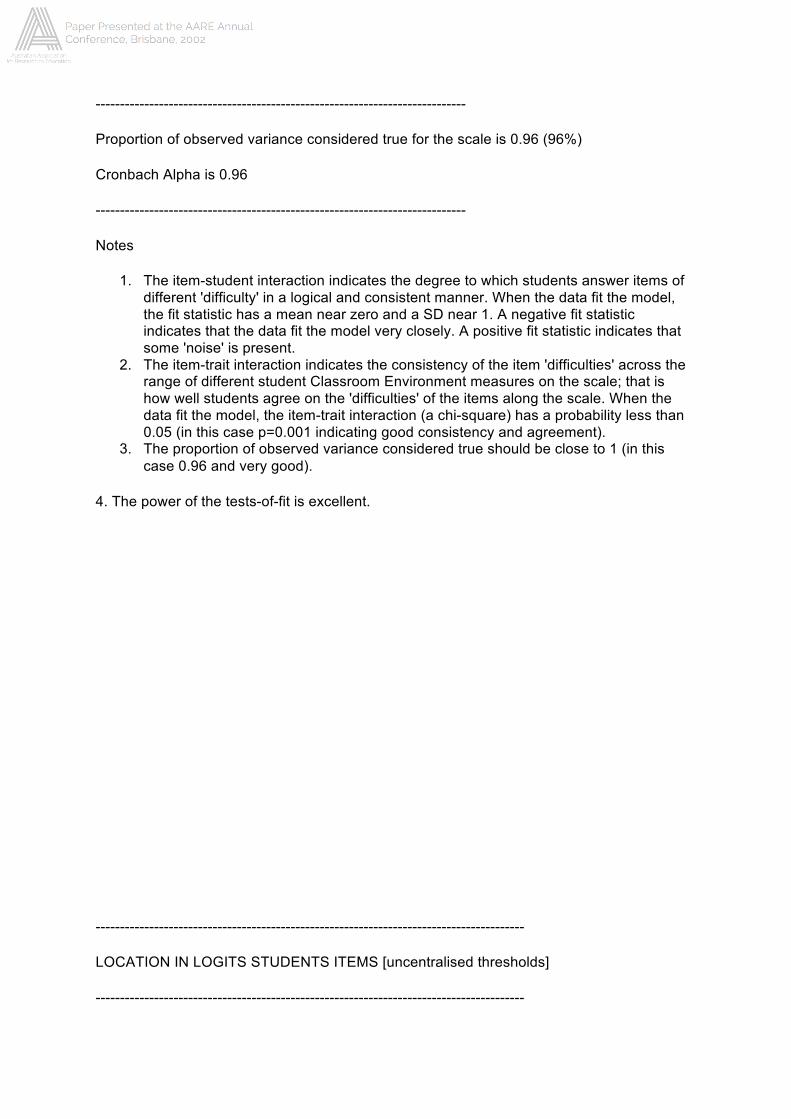
Proportion of observed variance considered true for the scale is 0.96 (96%)
Cronbach Alpha is 0.96
----------------------------------------------------------------------------
Notes
1. The item-student interaction indicates the degree to which students answer items of different 'difficulty' in a logical and consistent manner. When the data fit the model, the fit statistic has a mean near zero and a SD near 1. A negative fit statistic indicates that the data fit the model very closely. A positive fit statistic indicates that some 'noise' is present.
2. The item-trait interaction indicates the consistency of the item 'difficulties' across the range of different student Classroom Environment measures on the scale; that is how well students agree on the 'difficulties' of the items along the scale. When the data fit the model, the item-trait interaction (a chi-square) has a probability less than 0.05 (in this case p=0.001 indicating good consistency and agreement).
3. The proportion of observed variance considered true should be close to 1 (in this case 0.96 and very good).
4. The power of the tests-of-fit is excellent.
----------------------------------------------------------------------------------------
LOCATION IN LOGITS STUDENTS ITEMS [uncentralised thresholds]
----------------------------------------------------------------------------------------
4.0 High Classroom | 'Difficult' Items
Environment |
|
|
X |
3.0 | TBC56.3
X | CCABc42.3 TBC57.3 LABb29.3 LABa25.3 CDBL49.3
XXX | PAB66.3 CDBL47.3 SCABb41.3 PAB65.3 LABa26.3 TBC58.3
CPB50.3 SCABc43.3 LABc33.3 CPB52.3
X | PAB64.3 TBC55.3 FLOc22.3 CDBL48.3 SCABa34.3
CPB51.3 SCABc44.3 SCABa35.3 EVc13.3
XX | FLOa16.3 LABc30.3 SCABa36.3 CDBL45.3 FLOc21.3
FLOb19.3 TBDM54.3 SCABa37.3
2. XXX | FLOb17.3 LABc31.3 EVb8.3 CDBL46.3 SCABb40.3
SCABb38.3 SCABb39.3 FLOa15.3 FLOb18.3 LABc32.3
XXXXX | TES60.3 LABa24.3 TBDM53.3 LABb28.3
XXXXXXX | LABb27.3 EVc10.3 TES59.3 EVc11.3 EVc12.3
EVa4.3 FLOa14.3 PAB63.3
XXXXX | TBC58.2 FLOc20.3 EVb7.3 TES61.3
XXXXXXXXXXXX | EVa3.3 EVc9.3 TBC57.2 PAB62.3
1.0 XXXXXXXXXXXX | PAB66.2
XXXXXXXXXXXXXXXX | EVb6.3 PAB65.2 CPB51.2 CPB52.2 FLOc22.2
EVa2.3
XXXXXXXXXXXXXXXXX | LABb29.2 CPB50.2 LABa23.3
XXXXXXXXXXXXXXXXXX | LABc33.2 PAB64.2 SCABc44.2 LABa26.2
XXXXXXXXXXXXXXXXXX | LABc31.2 TBC58.1 SCABa36.2 FLOb19.2 CDBL49.2
TBC56.2 TBDM54.2
0.0 XXXXXXXXXXXXXXXXXX | CDBL47.2 EVa1.3 SCABa37.2 TBC55.2 LABc32.2
XXXXXXXXXX | SCABb41.2 CDBL45.2 LABa25.2 TBC57.1 CDBL48.2
SCABc43.2 FLOa16.2 CDBL46.2
XXXXXXXX | PAB63.2 SCABb38.2 SCABc42.2 SCABa35.2 FLOa15.2
SCABa34.2
XXXXXX | TBC56.1 LABc30.2 CPB52.1
X | PAB64.1 PAB66.1 LABc33.1 FLOc20.2 CPB51.1 EVc13.2
LABa24.2 SCABb40.1 LABb27.2 SCABb39.2 TBDM53.1 EVb5.3
FLOb18.2 TBDM53.2 FLOc21.2 SCABb40.2
-1.0 XXX | TES61.2 EVc12.2 PAB62.1 TBDM54.1 PAB63.1 FLOb17.2
TBC55.1 LABb28.2 PAB62.2
XX | FLOc22.1 FLOa14.2 SCABc44.1 TES60.2 LABc32.1 CPB50.1
PAB65.1
X | SCABb39.1 TES59.2 EVb8.2 LABc31.1 CDBL48.1 LABb29.1
EVa4.2 EVb7.2 EVc10.2 LABa26.1
X | EVa4.2 SCABc42.1 SCABa37.1 LABa23.2 EVa3.2 TES61.1
EVc9.2 FLOc21.1
X | LABc30.1 LABa25.1 SCABa35.1 SCABa36.1 CDBL47.1
CDBL46.1 FLOa16.1 SCABb41.1 FLOa15.1 FLOb18.1
-2.0 | EVb6.2 SCABa34.1 TES60.1 LABb28.1 FLOa14.1 SCABc43.1
LABb27.1 EVa2.2 CDBL49.1
| FLOb17.1 CDBL45.1 SCABb38.1 EVc13.1 FLOc20.1
| EVc12.1 LABa23.1 TES59.1 EVa3.1
X | EVa4.1 FLOb19.1 EVb5.1
| EVb7.1 EVa2.1
-3.0 | EVc11.1 EVb5.2 EVb8.1 EVa1.2 LABa24.1
|
| EVa1.1
| EVb6.1
|
-4.0 | EVc9.1
|
|
| EVc10.1
|
-5.0 Low Classroom | "easy' items
Environment |
|
---------------------------------------------------------------------------------------
X = 3 students
---------------------------------------------------------------------------------------
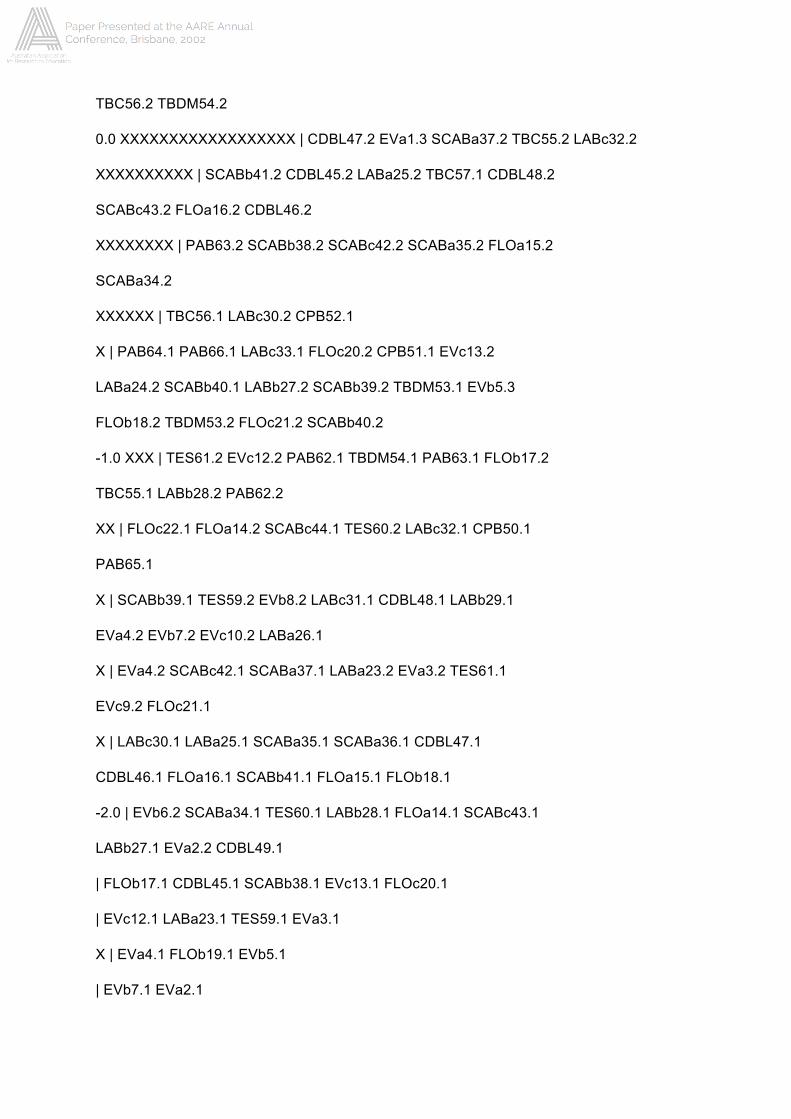
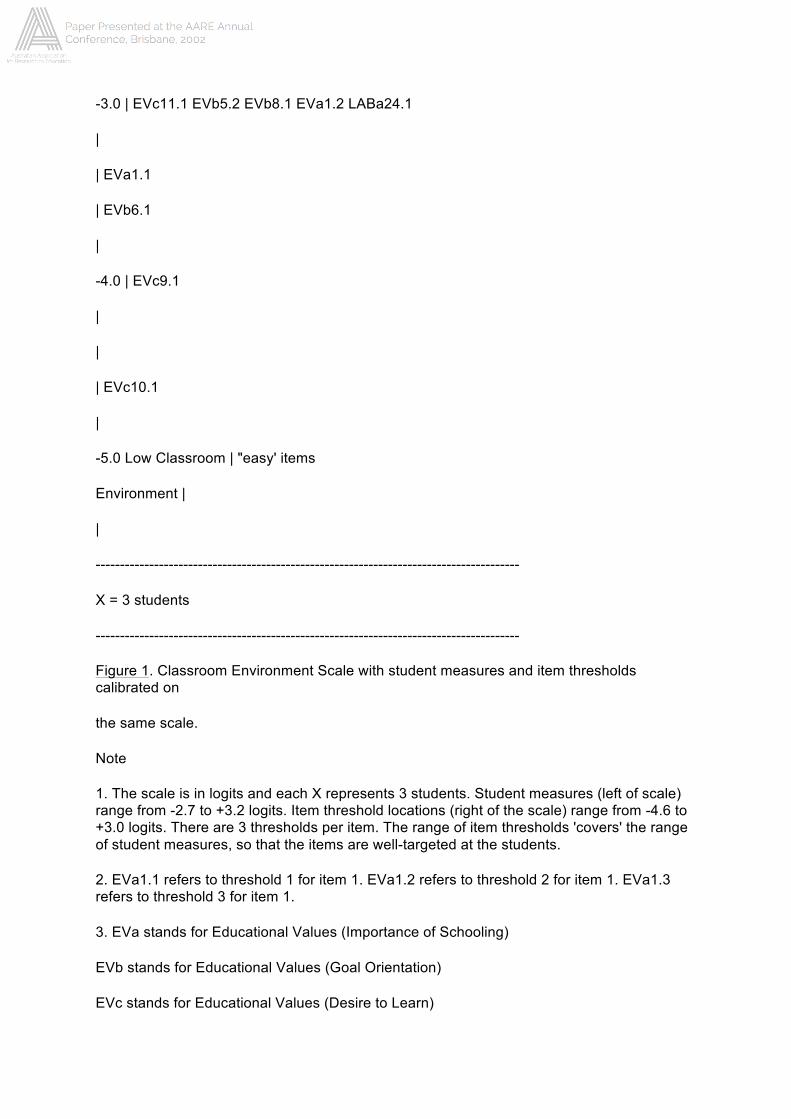
Figure 1. Classroom Environment Scale with student measures and item thresholds calibrated on
the same scale.
Note
1. The scale is in logits and each X represents 3 students. Student measures (left of scale) range from -2.7 to +3.2 logits. Item threshold locations (right of the scale) range from -4.6 to +3.0 logits. There are 3 thresholds per item. The range of item thresholds 'covers' the range of student measures, so that the items are well-targeted at the students.
2. EVa1.1 refers to threshold 1 for item 1. EVa1.2 refers to threshold 2 for item 1. EVa1.3 refers to threshold 3 for item 1.
3. EVa stands for Educational Values (Importance of Schooling)
EVb stands for Educational Values (Goal Orientation)
EVc stands for Educational Values (Desire to Learn)
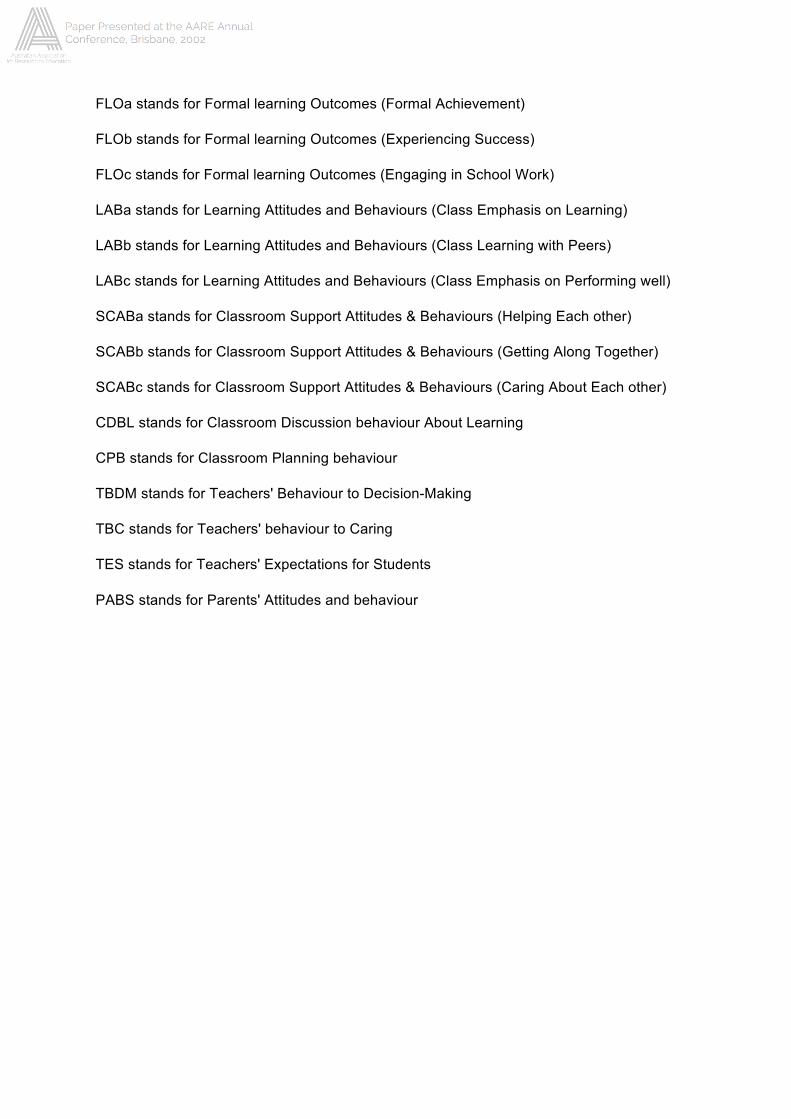
FLOa stands for Formal learning Outcomes (Formal Achievement)
FLOb stands for Formal learning Outcomes (Experiencing Success)
FLOc stands for Formal learning Outcomes (Engaging in School Work)
LABa stands for Learning Attitudes and Behaviours (Class Emphasis on Learning)
LABb stands for Learning Attitudes and Behaviours (Class Learning with Peers)
LABc stands for Learning Attitudes and Behaviours (Class Emphasis on Performing well)
SCABa stands for Classroom Support Attitudes & Behaviours (Helping Each other)
SCABb stands for Classroom Support Attitudes & Behaviours (Getting Along Together)
SCABc stands for Classroom Support Attitudes & Behaviours (Caring About Each other)
CDBL stands for Classroom Discussion behaviour About Learning
CPB stands for Classroom Planning behaviour
TBDM stands for Teachers' Behaviour to Decision-Making
TBC stands for Teachers' behaviour to Caring
TES stands for Teachers' Expectations for Students
PABS stands for Parents' Attitudes and behaviour