Embed Size (px)
Citation preview
FULLERTONSCHOOLDISTRICT
ORANGECOUNTY
AUDITREPORT
FortheFiscalYearEndedJune30,2019

FULLERTONSCHOOLDISTRICTFortheFiscalYearEndedJune30,2019TableofContents
FINANCIALSECTION Page
Independent Auditors’ Report ................................................................................................................................................................. 1 Management’s Discussion and Analysis ............................................................................................................................................... 3 Basic Financial Statements:
Government-wide Financial Statements: Statement of Net Position .......................................................................................................................................................... 17 Statement of Activities ................................................................................................................................................................ 18
Governmental Funds Financial Statements: Balance Sheet – Governmental Funds .................................................................................................................................. 19 Reconciliation of the Governmental Funds Balance Sheet to the Statement of Net Position ...................... 20 Statement of Revenues, Expenditures, and Changes in Fund Balances ................................................................ 21 Reconciliation of the Governmental Funds Statement of Revenues, Expenditures, and Changes in Fund Balances to the Statement of Activities ........................................................................ 22
Proprietary Fund Financial Statements: Statement of Net Position .......................................................................................................................................................... 23 Statement of Revenues, Expenses, and Changes in Net Position ............................................................................. 24 Statement of Cash Flows ............................................................................................................................................................ 25
Fiduciary Funds Financial Statement: Statement of Fiduciary Net Position ..................................................................................................................................... 26
Notes to Financial Statements ............................................................................................................................................................... 27
REQUIREDSUPPLEMENTARYINFORMATION Budgetary Comparison Schedule – General Fund ........................................................................................................................ 69 Budgetary Comparison Schedule – Cafeteria Fund ...................................................................................................................... 70 Schedule of Proportionate Share of the Net Pension Liability ................................................................................................ 71 Schedule of Pension Contributions ..................................................................................................................................................... 72 Schedule of Changes in the District’s Total OPEB Liability and Related Ratios .............................................................. 73 Schedule of the District’s Proportionate Share of the Net OPEB Liability-MPP Program ........................................... 74 Notes to the Required Supplementary Information .................................................................................................................... 75
SUPPLEMENTARYINFORMATION Local Educational Agency Organization Structure ....................................................................................................................... 77 Schedule of Average Daily Attendance .............................................................................................................................................. 78 Schedule of Instructional Time ............................................................................................................................................................. 79 Schedule of Financial Trends and Analysis...................................................................................................................................... 80 Reconciliation of Annual Financial and Budget Report with Audited Financial Statements .................................... 81 Schedule of Expenditures of Federal Awards ................................................................................................................................. 82 Note to the Supplementary Information ........................................................................................................................................... 83

FULLERTONSCHOOLDISTRICTFortheFiscalYearEndedJune30,2019TableofContents
OTHERINDEPENDENTAUDITORS’REPORTS Page
Independent Auditors’ Report on Internal Control over Financial Reporting and on Compliance and Other Matters Based on an Audit of Financial Statements Performed in Accordance with GovernmentAuditingStandards ..................................................................................................................................................... 84 Independent Auditors’ Report on Compliance For Each Major Federal Program and Report on Internal Control Over Compliance Required by the Uniform Guidance ........................................................................................ 86 Independent Auditors’ Report on State Compliance ................................................................................................................... 88
FINDINGSANDQUESTIONEDCOSTS
Schedule of Audit Findings and Questioned Costs: Summary of Auditors’ Results ...................................................................................................................................................... 90 Current Year Audit Findings and Questioned Costs ........................................................................................................... 91 Summary Schedule of Prior Audit Findings ........................................................................................................................... 94

FinancialSection

(Thispageintentionallyleftblank)

1
INDEPENDENTAUDITORS’REPORT Board of Trustees Fullerton School District Fullerton, California ReportontheFinancialStatementsWe have audited the accompanying financial statements of the governmental activities, each major fund, and the aggregate remaining fund information of Fullerton School District, as of and for the fiscal year ended June 30, 2019, and the related notes to the financial statements, which collectively comprise the District’s basic financial statements as listed in the table of contents. Management’sResponsibilityfortheFinancialStatementsManagement is responsible for the preparation and fair presentation of these financial statements in accordance with accounting principles generally accepted in the United States of America; this includes the design, implementation, and maintenance of internal control relevant to the preparation and fair presentation of financial statements that are free from material misstatement, whether due to fraud or error. Auditors’ResponsibilityOur responsibility is to express opinions on these financial statements based on our audit. We conducted our audit in accordance with auditing standards generally accepted in the United States of America, the standards applicable to financial audits contained in GovernmentAuditingStandards, issued by the Comptroller General of the United States, and the 2018‐19Guide forAnnualAudits ofK‐12 Local EducationAgencies and StateComplianceReporting. Those standards require that we plan and perform the audit to obtain reasonable assurance about whether the financial statements are free from material misstatement. An audit involves performing procedures to obtain audit evidence about the amounts and disclosures in the financial statements. The procedures selected depend on the auditor’s judgment, including the assessment of the risks of material misstatement of the financial statements, whether due to fraud or error. In making those risk assessments, the auditor considers internal control relevant to the entity’s preparation and fair presentation of the financial statements in order to design audit procedures that are appropriate in the circumstances, but not for the purpose of expressing an opinion on the effectiveness of the entity’s internal control. Accordingly, we express no such opinion. An audit also includes evaluating the appropriateness of accounting policies used and the reasonableness of significant accounting estimates made by management, as well as evaluating the overall presentation of the financial statements. We believe that the audit evidence we have obtained is sufficient and appropriate to provide a basis for our audit opinions. OpinionsIn our opinion, the financial statements referred to above present fairly, in all material respects, the respective financial position of the governmental activities, each major fund, and the aggregate remaining fund information of Fullerton School District, as of June 30, 2019, and the respective changes in financial position and, where applicable, cash flows thereof for the fiscal year then ended in accordance with accounting principles generally accepted in the United States of America.

2
OtherMattersRequiredSupplementaryInformationAccounting principles generally accepted in the United States of America require that the management's discussion and analysis, budgetary comparison information, schedule of proportionate share of the net pension liability, schedule of pension contributions, schedule of changes in the District’s total OPEB liability and related ratios, schedule of the District’s proportionate share of the net OPEB liability-MPP Program, and the notes to the required supplementary information be presented to supplement the basic financial statements. Such information, although not a part of the basic financial statements, is required by the Governmental Accounting Standards Board, who considers it to be an essential part of financial reporting for placing the basic financial statements in an appropriate operational, economic, or historical context. We have applied certain limited procedures to the required supplementary information in accordance with auditing standards generally accepted in the United States of America, which consisted of inquiries of management about the methods of preparing the information and comparing the information for consistency with management's responses to our inquiries, the basic financial statements, and other knowledge we obtained during our audit of the basic financial statements. We do not express an opinion or provide any assurance on the information because the limited procedures do not provide us with sufficient evidence to express an opinion or provide any assurance. OtherInformationOur audit was conducted for the purpose of forming opinions on the financial statements that collectively comprise the District's basic financial statements. The supplementary information is presented for purposes of additional analysis and is not a required part of the basic financial statements. The schedule of expenditures of federal awards is presented for purposes of additional analysis as required by Title 2 U.S. Code of Federal Regulations (CFR) Part 200, UniformAdministrativeRequirements,CostPrinciples,andAuditRequirements for Federal Awards, and is also not a required part of the basic financial statements. The supplementary information on pages 78 to 81 and the schedule of expenditures of federal awards on page 82 are the responsibility of management and were derived from and relate directly to the underlying accounting and other records used to prepare the basic financial statements. Such information has been subjected to the auditing procedures applied in the audit of the basic financial statements and certain additional procedures, including comparing and reconciling such information directly to the underlying accounting and other records used to prepare the basic financial statements or to the basic financial statements themselves, and other additional procedures in accordance with auditing standards generally accepted in the United States of America. In our opinion, the information is fairly stated in all material respects in relation to the basic financial statements as a whole. The information on page 77 has not been subjected to the auditing procedures applied in the audit of the basic financial statements and accordingly, we do not express an opinion or provide any assurance on it. OtherReportingRequiredbyGovernmentAuditingStandardsIn accordance with GovernmentAuditingStandards,we have also issued our report dated November 19, 2019, on our consideration of the District’s internal control over financial reporting and on our tests of its compliance with certain provisions of laws, regulations, contracts, and grant agreements and other matters. The purpose of that report is to describe the scope of our testing of internal control over financial reporting and compliance and the results of that testing, and not to provide an opinion on internal control over financial reporting or on compliance. That report is an integral part of an audit performed in accordance with Government Auditing Standards in considering the District’s internal control over financial reporting and compliance.
Murrieta, California November 19, 2019

3
FULLERTONSCHOOLDISTRICTManagement’sDiscussionandAnalysis(Unaudited)FortheFiscalYearEndedJune30,2019 INTRODUCTION The following discussion and analysis provides an overview of the financial position and activities of the District for the year ended June 30, 2019. This discussion has been prepared by management and should be read in conjunction with the financial statements and notes thereto which follow this section. The Fullerton School District is a large suburban school district offering instruction to students from transitional kindergarten through eighth grade, including programs for preschool and special education. During the 2018-19 school year, the District operated fifteen elementary schools, two K-8 schools, and three junior high schools, on the traditional August through May schedule, for the instruction of approximately 12,995 students. MISSIONSTATEMENT The mission of the Fullerton School District is to work collaboratively with the community to provide an innovative, high-quality educational program for all students in a safe learning environment. Our motto, “Great Schools ‐ Successful Kids” exemplifies the belief that all students will achieve academic excellence, acquire interpersonal skills, and develop technological expertise to contribute as productive citizens in a democratic society.
FocusingonExcellence StudentLearning Prepare students to be successful in high school, college and career by fostering students’ personalized
interest and passion as well as increasing student self-efficacy through mastery of grade level content standards, technology, and the 5 C’s (communication, collaboration, creativity, critical thinking, character) needed for students to be innovative in the 21st Century. Students will be able to identify interests and a pathway to college and career by 8th grade. Additionally, students prepared to take A-G requirements will increase.
BudgetandResources Ensure long-term District financial stability that provides adequate funding for all desired programs,
facilities, and the resources necessary to attract highly qualified staff while maintaining a budget free of structural deficit spending.
Staffing Recruit, hire and develop the best staff possible is a top priority, as great teachers are key to achieving a
high quality of education in our District. Where children are adversely impacted, we will take steps to dismiss unsatisfactory performers.
ParentsandCommunity High level of focus on parent and community engagement in all areas of programming and committees by
fostering a culture throughout the District where community and family feel welcomed, respected and appreciated.

4
FULLERTONSCHOOLDISTRICTManagement’sDiscussionandAnalysis(Unaudited)FortheFiscalYearEndedJune30,2019 FINANCIALHIGHLIGHTS DistrictwideFinancialStatements As of June 30, 2019, the District’s overall financial condition decreased from June 30, 2018, as Net
Position decreased $5.4 million. The sum of general revenues, operating grants and contributions, and charges for services was less than total expenses, creating the decrease.
Overall revenues increased $11.4 million, to $162.5 million. The largest category of revenue to the District is the Local Control Funding Formula (LCFF), which makes up $115.2 million (71%) of total revenues.
Overall expenditures increased $5.3 million, to $168 million. The majority of expenditures ($120.0 million) were for instruction and instruction-related services.
Since revenues increased less than expenditures, the change in net position showed a decrease of $5.4
million. This amount represents a decrease in the District’s reserves.
Total District-wide expenses were $168 million. Because a portion of these costs was paid for with charges, fees, and federal and state categorical programs, the net cost that required taxpayer funding was $135.3 million.
GeneralFundFinancialStatements The District’s General Fund recorded a net increase to the ending Fund Balance for the year. Actual
results were better than the revised operating budget for the year. This positive variance came about primarily because of underspending across all programs, as well as underspending of restricted categorical funds (which will be carried over into the next fiscal year).
Revenues of $155.2 million ($121.7 million Unrestricted, $33.5 million Restricted) were received. Expenditures of $152.4 million ($101.1 million Unrestricted, $51.3 million Restricted) were made.
The net result of operations was an increase to the ending fund balance of $2.8 million. ($1.0 million
increase in Unrestricted, $1.8 million increase in Restricted) A five-year history of the District’s General Fund is as follows:
Net ChangeIn
Unrestricted Restricted Total Fund Balance
2014-15 28,753,801$ 2,973,908$ 31,727,709$ 1,387,334$ 2015-16 31,512,672 6,200,580 37,713,252 5,985,543 2016-17 35,063,235 3,576,145 38,639,380 926,129 2017-18 31,918,473 3,300,180 35,218,653 (3,420,727) 2018-19 32,867,741 5,127,310 37,995,051 2,776,398
Ending Fund Balance

5
FULLERTONSCHOOLDISTRICTManagement’sDiscussionandAnalysis(Unaudited)FortheFiscalYearEndedJune30,2019 FINANCIALHIGHLIGHTS(continued) GeneralFundFinancialStatements(continued)
$-
$10,000,000
$20,000,000
$30,000,000
$40,000,000
$50,000,000
2014-15 2015-16 2016-17 2017-18 2018-19
Fullerton School District General Fund Balance
Unrestricted Fund Balance Restricted Fund Balance
At June 30, 2019, the District’s General Fund Balance was comprised of:
Reserved Amounts $ 4,789,751 Legally Restricted Balances 5,127,310 Assigned 5,254,869 Unassigned 22,823,121
Total $ 37,995,051
The amount Designated for Economic Uncertainties was $4,572,359, or 3% of total General Fund expenditures. The State mandated requirement is a 3% reserve. The actual amounts reported above are for the General Fund only, and do not agree with the amounts reported on the Statement of Revenues, Expenditures, and Changes in Fund Balances because the amounts on that schedule include the financial activity of the Deferred Maintenance Fund, Special Reserve Fund for Other Than Capital Outlay Projects, and Special Reserve Fund for Postemployment Benefits, in accordance with the fund type definitions promulgated by GASB Statement No. 54.

6
FULLERTONSCHOOLDISTRICTManagement’sDiscussionandAnalysis(Unaudited)FortheFiscalYearEndedJune30,2019 FINANCIALHIGHLIGHTS(continued) LCFFandAverageDailyAttendance(ADA)The majority of the District’s unrestricted revenues are received from the State through the LCFF. The State switched to the LCFF funding formula in the 2013-14 fiscal year. The State’s 2013-14 budget presented an extraordinary change in California school district funding. The Revenue limits and most categorical programs which have existed since the 1970’s Serranovs.Priest decision were eliminated. Instead, the State implemented the Local Control Funding Formula (LCFF). Under LCFF, instead of the State allocating funds and requiring the Districts to spend money on programs and service the State determines are a priority, the new funding formula gives local boards control over how to use funds and resources in a way that improves outcomes and opportunities for all students. The new funding model specifically addresses students with greater needs – such as English learners, low-income and foster youth – with input from the community and with specific student outcome in mind. While the main drivers of the Revenue Limit were Average Daily Attendance (ADA) and State-funded Cost of Living Adjustment (COLA), LCFF adds two additional factors:
Unduplicated Percentages - defined as those students enrolled in the Free and Reduced Lunch program, English Language Learners, and Foster Youth. Due to the widely differing unduplicated count percentages in different school districts, the amounts received in LCFF funding will vary widely by District will become even more disparate as time goes on.
Percentage of Gap Funding during Transition: Full implementation of the LCFF was beyond the
State’s prior year financial means. Therefore, the State initially intended to fully implement LCFF over an eight-year period. Each year, as part of the budget process, the Legislature and Governor (with consideration of the COLA and Proposition 98 requirements) will determine the amount of the gap funding to implement in the current budget year. For 2018-19, LCFF is was fully funded.
The District calculates its LCFF apportionment based upon a formula incorporating these inputs. The District receives its share of local property taxes, and the State provides Apportionment Revenue to make up the total LCFF earned.
7
FULLERTONSCHOOLDISTRICTManagement’sDiscussionandAnalysis(Unaudited)FortheFiscalYearEndedJune30,2019 FINANCIALHIGHLIGHTS(continued)AverageDailyAttendance(ADA)Virtually all of the District’s funding is based upon the number of students in attendance at District schools, or Average Daily Attendance (ADA). ADA is calculated based upon the actual number of days a student attends school, divided by the total possible instructional days (180 days for a full school year). Thus, a student who attends class every day of the school year, with no absences, earns one ADA. The District’s main source of funding, the Local Control Funding Formula (LCFF) is calculated based upon the District’s Second Period (“P-2”) ADA. If a district is in a declining enrollment situation (like Fullerton School District), LCFF is calculated based upon the higher, prior-year ADA. Therefore, even though enrollment decreased by approximately 291 students in fiscal year 2018-19, the District still earned LCFF based upon the higher 2017-18 ADA. The lower ADA for 2018-19 is reflected in the 2019-20 LCFF. This one-year lag is projected to continue for the foreseeable future as the District remains in declining enrollment. P-2 apportionment-earning ADA used in the calculation of the Revenue Limit/LCFF for the past five years, and the estimated LCFF ADA for the current year, is as follows:
2014-15 13,565 2015-16 13,384 2016-17 13,218 2017-18 12,924 2018-19 12,665
2019-20 Est 12,465
12,000 12,100 12,200 12,300 12,400 12,500 12,600 12,700 12,800 12,900 13,000 13,100 13,200 13,300 13,400 13,500 13,600
2014-15 2015-16 2016-17 2017-18 2018-19 2019-20 Est
Fullerton School District LCFF ADA

8
FigureA‐1.OrganizationofFullertonSchoolDistrict’sAnnualFinancialReport
FULLERTONSCHOOLDISTRICTManagement’sDiscussionandAnalysis(Unaudited)FortheFiscalYearEndedJune30,2019 OVERVIEWOFTHEFINANCIALSTATEMENTS This annual report consists of three parts – management discussion and analysis (this section), the basic financial statements, and required supplementary information. The basic financial statements include two kinds of statements that present different views of the District: The first two statements are district‐wide financial statements that provide both short-term and long-
term information about the District’s overall financial status. The remaining statements are fund financial statements that focus on individual parts of the District,
reporting the District’s operations in more detail than the district-wide statements. The governmentalfunds statements tell how basic services like regular and special education were
financed in the short term as well as what remains for future spending. Short and long-term financial information about the activities of the District that operate like
businesses (self-insurance funds) are provided in the proprietaryfundsstatements. Fiduciary funds statement provides information about the financial relationships in which the
District acts solely as a trustee or agent for the benefit of others to whom the resources belong. The financial statements also include notes that explain some of the information in the statements and provide more detailed data. Figure A-1 shows how the various parts of this annual report are arranged and related to one another.
Management’sDiscussionandAnalysis
BasicFinancial
Information
RequiredSupplementaryInformation
FundFinancialStatements
District‐WideFinancialStatements
NotestoFinancialStatements
SUMMARY DETAIL

9
FULLERTONSCHOOLDISTRICTManagement’sDiscussionandAnalysis(Unaudited)FortheFiscalYearEndedJune30,2019 OVERVIEWOFTHEFINANCIALSTATEMENTS(continued) Figure A-2 summarizes the major features of the District’s financial statements, including the portion of the District’s activities they cover and the types of information they contain.
FigureA‐2.MajorFeaturesoftheDistrict‐WideandFundFinancialStatements
TypeofStatements
District‐Wide GovernmentalFunds
ProprietaryFunds
FiduciaryFunds
Scope Entire District, except fiduciary activities
The activities of the District that are not proprietary or fiduciary, such as special education and building maintenance
Activities of the District that operate like a business, such as self-insurance funds
Instances in which the District administers resources on behalf of someone else, such as scholarship programs and student activities monies
Requiredfinancialstatements
Statement of Net Position
Statement of Activities
Balance Sheet
Statement of Revenues, Expenditures & Changes in Fund Balances
Statement of Net Position
Statement of Revenues, Expenses, & Changes in Net Position
Statement of Cash Flows
Statement of Fiduciary Net Position
Accountingbasisandmeasurementfocus
Accrual accounting and economic resources focus
Modified accrual accounting and current financial resources focus
Accrual accounting and economic resources focus
Accrual accounting and economic resources focus
Typeofasset/liabilityinformation
All assets and liabilities, both financial and capital, short-term and long-term
Only assets expected to be used up and liabilities that come due during the year or soon thereafter; no capital assets included
All assets and liabilities, both short-term and long-term; The District’s funds do not currently contain nonfinancial assets, though they can
All assets and liabilities, both short-term and long-term; The District’s funds do not currently contain nonfinancial assets, though they can
Typeofinflow/outflowinformation
All revenues and expenses during year, regardless of when cash is received or paid
Revenues for which cash is received during or soon after the end of the year; expenditures when goods or services have been received and payment is due during the year or soon thereafter
All revenues and expenses during the year, regardless of when cash is received or paid
All revenues and expenses during the year, regardless of when cash is received or paid

10
FULLERTONSCHOOLDISTRICTManagement’sDiscussionandAnalysis(Unaudited)FortheFiscalYearEndedJune30,2019 OVERVIEWOFTHEFINANCIALSTATEMENTS(continued) The remainder of this overview section of management’s discussion and analysis highlights the structure and contents of each of the statements. District‐WideStatementsThe district-wide statements report information about the District as a whole using accounting methods similar to those used by private-sector companies. The statement of net position includes all of the District’s assets and liabilities. All of the current year’s revenues and expenses are accounted for in the statement of activities regardless of when cash is received or paid. The two district-wide statements report the District’s net position and how it has changed. Net position – the difference between the District’s assets and deferred outflows of resources and liabilities and deferred inflows of resources – is one way to measure the District’s financial health, or position. Over time, increases and decreases in the District’s net position are an indicator of whether its financial
position is improving or deteriorating, respectively. To assess the overall health of the District, you need to consider additional nonfinancial factors such as
changes in the District’s demographics and the condition of school buildings and other facilities. In the district-wide financial statements, the District’s activities are categorized as Governmental
Activities. Most of the District’s basic services are included here, such as regular and special education, transportation, and administration. Property taxes and state aid finance most of these activities.
FundFinancialStatementsThe fund financial statements provide more detailed information about the District’s most significant funds – not the District as a whole. Funds are accounting devices the District uses to keep track of specific sources of funding and spending on particular programs: Some funds are required by State law and by bond covenants. The District establishes other funds to control and manage money for particular purposes (like repaying
its long-term debt) or to show that it is properly using certain revenues. The District has three kinds of funds: Governmental funds – Most of the District’s basic services are included in governmental funds, which
generally focus on (1) how cash and other financial assets that can readily be converted to cash flow in and out and (2) the balances left at year-end that are available for spending. Consequently, the governmental funds statements provide a detailed short-term view that helps you determine whether there are more or fewer financial resources that can be spent in the near future to finance the District’s programs. Because this information does not encompass the additional long-term focus of the district-wide statements, we provide additional information on a separate reconciliation page that explains the relationship (or differences) between them.

11
FULLERTONSCHOOLDISTRICTManagement’sDiscussionandAnalysis(Unaudited)FortheFiscalYearEndedJune30,2019 FundFinancialStatements(continued) Proprietary funds –When the District charges other District funds for the services it provides, these
services are reported in proprietary funds. Proprietary funds are reported in the same way that all activities are reported in the Statement of Net Position and Statement of Activities. In fact, the District’s internal service fund is included within the governmental activities reported in the district-wide statements but provides more detail and additional information, such as cash flows. The District uses the internal service fund to report activities that relate to the District’s self-insured program for workers’ compensation claims and property and liability losses.
Fiduciary funds – The District is the trustee, or fiduciary, for assets that belong to others, namely, the
student activities funds. The District is responsible for ensuring that the assets reported in these funds are used only for their intended purposes and by those to whom the assets belong. All of the District’s fiduciary activities are reported in a separate statement of fiduciary net position. We exclude these activities from the district-wide financial statements because the District cannot use these assets to finance its operations.
FINANCIALANALYSISOFTHEDISTRICTASAWHOLENetPosition. The District's combined net position was lower on June 30, 2019, than it was the year before – decreasing 9.1% to $(65.0) million (See Table A-1). TableA‐1:StatementofNetPosition
VarianceIncrease
2019 2018 (Decrease)Assets
Current assets 58,443,239$ 58,800,453$ (357,214)$ Capital assets 83,897,785 85,323,110 (1,425,325) Totalassets 142,341,024 144,123,563 (1,782,539)
Deferredoutflowsofresources 42,963,270 44,314,467 (1,351,197) Liabilities
Current liabilities 5,444,683 7,759,733 (2,315,050) Long-term liabilities 80,373,970 78,665,385 1,708,585 Net pension liability 151,841,524 149,449,341 2,392,183 Totalliabilities 237,660,177 235,874,459 1,785,718
Deferredinflowsofresources 12,682,009 12,157,218 524,791 Netposition
Net investment in capital assets 54,311,093 51,958,256 2,352,837 Restricted 15,693,145 14,785,140 908,005 Unrestricted (136,871,161) (126,337,043) (10,534,118) Totalnetposition (66,866,923)$ (59,593,647)$ (7,273,276)$
GovernmentalActivities
12
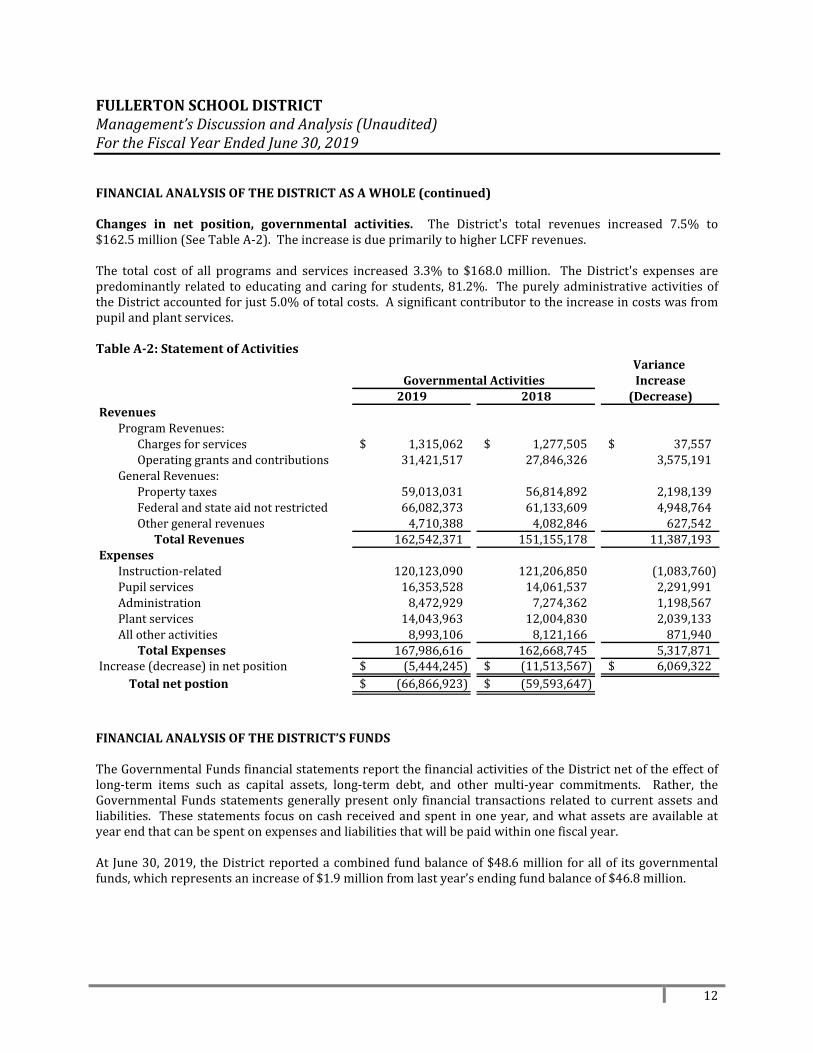
FULLERTONSCHOOLDISTRICTManagement’sDiscussionandAnalysis(Unaudited)FortheFiscalYearEndedJune30,2019 FINANCIALANALYSISOFTHEDISTRICTASAWHOLE(continued) Changes in net position, governmental activities. The District's total revenues increased 7.5% to $162.5 million (See Table A-2). The increase is due primarily to higher LCFF revenues. The total cost of all programs and services increased 3.3% to $168.0 million. The District's expenses are predominantly related to educating and caring for students, 81.2%. The purely administrative activities of the District accounted for just 5.0% of total costs. A significant contributor to the increase in costs was from pupil and plant services. TableA‐2:StatementofActivities
VarianceIncrease
2019 2018 (Decrease)Revenues
Program Revenues:Charges for services 1,315,062$ 1,277,505$ 37,557$ Operating grants and contributions 31,421,517 27,846,326 3,575,191
General Revenues:Property taxes 59,013,031 56,814,892 2,198,139 Federal and state aid not restricted 66,082,373 61,133,609 4,948,764 Other general revenues 4,710,388 4,082,846 627,542 TotalRevenues 162,542,371 151,155,178 11,387,193
ExpensesInstruction-related 120,123,090 121,206,850 (1,083,760) Pupil services 16,353,528 14,061,537 2,291,991 Administration 8,472,929 7,274,362 1,198,567 Plant services 14,043,963 12,004,830 2,039,133 All other activities 8,993,106 8,121,166 871,940
TotalExpenses 167,986,616 162,668,745 5,317,871 Increase (decrease) in net position (5,444,245)$ (11,513,567)$ 6,069,322$
Totalnetpostion (66,866,923)$ (59,593,647)$
GovernmentalActivities
FINANCIALANALYSISOFTHEDISTRICT’SFUNDS The Governmental Funds financial statements report the financial activities of the District net of the effect of long-term items such as capital assets, long-term debt, and other multi-year commitments. Rather, the Governmental Funds statements generally present only financial transactions related to current assets and liabilities. These statements focus on cash received and spent in one year, and what assets are available at year end that can be spent on expenses and liabilities that will be paid within one fiscal year. At June 30, 2019, the District reported a combined fund balance of $48.6 million for all of its governmental funds, which represents an increase of $1.9 million from last year’s ending fund balance of $46.8 million.

13
FULLERTONSCHOOLDISTRICTManagement’sDiscussionandAnalysis(Unaudited)FortheFiscalYearEndedJune30,2019 FINANCIALANALYSISOFTHEDISTRICT’SFUNDS(continued) TableA‐3:TheDistrict'sFundBalances
Other SourcesJuly 1, 2018 Revenues Expenditures and (Uses) June 30, 2019
FundGeneral Fund 35,218,653$ 155,188,362$ 152,411,964$ -$ 37,995,051$ Child Development Fund 785,437 4,623,354 4,414,747 - 994,044 Cafeteria Special Revenue Fund 2,153,826 6,157,514 6,374,618 - 1,936,722 Deferred Maintenance Fund 55,542 1,209 30 - 56,721 Building Fund 8,409 322 - - 8,731 Capital Facilities Fund 2,329,626 891,144 1,921,165 - 1,299,605 Special Reserve Fund (Capital Outlay) 2,751,989 903,429 1,123,177 - 2,532,241 Bond Interest and Redemption Fund 3,464,082 4,047,500 3,717,232 8,873 3,803,223
Total Governmental Fund Balances 46,767,564$ 171,812,834$ 169,962,933$ 8,873$ 48,626,338$ Proprietary Fund:
Self-Insurance Fund 1,722,944$ 2,188,369$ 2,082,282$ -$ 1,829,031$
Fund Balances
GeneralFundBudgetaryHighlightsThe District’s primary operating fund, and the fund where the majority of its financial transactions take place, is the General Fund. The overall financial health of the District is generally determined by the state of its General Fund. This fund reflects the effects on the District’s finances caused by increased funding or cuts imposed by the State on public education funding. It is also the fund where the District Board and administration have the most flexibility to adjust expenditures to match changes in State and Federal funding. The 2018-19 adopted budget was officially approved by the Board of Trustees on June 19, 2018. Over the course of the year, the District revised the annual operating budget several times. The major budget amendments fall into these categories:
Revenues – increased by $13.4 million primarily to reflect increases in federal, state, and local revenue estimates. Other Federal and State revenue adjustments reflect differences between estimated and actual carryovers for June 30, 2018 (more revenue was carried over than expected so budgets increased for 2018-19). Increases in other local revenues reflect donations received during the year. The District does not budget revenues and expenditures related to donations until the actual donation is received.
Expenditures – budget increased $15.6 million, primarily to reflect employee compensation increases negotiated in the winter of 2018, as well as the adjustment to the budget to reflect the expenditure of carryover amounts.
While the District's final budget for the General Fund anticipated that expenditures would exceed revenues by about $5.1 million, the actual results for the year show that revenues exceeded expenditures by roughly $2.8 million. Actual revenues were $2.3 million more than anticipated, and expenditures were $5.6 million less than budgeted. That amount consists primarily of restricted categorical program dollars that were not spent as of June 30, 2019, that will be carried over into the 2019-20 budget.

14
FULLERTONSCHOOLDISTRICTManagement’sDiscussionandAnalysis(Unaudited)FortheFiscalYearEndedJune30,2019 CAPITALASSETANDDEBTADMINISTRATION CapitalAssets By the end of 2018-19, the District had invested $5.0 million in new capital assets, related to site improvements. (More detailed information about capital assets can be found in Note 6 to the financial statements). Total depreciation expense for the year exceeded $2.9 million. TableA‐4:CapitalAssetsatYearEnd,NetofDepreciation
VarianceIncrease
2019 2018 (Decrease)Land 9,198,655$ 9,198,655$ -$ Improvement of sites 4,214,018 4,108,185 105,833 Buildings 65,826,707 69,666,359 (3,839,652) Equipment 2,947,916 2,185,988 761,928 Construction in progress 1,710,489 163,923 1,546,566 Total 83,897,785$ 85,323,110$ (1,425,325)$
GovernmentalActivities
Long‐TermDebtAt year-end the District had $80.4 million in general obligation bonds, certificates of participation, RDA loans, capital leases, early retirement, and employment benefits – an increase of 2.2% from last year – as shown in Table A-5. (More detailed information about the District's long-term liabilities is presented in Note 7 to the financial statements). TableA‐5:OutstandingLong‐TermDebtatYear‐End
VarianceIncrease
2019 2018 (Decrease)General obligation bonds 31,642,315$ 34,409,303$ (2,766,988)$ Certificates of participation 4,445,000 4,810,000 (365,000) RDA loans 188,761 220,221 (31,460) Capital leases 39,943 54,029 (14,086) Early retirement incentives 1,419,534 1,774,418 (354,884) Compensated absences 2,237,770 1,582,627 655,143 Claims 2,810,053 2,507,001 303,052 Other postemployment benefits 37,590,594 33,307,786 4,282,808 Total 80,373,970$ 78,665,385$ 1,708,585$
GovernmentalActivities

15
FULLERTONSCHOOLDISTRICTManagement’sDiscussionandAnalysis(Unaudited)FortheFiscalYearEndedJune30,2019 FACTORSBEARINGONTHEDISTRICT’SFUTURE The Legislature passed the final budget package on June 13, 2019. The Governor signed the 2019‐20BudgetActand 15 other budget-related bills on June 27, 2019. MajorFeaturesofthe2019‐20SpendingPlan Makes$5.9 BillioninAdditionalUnfundedLiabilityPaymentsTeachers, administrators, and other certificated employees of school districts earn pension benefits from the California State Teachers’ Retirement System (CalSTRS). Other school district employees, such as clerical staff, also earn pension benefits administered by California Public Employees’ Retirement System (CalPERS). The state and school districts each have full responsibility for their respective CalPERS’ unfunded liabilities associated with their own employees. In the case of CalSTRS, the state and school districts share responsibility for the system’s total unfunded liability (about one-third is the responsibility of the state and two-thirds of the districts). The spending plan allocates $5.9 billion General Fund to pay down unfunded pension liabilities on behalf of both the state and school districts (some of which is counted toward the state’s Proposition 2 debt payment requirements). In particular, the spending plan dedicates:
$3.6 BilliontoAddressState’sUnfundedLiabilities. The spending plan uses $2.5 billion in General Fund monies to pay down the state’s CalPERS unfunded liability. The spending plan also devotes $1.1 billion General Fund to reduce the state’s share of the CalSTRS unfunded liability, as part of the state’s Proposition 2 debt payment requirements.
$2.3 BilliontoAddressSchoolDistricts’UnfundedLiabilities.The spending plan also devotes $1.6 billion General Fund to reduce the school districts’ share of the CalSTRS unfunded liability and $660 million General Fund to address the school districts’ CalPERS unfunded liability.
K‐14EducationProvidesaFewNotableOngoingProposition 98AugmentationsUnder the spending plan, Proposition 98 funding for 2019-20 increases $2.9 billion (3.7 percent) from the revised 2018-19 level. The spending plan devotes the largest share of this increase—$2 billion—to school districts to cover changes in student attendance and provide a 3.26 percent cost-of-living adjustment (COLA) for the Local Control Funding Formula (general purpose per-student funding). The budget also provides two augmentations related to special education: (1) $493 million for school districts based on the number of three- and four-year old children identified with disabilities affecting their education and (2) $153 million for special education agencies with average or below average per-pupil funding rates. PaysaPortionofDistricts’PensionCostsfortheNextTwoYearsThe spending plan also provides additional monies to school districts outside of the Proposition 98 funding requirement by paying a portion of districts’ pension costs for the next two years. School districts’ pension contribution rates for both CalPERS and CalSTRS have been rising and are set to continue increasing for at least the next few years. For CalSTRS, the budget provides $606 million for the state to pay a portion of districts’ costs (reducing district contribution rates by about 1 percent of payroll in 2019-20 and 2020-21). Similarly, the budget provides $244 million for the state to cover a portion of districts’ CalPERS costs (reducing district rates by about 1 percent of payroll in 2019-20 and 2020-21). Although district pension rates will continue to rise, the increases will be slower than previously projected.

16
FULLERTONSCHOOLDISTRICTManagement’sDiscussionandAnalysis(Unaudited)FortheFiscalYearEndedJune30,2019 FACTORSBEARINGONTHEDISTRICT’SFUTURE(continued) All of these factors were considered in preparing the Fullerton School District budget for the 2019-20 fiscal year. CONTACTINGTHEDISTRICT’SFINANCIALMANAGEMENT This financial report is designed to provide our citizens, taxpayers, customers, investors and creditors with a general overview of the District’s finances and to demonstrate the District’s accountability for the money it receives. If you have any questions about this report or need additional financial information, contact Robert R. Coghlan, Ph.D., Assistant Superintendent, Business Services at (714) 447-7412.

Thenotestofinancialstatementsareanintegralpartofthisstatement. 17
FULLERTONSCHOOLDISTRICTStatementofNetPositionJune30,2019
TotalGovernmental
ActivitiesASSETS
Cash 50,309,347$ Accounts receivable 7,873,818 Inventories 119,840 Prepaid expenses 140,234 Non-depreciable assets 10,909,144 Depreciable assets 179,106,061 Less accumulated depreciation (106,117,420)
Total assets 142,341,024
DEFERREDOUTFLOWSOFRESOURCESDeferred amounts on refunding 817,627 Deferred outflows from OPEB 3,037,269 Deferred outflows from pensions 39,108,374
Total deferred outflows of resources 42,963,270
LIABILITIESAccounts payable 5,011,698 Unearned revenue 432,985 Long-term liabilities other than pensions:
Portion due or payable within one year 4,483,762 Portion due or payable after one year 75,890,208
Net pension liability 151,841,524
Total liabilities 237,660,177
DEFERREDINFLOWSOFRESOURCESDeferred inflows from pensions 10,915,978 Deferred inflows from OPEB 1,766,031
Total deferred inflows of resources 12,682,009
NETPOSITIONNet investment in capital assets 54,311,093 Restricted for:
Capital projects 3,831,846 Debt service 3,803,223 Educational programs 8,058,076 Self-insurance 1,829,031
Unrestricted (136,871,161)
Total net position (65,037,892)$

Thenotestofinancialstatementsareanintegralpartofthisstatement. 18
FULLERTONSCHOOLDISTRICTStatementofActivitiesFortheFiscalYearEndedJune30,2019
Net(Expense)Operating Revenueand
Chargesfor Grantsand ChangesinExpenses Services Contributions NetPosition
GovernmentalActivities
Instructional Services:Instruction 98,368,435$ 554$ 19,113,357$ (79,254,524)$ Instruction-Related Services:
Supervision of instruction 4,391,875 6 1,577,615 (2,814,254) Instructional library, media and technology 6,065,693 4 170,036 (5,895,653) School site administration 11,297,087 32 721,192 (10,575,863)
Pupil Support Services:Home-to-school transportation 2,748,850 - - (2,748,850) Food services 6,302,484 1,247,467 4,108,686 (946,331) All other pupil services 7,302,194 43 2,617,342 (4,684,809)
General Administration Services:Other general administration 8,472,929 54,108 880,846 (7,537,975)
Plant services 14,043,963 11,692 365,266 (13,667,005) Interest on long-term debt 1,335,859 - - (1,335,859) Transfers between agencies 1,201,861 1,156 1,867,177 666,472 Depreciation (unallocated) 6,455,386 - - (6,455,386)
Total Governmental Activities 167,986,616$ 1,315,062$ 31,421,517$ (135,250,037)$
GeneralRevenues:
Property taxes 59,013,031 Federal and state aid not restricted to specific purpose 66,082,373 Interest and investment earnings 730,978 Miscellaneous 3,979,410
Total general revenues 129,805,792
Change in net position (5,444,245)
Net position - July 1, 2018 (59,593,647)
Net position - June 30, 2019 (65,037,892)$
Functions/Programs
ProgramRevenues

Thenotestofinancialstatementsareanintegralpartofthisstatement. 19
FULLERTONSCHOOLDISTRICTBalanceSheet–GovernmentalFundsJune30,2019
GeneralFund
CafeteriaSpecial
RevenueFund
Non‐MajorGovernmental
Funds
TotalGovernmental
FundsASSETS
Cash 34,935,777$ 1,738,292$ 9,007,515$ 45,681,584$ Accounts receivable 6,514,899 971,267 379,098 7,865,264 Due from other funds 785,350 - 65,449 850,799 Inventories 27,556 92,284 - 119,840 Prepaid expenditures 139,836 398 - 140,234
Total Assets 42,403,418$ 2,802,241$ 9,452,062$ 54,657,721$
LIABILITIESANDFUNDBALANCESLiabilities
Accounts payable 4,176,388$ 41,502$ 477,151$ 4,695,041$ Due to other funds 125,242 643,032 135,083 903,357 Unearned revenue 50,016 180,985 201,984 432,985
Total Liabilities 4,351,646 865,519 814,218 6,031,383
FundBalancesNonspendable 217,392 92,911 - 310,303 Restricted 5,127,310 1,843,811 8,637,844 15,608,965 Assigned 5,311,590 - - 5,311,590 Unassigned 27,395,480 - - 27,395,480
Total Fund Balances 38,051,772 1,936,722 8,637,844 48,626,338
Total Liabilities and Fund Balances 42,403,418$ 2,802,241$ 9,452,062$ 54,657,721$

Thenotestofinancialstatementsareanintegralpartofthisstatement. 20
FULLERTONSCHOOLDISTRICTReconciliationoftheGovernmentalFundsBalanceSheettotheStatementofNetPositionJune30,2019
Totalfundbalances‐governmentalfunds 48,626,338$
Capital assets at historical cost: 190,015,205 Accumulated depreciation: (106,117,420) Net: 83,897,785
817,627
(266,866)
General obligation bonds payable 31,642,315 Certificates of participation payable 4,445,000 Fullerton RDA loan payable 188,761 Capital leases payable 39,943 Early retirement incentive 1,419,534 Compensated absences 2,237,770 Other postemployment benefits payable 37,590,594 Total (77,563,917)
The net pension liability is not due and payable in the current reporting period, and therefore is not reported as a liability in the fund financial statements. (151,841,524)
Deferred outflows of resources relating to OPEB 3,037,269 Deferred inflows of resources relating to OPEB (1,766,031) Net: 1,271,238
Deferred outflows of resources relating to pensions 39,108,374 Deferred inflows of resources relating to pensions (10,915,978) Net: 28,192,396
1,829,031
Totalnetposition‐governmentalactivities (65,037,892)$
Internal service funds are used to conduct certain activities for which costs are charged to other funds on a full cost-recovery basis. Because internal service funds are presumed to operate for the benefit of governmental activities, assets and liabilities of internal service funds are reported with governmental activities in the statement of net position. Net position for the internal service fund is:
Amounts reported for assets and liabilities for governmental activities in the statement of net position are different from amounts reported in governmental funds because:
In governmental funds, only current assets are reported. In the statement of net position, all assets are reported, including capital assets and accumulated depreciation.
Deferred amounts on refunding represent amounts paid to an escrow agent in excess of the outstanding debt at the time of the payment for refunded bonds which have been defeased. In the government-wide statements it is recognized as a deferred outflow of resources. The remaining deferred amounts on refunding at the end of the period were:
In governmental funds, interest on long-term debt is not recognized until the period in which it matures and is paid. In the government-wide statement of activities, it is recognized in the period that it is incurred. The additional liability for unmatured interest owing at the end of the period was:
In governmental funds, only current liabilities are reported. In the statement of net position, all liabilities, including long-term liabilities, are reported. Long-term liabilities relating to government-wide statements, consist of:
In governmental funds, deferred outflows and inflows of resources relating to pensions are not reported because they are applicable to future periods. In the statement of net position, deferred outflows and inflows of resources relating to pensions are reported.
In governmental funds, deferred outflows and inflows of resources relating to OPEB are not reported because they are applicable to future periods. In the statement of net position, deferred outflows and inflows of resources relating to OPEB are reported.

Thenotestofinancialstatementsareanintegralpartofthisstatement. 21
FULLERTONSCHOOLDISTRICTStatementofRevenues,Expenditures,andChangesinFundBalances–GovernmentalFundsFortheFiscalYearEndedJune30,2019
GeneralFund
CafeteriaSpecial
RevenueFund
Non‐MajorGovernmental
Funds
TotalGovernmental
FundsREVENUES
LCFF sources 115,164,777$ -$ -$ 115,164,777$ Federal sources 7,416,511 4,453,944 - 11,870,455 Other state sources 20,609,289 351,660 2,363,585 23,324,534 Other local sources 11,998,994 1,351,910 8,102,164 21,453,068
Total Revenues 155,189,571 6,157,514 10,465,749 171,812,834
EXPENDITURESCurrent:
Instruction 98,868,539 - 3,470,351 102,338,890 Instruction-related services:
Supervision of instruction 4,357,820 - 58,895 4,416,715 Instructional library, media and technology 5,599,781 - - 5,599,781 School site administration 10,609,251 - 545,020 11,154,271
Pupil support services:Home-to-school transportation 2,702,180 - - 2,702,180 Food services - 6,080,120 - 6,080,120 All other pupil services 6,957,818 - 160,361 7,118,179
Ancillary Services 29,425 - - 29,425 General administration services:
Other general administration 7,795,776 - - 7,795,776 Plant services 11,366,793 52,329 9,540 11,428,662 Transfers of indirect costs (421,550) 242,169 179,381 -
Capital outlay 2,820,069 - 3,004,081 5,824,150 Intergovernmental 1,201,861 - - 1,201,861 Debt service:
Principal 379,086 - 3,026,460 3,405,546 Interest 145,145 - 722,232 867,377
Total Expenditures 152,411,994 6,374,618 11,176,321 169,962,933
Excess (Deficiency) of RevenuesOver (Under) Expenditures 2,777,577 (217,104) (710,572) 1,849,901
OTHERFINANCINGSOURCES(USES)All other sources - - 8,873 8,873
Total Other Financing Sources and Uses - - 8,873 8,873
Net Change in Fund Balances 2,777,577 (217,104) (701,699) 1,858,774
35,274,195 2,153,826 9,339,543 46,767,564
Fund Balances, June 30, 2019 38,051,772$ 1,936,722$ 8,637,844$ 48,626,338$
Fund Balances, July 1, 2018

Thenotestofinancialstatementsareanintegralpartofthisstatement. 22
FULLERTONSCHOOLDISTRICTReconciliationoftheGovernmentalFundsStatementofRevenues,Expenditures, andChangesinFundBalancestotheStatementofActivitiesFortheFiscalYearEndedJune30,2019 Totalnetchangeinfundbalances‐governmentalfunds 1,858,774$
Amounts reported for governmental activities in the statement of activities are different because:
Expenditures for capital outlay 5,030,061 Depreciation expense (6,455,386)
Net expense adjustment: (1,425,325)
3,405,546
(287,883)
372,294
(600,306)
44,495
(6,349,145)
(1,965,471)
(603,311)
106,087
Changeinnetposition‐governmentalactivities (5,444,245)$
In governmental funds, pension costs are recognized when employer contributions are made. In the statement of activities pension costs are recognized on the accrual basis. This year, the difference between accrual-basis pension costs and actual employer contributions was:
The internal service fund is used by management to charge the cost of self-insurance activities. The net revenue (expense) of the internal service fund is reported with governmental activities.
In the statement of activities, certain operating expenses - compensated absences, early retirement incentives and claims payable for example are measured by the amounts earned during the year. In the governmental funds, however, expenditures for these items are measured by the amount of financial resources used (essentially, the amounts actually paid). This year, amounts paid exceeded amounts earned by:
In governmental funds, interest on long-term debt is recognized in the period that it becomes due. In the government-wide statement of activities, it is recognized in the period that it is incurred. Unmatured interest owing at the end of the period, less matured interest paid during the period but owing from the prior period, was:
In governmental funds, OPEB costs are recognized when employer contributions are made. In the statement of activities OPEB costs are recognized on the accrual basis. This year, the difference between accrual-basis OPEB costs and actual employer contributions was:
In governmental funds, accreted interest on capital appreciation bonds is not recorded as an expenditure from current resources. In the government-wide statement of activities, however, this is recorded as interest expense for the period:
In governmental funds, if debt is issued at a premium or at a discount, the premium or discount is recognized as an other financing source or an other financing use in the period it is incurred. In the government-wide statements, the premium or discount is amortized as interest over the life of the debt. Amortization of premium or discount for the period is:
In governmental funds, the costs of capital assets are reported as expenditures in the period when the assets are acquired. In the statement of activities, costs of capital assets are allocated over their estimated useful lives as depreciation expense. The difference between capital outlay expenditures and depreciation expense for the period is:
In governmental funds, repayments of long-term debt are reported as expenditures. In the government-wide statements, repayments of long-term debt are reported as a reduction of liabilities. Expenditures for repayment of the principal portion of long-term debt were:
The amounts paid to the refunded bond escrow agent in excess of the refunded bond at the time of payment are recorded as deferred amounts on refunding and are amortized to interest expense over the life of the liability. Deferred amounts incurred, less amortization of this amount during the year was:

Thenotestofinancialstatementsareanintegralpartofthisstatement. 23
FULLERTONSCHOOLDISTRICTStatementofNetPosition–ProprietaryFundsJune30,2019
GovernmentalActivities
InternalServiceFund
ASSETSCurrent:
Cash 4,627,763$ Accounts receivable 8,554 Due from other funds 59,793
Total assets 4,696,110
LIABILITIESAccounts payable and accrued liabilities 49,791 Due to other funds 7,235 Estimated liability for open claims and IBNR 2,810,053
Total liabilities 2,867,079
NETPOSITIONRestricted 1,829,031$

Thenotestofinancialstatementsareanintegralpartofthisstatement. 24
FULLERTONSCHOOLDISTRICTStatementofRevenues,Expenses,andChangesinFundNetPosition–ProprietaryFundsFortheFiscalYearEndedJune30,2019
GovernmentalActivities
InternalServiceFund
OPERATINGREVENUESCharges to other funds 2,087,657$ Other state revenue 10,647
Total operating revenues 2,098,304
OPERATINGEXPENSESCurrent:
Classified salaries 168,195 Employee benefits 94,282 Books and supplies 83,269 Services and other operating expenditures 1,736,538
Total operating expenses 2,082,284
Operating Income (Loss) 16,020
NON‐OPERATINGREVENUESInterest income 90,067
Change in net position 106,087
Net position, July 1, 2018 1,722,944
Net position, June 30, 2019 1,829,031$

Thenotestofinancialstatementsareanintegralpartofthisstatement. 25
FULLERTONSCHOOLDISTRICTStatementofCashFlows‐ProprietaryFundsFortheFiscalYearEndedJune30,2019
GovernmentalActivities
InternalServiceFund
CASHFLOWSFROMOPERATINGACTIVITIESReceived from in-district premiums 2,059,019$ Payments to employees and fringe benefits (258,382) Payments to vendors and suppliers (86,166) Payments on insurance claims (1,433,486) Other receipts (payments) 11,257
Net cash provided (used) by operating activities 292,242
CASHFLOWSFROMINVESTINGACTIVITIESInvestment income 93,349
Net increase (decrease) in cash 385,591 Cash, July 1, 2018 4,242,172 Cash, June 30, 2019 4,627,763$
Reconciliationofoperatingincome(loss)tonetcashprovided(used)byoperatingactivities:Operating income (loss) 16,020$ Adjustments to reconcile operating income (loss) to net cash provided (used) by operating activities:
Changes in assets, liabilities, and deferred outflows of resources:Due from other funds (28,638) Estimated liability for open claims and IBNRs 303,052 Accounts payable and accrued liabilities 1,198 Due to other funds 610
Net cash (used) by operating activities 292,242$

Thenotestofinancialstatementsareanintegralpartofthisstatement. 26
FULLERTONSCHOOLDISTRICTStatementofFiduciaryNetPositionJune30,2019
Associated DebtServiceStudent FundforSpecial
BodyFunds TaxBonds TotalASSETS
Cash 177,049$ 19,553$ 196,602$ Investments - 2,536,103 2,536,103Accounts receivable - 48 48
TotalAssets 177,049$ 2,555,704$ 2,732,753$
LIABILITIESAccounts payable -$ 103,739$ 103,739$ Unearned revenue - 1,975,253 1,975,253 Due to student groups 177,049 - 177,049 Due to bondholders - 476,712 476,712
TotalLiabilities 177,049$ 2,555,704$ 2,732,753$
AgencyFunds

27
FULLERTONSCHOOLDISTRICTNotestoFinancialStatementsJune30,2019 NOTE1–SUMMARYOFSIGNIFICANTACCOUNTINGPOLICIES Fullerton School District (the "District") accounts for its financial transactions in accordance with the policies and procedures of the California Department of Education’s California School Accounting Manual. The accounting policies of the District conform to accounting principles generally accepted in the United States of America as prescribed by the Governmental Accounting Standards Board. The following is a summary of the more significant policies: A. ReportingEntity
A reporting entity is comprised of the primary government, component units, and other organizations that are included to ensure the financial statements are not misleading. The primary government of the District consists of all funds, departments, and agencies that are not legally separate from the District. For Fullerton School District, this includes general operations, food service, and student related activities of the District. Component units are legally separate organizations for which the District is financially accountable. Component units may also include organizations that are fiscally dependent on the District, in that the District approves their budget, the issuance of their debt or the levying of their taxes. In addition, component units are other legally separate organizations for which the District is not financially accountable but the nature and significance of the organization’s relationship with the District is such that exclusion would cause the District’s financial statements to be misleading or incomplete. For financial reporting purposes, the component units have a financial and operational relationship which meets the reporting entity definition criteria of the Governmental Accounting Standards Board (GASB) Statement No. 61, TheFinancialReportingEntity:Omnibus–AnAmendmentofGASBStatementsNo. 14 and No. 34, and thus are included in the financial statements using the blended presentation method as if they were part of the District’s operations because the Board of Trustees of the component units is essentially the same as the Board of Trustees of the District and because their purpose is to finance the construction of facilities to be used for the direct benefit of the District. The Fullerton School District Capital Facilities Corporation (the Corporation) financial activity are presented in the financial statements as the Capital Projects for Blended Component Units Fund and the Debt Service for Blended Component Units Fund. Certificates of participation and other debt issued by the Corporation are included as long-term liabilities in the government-wide financial statements. Individually prepared financial statements are not prepared for the Corporation. The Fullerton School District Community Facilities Districts (CFDs) financial activity is presented in the financial statements as the Capital Projects Fund for Blended Component Units and in the Fiduciary Funds Statement as the Debt Service Fund for Special Tax Bonds. Special Tax Bonds issued by the CFDs are not included in the long-term obligations of the StatementofNetPosition as they are not obligations of the District. Individually prepared financial statements are not prepared for each of the CFDs.

28
FULLERTONSCHOOLDISTRICTNotestoFinancialStatementsJune30,2019 NOTE1–SUMMARYOFSIGNIFICANTACCOUNTINGPOLICIES(continued) B. BasisofPresentation,BasisofAccounting
1. BasisofPresentation
Government‐WideFinancialStatementsThe statement of net position and the statement of activities display information about the primary government (the District). These statements include the financial activities of the overall government, except for fiduciary activities. Eliminations have been made to minimize the double-counting of internal activities. Governmental activities generally are financed through taxes, intergovernmental revenues, and other nonexchange transactions. The statement of activities presents a comparison between direct expenses and program revenues for each function of the District’s governmental activities. Direct expenses are those that are specifically associated with a program or function and, therefore, are clearly identifiable to a particular function. Program revenues include (a) fees, fines, and charges paid by the recipients of goods or services offered by the programs and (b) grants and contributions that are restricted to meeting the operational or capital requirements of a particular program. Revenues that are not classified as program revenues, including all taxes, are presented as general revenues. FundFinancialStatementsThe fund financial statements provide information about the District’s funds, including its fiduciary funds. Separate statements for each fund category - governmental, proprietary, and fiduciary - are presented. The emphasis of fund financial statements is on major governmental funds, each displayed in a separate column. All remaining governmental funds are aggregated and reported as nonmajor funds. Proprietary fund operating revenues, such as charges for services, result from exchange transactions associated with the principal activity of the fund. Exchange transactions are those in which each party receives and gives up essentially equal values. Nonoperating revenues, such as subsidies and investment earnings, result from nonexchange transactions or ancillary activities. MajorGovernmentalFundsThe District maintains the following major governmental funds:
GeneralFund: This is the chief operating fund for the District. It is used to account for the ordinary operations of the District. All transactions except those accounted for in another fund are accounted for in this fund. The District also maintained a Deferred Maintenance Fund. The Deferred Maintenance Fund does not meet the definition of special revenue funds as it is not primarily composed of restricted or committed revenue sources. Because this fund does not meet the definition of special revenue funds under GASB 54, the activity in that fund is being reported within the General Fund. CafeteriaSpecialRevenueFund: This fund is used to account separately for federal, state, and local resources to operate the food service program (EducationCode sections 38090 and 38093).

29
FULLERTONSCHOOLDISTRICTNotestoFinancialStatementsJune30,2019 NOTE1–SUMMARYOFSIGNIFICANTACCOUNTINGPOLICIES(continued)
B. BasisofPresentation,BasisofAccounting(continued)
1. BasisofPresentation(continued)
Non‐MajorGovernmentalFundsThe District maintains the following non-major governmental funds:
SpecialRevenue Funds: Special revenue funds are established to account for the proceeds from specific revenue sources (other than trusts, major capital projects, or debt service) that are restricted or committed to the financing of particular activities, that compose a substantial portion of the inflows of the fund, and that are reasonably expected to continue. Additional resources that are restricted, committed, or assigned to the purpose of the fund may also be reported in the fund.
ChildDevelopmentFund: This fund is used to account separately for federal, state, and local revenues to operate child development programs.
CapitalProjectsFunds: Capital projects funds are established to account for financial resources to be used for the acquisition or construction of major capital facilities and other capital assets (other than those financed by proprietary funds and trust funds).
BuildingFund: This fund exists primarily to account separately for proceeds from the sale of bonds (EducationCode Section 15146) and may not be used for any purposes other than those for which the bonds were issued. Capital Facilities Fund: This fund is used to primarily account separately for moneys received from fees levied on development projects as a condition of approval (EducationCode sections 17620-17626 and GovernmentCode Section 65995 et seq.). SpecialReserveFund forCapitalOutlayProjects: This fund exists primarily to provide for the accumulation of general fund moneys for capital outlay purposes (EducationCode Section 42840). This fund may also be used to account for any other revenues specifically for capital projects that are not restricted to fund 21, 25, 30, 35, or 49.
Debt Service Funds: Debt service funds are established to account for the accumulation of resources for and the payment of principal and interest on general long-term debt.
BondInterestandRedemptionFund: This fund is used for the repayment of bonds issued for the District (EducationCode sections 15125-15262).

30
FULLERTONSCHOOLDISTRICTNotestoFinancialStatementsJune30,2019 NOTE1–SUMMARYOFSIGNIFICANTACCOUNTINGPOLICIES(continued)
B. BasisofPresentation,BasisofAccounting(continued)
1. BasisofPresentation(continued)
ProprietaryFundsProprietary fund reporting focuses on the determination of operating income, changes in net position, financial position, and cash flows. Proprietary funds are classified as enterprise or internal service. The District has the following proprietary fund:
Self‐Insurance Fund: Self-insurance funds are used to separate moneys received for self-insurance activities from other operating funds in the District. Separate funds may be established for each type of self-insurance activity, such as workers’ compensation, health and welfare, and deductible property loss (EducationCode Section 17566).
FiduciaryFundsFiduciary funds are used to account for assets held in a trustee or agent capacity for others that cannot be used to support the District’s own programs. The key distinction between trust and agency funds is that trust funds are subject to a trust agreement that affects the degree of management involvement and the length of time that the resources are held. The District maintains the following fiduciary funds:
DebtServiceFundforSpecialTaxBonds: This fund is used to account for the accumulation of resources for, and the repayment, of Community Facility District bonds, interest and related costs. AgencyFunds:The District maintains a separate agency fund for each school that operates an Associated Student Body (ASB) Fund, whether it is organized or not.
2. MeasurementFocus,BasisofAccounting
The accounting and financial reporting treatment is determined by the applicable measurement focus and basis of accounting. Measurement focus indicates the type of resources being measured such as current financial resource or economic resources. The basis of accounting indicates the timing of transactions or events for recognition in the financial statements. The government-wide financial statements are reported using the economic resources measurement focus and the accrual basis of accounting, as are the proprietary fund financial statements. Revenues are recorded when earned and expenses are recorded when a liability is incurred, regardless of the timing of the related cash flows. Property taxes are recognized as revenues in the year for which they are levied. Grants and similar items are recognized as revenues as soon as all eligibility requirements imposed by the provider have been met.

31
FULLERTONSCHOOLDISTRICTNotestoFinancialStatementsJune30,2019 NOTE1–SUMMARYOFSIGNIFICANTACCOUNTINGPOLICIES(continued)
B. BasisofPresentation,BasisofAccounting(continued)
2. MeasurementFocus,BasisofAccounting(continued)
Governmental fund financial statements are reported using the current financial resources measurement focus and the modified accrual basis of accounting. Under this method, revenues are recognized as soon as they are both measurable and available. Revenues are considered to be available when they are collectible within the current period or soon enough thereafter to pay liabilities for the current period. For this purpose, the District considers revenues to be available if they are collected within 60 days of the end of the current fiscal period. Expenditures generally are recorded when a liability is incurred, as under accrual accounting. However, debt service expenditures, as well as expenditures related to compensated absences and claims and judgments, are recorded only when payment is due. As a general rule the effect of interfund activity has been eliminated from the government-wide financial statements. Exceptions to this general rule are payments-in-lieu of taxes and other charges between the District’s proprietary funds and various other functions of the District. Elimination of these charges would distort the direct costs and program revenues reported for the various functions concerned. The agency fund has no measurement focus and utilizes the accrual bases of accounting for reporting its assets and liabilities.
3. Revenues‐ExchangeandNon‐ExchangeTransactionsRevenue resulting from exchange transactions, in which each party gives and receives essentially equal value, is recorded on the accrual basis when the exchange takes place. On a modified accrual basis, revenue is recorded in the fiscal year in which the resources are measurable and become available. Available means that the resources will be collected within the current fiscal year. Generally, available is defined as collectible within 60 days. However, to achieve comparability of reporting among California districts and so as not to distort normal revenue patterns, with specific respect to reimbursement grants and corrections to state-aid apportionments, the California Department of Education has defined available for districts as collectible within one year. The following revenue sources are considered to be both measurable and available at fiscal year-end: State apportionments, interest, certain grants, and other local sources. Non-exchange transactions, in which the District receives value without directly giving equal value in return, include property taxes, certain grants, entitlements, and donations. Revenue from property taxes is recognized in the fiscal year in which the taxes are received. Revenue from certain grants, entitlements, and donations is recognized in the fiscal year in which all eligibility requirements have been satisfied. Eligibility requirements include time and purpose requirements. On a modified accrual basis, revenue from non-exchange transactions must also be available before it can be recognized.

32
FULLERTONSCHOOLDISTRICTNotestoFinancialStatementsJune30,2019 NOTE1–SUMMARYOFSIGNIFICANTACCOUNTINGPOLICIES(continued)
C. BudgetaryData
The budgetary process is prescribed by provisions of the California Education Code and requires the governing board to hold a public hearing and adopt an operating budget no later than July 1 of each year. The District governing board satisfied these requirements. The adopted budget is subject to amendment throughout the year to give consideration to unanticipated revenue and expenditures primarily resulting from events unknown at the time of budget adoption with the legal restriction that expenditures cannot exceed appropriations by major object account. The amounts reported as the original budgeted amounts in the budgetary statements reflect the amounts when the original appropriations were adopted. The amounts reported as the final budgeted amounts in the budgetary statements reflect the amounts after all budget amendments have been accounted for. For budget purposes, on behalf payments have not been included as revenue and expenditures as required under generally accepted accounting principles.
D. EncumbrancesEncumbrance accounting is used in all budgeted funds to reserve portions of applicable appropriations for which commitments have been made. Encumbrances are recorded for purchase orders, contracts, and other commitments when they are written. Encumbrances are liquidated when the commitments are paid. All encumbrances are liquidated as of June 30.
E. Assets, Deferred Outflows of Resources, Liabilities, Deferred Inflows of Resources, and NetPosition 1. CashandCashEquivalents
The District considers cash and cash equivalents to be cash on hand and demand deposits. In addition, because the Treasury Pool is sufficiently liquid to permit withdrawal of cash at any time without prior notice or penalty, equity in the pool is also deemed to be a cash equivalent.
2. InventoriesandPrepaidItemsInventories are valued at cost using the first-in/first-out (FIFO) method. The costs of governmental fund-type inventories are recorded as expenditures when consumed rather than when purchased. Certain payments to vendors reflect costs applicable to future accounting periods and are recorded as prepaid items.
3. CapitalAssetsPurchased or constructed capital assets are reported at cost or estimated historical cost. Donated capital assets, donated works of art and similar items, and capital assets received in a service concession arrangement are reported at acquisition value rather than fair value. The cost of normal maintenance and repairs that do not add to the value of the asset or materially extend assets’ lives are not capitalized.

33
FULLERTONSCHOOLDISTRICTNotestoFinancialStatementsJune30,2019 NOTE1–SUMMARYOFSIGNIFICANTACCOUNTINGPOLICIES(continued) E. Assets, Deferred Outflows of Resources, Liabilities, Deferred Inflows of Resources, and Net
Position(continued)
3. CapitalAssets(continued)Capital assets are depreciated using the straight-line method over the following estimated useful lives:
Description Estimated Lives
Buildings and Improvements 25-50 years Furniture and Equipment 15-20 years Vehicles 8 years
4. UnearnedRevenue
Unearned revenue arises when potential revenue does not meet both the "measurable" and "available" criteria for recognition in the current period or when resources are received by the District prior to the incurrence of qualifying expenditures. In subsequent periods, when both revenue recognition criteria are met, or when the District has a legal claim to the resources, the liability for unearned revenue is removed from the combined balance sheet and revenue is recognized. Certain grants received that have not met eligibility requirements are recorded as unearned revenue. On the governmental fund financial statements, receivables that will not be collected within the available period are also recorded as unearned revenue.
5. DeferredOutflows/InflowsofResourcesIn addition to assets, the statement of net position will sometimes report a separate section for deferred outflows of resources. This separate financial statement element, deferred outflows ofresources, represents a consumption of net position that applies to a future period and so will not be recognized as an outflow of resources (expense/expenditure) until then. In addition to liabilities, the statement of net position will sometimes report a separate section for deferred inflows of resources. This separate financial statement element, deferred inflows ofresources, represents an acquisition of net position that applies to a future period and will not be recognized as an inflow of resources (revenue) until that time.
6. CompensatedAbsences
The liability for compensated absences reported in the government-wide statements consists of unpaid, accumulated annual vacation leave balances. The liability has been calculated using the vesting method, in which leave amounts for both employees who currently are eligible to receive termination payments and other employees who are expected to become eligible in the future to receive such payments upon termination are included.

34
FULLERTONSCHOOLDISTRICTNotestoFinancialStatementsJune30,2019 NOTE1–SUMMARYOFSIGNIFICANTACCOUNTINGPOLICIES(continued) E. Assets, Deferred Outflows of Resources, Liabilities, Deferred Inflows of Resources, and Net
Position(continued)
7. PostemploymentBenefitsOtherThanPensions(OPEB)For purposes of measuring the net OPEB liability, deferred outflows of resources and deferred inflows of resources related to OPEB, and OPEB expense, information about the fiduciary net position of the District Plan and CalSTRS Medicare Premium Payment (MPP) Program and additions to/deductions from the Plans’ fiduciary net position have been determined on the same basis as they are reported by the Plans. For this purpose, the Plans recognize benefit payments when due and payable in accordance with the benefit terms. Investments are reported at fair value, except for money market investments and participating interest-earning investment contracts that have a maturity at the time of purchase of one year or less, which are reported at cost.
8. PensionsFor purposes of measuring the net pension liability and deferred outflows/inflows of resources related to pensions, and pension expense, information about the fiduciary net position of the District’s California State Teachers Retirement System (CalSTRS) and California Public Employees’ Retirement System (CalPERS) plans and addition to/deductions from the Plans’ fiduciary net position have been determined on the same basis as they are reported by CalSTRS and CalPERS. For this purpose, benefit payments (including refunds of employee contributions) are recognized when due and payable in accordance with the benefit terms. Investments are reported at fair value.
9. FundBalancesThe fund balance for governmental funds is reported in classifications based on the extent to which the government is bound to honor constraints on the specific purposes for which amounts in those funds can be spent. Nonspendable: Fund balance is reported as nonspendable when the resources cannot be spent because they are either in a nonspendable form or legally or contractually required to be maintained intact. Resources in nonspendable form include inventories and prepaid assets. Restricted: Fund balance is reported as restricted when the constraints placed on the use of resources are either externally imposed by creditors, grantors, contributors, or laws or regulations of other governments; or imposed by law through constitutional provision or by enabling legislation. Committed: The District’s highest decision-making level of authority rests with the District’s Board. Fund balance is reported as committed when the Board passes a resolution that places specified constraints on how resources may be used. The Board can modify or rescind a commitment of resources through passage of a new resolution. Assigned: Resources that are constrained by the District’s intent to use them for a specific purpose, but are neither restricted nor committed, are reported as assigned fund balance. Intent may be expressed by either the Board, committees (such as budget or finance), or officials to which the Board has delegated authority.
35
FULLERTONSCHOOLDISTRICTNotestoFinancialStatementsJune30,2019 NOTE1–SUMMARYOFSIGNIFICANTACCOUNTINGPOLICIES(continued) E. Assets, Deferred Outflows of Resources, Liabilities, Deferred Inflows of Resources, and Net
Position(continued)
9. FundBalances(continued) Unassigned: Unassigned fund balance represents fund balance that has not been restricted, committed, or assigned and may be utilized by the District for any purpose. When expenditures are incurred, and both restricted and unrestricted resources are available, it is the District’s policy to use restricted resources first, then unrestricted resources in the order of committed, assigned, and then unassigned, as they are needed.
10. NetPosition
Net position is classified into three components: net investment in capital assets; restricted; and unrestricted. These classifications are defined as follows: Net investment in capitalassets - This component of net position consists of capital assets,
including restricted capital assets, net of accumulated depreciation and reduced by the outstanding balances of any bonds, mortgages, notes, or other borrowings that are attributable to the acquisition, construction, or improvement of those assets. If there are significant unspent related debt proceeds at year-end, the portion of the debt attributable to the unspent proceeds are not included in the calculation of net investment in capital assets. Rather, that portion of the debt is included in the same net position component as the unspent proceeds.
Restricted - This component of net position consists of constraints placed on net position use through external constraints imposed by creditors (such as through debt covenants), grantors, contributors, or laws or regulations of other governments or constraints imposed by law through constitutional provisions or enabling legislation.
Unrestrictednetposition - This component of net position consists of net position that does not meet the definition of "net investment in capital assets" or "restricted".
When both restricted and unrestricted resources are available for use, it is the District’s policy to use restricted resources first, then unrestricted resources as they are needed.
F. MinimumFundBalancePolicy
During the 2010-11 fiscal year, pursuant to GASB Statement No. 54, the District adopted a minimum fund balance policy for the General Fund in order to protect the District against revenue shortfalls or unpredicted expenditures. The policy requires a Reserve for Economic Uncertainties consisting of unassigned amounts equal to no less than three percent of total General Fund expenditures and other financing uses. When an expenditure is incurred for purposes for which both restricted and unrestricted fund balance is available, the District considers restricted funds to have been spent first. When an expenditure is incurred for which committed, assigned, or unassigned fund balances are available, the District considers amounts to have been spent first out of committed funds, then assigned funds, and finally unassigned funds, as needed unless the governing board has provided otherwise in its commitment or assignment actions.

36
FULLERTONSCHOOLDISTRICTNotestoFinancialStatementsJune30,2019 NOTE1–SUMMARYOFSIGNIFICANTACCOUNTINGPOLICIES(continued) G. PropertyTaxCalendar
The County is responsible for the assessment, collection, and apportionment of property taxes for all jurisdictions including the schools and special districts within the County. The Board of Supervisors levies property taxes as of September 1 on property values assessed on July 1. Secured property tax payments are due in two equal installments. The first is generally due November 1 and is delinquent with penalties on December 10, and the second is generally due on February 1 and is delinquent with penalties on April 10. Secured property taxes become a lien on the property on January 1.
H. UseofEstimates
The preparation of financial statements in conformity with generally accepted accounting principles requires management to make estimates and assumptions that affect the reported amounts of assets and liabilities and disclosure of contingent assets and liabilities at the date of the financial statements and the reported amounts of revenues and expenditures during the reported period. Actual results could differ from those estimates.
I. NewGASBPronouncements
During the 2018-19 fiscal year, the following GASB Pronouncements became effective: 1. In November 2016, the GASB issued Statement No. 83, CertainAssetRetirementObligations. This
Statement addresses accounting and financial reporting for certain asset retirement obligations (AROs). An ARO is a legally enforceable liability associated with the retirement of a tangible capital asset. A government that has legal obligations to perform future asset retirement activities related to its tangible capital assets should recognize a liability based on the guidance in this Statement. This Statement establishes criteria for determining the timing and pattern of recognition of a liability and a corresponding deferred outflow of resources for AROs. This Statement requires that recognition occur when the liability is both incurred and reasonably estimable. The determination of when the liability is incurred should be based on the occurrence of external laws, regulations, contracts, or court judgments, together with the occurrence of an internal event that obligates a government to perform asset retirement activities. Laws and regulations may require governments to take specific actions to retire certain tangible capital assets at the end of the useful lives of those capital assets, such as decommissioning nuclear reactors and dismantling and removing sewage treatment plants. Other obligations to retire tangible capital assets may arise from contracts or court judgments. Internal obligating events include the occurrence of contamination, placing into operation a tangible capital asset that is required to be retired, abandoning a tangible capital asset before it is placed into operation, or acquiring a tangible capital asset that has an existing ARO. The District has implemented the provisions of this Statement as of June 30, 2019.

37
FULLERTONSCHOOLDISTRICTNotestoFinancialStatementsJune30,2019 NOTE1–SUMMARYOFSIGNIFICANTACCOUNTINGPOLICIES(continued) I. NewGASBPronouncements(continued)
2. In April 2018, the GASB issued Statement No. 88, CertainDisclosuresRelatedtoDebt,IncludingDirectBorrowings and Direct Placements. The primary objective of this Statement is to improve the information that is disclosed in notes to government financial statements related to debt, including direct borrowings and direct placements. It also clarifies which liabilities governments should include when disclosing information related to debt. This Statement defines debt for purposes of disclosure in notes to financial statements as a liability that arises from a contractual obligation to pay cash (or other assets that may be used in lieu of cash) in one or more payments to settle an amount that is fixed at the date the contractual obligation is established. This Statement requires that additional essential information related to debt be disclosed in notes to financial statements, including unused lines of credit; assets pledged as collateral for the debt; and terms specified in debt agreements related to significant events of default with finance-related consequences, significant termination events with finance-related consequences, and significant subjective acceleration clauses. For notes to financial statements related to debt, this Statement also requires that existing and additional information be provided for direct borrowings and direct placements of debt separately from other debt. The District has implemented the provisions of this Statement as of June 30, 2019.
J. FutureAccountingPronouncements
Other GASB pronouncements, which will be effective in future periods, are as follows: 1. In January 2017, the GASB issued Statement No. 84, Fiduciary Activities. The objective of this
Statement is to improve guidance regarding the identification of fiduciary activities for accounting and financial reporting purposes and how those activities should be reported. This Statement establishes criteria for identifying fiduciary activities of all state and local governments. The focus of the criteria generally is on (1) whether a government is controlling the assets of the fiduciary activity and (2) the beneficiaries with whom a fiduciary relationship exists. Separate criteria are included to identify fiduciary component units and postemployment benefit arrangements that are fiduciary activities. The requirements of this Statement are effective for reporting periods beginning after December 15, 2018. Early implementation is encouraged.

38
FULLERTONSCHOOLDISTRICTNotestoFinancialStatementsJune30,2019 NOTE1–SUMMARYOFSIGNIFICANTACCOUNTINGPOLICIES(continued) J. FutureAccountingPronouncements(continued)
2. In June 2017, the GASB issued Statement No. 87, Leases. The objective of this Statement is to better
meet the information needs of financial statement users by improving accounting and financial reporting for leases by governments. This Statement increases the usefulness of governments’ financial statements by requiring recognition of certain lease assets and liabilities for leases that previously were classified as operating leases and recognized as inflows of resources or outflows of resources based on the payment provisions of the contract. It establishes a single model for lease accounting based on the foundational principle that leases are financings of the right to use an underlying asset. Under this Statement, a lessee is required to recognize a lease liability and an intangible right-to-use lease asset, and a lessor is required to recognize a lease receivable and a deferred inflow of resources, thereby enhancing the relevance and consistency of information about governments’ leasing activities.
The requirements of this Statement are effective for reporting periods beginning after December 15, 2019. Early implementation is encouraged.
3. In June 2018, the GASB issued Statement No. 89, AccountingforInterestCostIncurredBeforetheEndof a Construction Period. The objectives of this Statement are (1) to enhance the relevance and comparability of information about capital assets and the cost of borrowing for a reporting period and (2) to simplify accounting for interest cost incurred before the end of a construction period. This Statement establishes accounting requirements for interest cost incurred before the end of a construction period. Such interest cost includes all interest that previously was accounted for in accordance with the requirements of paragraphs 5-22 of Statement No. 62, CodificationofAccountingand Financial Reporting Guidance Contained in Pre‐November 30, 1989 FASB and AICPAPronouncements, which are superseded by this Statement. This Statement requires that interest cost incurred before the end of a construction period be recognized as an expense in the period in which the cost is incurred for financial statements prepared using the economic resources measurement focus. As a result, interest cost incurred before the end of a construction period will not be included in the historical cost of a capital asset reported in a business-type activity or enterprise fund. This Statement also reiterates that in financial statements prepared using the current financial resources measurement focus, interest cost incurred before the end of a construction period should be recognized as an expenditure on a basis consistent with governmental fund accounting principles. The requirements of this Statement are effective for reporting periods beginning after December 15, 2019. Earlier application is encouraged. The requirements of this Statement should be applied prospectively.

39
FULLERTONSCHOOLDISTRICTNotestoFinancialStatementsJune30,2019 NOTE1–SUMMARYOFSIGNIFICANTACCOUNTINGPOLICIES(continued) J. FutureAccountingPronouncements(continued)
4. In August 2018, the GASB issued Statement No. 90, MajorityEquityInterests‐AnAmendmentofGASB
Statements No. 14 and No. 61. The primary objectives of this Statement are to improve the consistency and comparability of reporting a government’s majority equity interest in a legally separate organization and to improve the relevance of financial statement information for certain component units. It defines a majority equity interest and specifies that a majority equity interest in a legally separate organization should be reported as an investment if a government’s holding of the equity interest meets the definition of an investment. A majority equity interest that meets the definition of an investment should be measured using the equity method, unless it is held by a special-purpose government engaged only in fiduciary activities, a fiduciary fund, or an endowment (including permanent and term endowments) or permanent fund. Those governments and funds should measure the majority equity interest at fair value. For all other holdings of a majority equity interest in a legally separate organization, a government should report the legally separate organization as a component unit, and the government or fund that holds the equity interest should report an asset related to the majority equity interest using the equity method. This Statement establishes that ownership of a majority equity interest in a legally separate organization results in the government being financially accountable for the legally separate organization and, therefore, the government should report that organization as a component unit. This Statement also requires that a component unit in which a government has a 100 percent equity interest account for its assets, deferred outflows of resources, liabilities, and deferred inflows of resources at acquisition value at the date the government acquired a 100 percent equity interest in the component unit. Transactions presented in flows statements of the component unit in that circumstance should include only transactions that occurred subsequent to the acquisition. The requirements of this Statement are effective for reporting periods beginning after December 15, 2018. Earlier application is encouraged. The requirements should be applied retroactively, except for the provisions related to (1) reporting a majority equity interest in a component unit and (2) reporting a component unit if the government acquires a 100 percent equity interest. Those provisions should be applied on a prospective basis.
5. In May 2019, the GASB issued Statement No. 91, ConduitDebtObligations. The primary objectives of this Statement are to provide a single method of reporting conduit debt obligations by issuers and eliminate diversity in practice associated with (1) commitments extended by issuers, (2) arrangements associated with conduit debt obligations, and (3) related note disclosures. This Statement achieves those objectives by clarifying the existing definition of a conduit debt obligation; establishing that a conduit debt obligation is not a liability of the issuer; establishing standards for accounting and financial reporting of additional commitments and voluntary commitments extended by issuers and arrangements associated with conduit debt obligations; and improving required note disclosures. This Statement also addresses arrangements – often characterized as leases – that are associated with conduit debt obligations. In those arrangements, capital assets are constructed or acquired with the proceeds of a conduit debt obligation and used by third-party obligors in the course of their activities.

40
FULLERTONSCHOOLDISTRICTNotestoFinancialStatementsJune30,2019 NOTE1–SUMMARYOFSIGNIFICANTACCOUNTINGPOLICIES(continued) J. FutureAccountingPronouncements(continued)
5. (continued) Payments from third-party obligors are intended to cover and coincide with debt service payments. During those arrangements, issuers retain the titles to the capital assets. Those titles may or may not pass to the obligors at the end of the arrangements. This Statement requires issuers to disclose general information about their conduit debt obligations, organized by type of commitment, including the aggregate outstanding principal amount of the issuers’ conduit debt obligations and a description of each type of commitment. Issuers that recognize liabilities related to supporting the debt service of conduit debt obligations also should disclose information about the amount recognized and how the liabilities changed during the reporting period. The requirements of this Statement are effective for reporting periods beginning after December 15, 2020. Earlier application is encouraged.
NOTE2–CASHANDINVESTMENTSCash and investments at June 30, 2019, are reported at fair value and consisted of the following:
GovernmentalFunds
ProprietaryFund Total
FiduciaryFunds
Pooled Funds:Cash in county treasury 43,749,692$ 4,502,763$ 48,252,455$ 19,553$ Cash with fiscal agent 143,600 - 143,600 -
Total Pooled Funds 43,893,292 4,502,763 48,396,055 19,553
Deposits:Cash on hand and in banks 1,738,063 - 1,738,063 177,049 Cash in revolving fund 50,229 125,000 175,229 -
Total Deposits 1,788,292 125,000 1,913,292 177,049
Total Cash 45,681,584$ 4,627,763$ 50,309,347$ 196,602$
Rating:Investments:
US Bank - Money Market N/A 2,536,103$
Governmental Activities
PooledFundsIn accordance with Education Code Section 41001, the District maintains substantially all of its cash in the County Treasury. The County pools and invests the cash. These pooled funds are carried at cost which approximates fair value. Interest earned is deposited annually to participating funds. Any investment losses are proportionately shared by all funds in the pool.

41
FULLERTONSCHOOLDISTRICTNotestoFinancialStatementsJune30,2019 NOTE2–CASHANDINVESTMENTS(continued) PooledFunds(continued)Because the District’s deposits are maintained in a recognized pooled investment fund under the care of a third party and the District’s share of the pool does not consist of specific, identifiable investment securities owned by the District, no disclosure of the individual deposits and investments or related custodial credit risk classifications is required. In accordance with applicable state laws, the County Treasurer may invest in derivative securities with the State of California. However, at June 30, 2019, the County Treasurer has represented that the Pooled Investment Fund contained no derivatives or other investments with similar risk profiles. CustodialCreditRisk–DepositsCustodial credit risk is the risk that in the event of a bank failure, the District’s deposits may not be returned to it. The District does not have a policy for custodial credit risk for deposits. Cash balances held in banks are insured up to $250,000 by the Federal Depository Insurance Corporation (FDIC) and are collateralized by the respective financial institutions. In addition, the California Government Code requires that a financial institution secure deposits made by State or local governmental units by pledging securities in an undivided collateral pool held by a depository regulated under State law (unless so waived by the governmental unit). The market value of the pledged securities in the collateral pool must equal at least 110 percent of the total amount deposited by the public agencies. California law also allows financial institutions to secure public deposits by pledging first trust deed mortgage notes having a value of 150 percent of the secured public deposits and letters of credit issued by the Federal Home Loan Bank of San Francisco having a value of 105 percent of the secured deposits. As of June 30, 2019, $2,043,030 of the District's bank balance was exposed to custodial credit risk because it was uninsured and collateralized with securities held by the pledging financial institution's trust department or agency, but not in the name of the District. Investments–InterestRateRisk The District’s investment policy limits investment maturities as a means of managing its exposure to fair value losses arising from increasing interest rates. The District’s investment policy limits investment purchases to investments with a term not to exceed three years. Investments purchased with maturity terms greater than three years require approval by the Board of Education. Investments purchased with maturities greater than one year require written approval by the Superintendent prior to commitment. Maturities of investments held at June 30, 2019, consist of the following:
One YearFair Less Than Through Fair Value
Value One Year Five Years MeasurementInvestment maturities:
U.S. Bank - Money Market 2,536,103$ 2,536,103$ -$ Level 2
Maturity

42
FULLERTONSCHOOLDISTRICTNotestoFinancialStatementsJune30,2019 NOTE2–CASHANDINVESTMENTS(continued)Investments–CreditRiskThe District’s investment policy limits investment choices to obligations of local, state and federal agencies, commercial paper, certificates of deposit, repurchase agreements, corporate notes, banker acceptances, and other securities allowed by State Government Code Section 53600. At June 30, 2019, all investments represented governmental securities which were issued, registered and held by the District’s agent in the District’s name. The District does not place limits on the amount it may invest in any one issuer. At June 30, 2019, the District had the following investment that represents more than five percent of the District’s net investments.
U.S. Bank - Money Market 100% FairValueMeasurementsThe District categorizes the fair value measurements of its investments based on the hierarchy established by generally accepted accounting principles. The fair value hierarchy, which has three levels, is based on the valuation inputs used to measure an asset’s fair value. The following provides a summary of the hierarchy used to measure fair value:
Level 1 – Quoted prices in active markets for identical assets that the District has the ability to access at the measurement date. Level 1 assets may include debt and equity securities that are traded in an active exchange market and that are highly liquid and are actively traded in over-the-counter markets. Level 2 – Observable inputs other than Level 1 prices such as quoted prices for similar assets in active markets, quoted prices for identical or similar assets in markets that are not active, or other inputs that are observable, such as interest rates and curves observable at commonly quoted intervals, implied volatilities, and credit spreads. For financial reporting purposes, if an asset has a specified term, a Level 2 input is required to be observable for substantially the full term of the asset. Level 3 – Unobservable inputs should be developed using the best information available under the circumstances, which might include the District’s own data. The District should adjust that date if reasonably available information indicates that other market participants would use different data or certain circumstances specific to the District are not available to other market participants. Uncategorized – Investments in the Orange County Treasury Investment Pool are not measured using the input levels above because the District’s transactions are based on a stable net asset value per share. All contributions and redemptions are transacted at $1.00 net asset value per share.
All assets have been valued using a market approach, with quoted market prices.

43
FULLERTONSCHOOLDISTRICTNotestoFinancialStatementsJune30,2019 NOTE3–ACCOUNTSRECEIVABLE Accounts receivable as of June 30, 2019, consisted of the following:
GeneralFund
Cafeteria Special Revenue Fund
Non-MajorGovernmental
Funds
Total Governmental
FundsProprietary
FundFederal Government:
Categorical aid programs 3,528,090$ 938,067$ -$ 4,466,157$ -$ State Government:
Lottery 648,647 - - 648,647 - Child Nutrition - 29,345 - 29,345 - Categorical aid programs 960,541 - 253,621 1,214,162 -
Local:Special education 853,200 - - 853,200 - Interest 144,248 3,855 23,029 171,132 8,554 Other local 380,173 - 102,448 482,621 -
Total 6,514,899$ 971,267$ 379,098$ 7,865,264$ 8,554$
NOTE4–INTERFUNDTRANSACTIONS BalancesDueTo/FromOtherFundsBalances due to/from other funds at June 30, 2019, consisted of the following:
Non-MajorGeneral Governmental Proprietary
Fund Funds Fund TotalGeneral Fund -$ 65,449$ 59,793$ 125,242$ Non-Major Funds 778,115 - - 778,115 Proprietary Fund 7,235 - - 7,235
Total 785,350$ 65,449$ 59,793$ 910,592$
General Fund due to Child Development Fund for revenues, indirect costs, and expenditure reimbursement 65,449$ General Fund due to Self-Insurance Fund for workers' compensation expense 59,793 Child Development Fund due to General Fund for payroll, program and indirect costs 132,029 Cafeteria Special Revenue Fund due to General Fund for payroll and program costs 643,032 Self-Insurance Fund due to General Fund for payroll expense 7,235 Capital Facilities Fund due to General Fund for payroll expense and program costs 3,054
Total 910,592$
Due from Other Funds

44
FULLERTONSCHOOLDISTRICTNotestoFinancialStatementsJune30,2019 NOTE5–FUNDBALANCESAt June 30, 2019, fund balances of the District’s governmental funds were classified as follows:
Non-Major
General Cafeteria Special GovernmentalFund Revenue Fund Funds Total
Nonspendable:Revolving cash 50,000$ 229$ -$ 50,229$ Stores inventories 27,556 92,284 - 119,840 Prepaid expenditures 139,836 398 - 140,234
Total Nonspendable 217,392 92,911 - 310,303 Restricted:
Categorical programs 5,127,310 - - 5,127,310 Child development program - - 994,044 994,044 Child nutrition program - 1,843,811 - 1,843,811 Capital projects - - 3,840,577 3,840,577 Debt service - - 3,803,223 3,803,223
Total Restricted 5,127,310 1,843,811 8,637,844 15,608,965 Assigned:
LCFF supplemental 660,202 - - 660,202 LCFF base 444,030 - - 444,030 Educational services 150,637 - - 150,637 Textbook adoptions 3,400,000 - - 3,400,000 Deferred maintenance 600,000 - - 600,000 Deferred maintenance program 56,721 - - 56,721
Total Assigned 5,311,590 - - 5,311,590 Unassigned:
Reserve for economic uncertainties 4,572,359 - - 4,572,359 Remaining unassigned balances 22,823,121 - - 22,823,121
Total Unassigned 27,395,480 - - 27,395,480
Total 38,051,772$ 1,936,722$ 8,637,844$ 48,626,338$

45
FULLERTONSCHOOLDISTRICTNotestoFinancialStatementsJune30,2019 NOTE6–CAPITALASSETSANDDEPRECIATIONCapital asset activity for the year ended June 30, 2019, was as follows:
Balance, Balance,
July 1, 2018 Additions Retirements June 30, 2019Capital assets not being depreciated: Land 9,198,655$ -$ -$ 9,198,655$ Construction in progress 163,923 1,710,489 163,923 1,710,489 Total capital assets not being depreciated 9,362,578 1,710,489 163,923 10,909,144 Capital assets being depreciated: Improvement of sites 22,124,585 183,899 - 22,308,484 Buildings and improvements 140,100,978 1,906,082 - 142,007,060 Machinery and equipment 13,537,897 1,393,514 140,894 14,790,517 Total capital assets being depreciated 175,763,460 3,483,495 140,894 179,106,061 Accumulated depreciation for: Improvement of sites (18,016,400) (78,066) - (18,094,466) Buildings and improvements (70,434,619) (5,745,734) - (76,180,353) Machinery and equipment (11,351,909) (631,586) (140,894) (11,842,601) Total accumulated depreciation (99,802,928) (6,455,386) (140,894) (106,117,420) Total capital assets being depreciated, net 75,960,532 (2,971,891) - 72,988,641
Governmental activity capital assets, net 85,323,110$ (1,261,402)$ 163,923$ 83,897,785$
NOTE7–LONG‐TERMDEBTOTHERTHANPENSIONS Changes in long-term debt for the year ended June 30, 2019, were as follows:
Balance, Balance, Amount Due
July 1, 2018 Additions Deductions June 30, 2019 Within One YearGeneral Obligation Bonds: Principal payments 27,120,458$ -$ 2,995,000$ 24,125,458$ 3,330,000$ Accreted interest 6,120,290 600,306 - 6,720,596 - Unamortized issuance premium 1,168,555 - 372,294 796,261 372,293 Total General Obligation Bonds 34,409,303 600,306 3,367,294 31,642,315 3,702,293 Certificates of Participation 4,810,000 - 365,000 4,445,000 380,000 Fullerton RDA Loan 220,221 - 31,460 188,761 31,460 Early Retirement Incentive 1,774,418 - 354,884 1,419,534 354,884 Capital Leases 54,029 - 14,086 39,943 15,125 Compensated Absences 1,582,627 655,143 - 2,237,770 - Claims payable 2,507,001 303,052 - 2,810,053 - Other Postemployment Benefits 33,307,786 6,910,648 2,627,840 37,590,594 - Totals 78,665,385$ 8,469,149$ 6,760,564$ 80,373,970$ 4,483,762$
Payments for general obligation bonds are made by the Bond Interest and Redemption Fund. Certificates of Participation payments are made by the General Fund. Capital leases payments are made by the General Fund. RDA loan payments are made from the Capital Facilities Fund. Accumulated vacation, early retirement incentive, pensions, and other postemployment benefits will be paid for by the fund for which the employee worked.

46
FULLERTONSCHOOLDISTRICTNotestoFinancialStatementsJune30,2019 NOTE7–LONG‐TERMDEBTOTHERTHANPENSIONS(continued)A. GeneralObligationBonds
On March 5, 2002, a special election was held at which more than 55 percent of the voters in the District approved Measure “CC”, which authorized the issuance and sale of $49.7 million of general obligation bonds. The bonds are general obligations of the District, and the County is obligated to annually levy ad valorem taxes for the payment of the interest on, and the principal of the bonds. The bonds were issued to finance the construction of new facilities, such as multipurpose rooms, and renovation and improvement at existing schools and to fund a portion of the cost of construction of a new elementary school. 2010GeneralObligationRefundingBondsOn December 1, 2010, the District issued $27,645,000 of 2010 General Obligation Refunding Bonds. The bonds consist of serial bonds bearing fixed rates ranging from 2.0% to 5.0% with annual maturities from August 2011 through August 2026. The net proceeds of $30,215,831 (after issuance costs of $389,721, plus premium of $2,960,552) were used to advance refund $27,645,000 of the District’s outstanding Election of 2002, Series A General Obligation Bonds, in addition to paying the costs of issuance associated with the refunding bonds. Amounts paid to the refunded bond escrow agent in excess of the outstanding debt at the time of payment are recorded as deferred amounts on the refunding on the statement of net position and are amortized to interest expense over the life of the liability. Deferred amounts on the refunding of $205,292 remain to be amortized. As of June 30, 2019, all principal balance on the defeased debt was paid. 2014RefundingGeneralObligationBondsOn September 18, 2014, the District issued $6,080,000 of General Obligation Refunding Bonds. The bonds bear fixed interest rates between 3.0% and 5.0% with annual maturities from August 1, 2015 through August 1, 2026. The net proceeds of $6,685,239 (after premiums of $782,710 and issuance costs of $177,471) were used to prepay the District’s outstanding General Obligation Bonds. Amounts paid to the escrow agent in excess of the outstanding debt at the time of payment are recorded as deferred charges on refunding on the statement of net assets and are amortized to interest expense over the life of the liability. Deferred amounts on refunding of $105,728 remain to be amortized. As of June 30, 2019, all principal balance on the defeased debt was paid. 2018GeneralObligationRefundingBondsOn February 14, 2018, the District issued $12,365,000 of General Obligation Refunding Bonds. The bonds bear fixed interest rates ranging between 1.89% and 3.16% with annual maturities from August 1, 2018 through August 1, 2026. The net proceeds of $12,134,613 (after issuance costs of $230,387) were used to prepay a portion of the District’s outstanding General Obligation Refunding Bonds of 2010, in addition to paying the costs of issuance associated with the refunding bonds. Amounts paid to the refunded bond escrow agent in excess of the outstanding debt at the time of payment are recorded as deferred amounts on refunding on the statement of net assets and are amortized to interest expense over the life of the liability. Deferred amounts of refunding of $416,108 remain to be amortized. The net proceeds were used to purchase U.S. government securities. Those securities were deposited into an irrevocable trust with an escrow agent to provide for future debt service payments on the refunded bonds. As a result, the refunded bonds are considered to be defeased, and the related liability for the bonds has been removed from the District's liabilities. As of June 30, 2019, the principal balance outstanding on the defeased debt amounted to $11,315,000.

47
FULLERTONSCHOOLDISTRICTNotestoFinancialStatementsJune30,2019 NOTE7–GENERALLONG‐TERMDEBT(continued)A. GeneralObligationBonds(continued)
A summary of outstanding general obligation bonds issued is presented below:
Issue Maturity Interest Original Balance, Advance Balance
Series Date Date Rate Issue July 1, 2018 Additions Deductions Refundings June 30, 20192002 A 7/3/2002 8/1/2023 3.25%-5.375% 40,000,458$ 4,545,458$ -$ -$ 4,545,458$ 2010 Ref. 12/1/2010 8/1/2026 2.0%-5.0% 27,645,000 5,075,000 - 2,425,000 - 2,650,000 2014 Ref. 9/18/2014 8/1/2026 3.0%-5.0% 6,080,000 5,135,000 - 460,000 4,675,000 2018 Ref 2/14/2018 8/1/2026 1.89%-3.16% 12,365,000 12,365,000 - 110,000 - 12,255,000
86,090,458$ 27,120,458$ -$ 2,995,000$ -$ 24,125,458$
The annual requirements to amortize all general obligation bonds payable outstanding as of June 30, 2019, were as follows:
FiscalYear Principal Interest Total
2019-20 3,330,000$ 599,698$ 3,929,698$ 2020-21 1,892,188 3,138,580 5,030,768 2021-22 1,899,698 3,269,556 5,169,254 2022-23 1,907,802 3,406,113 5,313,915 2023-24 1,905,770 2,243,285 4,149,055 2024-27 13,190,000 629,827 13,819,827
Total 24,125,458$ 13,287,059$ 37,412,517$
B. CertificatesofParticipation
2011RefundingCertificatesofParticipationOn November 10, 2011, the District issued $6,935,000 of Refunding Certificates of Participation. The Certificates bear fixed interest rates averaging 3.4% with annual maturities from June 1, 2012 through June 1, 2029. The net proceeds of $6,832,899 (after issuance costs of $102,101) were used to prepay the District’s outstanding Certificates of Participation. The net proceeds were used to purchase U.S. government securities. Those securities were deposited into an irrevocable trust with an escrow agent to provide for future debt service payments on the refunded certificates. As a result, the refunded certificates are considered to be defeased, and the related liability for the certificates has been removed from the District’s liabilities. Amounts paid to the escrow agent in excess of the outstanding debt at the time of payment are recorded as deferred amounts on refunding on the statement of net position and are amortized to interest expense over the life of the liability. Deferred amounts on refunding of $90,499 remain to be amortized.
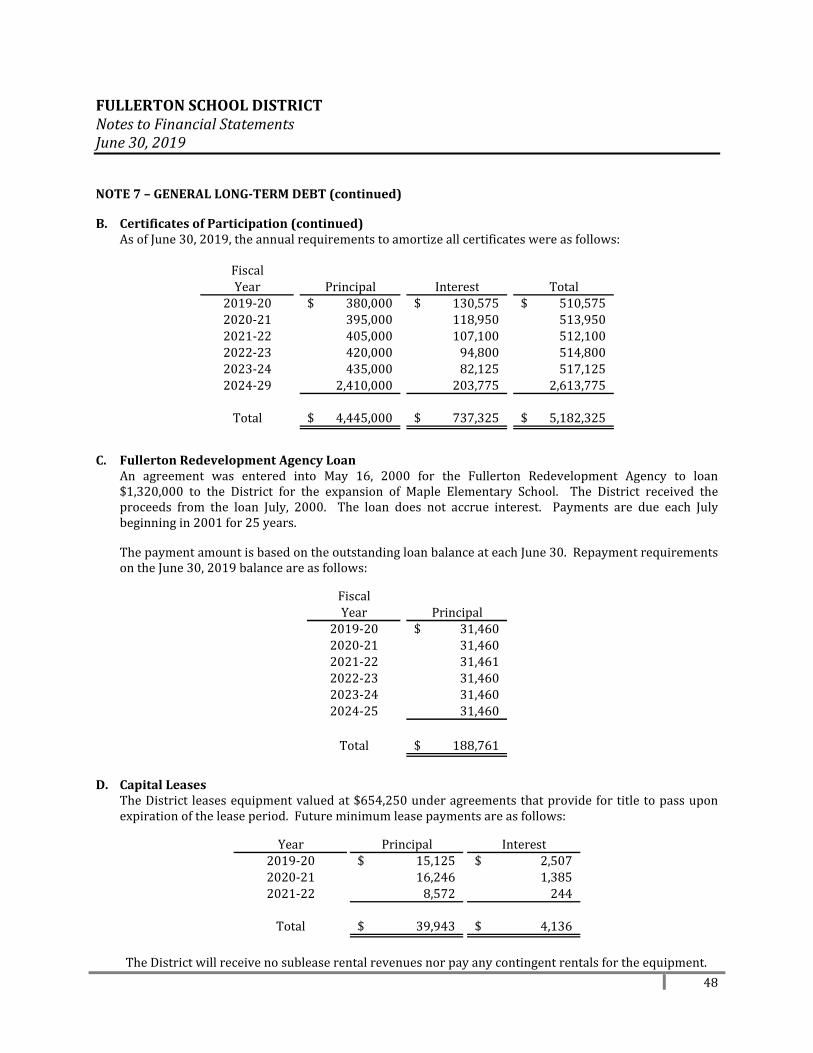
48
FULLERTONSCHOOLDISTRICTNotestoFinancialStatementsJune30,2019 NOTE7–GENERALLONG‐TERMDEBT(continued)
B. CertificatesofParticipation(continued)
As of June 30, 2019, the annual requirements to amortize all certificates were as follows:
FiscalYear Principal Interest Total
2019-20 380,000$ 130,575$ 510,575$ 2020-21 395,000 118,950 513,950 2021-22 405,000 107,100 512,100 2022-23 420,000 94,800 514,800 2023-24 435,000 82,125 517,125 2024-29 2,410,000 203,775 2,613,775
Total 4,445,000$ 737,325$ 5,182,325$
C. FullertonRedevelopmentAgencyLoan
An agreement was entered into May 16, 2000 for the Fullerton Redevelopment Agency to loan $1,320,000 to the District for the expansion of Maple Elementary School. The District received the proceeds from the loan July, 2000. The loan does not accrue interest. Payments are due each July beginning in 2001 for 25 years.
The payment amount is based on the outstanding loan balance at each June 30. Repayment requirements on the June 30, 2019 balance are as follows:
FiscalYear Principal
2019-20 31,460$ 2020-21 31,460 2021-22 31,461 2022-23 31,460 2023-24 31,460 2024-25 31,460
Total 188,761$
D. CapitalLeases
The District leases equipment valued at $654,250 under agreements that provide for title to pass upon expiration of the lease period. Future minimum lease payments are as follows:
Year Principal Interest
2019-20 15,125$ 2,507$ 2020-21 16,246 1,385 2021-22 8,572 244
Total 39,943$ 4,136$
The District will receive no sublease rental revenues nor pay any contingent rentals for the equipment.

49
FULLERTONSCHOOLDISTRICTNotestoFinancialStatementsJune30,2019 NOTE7–GENERALLONG‐TERMDEBT(continued) E. EarlyRetirement
The District has established a supplemental early retirement incentive program (SERP) whereby certain qualified employees may retire and receive a portion of their salary paid out as an annuity. The total future payments owing at June 30, 2019, for these obligations are shown below:
FiscalYear Payment
2019-20 354,884$ 2020-21 354,884 2021-22 354,883 2022-23 354,883
1,419,534$
F. Non‐ObligatoryDebt
Non-obligatory debt relates to debt issuances by the Community Facility Districts, as authorized by the Mello-Roos Community Facilities Act of 1982 as amended, and the Marks-Roos Local Bond Pooling Act of 1985, and are payable from special taxes levied on property within the Community Facilities Districts according to a methodology approved by the voters within the District. Neither the faith and credit nor taxing power of the District is pledged to the payment of the bonds. Reserves have been established from the bond proceeds to meet delinquencies should they occur. If delinquencies occur beyond the amounts held in those reserves, the District has no duty to pay the delinquency out of any available funds of the District. The District acts solely as an agent for those paying taxes levied and the bondholders, and may initiate foreclosure proceedings. On August 8, 2013, the Fullerton School District Financing Authority issued $16,475,000 in special tax revenue refunding bonds. The bonds were issued to refund two outstanding bonds previously issued by the Community Facilities Districts formed by Fullerton School District. The bonds carry stated interest rates ranging between 2.00% - 5.25% and fully mature in September 2031. Special assessment debt of $13,735,000 as of June 30, 2019, does not represent debt of the District and, as such, does not appear in the financial statements.

50
FULLERTONSCHOOLDISTRICTNotestoFinancialStatementsJune30,2019 NOTE7–LONG‐TERMDEBTOTHERTHANPENSIONS(continued) G. OtherPostemploymentBenefits(OPEB)Liability
For the fiscal year ended June 30, 2019, the District reported net OPEB liability, deferred outflows of resources, deferred inflows of resources, and OPEB expense for the following plans:
Net Deferred Outflows Deferred Inflows
Pension Plan OPEB Liability of Resources of Resources OPEB ExpenseDistrict Plan 36,879,628$ 3,037,269$ 1,766,031$ 3,636,887$ MPP Program 710,966 - - (79,548)
Total 37,590,594$ 3,037,269$ 1,766,031$ 3,557,339$
The details of each plan are as follows: DistrictPlanPlanDescriptionFullerton School District has a single-employer plan that provides post-employment benefits other than pensions (OPEB) to employees who meet certain criteria. The District provides post-employment healthcare benefits to eligible retirees and their covered eligible dependents and pays a portion of the cost. All active employees who retire directly from the District and meet the eligibility criteria may participate. The District has no assets accumulated in a trust that meets the criteria in paragraph 4 of GASB Statement No. 75. BenefitsProvidedThe postretirement health plans and the District’s obligation vary by employee group as described below. Certificated, Classified and Management employees may retire with District-paid health benefits after completing at least 10 years of District service and attainment of age 55. Certificated employees must have 10 years of full-time service with the District to be eligible. Classified employees may become eligible based on part-time service, with their District contributions pro-rated for full-time equivalency less than 100%. Management employees may have up to five years of management work in another district credited towards the 10-year requirement. The postretirement health plans and the District’s obligation vary by employee group as described below. Certificated Employees Certificated retirees receive a District contribution equal to the single-party medical premium and dental PPO premium. Spouses may be covered at the retiree's expense; however, if the retiree elects one of the HMO options, the District will contribute towards spousal coverage in an amount equal to the excess of the PPO premium over the single premium for the selected HMO. Classified Employees Classified retirees receive a District contribution equal to the single-party medical and dental premiums and the two-party vision premium. Spouses may be covered, and the District will contribute an amount equal on behalf of the spouse equal to the excess of the average of the HMO two-party premiums over the single premium for the coverage selected. District contributions are pro-rated for part-time service.

51
FULLERTONSCHOOLDISTRICTNotestoFinancialStatementsJune30,2019 NOTE7–LONG‐TERMDEBTOTHERTHANPENSIONS(continued) G. OtherPostemploymentBenefits(OPEB)Liability(continued)
DistrictPlan(continued)BenefitsProvided(continued)Management Employees Management retirees receive a District contribution equal to the single-party medical, dental and vision premiums. Spouses may be covered, and the District will contribute an amount on behalf of the spouse equal to the excess of the highest two-party HMO premium over the single premium for the coverage selected.The District's contribution ends at age 65 in all cases, except that one retired Superintendent is receiving lifetime supplemental coverage and five Management retirees over age 65 are currently receiving a District contribution equal to the excess of the vision rate over the single COBRA rate. There are also two spouses over age 65 receiving a coverage until each member’s age 65. Retired Superintendents and Assistant Superintendents have slightly different provisions apply but in all cases except those mentioned above, benefits end at age 65. EmployeesCoveredbyBenefitTermsAt June 30, 2019, the following employees were covered by the benefit terms:
Inactive employees or beneficiaries currently receiving benefit payments 86 Active employees 1,061
Total 1,147
TotalOPEBLiabilityThe District’s total OPEB liability of $36,879,628 was measured as of June 30, 2019, and was determined by an actuarial valuation as of June 30, 2019. ActuarialAssumptionsandOtherInputsThe total OPEB liability in the June 30, 2019 actuarial valuation was determined using the following actuarial assumptions and other inputs, applied to all periods included in the measurement, unless otherwise specified:
Valuation Date June 30, 2019Inflation 2.75 percentSalary increases 2.75 percentHealthcare cost trend ratesRetirees' share of benefit- Retirees who continue with the District medical plan are offered
4.00 percent

52
FULLERTONSCHOOLDISTRICTNotestoFinancialStatementsJune30,2019 NOTE7–LONG‐TERMDEBTOTHERTHANPENSIONS(continued) G. OtherPostemploymentBenefits(OPEB)Liability(continued)
DistrictPlan(continued)
DiscountRateThe discount rate of 3.5% is based on the Bond Buyer 20 Bond Index. MortalityRatesPre-retirement mortality rates were based on the RP-2014 Employee Mortality Table for Males or Females, as appropriate, without projection. Post-retirement mortality rates were based on the RP-2014 Health Annuitant Mortality Table for Males or Females, as appropriate, without projection. ChangesintheTotalOPEBLiability
TotalOPEBLiability
BalanceatJuly1,2018 32,517,273$ Changesfortheyear:
Service cost 2,437,691 Interest 1,198,400 Changes of assumptions 3,274,556 Experience Gains/Losses (1,286,016) Benefit payments (1,262,276) Net changes 4,362,355
BalanceatJune30,2019 36,879,628$
SensitivityoftheTotalOPEBLiabilitytoChangesintheDiscountRateThe following presents the total OPEB liability of the District, as well as what the District’s total OPEB liability would be if it were calculated using a discount rate that is one percentage-point lower or one percentage-point higher than the current discount rate:
OPEBDiscount Rate Liability
1% decrease (2.50%) 35,308,566$ Current discount rate (3.50%) 36,879,628$
1% increase (4.50%) 37,985,176$

53
FULLERTONSCHOOLDISTRICTNotestoFinancialStatementsJune30,2019 NOTE7–LONG‐TERMDEBTOTHERTHANPENSIONS(continued) G. OtherPostemploymentBenefits(OPEB)Liability(continued)
DistrictPlan(continued)
SensitivityoftheTotalOPEBLiabilitytoChangesintheHealthcareCostTrendRatesThe following presents the total OPEB liability of the District, as well as what the District’s total OPEB liability would be if it were calculated using healthcare cost trend rates that are one percentage-point lower or one percentage-point higher than the current healthcare cost trend rates:
Healthcare Cost OPEBTrend Rate Liability
1% decrease (3.00%) 39,241,831$ Current rate (4.00%) 36,879,628$ 1% increase (5.00%) 34,637,775$
OPEB Expense andDeferredOutflows ofResources andDeferred Inflows ofResourcesRelated toOPEBFor the year ended June 30, 2019, the District recognized OPEB expense of $3,636,887. In addition, at June 30, 2019, the District reported deferred outflows of resources related to OPEB from the following sources:
Deferred Outflows Deferred Inflowsof Resources of Resources
Differences between expected and actual experience -$ 1,192,826$ Changes of assumptions 3,037,269 573,205
Total 3,037,269$ 1,766,031$
The deferred outflows of resources related to OPEB resulting from contributions subsequent to the measurement date will be recognized as a reduction of the OPEB liability in the subsequent fiscal year. The deferred outflows of resources related to the differences between expected and actual experience in the measurement of the total OPEB liability will be amortized over the Expected Average Remaining Service Life (EARSL) of all members that are provided benefits (active, inactive, and retirees) as of the beginning of the measurement period. The EARSL for the measurement period is 6.79 years. MedicarePremiumPayment(MPP)Program PlanDescriptionThe MPP Program is a cost-sharing multiple-employer other postemployment benefit (OPEB) plan established pursuant to Chapter 1032, Statutes of 2000 (SB 1435). CalSTRS administers the MPP Program through the Teachers’ Health Benefit Fund (THBF). A full description of the MPP Program regarding benefit provisions, assumptions (for funding, but not accounting purposes), and membership information is listed in the June 30, 2017 annual actuarial valuation report, Medicare Premium Payment Program. This report and CalSTRS audited financial information are publicly available reports that can be found on the CalSTRS website under Publications at: http://www.calstrs.com/actuarial-financial-and-investor-information.

54
FULLERTONSCHOOLDISTRICTNotestoFinancialStatementsJune30,2019 NOTE7–LONG‐TERMDEBTOTHERTHANPENSIONS(continued) H. OtherPostemploymentBenefits(OPEB)Liability(continued)
MedicarePremiumPayment(MPP)Program BenefitsProvidedThe MPP Program pays Medicare Part A premiums and Medicare Parts A and B late enrollment surcharges for eligible members of the DB Program who were retired or began receiving a disability allowance prior to July 1, 2012, and were not eligible for premium-free Medicare Part A. The MPP Program is closed to new entrants as members who retire on or after July 1, 2012, are not eligible for coverage under the MPP Program. As of June 30, 2019, 5,984 retirees participated in the MPP Program. The number of retired members who will participate in the program in the future is unknown because eligibility cannot be predetermined.
The MPP Program is funded on a pay-as-you-go basis from a portion of monthly employer contributions. In accordance with California Education Code section 25930, contributions that would otherwise be credited to the DB Program each month are instead credited to the MPP Program to fund monthly program and administrative costs. Total redirections to the MPP Program are monitored to ensure that total incurred costs do not exceed the amount initially identified as the cost of the program. TotalOPEBLiabilityAt June 30, 2019, the District reported an MPP liability of $710,966 for its proportionate share of the net OPEB liability for the MPP Program. The total OPEB liability for the MPP Program as of June 30, 2018, was determined by applying update procedures to the financial reporting actuarial valuation as of June 30, 2017, and rolling forward the total OPEB liability to June 30, 2018. The District's proportion of the net OPEB liability was based on a projection of the District's long-term share of contributions to the OPEB plan relative to the projected contributions of all participating school districts and the State, actuarially determined. The District's proportions of the net OPEB liability for the two most recent measurement periods were:
FiscalYear FiscalYear ChangeEnding Ending Increase/
June30,2019 June30,2018 (Decrease)
Measurement Date June 30, 2018 June 30, 2017
Proportion of the Net OPEB Liability 0.185743% 0.187901% -0.002158%
PercentageShareofMPPProgram
For the year ended June 30, 2019, the District reported MPP OPEB expense of $(79,548).

55
FULLERTONSCHOOLDISTRICTNotestoFinancialStatementsJune30,2019 NOTE7–LONG‐TERMDEBTOTHERTHANPENSIONS(continued) G. OtherPostemploymentBenefits(OPEB)Liability(continued)
MedicarePremiumPayment(MPP)Program(continued)
ActuarialAssumptionsandOtherInputsThe total OPEB liability in the June 30, 2017 actuarial valuation was determined using the following actuarial assumptions and other inputs, applied to all periods included in the measurement, unless otherwise specified:
Measurement Date June 30, 2018Valuation Date June 30, 2017Experience Study July 1, 2010, through June 30, 2015Actuarial Cost Method Entry age normalInvestment Rate of Return 3.87%Healthcare Cost Trend Rates 3.70% for Medicare Part A, and
4.10% for Medicare Part B In addition, assumptions were made about future participation (enrollment) into the MPP Program because CalSTRS is unable to determine which members not currently participating meet all eligibility criteria for enrollment in the future. Assumed enrollment rates were derived based on past experience and are stratified by age with the probability of enrollment diminishing as the members’ age increases. This estimated enrollment rate was then applied to the population of members who may meet criteria necessary for eligibility and are not currently enrolled in the MPP Program. Based on this, the estimated number of future enrollments used in the financial reporting valuation was 459 or an average of 0.27 percent of the potentially eligible population (171,593). CalSTRS uses a generational mortality assumption, which involves the use of a base mortality table and projection scales to reflect expected annual reductions in mortality rates at each age, resulting in increases in life expectancies each year into the future. The base mortality tables are CalSTRS custom tables derived to best fit the patterns of mortality among its members. The projection scale was set equal to 110 percent of the ultimate improvement factor from the Mortality Improvement Scale (MP-2016) table issued by the Society of Actuaries. The MPP Program is funded on a pay-as-you-go basis with contributions generally being made at the same time and in the same amount as benefit payments and expenses coming due. Any funds within the MPP Program as of June 30, 2018, were to manage differences between estimated and actual amounts to be paid and were invested in the Surplus Money Investment Fund, which is a pooled investment program administered by the State Treasurer.
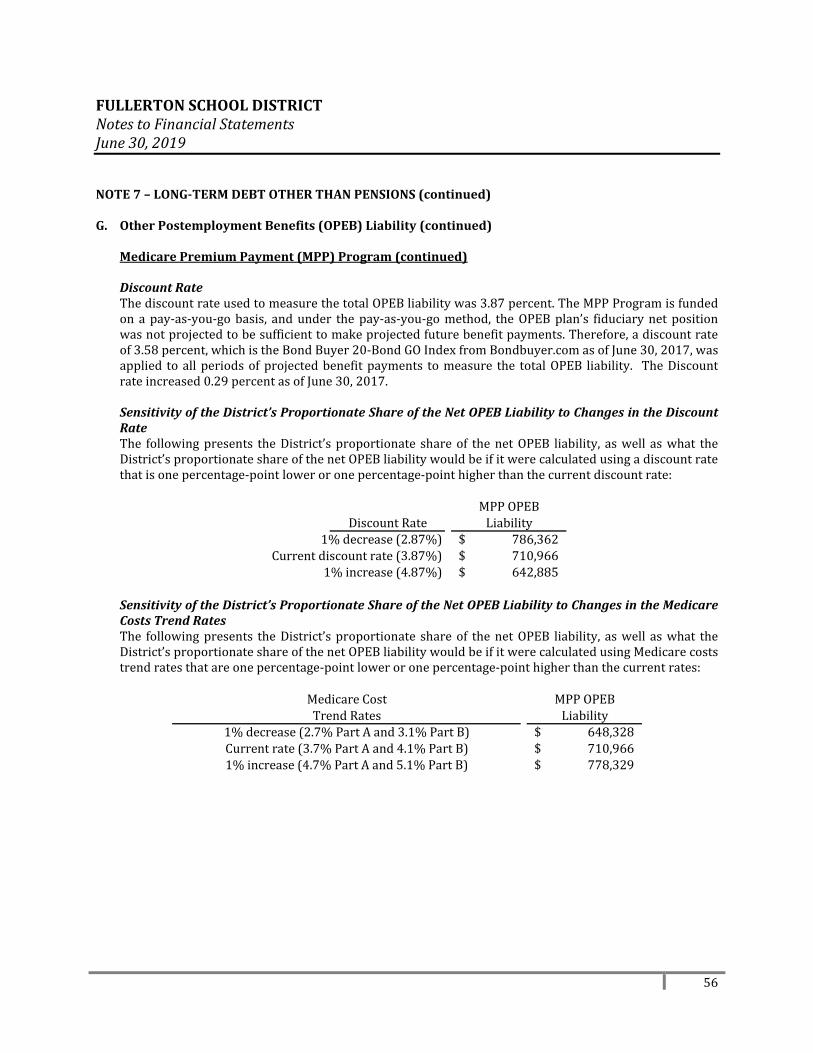
56
FULLERTONSCHOOLDISTRICTNotestoFinancialStatementsJune30,2019 NOTE7–LONG‐TERMDEBTOTHERTHANPENSIONS(continued) G. OtherPostemploymentBenefits(OPEB)Liability(continued)
MedicarePremiumPayment(MPP)Program(continued)
DiscountRateThe discount rate used to measure the total OPEB liability was 3.87 percent. The MPP Program is funded on a pay-as-you-go basis, and under the pay-as-you-go method, the OPEB plan’s fiduciary net position was not projected to be sufficient to make projected future benefit payments. Therefore, a discount rate of 3.58 percent, which is the Bond Buyer 20-Bond GO Index from Bondbuyer.com as of June 30, 2017, was applied to all periods of projected benefit payments to measure the total OPEB liability. The Discount rate increased 0.29 percent as of June 30, 2017.
SensitivityoftheDistrict’sProportionateShareoftheNetOPEBLiabilitytoChangesintheDiscountRateThe following presents the District’s proportionate share of the net OPEB liability, as well as what the District’s proportionate share of the net OPEB liability would be if it were calculated using a discount rate that is one percentage-point lower or one percentage-point higher than the current discount rate:
MPP OPEBDiscount Rate Liability
1% decrease (2.87%) 786,362$ Current discount rate (3.87%) 710,966$
1% increase (4.87%) 642,885$ SensitivityoftheDistrict’sProportionateShareoftheNetOPEBLiabilitytoChangesintheMedicareCostsTrendRatesThe following presents the District’s proportionate share of the net OPEB liability, as well as what the District’s proportionate share of the net OPEB liability would be if it were calculated using Medicare costs trend rates that are one percentage-point lower or one percentage-point higher than the current rates:
MPP OPEBLiability
648,328$ 710,966$ 778,329$ 1% increase (4.7% Part A and 5.1% Part B)
Medicare CostTrend Rates
1% decrease (2.7% Part A and 3.1% Part B)Current rate (3.7% Part A and 4.1% Part B)

57
FULLERTONSCHOOLDISTRICTNotestoFinancialStatementsJune30,2019 NOTE8–PENSIONPLANS Qualified employees are covered under multiple-employer defined benefit pension plans maintained by agencies of the State of California. Certificated employees are members of the California State Teachers' Retirement System (CalSTRS), and classified employees are members of the California Public Employees' Retirement System (CalPERS). For the fiscal year ended June 30, 2019, the District reported net pension liabilities, deferred outflows of resources, deferred inflows of resources, and pension expense for each of the above plans as follows:
Net Deferred Outflows Deferred Inflows
Pension Plan Pension Liability of Resources of Resources Pension ExpenseCalSTRS 108,556,721$ 27,523,867$ 10,391,185$ 14,062,077$ CalPERS 43,284,803 11,584,507 524,793 8,747,721
Total 151,841,524$ 39,108,374$ 10,915,978$ 22,809,797$
The details of each plan are as follows: A. CaliforniaStateTeachers’RetirementSystem(CalSTRS)
PlanDescriptionThe District contributes to the State Teachers Retirement Plan (STRP) administered by the California State Teachers' Retirement System (CalSTRS). STRP is a cost-sharing multiple-employer public employee retirement system defined benefit pension plan. Benefit provisions are established by State statutes, as legislatively amended, within the State Teachers' Retirement Law. A full description of the pension plan regarding benefit provisions, assumptions (for funding, but not accounting purposes), and membership information is listed in the June 30, 2017, annual actuarial valuation report, Defined Benefit Program Actuarial Valuation. This report and CalSTRS audited financial information are publicly available reports that can be found on the CalSTRS website under Publications at: http://www.calstrs.com/actuarial-financial-and-investor-information.
BenefitsProvidedThe STRP provides retirement, disability and survivor benefits to beneficiaries. Benefits are based on members' final compensation, age, and years of service credit. Members hired on or before December 31, 2012, with five years of credited service are eligible for the normal retirement benefit at age 60. Members hired on or after January 1, 2013, with five years of credited service are eligible for the normal retirement benefit at age 62. The normal retirement benefit is equal to 2.0% of final compensation for each year of credited service.
The STRP is comprised of four programs: Defined Benefit Program, Defined Benefit Supplement Program, Cash Balance Benefit Program, and Replacement Benefits Program. The STRP holds assets for the exclusive purpose of providing benefits to members and beneficiaries of these programs. CalSTRS also uses plan assets to defray reasonable expenses of administering the STRP. Although CalSTRS is the administrator of the STRP, the state is the sponsor of the STRP and obligor of the trust. In addition, the state is both an employer and nonemployer contributing entity to the STRP. The District contributes exclusively to the STRP Defined Benefit Program, thus disclosures are not included for the other plans.

58
FULLERTONSCHOOLDISTRICTNotestoFinancialStatementsJune30,2019 NOTE8–PENSIONPLANS(continued) A. CaliforniaStateTeachers’RetirementSystem(CalSTRS)
BenefitsProvided(continued)The STRP provisions and benefits in effect at June 30, 2019, are summarized as follows: STRPDefinedBenefitProgram Hire Date
On or before December 31, 2012
On or after January 1, 2013
Benefit Formula 2% at 60 2% at 62 Benefit Vesting Schedule 5 years of service 5 years of service Benefit Payments Monthly for life Monthly for life Retirement Age 60 62 Monthly Benefits as a Percentage of Eligible Compensation 2.0%-2.4% 2.0%-2.4% Required Member Contribution Rate 10.25% 10.205% Required Employer Contribution Rate 16.28% 16.25% Required State Contribution Rate 9.828% 9.828% ContributionsRequired member District and State of California contributions rates are set by the California Legislature and Governor and detailed in Teachers' Retirement Law. The contributions rates are expressed as a level percentage of payroll using the entry age normal actuarial method. In accordance with AB 1469, employer contributions into the CalSTRS will be increasing to a total of 19.1% of applicable member earnings phased over a seven year period. The contribution rates for each program for the year ended June 30, 2019, are presented above and the District's total contributions were $10,322,658. PensionLiabilities,PensionExpense,andDeferredOutflowsofResourcesandDeferredInflowsofResourcesRelatedtoPensionsAt June 30, 2019, the District reported a liability for its proportionate share of the net pension liability that reflected a reduction for State pension support provided to the District. The amount recognized by the District as its proportionate share of the net pension liability, the related state support and the total portion of the net pension liability that was associated with the District were as follows:
108,556,721$ 62,153,800
Total 170,710,520$
District's proportionate share of net pension liabilityState's proportionate share of the net pension liability associated with the District

59
FULLERTONSCHOOLDISTRICTNotestoFinancialStatementsJune30,2019 NOTE8–PENSIONPLANS(continued) A. CaliforniaStateTeachers’RetirementSystem(CalSTRS)(continued)
PensionLiabilities,PensionExpense,andDeferredOutflowsofResourcesandDeferredInflowsofResourcesRelatedtoPensions(continued)The net pension liability was measured as of June 30, 2018. The District's proportion of the net pension liability was based on a projection of the District's long-term share of contributions to the pension plan relative to the projected contributions of all participating school districts and the State, actuarially determined. The District's proportions of the net pension liability for the two most recent measurement periods were:
FiscalYear FiscalYear ChangeEnding Ending Increase/
June30,2019 June30,2018 (Decrease)
Measurement Date June 30, 2018 June 30, 2017
Proportion of the Net Pension Liability 0.118116% 0.118058% 0.000057%
PercentageShareofRiskPool
For the year ended June 30, 2019, the District recognized pension expense of $14,062,077. In addition, the District recognized pension expense and revenue of $2,119,432 for support provided by the State. At June 30, 2019, the District reported deferred outflows of resources and deferred inflows of resources related to pensions from the following sources:
Deferred Outflowsof Resources
Deferred Inflowsof Resources
10,322,658$ -$ - 4,634,219
16,864,579 - 336,630 1,576,846
Total 27,523,867$ 10,391,185$
Pension contributions subsequent to measurement dateNet change in proportionate share of net pension liabilityDifference between projected and actual earnings on pension plan investments - 4,180,119 Changes of assumptionsDifferences between expected and actual experience
The deferred outflows of resources related to pensions resulting from District contributions subsequent to the measurement date will be recognized as a reduction of the net pension liability in the subsequent fiscal year. The deferred outflows/(inflows) of resources related to the difference between projected and actual earnings on pension plan investments will be amortized over a closed five-year period. The deferred outflows/(inflows) of resources related to the net change in proportionate share of net pension liability, changes of assumptions, and differences between expected and actual experience in the measurement of the total pension liability will be amortized over the Expected Average Remaining Service Life (EARSL) of all members that are provided benefits (active, inactive, and retirees) as of the beginning of the measurement period. The EARSL for the measurement period is 7 years.

60
FULLERTONSCHOOLDISTRICTNotestoFinancialStatementsJune30,2019 NOTE8–PENSIONPLANS(continued) A. CaliforniaStateTeachers’RetirementSystem(CalSTRS)(continued)
PensionLiabilities,PensionExpense,andDeferredOutflowsofResourcesandDeferredInflowsofResourcesRelatedtoPensions(continued)Amounts reported as deferred outflows of resources and deferred inflows of resources related to pensions will be recognized in pension expense as follows:
Year EndedJune 30,
2020 2,770,621$ 2021 1,203,224 2022 (1,649,274) 2023 1,164,245 2024 3,535,561
Thereafter (214,353) Total 6,810,024$
DeferredOutflows/(Inflows)
of Resources
ActuarialMethodsandAssumptionsThe total pension liability for the STRP was determined by applying update procedures to the financial reporting actuarial valuation as of June 30, 2017, and rolling forward the total pension liability to June 30, 2018. In determining the total pension liability, the financial reporting actuarial valuation used the following actuarial methods and assumptions:
Valuation Date June 30, 2017 Experience Study July 1, 2010 through June 30, 2015 Actuarial Cost Method Entry age normal Investment Rate of Return 7.1% Consumer Price of Inflation 2.75% Wage Growth 3.5%
CalSTRS uses a generational mortality assumption, which involves the use of a base mortality table and projection scales to reflect expected annual reductions in mortality rates at each age, resulting in increases in life expectancies each year into the future. The base mortality tables are CalSTRS custom tables derived to best fit the patterns of mortality among our members. The projection scale was set equal to 110 percent of the ultimate improvement factor from the Mortality Improvement Scale (MP-2016) table issued by the Society of Actuaries. The long-term expected rate of return on pension plan investments was determined using a building-block method in which best-estimate ranges of expected future real rates of return (expected returns, net of pension plan investment expense and inflation) are developed for each major asset class. The best-estimate ranges were developed using capital market assumptions from CalSTRS’ general investment consultant (Pension Consulting Alliance–PCA) as inputs to the process. The actuarial investment rate of return assumption was adopted by the board in February 2017 in conjunction with the most recent experience study.

61
FULLERTONSCHOOLDISTRICTNotestoFinancialStatementsJune30,2019 NOTE8–PENSIONPLANS(continued) A. CaliforniaStateTeachers’RetirementSystem(CalSTRS)(continued)
ActuarialMethodsandAssumptions(continued)For each future valuation, CalSTRS’ consulting actuary reviews the return assumption for reasonableness based on the most current capital market assumptions. Best estimates of expected 20-year geometrically linked real rates of return and the assumed asset allocation for each major asset class as of June 30, 2019, are summarized in the following table:
Asset Class
Assumed Asset
Allocation
Long-Term Expected Real Rate of Return
Global Equity 47% 6.30% Fixed Income 12% 0.30% Real Estate 13% 5.20% Private Equity 13% 9.30% Risk Mitigating Strategies 9% 2.90% Inflation Sensitive 4% 3.80% Cash/Liquidity 2% (1.00)%
DiscountRateThe discount rate used to measure the total pension liability was 7.1%. The projection of cash flows used to determine the discount rate assumed the contributions from plan members and employers will be made at statutory contribution rates. Projected inflows from investment earnings were calculated using the long-term assumed investment rate of return (7.1%) and assuming that contributions, benefit payments and administrative expense occurred midyear. Based on these assumptions, the STRP's fiduciary net position was projected to be available to make all projected future benefit payments to current plan members. Therefore, the long-term assumed investment rate of return was applied to all periods of projected benefit payments to determine total pension liability. The following presents the District's proportionate share of the net pension liability calculated using the current discount rate as well as what the net pension liability would be if it were calculated using a discount rate that is one percent lower or higher than the current rate:
Net PensionDiscount Rate Liability
1% decrease (6.10%) 159,022,892$ Current discount rate (7.10%) 108,556,721
1% increase (8.10%) 66,715,367 On‐BehalfPaymentsThe State of California makes contributions to CalSTRS on behalf of the District. These payments consist of State General Fund contributions to CalSTRS pursuant to Sections 22954 and 22955.1 of the Education Code and Public Resources Code Section 6217.5. In addition, for the 2018-19 fiscal year, California Senate Bill No. 90 (SB 90) was signed into law on June 27, 2019, and appropriated supplemental contributions of $2,246,000,000. Under accounting principles generally accepted in the United States of America, these amounts are reported as revenues and expenditures in the fund financial statements. The total amount recognized by the District for its proportionate share of the State’s on-behalf contributions is $9,909,112.
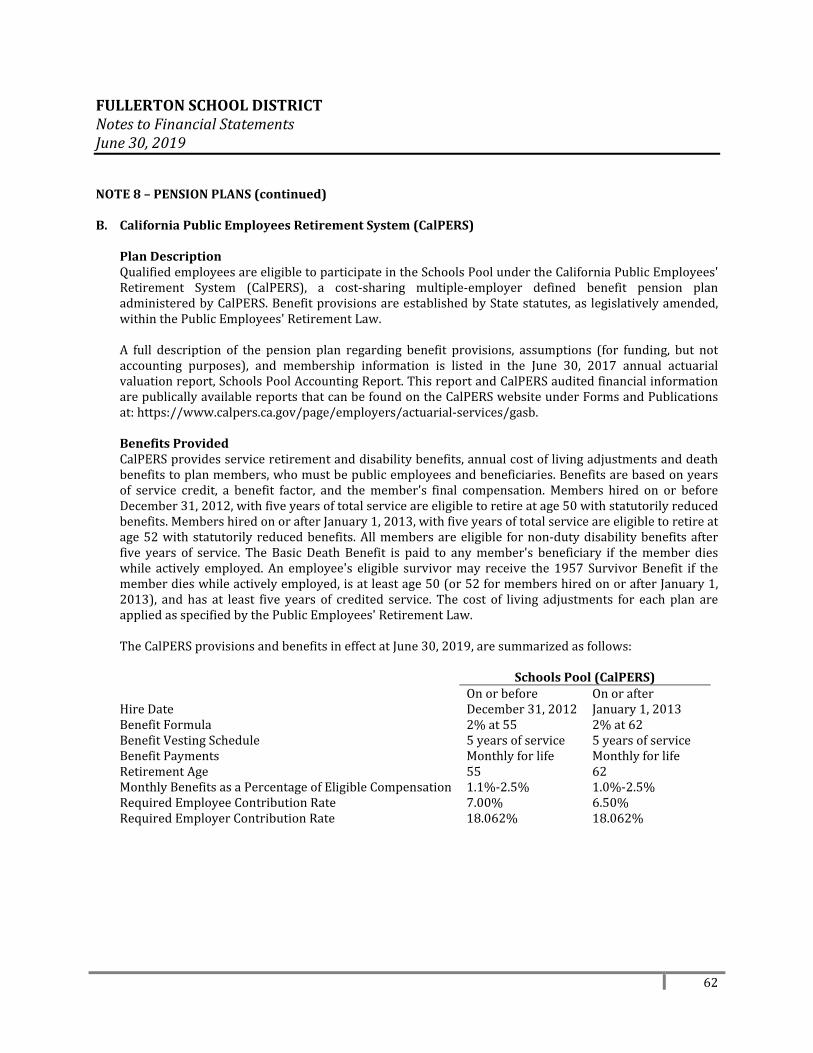
62
FULLERTONSCHOOLDISTRICTNotestoFinancialStatementsJune30,2019 NOTE8–PENSIONPLANS(continued) B. CaliforniaPublicEmployeesRetirementSystem(CalPERS)
PlanDescriptionQualified employees are eligible to participate in the Schools Pool under the California Public Employees' Retirement System (CalPERS), a cost-sharing multiple-employer defined benefit pension plan administered by CalPERS. Benefit provisions are established by State statutes, as legislatively amended, within the Public Employees' Retirement Law. A full description of the pension plan regarding benefit provisions, assumptions (for funding, but not accounting purposes), and membership information is listed in the June 30, 2017 annual actuarial valuation report, Schools Pool Accounting Report. This report and CalPERS audited financial information are publically available reports that can be found on the CalPERS website under Forms and Publications at: https://www.calpers.ca.gov/page/employers/actuarial-services/gasb. BenefitsProvidedCalPERS provides service retirement and disability benefits, annual cost of living adjustments and death benefits to plan members, who must be public employees and beneficiaries. Benefits are based on years of service credit, a benefit factor, and the member's final compensation. Members hired on or before December 31, 2012, with five years of total service are eligible to retire at age 50 with statutorily reduced benefits. Members hired on or after January 1, 2013, with five years of total service are eligible to retire at age 52 with statutorily reduced benefits. All members are eligible for non-duty disability benefits after five years of service. The Basic Death Benefit is paid to any member's beneficiary if the member dies while actively employed. An employee's eligible survivor may receive the 1957 Survivor Benefit if the member dies while actively employed, is at least age 50 (or 52 for members hired on or after January 1, 2013), and has at least five years of credited service. The cost of living adjustments for each plan are applied as specified by the Public Employees' Retirement Law. The CalPERS provisions and benefits in effect at June 30, 2019, are summarized as follows: SchoolsPool(CalPERS) Hire Date
On or before December 31, 2012
On or after January 1, 2013
Benefit Formula 2% at 55 2% at 62 Benefit Vesting Schedule 5 years of service 5 years of service Benefit Payments Monthly for life Monthly for life Retirement Age 55 62 Monthly Benefits as a Percentage of Eligible Compensation 1.1%-2.5% 1.0%-2.5% Required Employee Contribution Rate 7.00% 6.50% Required Employer Contribution Rate 18.062% 18.062%

63
FULLERTONSCHOOLDISTRICTNotestoFinancialStatementsJune30,2019 NOTE8–PENSIONPLANS(continued) B. CaliforniaPublicEmployeesRetirementSystem(CalPERS)(continued)
ContributionsSection 20814(c) of the California Public Employees' Retirement Law requires that the employer contribution rates for all public employers are determined on an annual basis by the actuary and shall be effective on the July 1 following notice of a change in the rate. Total plan contributions are calculated through the CalPERS annual actuarial valuation process. The actuarially determined rate is the estimated amount necessary to finance the costs of benefits earned by employees during the year, with an additional amount to finance any unfunded accrued liability. The District is required to contribute the difference between the actuarially determined rate and the contribution rate of employees. The contribution rates are expressed as a percentage of annual payroll. The contribution rates for each plan for the year ended June 30, 2019, are presented above and the total District contributions were $4,070,085. PensionLiabilities,PensionExpense,andDeferredOutflowsofResourcesandDeferredInflowsofResourcesRelatedtoPensionsAs of June 30, 2019, the District reported net pension liabilities for its proportionate share of the CalPERS net pension liability totaling $43,284,803. The net pension liability was measured as of June 30, 2018. The District's proportion of the net pension liability was based on a projection of the District's long-term share of contributions to the pension plan relative to the projected contributions of all participating school districts, actuarially determined. The District's proportions of the net pension liability for the two most recent measurement periods were:
FiscalYear FiscalYear ChangeEnding Ending Increase/
June30,2019 June30,2018 (Decrease)
Measurement Date June 30, 2018 June 30, 2017
Proportion of the Net Pension Liability 0.162339% 0.168682% -0.006343%
PercentageShareofRiskPool
For the year ended June 30, 2019, the District recognized pension expense of $8,747,721. At June 30, 2019, the District reported deferred outflows of resources and deferred inflows of resources related to pensions from the following sources:
Deferred Outflows
of ResourcesDeferred Inflows
of Resources4,070,085$ -$
- 524,793
4,321,797 - 2,837,593 -
Total 11,584,507$ 524,793$
Pension contributions subsequent to measurement dateNet change in proportionate share of net pension liabilityDifference between projected and actual earnings on pension plan investments - Changes of assumptionsDifferences between expected and actual experience
355,033

64
FULLERTONSCHOOLDISTRICTNotestoFinancialStatementsJune30,2019 NOTE8–PENSIONPLANS(continued) B. CaliforniaPublicEmployeesRetirementSystem(CalPERS)(continued)
PensionLiabilities,PensionExpense,andDeferredOutflowsofResourcesandDeferredInflowsofResourcesRelatedtoPensions(continued)The deferred outflows of resources related to pensions resulting from District contributions subsequent to the measurement date will be recognized as a reduction of the net pension liability in the subsequent fiscal year. The deferred outflows/(inflows) of resources related to the difference between projected and actual earnings on pension plan investments will be amortized over a closed five-year period. The deferred outflows/(inflows) of resources related to the net change in proportionate share of net pension liability, changes of assumptions, and differences between expected and actual experience in the measurement of the total pension liability will be amortized over the Expected Average Remaining Service Life (EARSL) of all members that are provided benefits (active, inactive, and retirees) as of the beginning of the measurement period. The EARSL for the measurement period is 4 years. Amounts reported as deferred outflows of resources and deferred inflows of resources related to pensions will be recognized in pension expense as follows:
Year EndedJune 30,
2020 4,597,360$ 2021 3,248,074 2022 (299,252) 2023 (556,553) 2024 -
Thereafter - Total 6,989,629$
DeferredOutflows/(Inflows)
of Resources
ActuarialMethodsandAssumptionsTotal pension liability for the Schools Pool was determined by applying update procedures to a financial reporting actuarial valuation as of June 30, 2017, and rolling forward the total pension liability to June 30, 2018. The financial reporting actuarial valuation as of June 30, 2017, used the following methods and assumptions, applied to all prior periods included in the measurement:
Valuation Date June 30, 2017 Experience Study 1997-2015 Actuarial Cost Method Entry age normal Discount Rate 7.15% Consumer Price of Inflation 2.75% Wage Growth Varies by entry age and service
Post-retirement mortality rates are based on CalPERS’ experience and include 15 years of projected ongoing mortality improvement using 90 percent of Scale MP 2016 published by the Society of Actuaries.

65
FULLERTONSCHOOLDISTRICTNotestoFinancialStatementsJune30,2019 NOTE8–PENSIONPLANS(continued) B. CaliforniaPublicEmployeesRetirementSystem(CalPERS)(continued)
ActuarialMethodsandAssumptions(continued)In determining the long-term expected rate of return, CalPERS took into account both short-term and long-term market return expectations as well as the expected pension fund cash flows. Using historical returns of all the funds' asset classes, expected compound returns were calculated over the short-term (first ten years) and the long-term (11+ years) using a building-block approach. Using the expected nominal returns for both short-term and long-term, the present value of benefits was calculated for each fund. The expected rate of return was set by calculating the single equivalent expected return that arrived at the same present value of benefits for cash flows as the one calculated using both short-term and long-term returns. The expected rate of return was then set equivalent to the single equivalent rate calculated above and adjusted to account for assumed administration expenses. The target asset allocation and best estimates of real rates of return for each major asset class are summarized in the following table:
Asset Class
Assumed Asset Allocation
Real Return Years 1-10
Real Return Years 11+
Global Equity 50% 4.80% 5.98% Fixed Income 28% 1.00% 2.62% Inflation Assets 0% 0.77% 1.81% Private Equity 8% 6.30% 7.23% Real Assets 13% 3.75% 4.93% Liquidity 1% 0.00% (0.92%)
DiscountRateThe discount rate used to measure the total pension liability was 7.15%. The projection of cash flows used to determine the discount rate assumed the contributions from plan members and employers will be made at statutory contribution rates. Based on these assumptions, the School Employer Pool fiduciary net position was projected to be available to make all projected future benefit payments to current plan members. Therefore, the long-term assumed investment rate of return was applied to all periods of projected benefit payments to determine total pension liability. The following presents the District's proportionate share of the net pension liability calculated using the current discount rate as well as what the net pension liability would be if it were calculated using a discount rate that is one percent lower or higher than the current rate:
Net PensionDiscount Rate Liability
1% decrease (6.15%) 63,020,604$ Current discount rate (7.15%) 43,284,803
1% increase (8.15%) 26,911,132

66
FULLERTONSCHOOLDISTRICTNotestoFinancialStatementsJune30,2019 NOTE8–PENSIONPLANS(continued) B. CaliforniaPublicEmployeesRetirementSystem(CalPERS)(continued)
On‐BehalfPaymentsThe State of California normally makes no contributions to CalPERS on behalf of the District. However, for the 2018-19 fiscal year, California Senate Bill No. 90 (SB 90) was signed into law on June 27, 2019, and appropriated contributions of $904,000,000. Under accounting principles generally accepted in the United States of America, these amounts are reported as revenues and expenditures in the fund financial statements. The total amount recognized by the District for its proportionate share of the State’s on-behalf contributions is $1,467,548.
C. SocialSecurity
As established by Federal law, all public sector employees who are not members of their employer's existing retirement system (CalSTRS or CalPERS) must be covered by social security or an alternative plan. The District has elected to use the Social Security as its alternative plan.
D. PayablestothePensionPlans
At June 30, 2019, the District reported payables of $29,294 and $33,758 for the outstanding amount of legally required contributions to the CalSTRS and CalPERS pension plans, respectively, for the fiscal year ended June 30, 2019.
NOTE9–JOINTPOWERSAGREEMENTS The Fullerton School District participates in two joint ventures under a joint powers agreement (JPA), the Schools Excess Liability Fund (SELF) and Alliance of Schools for Cooperative Insurance Programs (ASCIP). The relationship between the Fullerton School District and the JPAs is such that the JPAs are not a component unit of the District for financial reporting purposes as explained below: SELF arranges for and provides a self-funded excess liability fund for approximately 1,100 public educational agencies. ASCIP arranges for and provides property and liability insurance for its member school districts. The JPAs are governed by boards consisting of representatives from certain member districts. The Boards control the operation of the JPAs, including selection of management and approval of operating budgets, independent of any influence by the members beyond their representation of the Board. Each member pays an annual contribution based upon that calculated by the JPAs’ Boards and shares surpluses and deficits proportionately to its participation in the JPAs. The Fullerton School District also participates in a JPA that meets the definition of a component unit, as described below: The Fullerton School District Financing Authority is a joint exercise of powers agency comprised of the Fullerton School District and Community Facilities District No. 2000-1. Its purpose is to provide financing and refinancing for public capital improvements.

67
FULLERTONSCHOOLDISTRICTNotestoFinancialStatementsJune30,2019
NOTE9–JOINTPOWERSAGREEMENTS(continued) Condensed financial information is as follows:
SELF ASCIP FSD Finance Authority
June 30, 2018 June 30, 2018 June 30, 2019Total Assets 118,692,006$ 454,668,010$ 1,737,420$ Deferred outflows-pensions 497,939 1,762,160 - Total Liabilities 101,064,545 251,584,695 - Deferred inflows-pensions 28,087 442,840 - Net Position 18,097,313$ 204,402,635$ 1,737,420$
Total Revenues 15,073,823$ 259,307,983$ 1,708,908$ Total Expenses 19,471,187 251,547,168 1,699,985 Total Non-Operating Revenues (Expense) 65,650 2,679,762 - Change in Net Position (4,331,714)$ 10,440,577$ 8,923$
NOTE10–COMMITMENTSANDCONTINGENCIES A. StateandFederalAllowances,Awards,andGrants
The District has received state and federal funds for specific purposes that are subject to review and audit by the grantor agencies. Although such audits could generate expenditure disallowances under terms of the grants, it is believed that any required reimbursement will not be material.
B. ConstructionCommitmentsAs of June 30, 2019, the District had commitments with respect to unfinished capital projects of approximately $1.7 million to be paid from a combination of State and local funds.
C. Litigation
The District is the defendant in a number of lawsuits arising principally in the normal course of operations. In the opinion of the administration, the outcome of these lawsuits will not have a materially adverse effect on the accompanying financial statements and accordingly, no provision for losses has been recorded beyond claims payable and incurred but not reported reserves established in the Self-Insurance Internal Service Fund.

68
FULLERTONSCHOOLDISTRICTNotestoFinancialStatementsJune30,2019 NOTE11–RISKMANAGEMENT PropertyandLiabilityThe District is exposed to various risks of loss related to torts; theft of, damage to, and destruction of assets; errors and omissions; injuries to employees and natural disasters. During fiscal year ending June 30, 2019, the District was self-insured for property and liability losses with specific deductibles, but participated in the ASCIP public entity risk pool for excess property and liability insurance coverage. Settled claims have not exceeded this commercial coverage in any of the past three years. Workers’CompensationFor fiscal year 2019, the District was self-funded for workers compensation, with coverage purchased from a private insurer for claims in excess of the $1.0 million retention amount. EmployeeMedicalBenefitsThe District has contracted through Self-Insured Schools of California (SISC), Anthem Blue Cross and Kaiser Permanente to provide employee medical and surgical benefits, Delta Dental and Deltacare USA for dental benefits and Vision Service Plan (VSP). ClaimsLiabilityThe District records an estimated liability for workers’ compensation claims against the District. Claims liabilities are based on estimates of the ultimate cost of reported claims (including future claim adjustment expenses) and an estimate for claims incurred but not reported based on historical experience. UnpaidClaimsLiabilitiesThe District establishes a liability for both reported and unreported events, which includes estimates of both future payments of losses and related claim adjustment expenses.
The following represent the changes in approximate aggregate liabilities for the District from July 1, 2017 to June 30, 2019:
Workers'
CompensationLiability Balance, July 1, 2017 2,389,956$
Claims and changes in estimates 1,540,633 Claims payments (1,423,588)
Liability Balance, June 30, 2018 2,507,001 Claims and changes in estimates 1,555,221 Claims payments (1,252,169)
Liability Balance, June 30, 2019 2,810,053$
Assets available to pay claims at June 30, 2019 4,696,110$

RequiredSupplementaryInformation

(Thispageintentionallyleftblank)

Seeaccompanyingnotetorequiredsupplementaryinformation. 69
FULLERTONSCHOOLDISTRICTBudgetaryComparisonSchedule–GeneralFundFortheFiscalYearEndedJune30,2019
VariancewithActual FinalBudget‐
Original Final (BudgetaryBasis) Pos(Neg)Revenues
Local Control Funding Formula Sources 114,663,974$ 114,450,170$ 115,164,777$ 714,607$ Federal Sources 6,098,609 7,735,430 7,416,511 (318,919) Other State Sources 10,150,780 20,229,579 20,609,289 379,710 Other Local Sources 8,612,514 10,478,141 11,997,785 1,519,644
- Total Revenues 139,525,877 152,893,320 155,188,362 2,295,042 Expenditures
Current:Certificated Salaries 64,565,545 64,405,435 63,990,196 415,239 Classified Salaries 22,814,912 23,059,066 23,046,440 12,626 Employee Benefits 33,864,213 45,069,998 43,974,099 1,095,899 Books and Supplies 7,889,045 11,675,504 7,768,904 3,906,600 Services and Other Operating Expenditures 10,673,592 10,034,600 10,074,480 (39,880) Transfers of Indirect Cost (447,958) (468,802) (421,550) (47,252)
Capital Outlay 1,202,343 2,394,488 2,253,304 141,184 Intergovernmental 1,340,000 1,340,000 1,201,860 138,140 Debt Service 524,231 524,231 524,231 -
Total Expenditures 142,425,923 158,034,520 152,411,964 5,622,556
Excess (Deficiency) of RevenuesOver (Under) Expenditures (2,900,046) (5,141,200) 2,776,398 7,917,598
Fund Balance, July 1, 2018 32,228,372 35,218,653 35,218,653 -
Fund Balance, June 30, 2019 29,328,326$ 30,077,453$ 37,995,051$ 7,917,598$
FundBalancesincludedintheStatementofRevenues,ExpendituresandChangesinFundBalances:
Deferred Maintenance Fund 56,721 ReportedGeneralFundbalanceontheStatementofRevenues,ExpendituresandChangesinFundBalances: 38,051,772$
BudgetedAmounts

Seeaccompanyingnotetorequiredsupplementaryinformation. 70
FULLERTONSCHOOLDISTRICTBudgetaryComparisonSchedule–CafeteriaFundFortheFiscalYearEndedJune30,2019
VariancewithActual FinalBudget‐
Original Final (BudgetaryBasis) Pos(Neg)Revenues
Federal Sources 4,530,565$ 4,514,631$ 4,453,944$ (60,687)$ Other State Sources 249,471 252,226 351,660 99,434 Other Local Sources 1,310,504 1,348,161 1,351,910 3,749
Total Revenues 6,090,540 6,115,018 6,157,514 42,496 Expenditures
Current:Classified Salaries 2,000,582 2,025,582 1,983,846 41,736 Employee Benefits 919,793 929,625 961,263 (31,638) Food and Supplies 2,621,030 2,621,387 2,711,554 (90,167) Services and Other Operating Expenditures 312,798 339,069 294,029 45,040 Transfers of Indirect Cost 242,167 248,225 242,169 6,056
Capital Outlay 215,000 313,000 181,757 131,243 Total Expenditures 6,311,370 6,476,888 6,374,618 102,270
Excess (Deficiency) of RevenuesOver (Under) Expenditures (220,830) (361,870) (217,104) (59,774)
Fund Balance, July 1, 2018 2,153,826 2,153,826 2,153,826 -
Fund Balance, June 30, 2019 1,932,996$ 1,791,956$ 1,936,722$ (144,766)$
BudgetedAmounts

Seeaccompanyingnotetorequiredsupplementaryinformation. 71
FULLERTONSCHOOLDISTRICTScheduleofProportionateShareoftheNetPensionLiabilityFortheFiscalYearEndedJune30,2019
2018 2017 2016 2015 2014CalSTRS
District's proportion of the net pension liability 0.1181% 0.1181% 0.1200% 0.1170% 0.1290%
District's proportionate share of the net pension liability 108,556,721$ 109,180,387$ 97,057,200$ 78,769,080$ 75,383,730$ State's proportionate share of the net pension liability
associated with the District 62,153,800 64,590,194 55,261,067 41,660,048 45,520,408
Totals 170,710,521$ 173,770,581$ 152,318,267$ 120,429,128$ 120,904,138$
District's covered-employee payroll 65,021,734$ 62,716,781$ 60,377,307$ 57,461,667$ 53,572,921$
District's proportionate share of the net pension liabilityas a percentage of its covered-employee payroll 166.95% 174.08% 160.75% 137.08% 140.71%
Plan fiduciary net position as a percentage of the total pension liability 71% 69% 70% 74% 77%
CalPERS
District's proportion of the net pension liability 0.1623% 0.1687% 0.1673% 0.1644% 0.1587%
District's proportionate share of the net pension liability 43,284,803$ 40,268,954$ 33,041,853$ 24,232,722$ 18,016,314$
District's covered-employee payroll 21,446,584$ 21,336,110$ 19,938,997$ 18,132,291$ 17,467,785$
District's proportionate share of the net pension liabilityas a percentage of its covered-employee payroll 201.83% 188.74% 165.71% 133.64% 103.14%
Plan fiduciary net position as a percentage of the total pension liability 71% 72% 74% 79% 83%
NotestoSchedule:* Thisscheduleisrequiredtoshowinformationfortenyears;however,untilafulltenyeartrendiscompiled,informationispresentedforthoseyearsforwhichinformationisavailable.
Last Ten Fiscal Years*

Seeaccompanyingnotetorequiredsupplementaryinformation. 72
FULLERTONSCHOOLDISTRICTScheduleofPensionContributionsFortheFiscalYearEndedJune30,2019
2019 2018 2017 2016 2015CalSTRS
Contractually required contribution 10,480,427$ 9,382,636$ 7,889,771$ 6,478,548$ 5,102,596$
Contributions in relation to the contractually required contribution 10,480,427 9,382,636 7,889,771 6,478,548 5,102,596
Contribution deficiency (excess): -$ -$ -$ -$ -$
District's covered-employee payroll 64,376,086$ 65,021,734$ 62,716,781$ 60,377,307$ 57,461,667$
Contributions as a percentage of covered-employee payroll 16.28% 14.43% 12.58% 10.73% 8.88%
CalPERS
Contractually required contribution 4,070,085$ 3,330,869$ 2,963,158$ 2,362,173$ 2,134,352$
Contributions in relation to the contractually required contribution 4,070,085 3,330,869 2,963,158 2,362,173 2,134,352
Contribution deficiency (excess): -$ -$ -$ -$ -$
District's covered-employee payroll 22,533,964$ 21,446,584$ 21,336,103$ 19,938,997$ 18,132,291$
Contributions as a percentage of covered-employee payroll 18.062% 15.531% 13.888% 11.847% 11.771%
* Thisscheduleisrequiredtoshowinformationfortenyears;however,untilafulltenyeartrendiscompiled,informationispresentedforthoseyearsforwhichinformationisavailable.
Last Ten Fiscal Years*

Seeaccompanyingnotetorequiredsupplementaryinformation. 73
FULLERTONSCHOOLDISTRICTScheduleofChangesintheDistrict’sTotalOPEBLiabilityandRelatedRatiosFortheFiscalYearEndedJune30,2019
2018 2017
TotalOPEBliabilityService cost 2,437,691$ 2,366,690$ Interest 1,198,400 973,022 Experience Gains/Losses (1,286,016) - Changes of assumptions or other inputs 3,274,556 (1,189,399) Benefit payments (1,262,276) (1,428,991) NetchangeintotalOPEBliability 4,362,355 721,322 TotalOPEBliability‐beginning 32,517,273 31,795,951 TotalOPEBliability‐ending 36,879,628$ 32,517,273$
Covered‐employeepayroll 90,580,263$ 90,469,777$
TotalOPEBliabilityasapercentageofcovered‐employeepayroll 40.71% 35.94%
NotestoSchedule:The discount rate was decreased from 3.62% to 3.50%. The medical trend assumption was decreased from 5.00% to 4.00%.
*Thisscheduleisrequiredtoshowinformationfortenyears;however,untilafulltenyeartrendiscompiled,informationispresentedforthoseyearsforwhichinformationisavailable.
Last 10 Fiscal Years*

Seeaccompanyingnotetorequiredsupplementaryinformation. 74
FULLERTONSCHOOLDISTRICTScheduleoftheDistrict’sProportionateShareoftheNetOPEBLiability–MPPProgramFortheFiscalYearEndedJune30,2019
2018 2017
District's proportion of net OPEB liability 0.1857% 0.1879%
District's proportionate share of net OPEB liability 710,966$ 790,513$
Covered-employee payroll N/A N/A
District's net OPEB liability as a percentage of covered-employee payroll N/A N/A
Plan fiduciary net position as a percentage of the total OPEB liability 0.40% 0.01%
NotestoSchedule:AsofJune30,2012,activemembersarenolongereligibleforfutureenrollmentintheMPPProgram;therefore,thecoveredpayrolldisclosureisnotapplicable.
Thisscheduleisrequiredtoshowinformationfortenyears;however,untilafulltenyeartrendiscompiled,informationispresentedforthoseyearsforwhichinformationisavailable.

75
FULLERTONSCHOOLDISTRICTNotestotheRequiredSupplementaryInformationFortheFiscalYearEndedJune30,2019
NOTE1–PURPOSEOFSCHEDULESBudgetaryComparisonScheduleThe District employs budget control by object codes and by individual appropriation accounts. Budgets are prepared on the modified accrual basis of accounting in accordance with accounting principles generally accepted in the United States of America as prescribed by the Governmental Accounting Standards Board and provisions of the California Education Code. The governing board is required to hold a public hearing and adopt an operating budget no later than July 1 of each year. The adopted budget is subject to amendment throughout the year to give consideration to unanticipated revenue and expenditures primarily resulting from events unknown at the time of budget adoptions with the legal restriction that expenditures cannot exceed appropriations by major object account. The amounts reported as the original budgeted amounts in the budgetary statements reflect the amounts when the original appropriations were adopted. The amounts reported as the final budgeted amounts in the budgetary statements reflect the amounts after all budget amendments have been accounted for. This schedule presents information for the original and final budgets and actual results of operations, as well as the variances from the final budget to actual results of operations. ScheduleoftheProportionateShareoftheNetPensionLiabilityThis schedule presents information on the District’s proportionate share of the net pension liability (NPL), the plans’ fiduciary net position and, when applicable, the State’s proportionate share of the NPL associated with the District. In the future, as data becomes available, ten years of information will be presented.
Changeinbenefitterms – There were no changes in benefit terms since the previous valuations for both CalSTRS and CalPERS.
Change of assumptions ‐ In 2018, demographic assumptions and inflation rate were changed in accordance to the CalPERS Experience Study and Review of Actuarial Assumptions December 2017. There were no changes in the discount rate.
ScheduleofPensionContributionThis schedule presents information on the District’s required contribution, the amounts actually contributed, and any excess or deficiency related to the required contribution. In the future, as data becomes available, ten years of information will be presented. ScheduleofChangesintheDistrict’sTotalOPEBLiabilityandRelatedRatiosThis schedule presents information on the District’s changes in the total OPEB liability, including beginning and ending balances, and the total OPEB liability. In the future, as data becomes available, ten years of information will be presented.
Changeinbenefitterms – There were no changes in benefit terms since the previous valuation. Change of assumptions – Liability changes resulting from changes in economic and demographic assumptions are also deferred based on the average working life. The discount rate was decreased from 3.62% to 3.50%. The medical trend assumption was decreased from 5.00% to 4.00%.

76
FULLERTONSCHOOLDISTRICTNotestotheRequiredSupplementaryInformationFortheFiscalYearEndedJune30,2019 NOTE1–PURPOSEOFSCHEDULES(continued)ScheduleoftheDistrict’sProportionateShareoftheNetOPEBLiability–MPPProgramThis schedule presents information on the District’s proportionate share of the net OPEB liability – MPP Program and the plans’ fiduciary net position. In the future, as data becomes available, ten years of information will be presented.
Changeinbenefitterms – There were no changes in benefit terms since the previous valuation. Changeofassumptions – The plan rate of investment return assumption was changed from 3.58 percent to 3.87 percent since the previous valuation.

SupplementaryInformation

(Thispageintentionallyleftblank)

77
FULLERTONSCHOOLDISTRICTLocalEducationalAgencyOrganizationStructureJune30,2019 The Fullerton School District was established in 1888. The District boundaries encompass approximately 26 square miles in Orange County. There were no changes in the boundaries of the District during the current year. The District is currently operating 15 elementary schools (K-6), two combined K-8 schools, and three junior high schools.
BOARDOFTRUSTEESMember Office TermExpires
Janny Meyer President November 30, 2022
Jeanette Vazquez Vice President November 30, 2020
Hilda Sugarman Clerk November 30, 2020
Aaruni Thakur Member November 30, 2022
Beverly Berryman Member November 30, 2022
DISTRICTADMINISTRATORS
Robert Pletka, Ed.D., Superintendent
Robert R. Coghlan, Ph.D.,
AssistantSuperintendent,BusinessServices
Jeremy Davis, AssistantSuperintendent,InnovationandInstructionalSupport
Emy Flores, Ed.D.,
AssistantSuperintendent,EducationalServices
Chad Hammitt, Ed.D., AssistantSuperintendent,PersonnelServices

Seeaccompanyingnotetosupplementaryinformation. 78
FULLERTONSCHOOLDISTRICTScheduleofAverageDailyAttendanceFortheFiscalYearEndedJune30,2019
SecondPeriod AnnualReport Report
Certificate No. Certificate No.AF698AAA 3D06EC68
Regular&ExtendedYearADA:Transitional Kindergarten through Third 5,367.93 5,375.10 Fourth through Sixth 4,325.23 4,315.42 Seventh through Eighth 2,962.19 2,952.79
Total Regular & Extended Year ADA 12,655.35 12,643.31
SpecialEducation‐Nonpublic,NonsectarianSchools:Transitional Kindergarten through Third 3.35 3.34 Fourth through Sixth 2.71 2.78 Seventh through Eighth 3.50 3.51
Total Special Education - Nonpublic, Nonsectarian Schools 9.56 9.63
Total ADA 12,664.91 12,652.94

Seeaccompanyingnotetosupplementaryinformation. 79
FULLERTONSCHOOLDISTRICTScheduleofInstructionalTimeFortheFiscalYearEndedJune30,2019
2018-19 Number of DaysRequired Actual Traditional
Grade Level Minutes Minutes Calendar Status
Kindergarten 36,000 37,310 180 CompliedGrade 1 50,400 52,544 180 CompliedGrade 2 50,400 52,740 180 CompliedGrade 3 50,400 53,320 180 CompliedGrade 4 54,000 54,926 180 CompliedGrade 5 54,000 54,926 180 CompliedGrade 6 54,000 54,926 180 CompliedGrade 7 54,000 62,519 180 CompliedGrade 8 54,000 62,519 180 Complied

Seeaccompanyingnotetosupplementaryinformation. 80
FULLERTONSCHOOLDISTRICTScheduleofFinancialTrendsandAnalysisFortheFiscalYearEndedJune30,2019
(Budget)General Fund 2020 2 2019 3 2018 2017
Revenues and other financing sources 137,569,128$ 155,188,362$ 139,864,795$ 138,530,885$
Expenditures 140,510,045 152,411,964 143,285,522 137,604,756
Total outgo 140,510,045 152,411,964 143,285,522 137,604,756
Change in fund balance (deficit) (2,940,917) 2,776,398 (3,420,727) 926,129
Ending fund balance 35,054,134$ 37,995,051$ 35,218,653$ 38,639,380$
Available reserves 1 25,806,824$ 27,395,480$ 26,050,813$ 24,915,876$
Available reserves as a percentage of total outgo 18.4% 18.0% 18.2% 18.1%
Total long-term debt 227,731,732$ 232,215,494$ 225,607,725$ 206,707,485$
Average daily attendance at P-2 12,465 12,665 12,924 13,038
The General Fund balance has decreased by $0.6 million over the past two years. The fiscal year 2019-20 adoptedbudget projects a decrease of $2.9 million. For a district of this size, the state recommends available reserves of at least 3% of total general fund expenditures, transfers out, and other uses (total outgo).
The District has incurred operating surpluses in two of the past three years, but anticipates an operating deficitfor the 2019-20 fiscal year. The total long-term debt has increased by approximately $25.5 million over the past two years because of increases to the net pension and OPEB liabilities under GASB Statements 68 and 75.
Average daily attendance has decreased by 373 over the past two years. The District anticipates a decrease in ADAof 200 for the 2019-20 fiscal year.
1 Available reserves consist of all unassigned fund balances in the General Fund.
2 Budget as of September, 2019.
3 The actual amounts reported in this schedule are for the General Fund only, and do not agree with the amounts reported on the Statement of Revenues, Expenditures, and Changes in Fund Balances because the amounts on that schedule include the financial activity of the Deferred Maintenance Fund in accordance with the fund type definitions promulgated by GASB Statement No. 54.

Seeaccompanyingnotetosupplementaryinformation. 81
FULLERTONSCHOOLDISTRICTReconciliationofAnnualFinancialandBudgetReportwithAuditedFinancialStatementsFortheFiscalYearEndedJune30,2019
TherewerenodifferencesbetweentheAnnualFinancialandBudgetReportandtheAuditedFinancialStatementsinanyfunds.

Seeaccompanyingnotetosupplementaryinformation. 82
FULLERTONSCHOOLDISTRICTScheduleofExpendituresofFederalAwardsFortheFiscalYearEndedJune30,2019
Federal Pass-ThroughFederal Grantor/Pass-Through CFDA Entity Identifying Cluster FederalGrantor/Program or Cluster Title Number Number Expenditures ExpendituresFederal Programs:
U.S. Department of Agriculture:Passed through California Dept. of Education (CDE):
Child Nutrition Cluster:School Breakfast Program - Especially Needy 10.553 13526 421,824$ School Breakfast Program - Basic 10.553 13390 577 National School Lunch Program 10.555 13523 2,999,496 Summer Food Service Program 10.559 13004 18,304 USDA Donated Foods 10.555 N/A 393,694
Total Child Nutrition Cluster 3,833,895$ Child and Adult Care Food Program 10.558 13394 569,191 Cash in Lieu of Commodities 10.558 13389 40,411
Total Child and Adult Care Food Program 609,602 Fresh fruit and vegetable program 10.582 14968 10,446
Total U.S. Department of Agriculture 4,453,943
U.S. Department of Education:Passed through California Dept. of Education (CDE):
Title I, Part A, Basic Grants Low-Income and Neglected 84.010 14329 2,428,727 Title II, Part A, Supporting Effective Instruction 84.367 14341 362,528 English Language Acquisition Grants Cluster:
Title III, Limited English Proficiency 84.365 14346 373,193 Title III, Immigrant Education Program 84.365 15146 30,095
Subtotal English Language Acquisition Grants Cluster 403,288 Student Support and Academic Enrichment Program:
Title IV Part A, Stud. Support and Ac. Enrich. (formula) 84.424 15396 131,367 Title IV Part A, Stud. Support and Ac. Enrich. (Competitive) 84.424 15391 373,647
Total Student Support and Academic Enrichment Grants 505,014 Individuals with Disabilities Education Act (IDEA):
Special Education Cluster:Passed through North Orange County SELPA:
Local Assistance Entitlement 84.027 13379 2,207,305 Preschool Grants, Part B, Sec 619 84.173 13430 68,032 Preschool Local Entitlement, Part B, Sec 611 84.027A 13682 237,762
Total Special Education Cluster: 2,513,099
Total U.S. Department of Education 6,212,656
U.S. Department of Health & Human Services:Passed through California Dept. of Education:
Medicaid Cluster:Medi-Cal Billing Option 93.778 10013 669,163 Medi-Cal Administrative Activities (MAA) 93.778 10060 795,181
Total Medicaid Cluster: 1,464,344
Total U.S. Department of Health & Human Services 1,464,344
Total Expenditures of Federal Awards 12,130,943$
OftheFederalexpenditurespresentedintheschedule,theDistrictprovidednoFederalawardstosubrecipients.

83
FULLERTONSCHOOLDISTRICTNotetotheSupplementaryInformationJune30,2019 NOTE1–PURPOSEOFSCHEDULES ScheduleofAverageDailyAttendance(ADA)Average daily attendance (ADA) is a measurement of the number of pupils attending classes of the District. The purpose of attendance accounting from a fiscal standpoint is to provide the basis on which apportionments of State funds are made to school districts. This schedule provides information regarding the attendance of students at various grade levels and in different programs. ScheduleofInstructionalTimeThe District has participated in the Incentives for Longer Instructional Day and Longer Instructional Year. The District has met its LCFF target funding. This schedule presents information on the amount of instructional time offered by the District and whether the District complied with Article 8 (commencing with Section 46200) of Chapter 2 Part 26 of the Education Code. ScheduleofFinancialTrendsandAnalysisThis schedule discloses the District’s financial trends by displaying past years’ data along with current year budget information. These financial trend disclosures are used to evaluate the District’s ability to continue as a going concern for a reasonable period of time. ReconciliationofAnnualFinancialandBudgetReportwithAuditedFinancialStatementsThis schedule provides the information necessary to reconcile the fund balance of all funds reported on the Unaudited Actual financial report to the audited financial statements. ScheduleofExpendituresofFederalAwardsThe schedule of expenditures of Federal awards includes the Federal grant activity of the District and is presented on the modified accrual basis of accounting. The information in this schedule is presented in accordance with the requirements of the Title 2 U.S. Code of Federal Regulations (CFR) Part 200, UniformAdministrative Requirements, Cost Principles, and Audit Requirements for Federal Awards. Therefore, some amounts presented in this schedule may differ from amounts presented in, or used in the preparation of the financial statements. The District did not elect to use the ten percent de minimis indirect cost rate. The following schedule provides a reconciliation between revenues reported on the Statement of Revenues, Expenditures, and Changes in Fund Balances and the related expenditures reported on the Schedule of Expenditures of Federal Awards. The reconciling amounts represent Federal funds that have been recorded as revenues that have not been expended by June 30, 2019.
CFDA Number AmountTotal Federal Revenues from the Statement of Revenues, Expenditures,
and Changes in Fund Balances 11,870,455$ Differences between Federal Revenues and Expenditures:
Medi-Cal Billing Option 93.778 260,488
Total Schedule of Expenditures of Federal Awards 12,130,943$

(Thispageintentionallyleftblank)

OtherIndependentAuditors’Reports

(Thispageintentionallyleftblank)

84
INDEPENDENTAUDITORS’REPORTONINTERNALCONTROLOVERFINANCIALREPORTINGANDONCOMPLIANCEANDOTHERMATTERSBASEDONANAUDITOFFINANCIALSTATEMENTSPERFORMEDINACCORDANCE
WITHGOVERNMENTAUDITINGSTANDARDS Board of Trustees Fullerton School District Fullerton, California
We have audited, in accordance with the auditing standards generally accepted in the United States of America and the standards applicable to financial audits contained in GovernmentAuditingStandards issued by the Comptroller General of the United States, the financial statements of the governmental activities, each major fund, and the aggregate remaining fund information of Fullerton School District as of and for the year ended June 30, 2019, and the related notes to the financial statements, which collectively comprise Fullerton School District’s basic financial statements, and have issued our report thereon dated November 19, 2019. InternalControlOverFinancialReportingIn planning and performing our audit of the financial statements, we considered Fullerton School District's internal control over financial reporting (internal control) to determine the audit procedures that are appropriate in the circumstances for the purpose of expressing our opinions on the financial statements, but not for the purpose of expressing an opinion on the effectiveness of the Fullerton School District's internal control. Accordingly, we do not express an opinion on the effectiveness of the Fullerton School District's internal control. A deficiencyininternalcontrol exists when the design or operation of a control does not allow management or employees, in the normal course of performing their assigned functions, to prevent, or detect and correct misstatements on a timely basis. A materialweakness is a deficiency, or a combination of deficiencies, in internal control such that there is a reasonable possibility that a material misstatement of the District's financial statements will not be prevented, or detected and corrected on a timely basis. A significantdeficiency is a deficiency, or a combination of deficiencies, in internal control that is less severe than a material weakness, yet important enough to merit attention by those charged with governance. Our consideration of internal control was for the limited purpose described in the first paragraph of this section and was not designed to identify all deficiencies in internal control that might be material weaknesses or significant deficiencies. Given these limitations, during our audit we did not identify any deficiencies in internal control that we consider to be material weaknesses. However, material weaknesses may exist that have not been identified.

85
ComplianceandOtherMattersAs part of obtaining reasonable assurance about whether Fullerton School District's financial statements are free of material misstatement, we performed tests of its compliance with certain provisions of laws, regulations, contracts, and grant agreements, noncompliance with which could have a direct and material effect on the determination of financial statement amounts. However, providing an opinion on compliance with those provisions was not an objective of our audit, and accordingly, we do not express such an opinion. The results of our tests disclosed no instances of noncompliance or other matters that are required to be reported under GovernmentAuditingStandards. PurposeofthisReportThe purpose of this report is solely to describe the scope of our testing of internal control and compliance and the results of that testing, and not to provide an opinion on the effectiveness of the District's internal control or on compliance. This report is an integral part of an audit performed in accordance with GovernmentAuditing Standards in considering the District's internal control and compliance. Accordingly, this communication is not suitable for any other purpose.
Murrieta, California November 19, 2019

86
INDEPENDENTAUDITORS'REPORTONCOMPLIANCEFOREACHMAJORFEDERALPROGRAMANDREPORTONINTERNALCONTROL
OVERCOMPLIANCEREQUIREDBYTHEUNIFORMGUIDANCE
Board of Trustees Fullerton School District Fullerton, California ReportonComplianceforEachMajorFederalProgramWe have audited Fullerton School District's compliance with the types of compliance requirements described in the OMB ComplianceSupplementthat could have a direct and material effect on each of Fullerton School District's major federal programs for the year ended June 30, 2019. Fullerton School District's major federal programs are identified in the summary of auditors' results section of the accompanying schedule of findings and questioned costs. Management'sResponsibilityManagement is responsible for compliance with federal statutes, regulations, and the terms and conditions of its federal awards applicable to its federal programs. Auditors'ResponsibilityOur responsibility is to express an opinion on compliance for each of Fullerton School District's major federal programs based on our audit of the types of compliance requirements referred to above. We conducted our audit of compliance in accordance with auditing standards generally accepted in the United States of America; the standards applicable to financial audits contained in Government Auditing Standards, issued by the Comptroller General of the United States; and the audit requirements of Title 2 U.S. Code of FederalRegulations Part 200, UniformAdministrativeRequirements,CostPrinciples,andAuditRequirementsforFederalAwards (Uniform Guidance). Those standards and the Uniform Guidance require that we plan and perform the audit to obtain reasonable assurance about whether noncompliance with the types of compliance requirements referred to above that could have a direct and material effect on a major federal program occurred. An audit includes examining, on a test basis, evidence about Fullerton School District's compliance with those requirements and performing such other procedures as we considered necessary in the circumstances. We believe that our audit provides a reasonable basis for our opinion on compliance for each major federal program. However, our audit does not provide a legal determination of Fullerton School District's compliance. OpiniononEachMajorFederalProgramIn our opinion, Fullerton School District complied, in all material respects, with the types of compliance requirements referred to above that could have a direct and material effect on each of its major federal programs for the year ended June 30, 2019.

87
ReportonInternalControlOverComplianceManagement of Fullerton School District is responsible for establishing and maintaining effective internal control over compliance with the types of compliance requirements referred to above. In planning and performing our audit of compliance, we considered Fullerton School District's internal control over compliance with the types of requirements that could have a direct and material effect on each major federal program to determine the auditing procedures that are appropriate in the circumstances for the purpose of expressing an opinion on compliance for each major federal program and to test and report on internal control over compliance in accordance with the Uniform Guidance, but not for the purpose of expressing an opinion on the effectiveness of internal control over compliance. Accordingly, we do not express an opinion on the effectiveness of the District's internal control over compliance. A deficiency in internal control over compliance exists when the design or operation of a control over compliance does not allow management or employees, in the normal course of performing their assigned functions, to prevent, or detect and correct, noncompliance with a type of compliance requirement of a federal program on a timely basis. A materialweaknessininternalcontrolovercompliance is a deficiency, or a combination of deficiencies, in internal control over compliance, such that there is a reasonable possibility that material noncompliance with a type of compliance requirement of a federal program will not be prevented, or detected and corrected, on a timely basis. A significant deficiency in internal control overcomplianceis a deficiency, or a combination of deficiencies, in internal control over compliance with a type of compliance requirement of a federal program that is less severe than a material weakness in internal control over compliance, yet important enough to merit attention by those charged with governance. Our consideration of internal control over compliance was for the limited purpose described in the first paragraph of this section and was not designed to identify all deficiencies in internal control over compliance that might be material weaknesses or significant deficiencies. We did not identify any deficiencies in internal control over compliance that we consider to be material weaknesses. However, material weaknesses may exist that have not been identified. The purpose of this report on internal control over compliance is solely to describe the scope of our testing of internal control over compliance and the results of that testing based on the requirements of the Uniform Guidance. Accordingly, this report is not suitable for any other purpose.
Murrieta, California November 19, 2019

88
INDEPENDENTAUDITORS'REPORTONSTATECOMPLIANCE
Board of Trustees Fullerton School District Fullerton, California ReportonStateComplianceWe have audited Fullerton School District's compliance with the types of compliance requirements described in the 2018‐19GuideforAnnualAuditsofK‐12LocalEducationAgenciesandStateComplianceReporting that could have a direct and material effect on each of the Fullerton School District's state government programs as noted on the following page for the fiscal year ended June 30, 2019. Management'sResponsibilityManagement is responsible for compliance with state laws, regulations, and the terms and conditions of its State programs. Auditors'ResponsibilityOur responsibility is to express an opinion on compliance for each of Fullerton School District's state programs based on our audit of the types of compliance requirements referred to on the following page. We conducted our audit of compliance in accordance with auditing standards generally accepted in the United States of America; the standards applicable to financial audits contained in GovernmentAuditingStandards, issued by the Comptroller General of the United States; and the 2018‐19GuideforAnnualAuditsofK‐12LocalEducationAgenciesandStateComplianceReporting. Those standards require that we plan and perform the audit to obtain reasonable assurance about whether noncompliance with the types of compliance requirements referred to on the following page that could have a direct and material effect on a state program occurred. An audit includes examining, on a test basis, evidence about Fullerton School District’s compliance with those requirements and performing such other procedures as we considered necessary in the circumstances. We believe that our audit provides a reasonable basis for our opinion on compliance for each state program. However, our audit does not provide a legal determination of Fullerton School District’s compliance. In connection with the audit referred to above, we selected and tested transactions and records to determine the District’s compliance with the State laws and regulations applicable to the following items:
Description
Procedures Performed
Local Education Agencies Other Than Charter Schools: Attendance Yes Teacher Certification and Misassignments Yes Kindergarten Continuance Yes Independent Study No (see below) Continuation Education Not Applicable Instructional Time Yes Instructional Materials Yes Ratio of Administrative Employees to Teachers Yes

89
Description
Procedures Performed
Classroom Teacher Salaries Yes Early Retirement Incentive Not Applicable Gann Limit Calculation Yes School Accountability Report Card Yes Juvenile Court Schools Not Applicable Middle or Early College High Schools Not Applicable K-3 Grade Span Adjustment Yes Transportation Maintenance of Effort Yes Apprenticeship: Related and Supplemental Instruction Not Applicable Comprehensive School Safety Plan Yes District of Choice Not Applicable
School Districts, County Offices of Education, and Charter Schools: California Clean Energy Jobs Act Yes After/Before School Education and Safety Program Yes Proper Expenditure of Education Protection Account Funds Yes Unduplicated Local Control Funding Formula Pupil Counts Yes Local Control and Accountability Plan Yes Independent Study - Course Based Not Applicable
Charter Schools: Attendance Not Applicable Mode of Instruction Not Applicable Nonclassroom-Based Instruction/Independent Study Not Applicable Determination of Funding for Nonclassroom-Based Instruction Not Applicable Annual Instructional Minutes – Classroom Based Not Applicable Charter School Facility Grant Program Not Applicable
We did not perform testing for independent study because the ADA was under the level that requires testing. UnmodifiedOpiniononCompliancewithStateProgramsIn our opinion, Fullerton School District complied, in all material respects, with the types of compliance requirements referred to above for the year ended June 30, 2019.
Murrieta, California November 19, 2019

FindingsandQuestionedCosts

(Thispageintentionallyleftblank)

90
FULLERTONSCHOOLDISTRICTScheduleofAuditFindingsandQuestionedCostsFortheFiscalYearEndedJune30,2019 SECTIONI‐SUMMARYOFAUDITORS'RESULTS
FinancialStatements
Type of auditors' report issued UnmodifiedInternal control over financial reporting:
Material weakness(es) identified? NoSignificant deficiency(s) identified not considered to be material weaknesses? None reported
Noncompliance material to financial statements noted? No
FederalAwards
Internal control over major programs:Material weakness(es) identified? NoSignificant deficiency(s) identified not considered to be material weaknesses? None reported
Type of auditors' report issued on compliance formajor programs: Unmodified
Any audit findings disclosed that are required to be reported in accordance with the Uniform Guidance, Section 200.516 NoIdentification of major programs:
CFDA Numbers Name of Federal Program or Cluster
84.027 and 84.173 IDEA93.778 Medical Assistance Program (Medicaid Cluster)
Dollar threshold used to distinguish between Type A andType B programs: 750,000$
Auditee qualified as low-risk auditee? Yes
StateAwards
Type of auditors' report issued on compliance forstate programs: Unmodified

91
FULLERTONSCHOOLDISTRICTScheduleofAuditFindingsandQuestionedCostsFortheFiscalYearEndedJune30,2019 SECTIONII‐FINANCIALSTATEMENTFINDINGS This section identifies the significant deficiencies, material weaknesses, and instances of noncompliance related to the financial statements that are required to be reported in accordance with GovernmentAuditingStandards.Pursuant to Assembly Bill (AB) 3627, all audit findings must be identified as one or more of the following categories:
Five Digit Code AB 3627 Finding Types 10000 Attendance 20000 Inventory of Equipment 30000 Internal Control 40000 State Compliance 42000 Charter School Facilities Programs 43000 Apprenticeship: Related and Supplemental Instruction 50000 Federal Compliance 60000 Miscellaneous 61000 Classroom Teacher Salaries 62000 Local Control Accountability Plan 70000 Instructional Materials 71000 Teacher Misassignments 72000 School Accountability Report Card
Therewerenofinancialstatementfindingsin2018‐19.
92
FULLERTONSCHOOLDISTRICTScheduleofAuditFindingsandQuestionedCostsFortheFiscalYearEndedJune30,2019 SECTIONIII‐FEDERALAWARDFINDINGSANDQUESTIONEDCOSTSThis section identifies the audit findings required to be reported by the Uniform Guidance, Section 200.516 (e.g., significant deficiencies, material weaknesses, and instances of noncompliance, including questioned costs). Therewerenofederalawardfindingsorquestionedcostsin2018‐19.

93
FULLERTONSCHOOLDISTRICTScheduleofAuditFindingsandQuestionedCostsFortheFiscalYearEndedJune30,2019 SECTIONIV‐STATEAWARDFINDINGSANDQUESTIONEDCOSTS This section identifies the audit findings pertaining to noncompliance with state program rules and regulations. Therewerenostateawardfindingsorquestionedcostsin2018‐19.

94
FULLERTONSCHOOLDISTRICTSummaryScheduleofPriorAuditFindingsFortheFiscalYearEndedJune30,2019
Original
FindingNo.
Finding
Code
Recommendation
CurrentStatus Finding2018‐001:CALPADSUnduplicatedPupilCount
Supplemental and concentration grant amounts are calculated based on the percentage of "unduplicated pupils" enrolled in the LEA on Census Day (first Wednesday in October). The percentage equals: Unduplicated count of pupils who (1) are English
learners, (2) meet income or categorical eligibility requirements for free or reduced-price meals under the National School Lunch Program, or (3) are foster youth. "Unduplicated count" means that each pupil is counted only once even if the pupil meets more than one of these criteria (EC sections 2574(b)(2) and 42238.02(b)(1)).
Divided by total enrollment in the LEA (ECsections
2574(b)(1) and 42238.02(b)(5)). All pupil counts are based on Fall 1 certified enrollment reported in the CALPADS as of Census Day.
During submission of data to CALPADS, the District discovered it did not upload the complete listing of students that qualify as FRPM from the information system for a six-week period. This resulted in underreporting the UPC by 611 students.
40000 We recommend that the District implement a review procedure of the CALPADS information prior to the reports submission to the California Department of Education.
Implemented.