Embed Size (px)
Citation preview

February 2014 Teacher's Guide
Table of Contents
About the Guide 3Student Questions4Answers to Student Questions 6ChemMatters Puzzle: ChemCrostic 11Answers to the ChemMatters Puzzle 12National Science Education Standards (NSES) Correlations 13Next-Generation Science Standards (NGSS) Correlations14Common Core State Standards Connections 16Anticipation Guides 17
Ice, Cream… and Chemistry........................................................................................................18Going the Distance: Searching for Sustainable Shoes.................................................................19It’s Not Easy Being Green… Or Is It?...........................................................................................20An Explosion of Diamonds............................................................................................................21From Waste to Energy… Thanks to Methane...............................................................................22
Reading Strategies 23Ice, Cream… and Chemistry........................................................................................................24Going the Distance: Searching for Sustainable Shoes.................................................................25It’s Not Easy Being Green… Or Is It?...........................................................................................26An Explosion of Diamonds............................................................................................................27From Waste to Energy… Thanks to Methane...............................................................................28
Ice, Cream… and Chemistry 29Background Information (teacher information)..............................................................................29Connections to Chemistry Concepts (for correlation to course curriculum)..................................36Possible Student Misconceptions (to aid teacher in addressing misconceptions)........................37Anticipating Student Questions (answers to questions students might ask in class)....................37In-class Activities (lesson ideas, including labs & demonstrations)..............................................38Out-of-class Activities and Projects (student research, class projects).........................................40References (non-Web-based information sources)......................................................................41Web Sites for Additional Information (Web-based information sources).......................................42
Going the Distance: Searching for Sustainable Shoes 44Background Information (teacher information)..............................................................................44Connections to Chemistry Concepts (for correlation to course curriculum)..................................57Possible Student Misconceptions (to aid teacher in addressing misconceptions)........................57Anticipating Student Questions (answers to questions students might ask in class)....................58In-class Activities (lesson ideas, including labs & demonstrations)..............................................58Out-of-class Activities and Projects (student research, class projects).........................................59References (non-Web-based information sources)......................................................................60Web Sites for Additional Information (Web-based information sources).......................................61More Web Sites on Teacher Information and Lesson Plans (sites geared specifically to teachers)63
It’s Not Easy Being Green… Or Is It? 64Background Information (teacher information)..............................................................................64

Connections to Chemistry Concepts (for correlation to course curriculum).................................76Possible Student Misconceptions (to aid teacher in addressing misconceptions).......................77Anticipating Student Questions (answers to questions students might ask in class)...................77In-class Activities (lesson ideas, including labs & demonstrations).............................................78Out-of-class Activities and Projects (student research, class projects).........................................79References (non-Web-based information sources)......................................................................80Web Sites for Additional Information (Web-based information sources).......................................82
An Explosion of Diamonds 89Background Information (teacher information)..............................................................................89Connections to Chemistry Concepts (for correlation to course curriculum)................................103Possible Student Misconceptions (to aid teacher in addressing misconceptions)......................103Anticipating Student Questions (answers to questions students might ask in class)..................104In-class Activities (lesson ideas, including labs & demonstrations)............................................104Out-of-class Activities and Projects (student research, class projects).......................................105References (non-Web-based information sources)....................................................................107Web Sites for Additional Information (Web-based information sources).....................................108
From Waste to Energy… Thanks to Methane110Background Information (teacher information)............................................................................110Connections to Chemistry Concepts (for correlation to course curriculum)................................118Possible Student Misconceptions (to aid teacher in addressing misconceptions)......................118Anticipating Student Questions (answers to questions students might ask in class)..................118In-class Activities (lesson ideas, including labs & demonstrations)............................................119Out-of-class Activities and Projects (student research, class projects).......................................120References (non-Web-based information sources)....................................................................121Web Sites for Additional Information (Web-based information sources).....................................122
2

About the Guide
Teacher’s Guide editors William Bleam, Donald McKinney, Ronald Tempest, and Erica K. Jacobsen created the Teacher’s Guide article material. E-mail: [email protected]
Susan Cooper prepared the national science education content, anticipation guides, and reading guides.
David Olney created the puzzle. E-mail: [email protected]
Patrice Pages, ChemMatters editor, coordinated production and prepared the Microsoft Word and PDF versions of the Teacher’s Guide. E-mail: [email protected]
Articles from past issues of ChemMatters can be accessed from a CD that is available from the American Chemical Society for $30. The CD contains all ChemMatters issues from February 1983 to April 2008.
The ChemMatters CD includes an Index that covers all issues from February 1983 to April 2008.
The ChemMatters CD can be purchased by calling 1-800-227-5558.
Purchase information can be found online at www.acs.org/chemmatters
3

Student Questions (from the articles)
Ice, Cream … and Chemistry
1. What is the function of air in ice cream?2. What is meant by the term “overrun”?3. What difference in melting rate is caused by the amount of air in ice cream?4. What is the relationship between the amount of air in ice cream and its density?5. What is an emulsion? Explain how ice cream can be considered an emulsion.6. Why is sugar added to the ice cream mix when the milk in ice cream already
contains the sugar, lactose?7. What percent of ice cream must be fat?8. What is the purpose of fat in ice cream?9. What steps must be taken to have the fat in ice cream mix with the other non-fat,
water-based ingredients?10. What are some other emulsifiers in ice cream beside the milk proteins, casein
and whey? 11. What purpose is served by adding stabilizers to the ice cream mix?
Going the Distance: Searching for Sustainable Shoes
1. What is the focus of the branch of chemistry known as “green chemistry”?2. The “green” shoes mentioned in the article are made of recycled materials. What benefit
does this provide over using new materials?3. Which chemicals has the PUMA company committed to phasing out of its products and
supply chain?4. Perfluorocarbons (PFCs) are used to make shoes and clothes waterproof. How does their
chemical structure allow for this use? 5. What is a drawback to using perfluorocarbons (PFCs) in manufacturing?6. Describe the alternative material used for the sole of the PUMA Re-Suede shoe.7. What are useful guidelines to consider when designing a “green” product or redesigning an
old product in an environmentally friendly way?8. Which principles of green chemistry do the PUMA Re-Suede shoes meet?
It’s Not Easy Being Green… Or Is It?
1. What is the name of the process we use to get a more complete view of the total impact a product has on the environment?
2. What does LCA investigate?3. Name two other factors, besides energy consumption in manufacturing, that might affect our
decision whether to use a ceramic mug or a paper or Styrofoam® cup.4. Why does a product’s impact on the environment decrease with repeated use?5. Does the author indicate the best choice for a grocery bag—cotton, reusable polyethylene or
disposable polyethylene? If so, which is it?6. Is the same true for choosing among glass or plastic bottles or aluminum cans?
4

7. Are environmental costs the only factors to consider when making life cycle analysis choices?
8. What is the goal of life cycle analysis?
An Explosion of Diamonds
1. How far below the surface of the Earth are diamonds formed?2. What are the conditions at which diamonds are formed naturally?3. What are allotropes?4. What are the allotropes of carbon?5. How are carbon atoms arranged in graphite?6. How are carbon atoms arranged in diamonds?7. What is the SI equivalent of a carat?8. What are the three ways of producing artificial diamonds, according to the article?
From Waste to Energy… Thanks to Methane
1. What additional ingredient is needed to convert a mixture of waste food and animal dung into methane gas?
2. What does anaerobic mean?3. What is the difference between methane and biogas?4. What are the three main chemical groups found in biological waste (food, sewage, dung)?5. What smaller molecules are produced by hydrolysis of the larger molecules of
carbohydrates, proteins and fats?6. Why is burning biogas better than burning fossil fuels?7. What are two advantages of using methane gas for cooking (indoors) in Nigeria?8. In India, what benefits have come from using public toilets connected to biogas generators?9. How has the modern Swedish city of Kristianstad reversed its dependence on purchasing
natural gas and oil from the Middle East and Norway in the last 20 years?10. For what purposes is methane used in Kristianstad that are different compared with Lagos,
Nigeria?
5

Answers to Student Questions (from the articles)
Ice, Cream… and Chemistry
1. What is the function of air in ice cream?By adding air to the ice cream mix, you increase the volume of the ice cream which, in turn, increases the time it takes for the flavor molecules to trigger the taste receptors in the mouth and tongue.
2. What is meant by the term “overrun”?The term “overrun” refers to the amount of air in ice cream. If the volume of ice cream without air is doubled by adding air, then the overrun is listed as 100%, the maximum allowable in commercial ice cream.
3. What difference in the melting rate is caused by the amount of air in ice cream?The more air in ice cream, the quicker it will melt. Higher quality ice creams contain less air than less expensive brands and therefore, melt more slowly.
4. What is the relationship between the amount of air in ice cream and its density?The amount of air in ice cream is inversely related to its density: the more air that is present, the lower the density.
5. What is an emulsion? Explain how ice cream can be considered an emulsion.An emulsion is “a combination of two liquids that don’t normally mix together. Instead, one of the liquids is dispersed throughout the other. In ice cream, liquid particles of fat—called fat globules—are spread throughout a mixture of water, sugar, and ice, along with air bubbles.”
6. Why is sugar added to the ice cream mix when the milk in ice cream already contains the sugar, lactose?Sugar is added because, by itself, lactose does not taste as sweet as glucose or sucrose, the two types of sugar added to the ice cream mix. Further, the cold temperature of ice cream makes the taste buds less sensitive to the sweet taste. So, more sugar (glucose or sucrose) is added.
7. What percent of ice cream must be fat?The percent of fat in ice cream must be a minimum of 10%. Premium ice cream may have up to 20%.
8. What is the purpose of fat in ice cream?Fat in ice cream adds flavor and provides a velvety rich texture in the mouth. Reducing the fat content reduces the creamy texture sensation.
9. What steps must be taken to have the fat in ice cream mix with the other non-fat, water-based ingredients?To ensure mixing of fat and non-fat ingredients, emulsifiers are added if they are not already in the ice cream in the form of milk proteins called casein and whey. These emulsifiers connect the fat molecules to the water-based ingredients which normally don’t mix.
10. What are some other emulsifiers in ice cream beside the milk proteins, casein and whey?Some other emulsifiers added to ice cream include lecithin, mono- and diglycerides, and polysorbate 80.
6

11. What purpose is served by adding stabilizers to the ice cream mix?The stabilizers added to ice cream prevent the formation of large ice crystals in the ice cream; they also slow the rate of melting.
Going the Distance: Searching for Sustainable Shoes
1. What is the focus of the branch of chemistry known as “green chemistry”?The branch of chemistry known as “green chemistry” focuses on reducing or eliminating substances that are harmful to human health and the environment.
2. The “green” shoes mentioned in the article are made of recycled materials. What benefit does this provide over using new materials?Using recycled materials for the “green shoes” can provide two benefits:a. It saves energy consumption.b. It reduces carbon emissions.
3. Which chemicals has the PUMA company committed to phasing out of its products and supply chain?PUMA has committed to phasing out long-chain fluorinated chemicals, or perfluorocarbons (PFCs).
4. Perfluorocarbons (PFCs) are used to make shoes and clothes waterproof. How does their chemical structure allow for this use?Perfluorocarbons (PFCs) have a chemical structure that is nonpolar. Because nonpolar molecules do not bind with polar molecules, such as water, PFCs are insoluble in water, which can make materials waterproof.
5. What is a drawback to using perfluorocarbons (PFCs) in manufacturing?A drawback to using perfluorocarbons (PFCs) in manufacturing is that they break down to form substances such as perfluorooctanesulfonic acid, a toxic chemical that remains in the environment and concentrates as it moves up the food chain.
6. Describe the alternative material used for the sole of the PUMA Re-Suede shoe.The sole of the PUMA Re-Suede shoe uses an alternative material called Double-R Rice Rubber, a combination of natural rubber and rice husk waste.
7. What are useful guidelines to consider when designing a “green” product or redesigning an old product in an environmentally friendly way?Useful guidelines to consider when designing a “green” product or redesigning an old product in an environmentally friendly way are the twelve principles of green chemistry.
8. Which principles of green chemistry do the PUMA Re-Suede shoes meet?The PUMA Re-Suede shoes meet six of the green chemistry principles:1) Prevent waste; 3) Less hazardous chemical synthesis; 4) Design safe chemicals; 6) Design for energy efficiency; 7) Use renewable feedstock; and 10) Design for degradation.
It’s Not Easy Being Green… Or Is It?
1. What is the name of the process we use to get a more complete view of the total impact a product has on the environment?The process used to obtain a more complete picture of the impact a product has on the environment is called Life Cycle Analysis (LCA).
2. What does LCA investigate?
7

LCA investigates every part of the production, use and final disposition of a product, including collection and processing of raw materials, energy used in production and use of the product, and transportation and disposal or recycling costs.
3. Name two other factors, besides energy consumption in manufacturing, that might affect our decision whether to use a ceramic mug or a paper or Styrofoam® cup.The author mentions landfill burden and energy required to recycle paper as two other factors we need to consider when making a decision to use ceramic, paper or Styrofoam®.
4. Why does a product’s impact on the environment decrease with repeated use?A product that is reused over and over may still require cleaning (like a ceramic mug or cloth grocery bag), but it only needs to be manufactured once, so the impact on the environment of manufacturing the item is averaged out over many uses and is thus reduced.
5. Does the author indicate the best choice for a grocery bag—cotton, reusable polyethylene or disposable polyethylene? If so, which is it?While the author pretty much dismisses the cotton grocery bag as being the worst, which of the remaining bags is the best choice depends upon the number of times they are reused—and he doesn’t give us enough information to make that decision.
6. Is the same true for choosing among glass or plastic bottles or aluminum cans?This time the author makes it pretty clear that the factors considered in choosing among glass, plastic or aluminum vastly favors the use of plastic bottles. (However, one might also consider landfills vs. recycling to add to the factors and this might change the mix considerably, especially since aluminum cans have a very high recycle rate, as does glass.)
7. Are environmental costs the only factors to consider when making life cycle analysis choices?Besides environmental costs, society also has to consider more subjective factors, such as those noted in the article, plastic bag litter along roadsides, cans and bottles left on the beach, and sea animals killed by plastic.
8. What is the goal of life cycle analysis?The goal of life cycle analysis is to provide sufficient information for us to make informed decisions for a sustainable future.
An Explosion of Diamonds
1. How far below the surface of the Earth are diamonds formed?The article indicated that diamond formation can take place as deep as 90 miles below the surface (150 km) but the range is 90-100 miles (150-160 km).This is important to note in order to counter the misconception that diamonds are made from coal, which usually forms about 2 miles below the Earth.
2. What are the conditions at which diamonds are formed naturally?The article indicates a temperature of 2000 oF (1050 oC) and “enormous” pressure. The pressure can be as much as 725,000 pounds per square inch (49 atm or 5000 kPa).
3. What are allotropes?The article says that isotopes are “different structural modifications of an element in which the atoms of the element are bonded together in a different manner.”
4. What are the allotropes of carbon?Diamond and graphite are mentioned in the article. There are other forms (see “More on graphite and other allotropes”, in “Background Information” section, below).
5. How are carbon atoms arranged in graphite?Since carbon has four valence electrons it can form four covalent bonds. However, in graphite each carbon atom forms only three covalent bonds. So each carbon atom is bonded to three other carbon atoms in a network of these bonds, forming a sheet-like
8

structure. These sheets are held together by weak van der Waals forces. The sheets are free to slide over each other giving graphite its lubricating properties. The fourth valence electron in each carbon is free to move throughout the graphite sheet, making graphite a good electrical conductor.
6. How are carbon atoms arranged in diamonds?Each carbon atom in a diamond is bonded to four adjacent carbon atoms by very strong covalent bonds, producing a tetrahedral shape and making the diamond a very strong structure.
7. What is the SI equivalent of a carat?A carat is the unit of weight for gemstones. One carat is equal to 200 milligrams.
8. What are the three ways of producing synthetic diamonds, according to the article?The three ways to produce synthetic diamonds are as follows:a. The oldest method “uses large circular presses to provide the necessary high pressure
and high temperature. A carbon material is fed into the presses along with a catalyst. The press applies pressure and temperature to mimic the conditions that form natural diamonds.” (This is known as the high pressure-high temperature (HPHT) method.)
b. In a second method, the chemical vapor deposition (CVD) method, “…methane gas is mixed with hydrogen gas at a temperature of 700 °C to 1,000 °C. The mixture is put into a partial vacuum”, where the hydrogen and methane react to form a highly reactive carbon-hydrogen compound. This compound (in the vapor state) then attaches itself to (deposits on) diamond seed crystals, and in the process the carbon-hydrogen compound loses its hydrogen, leaving diamond crystals.
c. The third method involves inserting top secret diamond-making material into a steel tube and setting off explosives around the tube. The explosion creates the temperature and pressure needed to form diamonds.
From Waste to Energy… Thanks to Methane
1. What additional ingredient is needed to convert the mixture of waste food and animal dung into methane gas?You need to add bacteria such as those found in the soil.
2. What does anaerobic mean?Anaerobic means “without oxygen”.
3. What is the difference between methane and biogas?Biogas is a mixture of gases that includes methane, along with carbon dioxide, hydrogen sulfide and nitrogen.
4. What are the three main chemical groups found in biological waste (i.e., food, sewage, dung)?The main chemical groups found in biological waste are proteins, carbohydrates, and fats.
5. What smaller molecules are produced by hydrolysis of the larger molecules of carbohydrates, proteins and fats?The smaller molecules that are produced include amino acids, simple sugars, and fatty acids.
6. What are two advantage of using methane gas for cooking (indoors) in Nigeria?The advantages of using methane for indoor cooking are thata. methane replaces wood which is often in short supply, andb. methane reduces indoor air pollution, a major problem when burning wood.
7. Why is burning biogas better than burning fossil fuels?It is better to burn biogas than fossil fuels because the burning of biogas is carbon-neutral, meaning that burning it does not add to the amount of carbon dioxide already in the
9

atmosphere, hence not adding to the amount of greenhouse gases and thus not having a negative effect on global warming.
8. In India, what benefits have come from using public toilets connected to biogas generators?When available, a public toilet prevents people from relieving themselves in public which spreads disease-causing germs. Perhaps more importantly, it also allows for generating electricity.
9. How has the modern Swedish city of Kristianstad reversed its dependence on purchasing natural gas and oil from the Middle East and Norway in the last 20 years?The city generates biogas to power its municipal cars, buses and trucks. It is also used to generate electricity. The city also uses the fuel to heat its municipal buildings.
10. For what purposes is methane used in Kristianstad that are different compared with Lagos, Nigeria?Lagos developed a sanitation plan to prevent primarily human waste from getting into the local drinking water. The waste was directed into household methane generators reducing a health hazard while generating usable methane gas. The city of Kristianstad generates methane gas from a variety of sources for the purpose of fueling vehicles and heating buildings to minimize their dependence on outside sources of fossil fuels, rather than protecting drinking water.Besides chemical processes, mechanical processes are also involved in cleaning. Clothes must be agitated to expose the stains to surfactants and water. Heat is also almost essential to cleaning. Besides its effect of speeding up chemical reactions in the washing machine, it also increases the solubility of both detergent in the water and stains from clothing.
10

ChemMatters Puzzle: ChemCrosticIn a crostic puzzle, a short passage or perhaps a quote is revealed in a grid. Each cell gets an alphabetic letter, placed there by the clues below the grid. A black square denotes the end of a word. Note that some words carry over to the next line.
To solve the crostic, put as many of letters into the clue blanks as you can, then transfer them to the grid. For example the quote’s first letter will be found in the first blank of clue D. As you continue, you’ll soon be able to see words in the grid, and can begin to work backwards to complete more clues. The majority of the clues are from the world of Chemistry.
One more hint. The first letters in each clue are arranged alphabetically going down the page. Thus it’s unlikely that the answer to clue I is AMPS… but it might be WATT !
1D 2C 3G 4A 5F 6I 7E 8J 9F 10J 11G
12C
13F
14E
15B
16I 17H
18A
19J 20H
21H
22E
23F
24G
25J
26F
27D
28E
29A
30A
31F
32J 33B
34J 35C
36H
37G
38F
39A
40G
41I 42H
43B
44D
45A
46E
47H
48H
49G
50F
51A
52I 53B
54C
55A
56E
57E
58H
59F .
THE CLUESA. __ __ __ __ __ __ __ __ Salt and last, steel and sleet, are examples of ____ . 55 4 39 51 29 45 30 18 B. __ __ __ __ Danish scientist, notably explaining atomic Hydrogen’s energy levels. 43 15 33 53C. __ __ __ __ __ Financial misconduct, especially by government office holders. 54 12 35 2 34D. __ __ __ H2O (s) 1 27 44E. __ __ __ __ __ __ __ Nationality of the man honored in clue I by a derived SI unit. 57 14 28 46 7 22 56F. __ __ __ __ __ - __ __ __ __ Wife and co-worker of Antoine Lavoisier. 59 5 23 31 13 26 50 9 38G. __ __ __ __ __ __ Buccaneer, robber at sea. 37 49 40 3 24 11H. __ __ __ __ __ __ __ __ The kind of charge an alpha particle possesses. 36 42 58 17 20 47 48 21 I. __ __ __ __ One Joule per coulomb; unit of electrical potential. 16 52 6 41
11

J. __ __ __ __ __ Often used (incorrectly!) as a verb to be synonymous with mass.
12

Answers to the ChemMatters PuzzleTHE QUOTE
“If an alien were to visit Earth, …a car might appear to be a living organism.”
Source: Rohrig, B. Is Your Car a Living Thing? ChemMatters, Feb 2013, pp 17–19.
THE CLUES
ANAGRAMBOHRGRAFTICEITALIANMARIE-ANNEPIRATEPOSITIVEVOLTWEIGH
A Note on the Origin of this Quote:
The February 2013 issue of ChemMatters contained a fascinating article by Brian Rohrig in which the (slightly edited) opening sentence is our puzzle quote. The article shows how a car converts the burning of a fuel into various energy forms (including motion), even as a human being converts food into energy that keeps us alive and moving. Analogies between the breakdown of food/ fuel molecules, digestive functions/enzymes and catalytic converters are made. A few ways by which cars are not living things are offered, as well. Also, teachers can get some ideas for classroom usage from the Teachers’s Guide for that issue.
—David Olney
13

National Science Education Standards (NSES) CorrelationsNational Science Education
Content Standard Addressed
As a result of activities in grades 9-12, all students
should develop understanding
Ice Cream
Sustainable Shoes
It’s Not Easy Being Green Diamonds
From Waste to Energy . . .
Thanks to Methane
Physical Science Standard A: about scientific inquiry.
Physical Science Standard B: of the structure and properties of matter.
Physical Science Standard B: of chemical reactions.
Earth Science Standard D: of geochemical cycles
Science and Technology Standard E: about science and technology.
Science in Personal and Social Perspectives Standard F: of personal and community health.
Science in Personal and Social Perspectives Standard F: of natural resources.
Science in Personal and Social Perspectives Standard F: of environmental quality.
Science in Personal and Social Perspectives Standard F: of natural and human-induced hazards.
Science in Personal and Social Perspectives Standard F: of science and technology in local, national, and global challenges.
History and Nature of Science Standard G: of science as a human endeavor.
History and Nature of Science Standard G: of the nature of scientific knowledge.
14

Next-Generation Science Standards (NGSS) Correlations
Article NGSS
Ice, Cream . . . and Chemistry
HS-ETS1-2.Design a solution to a complex real-world problem by breaking it down into smaller, more manageable problems that can be solved through engineering.
Crosscutting Concepts: Structure & Function
Science and Engineering Practices: Constructing explanations (for science and designing solutions (for engineering)
Nature of Science: Scientists often use hypotheses to develop and test theories and explanations.
Going the Distance: Searching for Sustainable Shoes
HS-ETS1-3.Evaluate a solution to a complex real-world problem based on prioritized criteria and trade-offs that account for a range of constraints, including cost, safety, reliability, and aesthetics as well as possible social, cultural, and environmental impacts.
Crosscutting Concepts: Energy and matter: Flows, cycles, and conservation Structure and Function Influence of Engineering, Technology, and Science on Society and the Natural
WorldScience and Engineering Practices:
Developing and Using Models Analyzing and Interpreting Data Engaging in Argument from Evidence
Nature of Science: Science and engineering are influenced by society, and society is influenced
by science and engineering.
It’s Not Easy Being Green—Or Is It?
HS-ETS1-3.Evaluate a solution to a complex real-world problem based on prioritized criteria and trade-offs that account for a range of constraints, including cost, safety, reliability, and aesthetics as well as possible social, cultural, and environmental impacts.
Crosscutting Concepts: Energy and matter: Flows, cycles, and conservation Structure and Function Influence of Engineering, Technology, and Science on Society and the Natural
WorldScience and Engineering Practices:
Analyzing and interpreting data Engaging in Argument from Evidence
Nature of Science: Science and technology may raise ethical issues for which science, by itself,
does not provide answers and solutions.
15
An Explosion of Diamonds
HS-PS2-6.Communicate scientific and technical information about why the molecular-level structure is important in the functioning of designed materials.
Crosscutting Concepts: Patterns Systems and System Models Structure and Function
Science and Engineering Practices: Asking questions and defining problems Analyzing and interpreting data
Nature of Science: Many decisions are not made using science alone, but rely on social and
cultural contexts to resolve issues.
From Waste to Energy . . . Thanks to Methane
HS-ETS1-1.Analyze a major global challenge to specify qualitative and quantitative criteria and constraints for solutions that account for societal needs and wants.
Crosscutting Concept: Systems and System Models Energy and matter: Flows, cycles, and conservation
Science and Engineering Practices: Developing and musing models
Nature of Science: Individuals and teams from many nations and cultures have contributed to
science and to advances in engineering.
16

Common Core State Standards Connections(for all the articles in this issue (February/March 2014)
RST.9-10.1 Cite specific textual evidence to support analysis of science and technical texts, attending to the precise details of explanations or descriptions.
RST 11-12.1 Cite specific textual evidence to support analysis of science and technical texts, attending to important distinctions the author makes and to any gaps or inconsistencies in the account.In addition, the teacher could assign writing to include the following Common Core State Standard:
WHST.9-10.2 Develop the topic with well-chosen, relevant, and sufficient facts, extended definitions, concrete details, quotations, or other information and examples appropriate to the audience’s knowledge of the topic.
WHST.11-12.2 Develop the topic thoroughly by selecting the most significant and relevant facts, extended definitions, concrete details, quotations, or other information and examples appropriate to the audience’s knowledge of the topic.
17

Anticipation GuidesAnticipation guides help engage students by activating prior knowledge and stimulating student interest before reading. If class time permits, discuss students’ responses to each statement before reading each article. As they read, students should look for evidence supporting or refuting their initial responses.
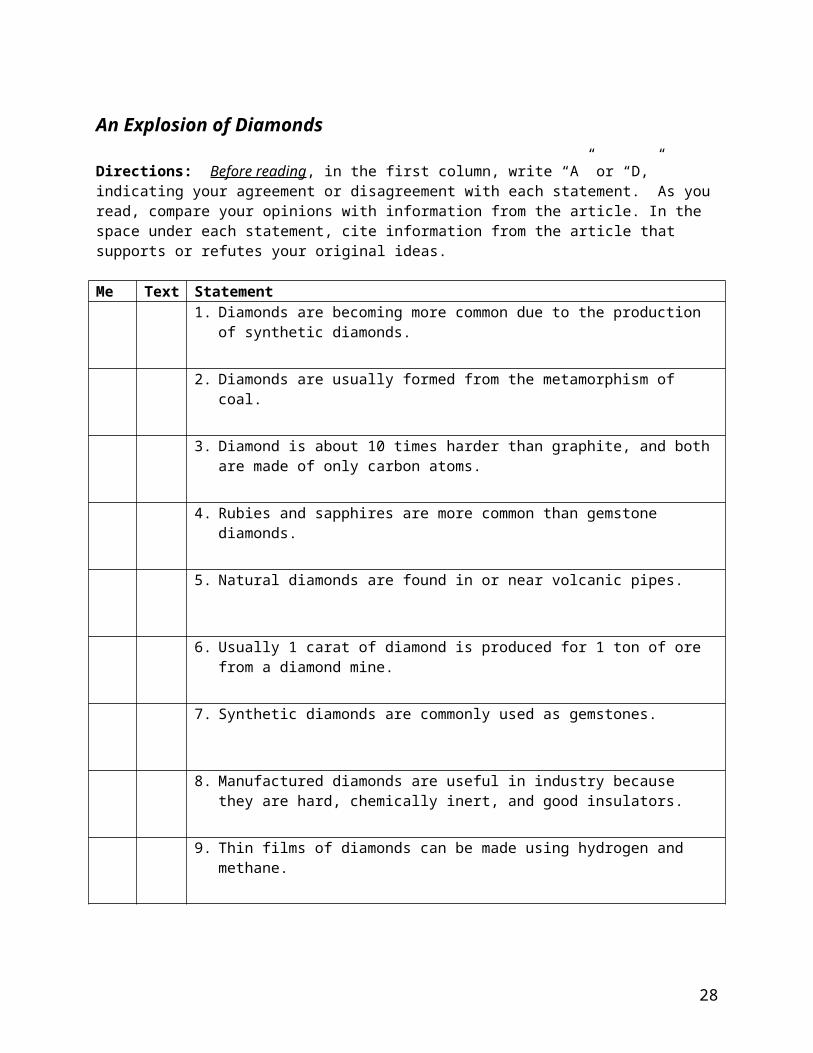
Directions for all Anticipation Guides: Before reading, in the first column, write “A” or “D,” indicating your agreement or disagreement with each statement. As you read, compare your opinions with information from the article. In the space under each statement, cite information from the article that supports or refutes your original ideas.
18

Ice, Cream… and Chemistry
Directions: Before reading, in the first column, write “A” or “D,” indicating your agreement or disagreement with each statement. As you read, compare your opinions with information from the article. In the space under each statement, cite information from the article that supports or refutes your original ideas.
Me Text Statement1. Residents of the United States eat about 30 liters of ice cream per person
annually.
2. More expensive ice cream brands have more air than less expensive brands.
3. All ice cream is less dense than water.
4. The temperature of food and drinks affects the amount of sweetness we taste.
5. The fat in ice cream must come from milk.
6. Ice cream contains at least two different kinds of emulsifiers.
7. Lecithin molecules have a definite chemical structure.
8. Ice cream freezes at 0C.
9. There is a physiological explanation for an ice cream headache (brain freeze).
10. The whiter the soft-serve ice cream, the better the quality.
19

Going the Distance: Searching for Sustainable Shoes
Directions: Before reading, in the first column, write “A” or “D,” indicating your agreement or disagreement with each statement. As you read, compare your opinions with information from the article. In the space under each statement, cite information from the article that supports or refutes your original ideas.
Me Text Statement1. “Green” shoes may be made from recycled materials.
2. Perfluorocarbons (PFCs) contain carbon, fluorine, and hydrogen atoms.
3. PFCs are waterproof because they are nonpolar.
4. PFCs break down into harmless chemicals when they are released into the environment.
5. Rice husk waste is incorporated into the soles of the shoes described in the article.
6. Green chemistry principles address energy issues as well as environmental issues.
7. Products designed using green chemistry principles should be created using large amounts of reagents.
20

It’s Not Easy Being Green… Or Is It?
Directions: Before reading, in the first column, write “A” or “D,” indicating your agreement or disagreement with each statement. As you read, compare your opinions with information from the article. In the space under each statement, cite information from the article that supports or refutes your original ideas.
Me Text Statement1. A life cycle analysis (LCA) helps us make decisions regarding sustainable
products.
2. Considering manufacturing and washing, a ceramic mug must be used 1000 times before it uses less energy per use than a disposable paper cup.
3. Conventionally grown cotton uses very few pesticides.
4. Reusable cotton bags are better for the environment than bags made of polyethylene or polypropylene.
5. Bags made of polypropylene must be used more than 11 times to have less impact on the environment than disposable plastic bags.
6. Disposable plastic bottles are better for the environment than glass or aluminum containers.
7. Decisions about which type of container to use include only energy use.
8. In the article, there were references to energy measurements in joules, kilocalories, and BTUs.
21

An Explosion of Diamonds
Directions: Before reading, in the first column, write “A” or “D,” indicating your agreement or disagreement with each statement. As you read, compare your opinions with information from the article. In the space under each statement, cite information from the article that supports or refutes your original ideas.
Me Text Statement1. Diamonds are becoming more common due to the production of synthetic
diamonds.
2. Diamonds are usually formed from the metamorphism of coal.
3. Diamond is about 10 times harder than graphite, and both are made of only carbon atoms.
4. Rubies and sapphires are more common than gemstone diamonds.
5. Natural diamonds are found in or near volcanic pipes.
6. Usually 1 carat of diamond is produced for 1 ton of ore from a diamond mine.
7. Synthetic diamonds are commonly used as gemstones.
8. Manufactured diamonds are useful in industry because they are hard, chemically inert, and good insulators.
9. Thin films of diamonds can be made using hydrogen and methane.
10. Gemstone diamonds can be made using explosives.
22

From Waste to Energy… Thanks to Methane
Directions: Before reading, in the first column, write “A” or “D,” indicating your agreement or disagreement with each statement. As you read, compare your opinions with information from the article. In the space under each statement, cite information from the article that supports or refutes your original ideas.
Me Text Statement1. Today, methane produced from food waste, human sewage, and animal
dung is being used for energy in homes and buildings.
2. Biogas contains mostly methane, carbon dioxide, and hydrogen.
3. Burning methane produces carbon dioxide and water.
4. Producing methane from food scraps is carbon-neutral.
5. Most disease-causing bacteria are anaerobic, meaning they do not require oxygen.
6. Methane has less density than carbon dioxide.
7. Wood smoke pollutes the air less than products produced from burning methane.
8. In India, families have their own toilet-biogas units which produce methane.
9. A city in Sweden uses biogas for municipal cars, buses, trucks, and to heat its buildings.
10. Currently, no landfills in the United States collect methane for energy.
23

Reading Strategies
These graphic organizers are provided to help students locate and analyze information from the articles. Student understanding will be enhanced when they explore and evaluate the information themselves, with input from the teacher if students are struggling. Encourage students to use their own words and avoid copying entire sentences from the articles. The use of bullets helps them do this. If you use these reading strategies to evaluate student performance, you may want to develop a grading rubric such as the one below.
Score Description Evidence
4 Excellent Complete; details provided; demonstrates deep understanding.
3 Good Complete; few details provided; demonstrates some understanding.
2 Fair Incomplete; few details provided; some misconceptions evident.
1 Poor Very incomplete; no details provided; many misconceptions evident.
0 Not acceptable
So incomplete that no judgment can be made about student understanding
Teaching Strategies:
1. Links to Common Core Standards for writing: a. Ask students to defend their position on sustainable choices, using information
from the articles. b. Ask students to revise one of the articles in this issue to explain the information
to a person who has not taken chemistry. Students should provide evidence from the article or other references to support their position.
2. Vocabulary that is reinforced in this issue:
Emulsion and emulsifiers Coalescence Green chemistry Joule Allotrope Hydrolysis Fermentation
3. To help students engage with the text, ask students what questions they still have about the articles. The articles about green chemistry (“Going the Distance: Searching for Sustainable Shoes” and “It’s Not Easy Being Green—Or Is It?”) may challenge students’ beliefs about sustainability.
24

Ice, Cream… and Chemistry
Directions: As you read the article, complete the graphic organizer below, comparing the ingredients in ice cream.
Ingredient What is its purpose?How does the amount affect the taste or appearance of ice cream?
Air
Sugar
Fat
Lecithin
Gelatin
25

Going the Distance: Searching for Sustainable Shoes
Directions: As you read the article, complete the graphic organizer below to describe what you learned about green chemistry and sustainable shoes.
3
Your friends are discussing what to look for when buying new shoes. Write three new things you learned about buying “green” shoes from reading this article that you would like to share with your friends.
1.
2.
3.
2
Share two things you learned about chemistry from the reading the article.
1.
2.
1
Did this article change your views about green chemistry? Explain in one sentence.
Con
tact
!
Describe a personal experience about green chemistry principles that connects to something you read in the article—something that your personal experience validates.
26

It’s Not Easy Being Green… Or Is It?
Directions: As you read, use the graphic organizer below to compare the energy required during the life cycle of each product, as well as other issues to consider when deciding which product to use. You may also refer to the information in “Open for Discussion: The Big Bag Battle” on page 5 of this issue of ChemMatters.
Product Energy Use Other Issues to consider
Cof
fee
Con
tain
ers
Paper Cup
Styrofoam Cup
Ceramic Mug
Gro
cery
Bag
s
Cotton reusable
Polyethylene or polypropylene reusable
Disposable plastic
Drin
k C
onta
iner
s
Plastic bottle
Glass bottle
Aluminum can
27
An Explosion of Diamonds
Directions: As you read the article, use your own words to complete the graphic organizer below comparing natural and synthetic diamonds. At the bottom, list properties they have in common.
Natural Diamonds Synthetic Diamonds
How they formed
1.
2.
3.
Chemical structure (draw and/or describe)
Uses
Similarities
28

From Waste to Energy… Thanks to Methane
Directions: As you read, use your own words to describe how biogas is being produced and used in different places around the world.
Source of waste Special equipment needed Uses for biogas
Nigeria
India
Sweden
Future
29

Ice, Cream… and Chemistry
Background Information (teacher information)
More on the character of ice cream
The popularity of ice cream results from a number of sensory characteristics detected by people when they savor the product. The first category of sensations produced when the ice cream gets into the mouth includes feelings of freezing, simple cooling, and a sensation described as “refreshing”. Another set of sensations has to do with the sweet taste as well as an aroma that is given off by ice cream when the product is consumed. For all these sensations produced, a sugar solution is the common denominator. The characteristics of the sugar-based syrup are manipulated by the addition of other materials to obtain desired taste, texture, consistency, and appearance. Ice cream is manufactured as regular, custard/French, reduced fat, light, low, and no-fat versions.
The Code of Federal Regulations (21 CFR135.110) specifies both compositional and manufacturing requirements for a product to be called ice cream. The compositional requirements state that the product cannot contain less than 20% total milk solids including 10% milk fat. No more than 25% of the nonfat milk solids can be derived from whey, and caseinates may be used only after reaching the 20% milk solids minimum. Some allowances are made for bulky flavors such as chocolate and certain fruit flavors, and the requirements for milk solids level is reduced by 20%. For a product to be called frozen custard (or French ice cream), the product must contain at least 1.4% egg yolk solids. Last but not the least, a minimum total solids and weight per gallon are also specified. Ice cream must weigh a minimum of 4.5 lb/gallon or 540 g/L. This requirement specifies the maximum amount of air (a maximum of 100% overrun) permissible in the product. However, for reduced fat, low fat and nonfat ice cream, the minimum weight requirement is reduced to 480 g/L. Total food solids must be at least 1.6 lb/gallon or 192 g/L.A serving of ice cream is considered to be one half cup or 4 fl. oz, or 120 mL (a volumetric measure). To conform to the weight requirement of 4.5 lbs/gallon, 1/2 cup corresponds to 63.8 g.
(http://www.researchgate.net/publication/227580162_Ice_Cream_and_Frozen_Desserts/file/9c9605151b162a696c.pdf)
Two manufacturing practices that affect the characteristics of frozen desserts are the freezing technique and degree of freezing. The freezing technique may involve stirring (agitation) during freezing, or may occur without stirring (quiescent), or a combination of the two. Similarly, the degree of freezing results in products that are hard frozen, designed for dipping or scooping, or used as soft serve, or for milkshakes.
More on components of ice cream
The extent of the fat content is determined by the amount of fat that is allowed in the milk source. Fat normally floats on top of fresh milk. Scooping off all the fat produces skim milk! As is known, you can purchase milk with varying amounts of fat from 0 (skim milk), 1 and 2 % up to whole milk with a fat content in excess of 3% (usually listed as 4%).
30

Fat in milk (important to ice cream making) is secreted as tiny droplets called globules. A drop of milk contains millions of such globules. Each globule is surrounded by a membrane called a milk fat globule membrane. The membrane is lipophilic (“fat loving”) on the inside, where it is in contact with fat, and hydrophilic (“water-loving) on the outside, where it is in contact with the aqueous medium. These membranes prevent the fat globules from coalescing. Since fat has a lower specific gravity than the milk serum (water solution), the fat globules separate out (float) to the top of a contained volume of milk. To prevent this separation in milk, the fat globules are broken up mechanically into droplets, 0.1–2 micrometers in diameter. (This process is homogenization). The disintegration of the large fat globules results in a 6-fold increase in the total surface area of all the fat globules in a given volume of milk. These disrupted fat droplets attract various milk proteins which form artificial membranes which, in turn, further prevent the fragmented fat globules from coalescing. So, even though homogenized milk still contains the fat, the fat will not re-separate into a layer on top of the non-fat milk mixture.
The fat in the milk is made up of triglycerides, traces of di- and monoglycerides, cholesterol, and phospholipids among many other substances. In fact milk fat is composed of some 3600 different compounds. The triglycerides which are the main component are synthesized by the cow by linking three molecules of fatty acids to one molecule of glycerol, hence the name triglycerides. Fatty acids can have as few as four carbon atoms or as many as 26 carbon atoms. In milk fat, there are a number of different fatty acids including those containing four, six, and eight carbon atoms. This is significant because the characteristic flavor of milk fat is in large part due to the presence of these lower chain fatty acids—butyric, caproic, capryllic, and capric acids with carbon numbers 4, 6, 8, and 10, respectively. Further there are fatty acids that are unsaturated; thus we have fatty acids with one double bond (monoenoic) fatty acids, two double bonds (dienoic) or with three double bonds (trienoic). The unsaturated fatty acids with multiple double bonds are functional, healthy, and essential for human beings.
31

(http://www.researchgate.net/publication/227580162_Ice_Cream_and_Frozen_Desserts/file/9c9605151b162a696c.pdf - pp 5-6)
More on stabilizers
Stabilizers (also known as colloids, hydrocolloids and gums) are macromolecules that are capable of interacting with water. In so doing, they are also able to interact with proteins and lipids in an ice cream mix. During the mix processing, the presence of these stabilizers affect mix viscosity and homogeneity. During the freezing phase, these stabilizers affect the “dryness” and stiffness of the ice cream as well as controlling crystal formation in the finished product (think in terms of preventing ice crystals while the ice cream is in storage and distribution). Some of the common stabilizers used to prevent large crystal formation (called heat shock) and rapid melting in ice cream include the following:
Gelatin—an animal protein effective in high concentrations of 0.3–0.5%. But it is expensive and may not prevent heat shock.
32

Guar gum—derived from the seeds of the tropical legume, guar. It is the least expensive of the stabilizers and effectively mitigates the undesirable changes in ice cream due to heat shock. It makes up 0.1–0.2% of the ice cream mix, making it a strong stabilizer.
Sodium carboxymethyl cellulose (CMC)—derived from cellulose, it is a strong stabilizer (used at 0.1–0.2%), imparting body and chewiness to ice cream. It is usually mixed with carrageenan.
Locust bean gum—isolated from the plant seed of the carob tree (Mediterranean). It is a strong stabilizer, used in 0.1–0.2% levels.
Carrageenan—this stabilizer derived from the sea weed, Chondritis crispus, and used at levels of 0.01–0.02%. It reacts with milk proteins to prevent the formation of whey, a watery condition.
Heat shock, which is the formation of large ice crystals, occurs when ice cream is subjected to fluctuations in storage temperature. Slight melting and then refreezing also contributes to this icy (coarse) condition. The original matrix, formed from the various ingredients including the stabilizers, traps some of the water as small ice crystals. This matrix is compromised with the raising and lowering of temperatures, allowing the ice crystals to re-establish themselves as “free” water, so called. With larger “volumes” of water unrestricted by the matrix, larger ice crystals are formed upon refreezing.
More on emulsifiers
In contrast with stabilizers, emulsifiers exert their action on the fat phase of ice cream, acting as surface agents or surfactants, physically promoting the mixing of fat and water due to the presence of both hydrophilic (water attracting) and hydrophobic (fat attracting, water resisting) ends of the molecule. Emulsifiers are considered to be fatty substances and show fat-like properties of melting point and crystallinity, and can be composed of saturated and unsaturated fatty acids.
The emulsifiers are added to ice cream to actually reduce the stability of this fat emulsion by replacing proteins on the fat surface, leading to a thinner membrane more prone to coalescence during whipping. When the mix is subjected to the whipping action of the barrel freezer, the fat emulsion begins to partially break down and the fat globules begin to flocculate or destabilize. The air bubbles which are being beaten into the mix are stabilized by this partially coalesced fat. If emulsifiers were not added, the fat globules would have so much ability to resist this coalescing, due to the proteins being adsorbed to the fat globule, that the air bubbles would not be properly stabilized and the ice cream would not have the same smooth texture (due to this fat structure) that it has.(https://www.uoguelph.ca/foodscience/dairy-science-and-technology/dairy-products/ice-cream/ice-cream-structure/colloidal-aspects-structur)
The presence of emulsifiers in ice cream leads to smoother texture and better shape retention as well as improving the ability of the mix to incorporate air. The following are common emulsifiers in ice cream:
Mono- and diglyceride mixtures—these compounds are produced by the chemical treatment of fats (hydrogenation) such as lard, palm kernel or soybean oil. These glycerides are solid at room temperature, added to the mix prior to pasteurization at 0.1–0.2%.
Polysorbates—are compounds (polymers actually) derived from ethylene glycol. They are considered to be the best drying agents. Polysorbate 80 is an oleic acid derivative
33

and is used at the 0.04–0.07% levels. Polysorbate 65 is helpful as a whipping agent (helps to incorporate air into the ice cream mix). Polysorbate 65 is used in greater proportion than 80. Polysorbates are usually liquid and assist in the mixing process.
Buttermilk powder—the buttermilk contains phospholipids that act as emulsifiers. Egg products—dried or frozen egg yolks are used to produce dry, stiff ice cream.
Frozen or sugared egg yolks are easier to incorporate into the mix than dried product. The general range is 0.3–0.5% of the mix. In French-style or custard, a minimum of 1.4% yolk solids are required. Egg yolks contain lecithin which can also be derived from soybean oil.
More on freezing point depression by ice cream components
Looking at the chart below, one can see the relative effects on the freezing point depression of a variety of substances that can be added to ice cream. The alcohol category (actually, sugar alcohols) is a general category and includes two common additives to ice cream—sorbitol and xylitol. High fructose corn syrup is 45% fructose and 55% glucose and is as sweet as sucrose. This ratio can be changed to 55% fructose and 45% glucose, producing a mix that is sweeter than sucrose.
Effect of Nutritive Sweeteners on Freezing Point DepressionSweetener Relative Effect
Sucrose 1.0
Lactose 1.0
Dextrose 1.82
Fructose 1.82
55% High fructose corn syrup 1.85
Sorbitol 1.90
Glycerol 3.70
Alcohol 7.40
(http://www.researchgate.net/publication/227580162_Ice_Cream_and_Frozen_Desserts/file/9c9605151b162a696c.pdf-, p 11 of pdf)
In commercial ice cream making, the freezing/whipping process takes place after mix processing is complete. The mix is drawn into a flavor tank where any liquid flavors, fruit purees, or colors are added. The mix then enters the dynamic freezing process which both freezes a portion of the water and whips air into the frozen mix.
The "barrel" freezer (at right) is a scraped-surface, tubular heat exchanger, which
34

is jacketed with a (low-temperature) boiling refrigerant such as ammonia or Freon substitute. The mix is pumped through this freezer and is drawn off at the other end in a matter of 30 seconds, (or 10 to 15 minutes in the case of batch freezers) with about 50% of its water frozen. There are rotating blades inside the barrel that keep the ice scraped off the surface of the freezer and also dashers inside the machine which help to whip the mix and incorporate air.
As the ice cream is drawn with about half of its water frozen, particulate matter such as fruits, nuts, candy, cookies, or whatever you like, is added to the semi-frozen slurry which has a consistency similar to soft-serve ice cream. In fact, almost the only thing which differentiates hard frozen ice cream from soft-serve, is the fact that soft serve is drawn into cones at this point in the process rather than into packages for subsequent hardening.(https://www.uoguelph.ca/foodscience/dairy-science-and-technology/dairy-products/ice-cream/ice-cream-manufacture/freezing-and-hardening)
More on ice cream as a foam
In the culinary world, foams are an important part of imparting unique tastes to the preparation of various dishes. Known as culinary foams, the foam is again formed the same way as in ice cream. In ice cream,
… [T]he structure (of ice cream) can be described as a partly frozen foam with ice crystals and air bubbles occupying a majority of the space. The tiny fat globules, some of them flocculated and surrounding the air bubbles also form a dispersed phase. Proteins and emulsifiers are in turn surrounding the fat globules. The continuous phase consists of a very concentrated, unfrozen solution of sugars. One gram of ice cream of typical composition contains 1.5 x 10¹² fat globules of average diameter 1µ m that have a surface area of greater than 1 square meter (in a gram!), 8 x 10⁶ air bubbles of average diameter 70 µ m with a surface area of 0.1 sq. m., and 8 x 10⁶ ice crystals of average diameter 50 µ m with a surface area of another 0.1 sq. m. The importance of surface chemistry becomes obvious!(https://www.uoguelph.ca/foodscience/dairy-science-and-technology/dairy-products/ice-cream/ice-cream-manufacture/freezing-and-hardening)
In culinary foams other than ice cream, the temperature is obviously higher than in ice cream. Therefore, one is not talking about ice crystals as part of the structure. But there are two phases—an aqueous one (rather than ice) and a gaseous (air) phase. Usually a protein solution is bubbled, whipped or shaken to create the foam which is dependent on the protein to both form and stabilize a dispersed gaseous phase. The extent of the foaming is affected by the amount of protein present in a solution used to create the foam. The ultimate “stiffness” of a culinary foam is represented by something like the meringue on top of a pie. Soufflés, another example of a culinary foam, have been around since the late 1700s, seen first in French restaurants. Foams are used in creating culinary dishes to produce a lighter feel to what would normally be a thick sauce. Foams also provide tactile and textural aspects to food. Last but not least, they can provide a visual aspect to a dish.
35

When milk is the source of a foam, its formation is dependent upon two different types of milk protein—whey and casein. Casein makes up 80% of the total protein in milk. Casein provides good surface-active properties which is fundamental to whipping and foaming. Whey proteins are not nearly as active in the actual surface activity of foam formation but they do provide stabilizing properties to the foam, creating a more rigid film at the air-water interface of the foam.
The chart at right shows the subcategories of both casein and whey protein groups. Note again the percent contribution of each of the subcategories as well as the total contribution for each group.
More on effect of temperature on taste
Heating or cooling certain parts of the tongue can create the illusion of certain tastes. A study published in the journal Nature in 1999 found that, for example, warming the front edge of the tongue (where the chorda tympani nerve is), from a cold temperature, can evoke sweetness. Cooling the same area conjures sourness and/or saltiness. Then, at the back of the tongue (where the glossopharyngeal nerve is), thermal taste also occurs but the relationship between temperature and taste is different there than on the front of the tongue. The Yale researchers concluded that thermally sensitive neurons form an everyday part of our sensory code for taste.
It follows that the temperature of what you drink while eating will also affect the food's taste. North American people, on the whole, like ice-cold water and other beverages at mealtimes, whereas Europeans are happy with liquids not-far-below room temperature, and Asian people often drink hot water or tea while eating. Research published in the journal Food Quality and Preference in June 2013 (abstract at http://www.sciencedirect.com/science/article/pii/S0950329312002273?np=y#bb0025) found that eating immediately after drinking cold water decreased the perception of sweetness, chocolate flavor and creaminess, and the researchers are now wondering whether the preponderance for iced water among Americans contributes to their preference for highly sweetened food.
A 2005 paper published in the Journal of Sensory Studies found that the serving temperature of cheddar cheese affected how its taste was perceived. The cheese was served at 5 oC, 12 oC and 21 oC and sourness increased as the temperature rose. The tasters also found the warmest cheese more difficult to evaluate. Talavera Pérez [Professor of Molecular and Cellular Medicine at the University of Leuven in Belgium] meanwhile discovered in the same year why ice-cream gets sweeter when warmer. It's true: melted ice-cream is too sickly to drink, whereas when cold, it is pleasantly sweet. Beer, on the other hand, tastes more bitter as it gets warmer. Ham tastes saltier when cold and more savory when warm. Some of these effects, such as the over-sweet melted ice cream, occur because the taste receptor TRPM5 (which picks up sweet, bitter and umami tastes) sends a stronger electrical signal to the brain when food is warmer.(http://www.theguardian.com/lifeandstyle/wordofmouth/2013/sep/17/serving-temperature-affects-taste-food)
36
(http://dwb4.unl.edu/Chem/CHEM869N/CHEM869NLinks/www.fst.rdg.ac.uk/courses/fs560/topic1/t1g/t1g.htm)

More on lactose intolerance and ice cream
People who are lactose intolerant do not react well to drinking milk, because they are not able to produce the enzyme lactase in the small intestine, which is needed to convert the lactose sugar to glucose and galactose. As a result, the lactose remains in the digestive tract and essentially ferments, creating by products that are associated with gas production which, in turn, can create an uncomfortable feeling in the intestinal region from bloating or cramps. The condition can also produce diarrhea and nausea. The condition is more common among Native Americans, Africans, Asians, and South Americans. It is less likely to occur in Europeans and those of European descent.
For people who are lactose intolerant and who want to drink milk, there is lactose-free milk. And for people who have the condition and want to eat ice cream, there is also lactose-free ice cream, although it may not be as readily available. (Do an online search for Lactaid® or Breyers® lactose-free ice creams.) Should the lactose-free variety not be available, people can still enjoy ice cream that contains the sugar lactose found in milk products by first taking a readily available pill that contains the enzyme lactase prior to ingesting milk-containing products.
Connections to Chemistry Concepts (for correlation to course curriculum)
1. Solubility—Polar, non-polar—To create a heterogeneous mixture such as ice cream, one has to be aware of solubility issues that relate to polar and non-polar ingredients. The use of emulsifiers is meant to deal with these particular solubility properties.
2. Emulsion—The presence of fats and water in the ice cream mix create an emulsion, the same as in mayonnaise, for which both require some kind of emulsifier to create a mixture that does not separate. Normally fats and water will not mix—they are immiscible. Therefore an emulsifier is required that allows the fat and water to mix (a colloid). True mayonnaise depends upon egg yolks containing the protein lecithin as the emulsifier. Emulsions are colloids.
3. Emulsifier—In order to keep normally immiscible substances from separating out after being mixed together, a so-called stabilizer is added which prevents the separation from occurring. There are many examples in the culinary world—for instance, Hollandaise sauce, which is made from clarified butter and egg yolks, the yolks providing the protein emulsifier, lecithin. Starch is used as an emulsifier in cooking, often joining the fat in a sauce to the liquid stock. In turn, this thickens the mixture. A mixture of milk and cocoa butter, in which the milk proteins act as the emulsifier, produce the emulsion called chocolate. A hot dog is also an emulsion formed from meat, fat and water in which the meat proteins act as an emulsifier as well as the physical solids of the hotdog.
4. Foam—Ice cream is considered a foam with its large amounts of air added in the mixing process to produce a smooth texture. As much as 50% of the ice cream mix is air. A short (2:24) but illustrative video shows not only the components of an ice cream mix but also their interaction with each other to produce the foam when air is mixed in with the ice crystals and water (a three phase system). To view this excellent video that illustrates the interaction of ice cream components in a foam, refer to this Web site (video): http://vimeo.com/65780089.
37

5. Colloids—Being a type of mixture intermediate between a homogeneous mixture (also called a solution) and a heterogeneous mixture, it has the properties intermediate between the two types of mixtures. One can distinguish between solutions and colloids based upon the size of the particles. In a colloid, particles have a size range of 10-8 to 10-6 m; particles in a solution are 10-9 m or smaller. Colloid particles do not settle out due to Brownian motion (as is also true of solution particles). Given the size of the particles in a colloid, it is also possible to detect their presence by shining a light beam through the mixture, creating a visible path; the effect is known as the Tyndall effect. In making ice cream, colloids, known as stabilizers, are used in the ice cream mix to produce homogeneity and increased viscosity of the mix. The stabilizers bind the water into smaller droplets within the network of proteins and lipids, preventing “free flow” of the water and the formation of large ice crystals.
6. Colligative properties—Ice cream’s freezing point depression, a colligative property, is affected by the presence of sugars and salts. At a typical ice-cream serving temperature of –16 oC, only about 72% of the water is frozen. The unfrozen concentrated solution component keeps the ice cream “scoopable”.
7. Freezing point depression—components of the ice cream mixture lower the freezing point of the ice cream (on the average, –3.0 oC) which is then normally hardened by cooling down to –10 to –12o C for scooping.
8. Organic chemistry—Ice cream is an extensive collection of organic molecules that fit into the three major food groups—carbohydrates, lipids, and proteins. Thanks to the presence of the carbon atom, a multitude of organic compounds (many of them large, molecularly speaking, such as proteins) exist because of the four bonding positions of carbon.
9. Heat/energy transfer—Ingredients of ice cream must be cooled down to/below their freezing temperature in order to freeze the ice cream. Using liquid nitrogen to make ice cream adds the extra “ingredient” of heat absorption from phase change (although this is probably insignificant compared to the heat transfer due to original temperature differences).
Possible Student Misconceptions (to aid teacher in addressing misconceptions)
1. “If I am lactose intolerant, I will not be able to eat milk products, including ice cream, that contain lactose.” Fortunately for those who are unable to produce the enzyme lactase which is needed to convert lactose to glucose and galactose, there is available the lactase enzyme in tablet form that can be ingested before eating any milk-containing products, including ice cream.
2. “I’ll bet air is put in ice cream just to make it take up more space, so it looks like we get more.” Actually, as the article mentions, air gives ice cream structure that makes it taste and feel good when we eat it.
3. “Why do they call it ice cream when there’s no ice in it? There can’t be any ice—it’s too smooth.” Actually, there is ice in ice cream, but the ice crystals are so small (<50 μm) that we don’t actually feel them (see Figure 1 in the article).
Anticipating Student Questions (answers to questions students might ask in class)
1. “Is there really such a thing as an ice-cream headache?” There have been scientifically based attempts to explain this phenomenon, also called a “brain freeze”. One of
38

the more credible explanations says that when cold things like ice cream hit the roof of your mouth, a nerve overreacts by sending a signal to the brain to counter the cold with heat. The heat is provided by dilating blood vessels (the anterior cerebral artery) in the brain. The dilated blood vessels expand the brain, pressing against the nerves in the brain cover (the meninges) producing the pain. The brain itself has no pain receptors. This is the basis of a headache in general—dilated blood vessels in the brain. The solution to preventing an ice cream headache is to eat more slowly and keep cold things like ice cream away from the roof of your mouth.
2. “How is it possible to have ‘deep fried ice cream’ like that which is served in Mexican restaurants? Isn’t this a contradiction—fried and frozen?” Interestingly enough, this is neither an impossibility nor culinary magic. The way it is done is to freeze crunchy-coated scoops of ice cream until hard, and then quickly fry them before the ice cream inside has a chance to melt!
In-class Activities (lesson ideas, including labs & demonstrations)
1. Depending on your policies for having food in a chemistry lab, you should make ice cream as a chemistry experiment, perhaps in a non-chemistry room. You can use ice and salt, or liquid nitrogen as the freezing medium. The instructions for doing this kind of activity can be found at https://www.uoguelph.ca/foodscience/sites/uoguelph.ca.foodscience/files/FindingScienceInIceCream.pdf. The following is an excerpt from this reference discussing both methods:
…Here are directions from a clever experiment I received from a science … teacher: Each student places in a small zip loc baggy (the heavy-duty, freezer type) - 1 T sugar, 1/2 t vanilla, 1/2 cup milk. Secure zip loc and place small baggy in a larger zip loc baggy (also the heavy duty kind). Surround the small baggy with ice to 1/2 large baggy full and put in 6 T salt on ice. Next, shake the baggies 5-10 minutes and the students have made their own serving of ice cream. Chocolate syrup on top is really good.
An alternative is to use liquid nitrogen for the freezing. Use a mix of standard recipe (see homemade ice cream page). Place the mix on a very large stainless steel bowl, about 1/3 full, and have a student stir the mix very quickly with a wire whisk (very quickly!). Have someone else pour a small quantity of liquid nitrogen into the mix while being stirred (stir as long and as fast as you possibly can). It will freeze instantly. Let the ice cream sit for a few minutes to ensure there is no liquid nitrogen left, and then eat when it is at the right consistency. A few words of caution - this experiment is pretty safe for older children (I have done it many times in high school classes), but liquid nitrogen needs to be handled cautiously. Wear gloves, don't spill on skin, etc.
Another video that illustrates this bag approach to making ice cream is found at http://www.youtube.com/watch?v=l9c5rmDQ9DE. The narrator of this video also provides a discussion of freezing point depression as well as performing an experiment that includes data collecting and graphing.
2. Another set of instructions for making ice cream with liquid nitrogen as the coolant is found at http://chemistry.about.com/od/demonstrationsexperiments/ht/n2icecream.htm. There is also a reference for additional ice cream recipes.
39

3. To illustrate the role of emulsifiers in producing an ice cream mix in which the insoluble components do not separate out, a simple experiment can be done using water, oil, and egg yolk (a source of the emulsifier, lecithin). The arrangement for this experiment can be found at http://www.sciencebuddies.org/science-fair-projects/project_ideas/FoodSci_p021.shtml.
4. The fact that the combination of ingredients produces a drop in the freezing point of an ice cream mixture is related to a physical principle called the “Freezing Point Depression” as mentioned in the article (ice cream typically freezes at –3 oC instead of 0 oC). There are several experiments that students can do to observe both the effect of solutes on the freezing point of a solvent, as well as to use the technique to calculate the molecular weight of the solute. To illustrate the effect of depressing the freezing point of a solvent (water), refer to the following Web site for a simple but effective set up. http://www.lahc.edu/classes/chemistry/arias/Exp%2012%20-%20Freezing%20PointF11.pdf. This activity uses both electrolyte and non-electrolyte (molecular) solutes. The lab asks for the calculation of the molality of each solution (information on doing the calculations is included). For those students who can handle the quantitative aspects of chemical calculations, the molecular weight of the solute can be determined with the data collected for freezing point depression since they are being asked to calculate molality. Temperature data can be collected with a regular thermometer or it can be done using a thermistor such as that available from Vernier equipment. (see reference below for Vernier)The references for three different lab approaches are found at http://www.sheboyganfalls.k12.wi.us/mjnikson/files/2011/05/Freezing-Point-Depression-Lab.pdf (using different amounts of NaCl in water), http://www.webassign.net/sample/ncsugenchem202labv1/lab_3/manual.html (using two substances, benzoic acid and lauric acid for solute and solvent), and http://www2.vernier.com/sample_labs/CWV-15-COMP-freezing_pt_depression.pdf (using the thermistor and the chemicals, benzoic acid and lauric acid as in the previous Web site but students have the capability of seeing real time graphing along with tools for analyzing the data points).
5. Students can evaluate different chemicals in terms of their effect on the freezing point of a given solvent (ex, water). Some common solute chemicals, two of which are used to deice sidewalks, include NaCl and CaCl2. A third chemical would be sucrose (C12H22O11), table sugar. Remember that the freezing point depression (of the solvent) depends upon the number of moles of solute in 1 kg of water (or other solvent), which is known as molality. If you are using a molecular solid like sucrose, you will have a different effect quantitatively on the freezing point depression per mole of solute than an ionic solute because there are more moles of the solute ions (Na+ and Cl–) than solute molecules (sucrose) when using one mole of each solute per kg of solvent, for example. Students could experiment, using the same mass of each solute tested vs. the same number of moles of each solute tested. Refer to the experiment references listed in #4 above for background.
6. To illustrate the properties of an emulsion, a well-constructed experiment for students (with notes for teacher support) can be found at http://www.juliantrubin.com/encyclopedia/chemistry/emulsion_experiments.html.
7. If there is interest in the problem of lactose intolerance, students can perform an experiment to show the activity of the enzyme lactase that is missing in people who are lactose intolerant. The dietary supplement is readily available over the counter. Essentially in such an experiment, students will test for the activity of the lactase tablet on a milk product. If the lactase pill breaks down the sugar lactose into glucose and galactose, students can then do a glucose test with paper strips normally used by diabetics to test for glucose in their urine. The test strips are available from drugstores. Two different lab guides can be found at http://seql.mst.edu/2012/institute/4/LactoseLactaseExperiment.pdf and
40

https://docs.google.com/document/d/1mIdcJc-bkhm7_hqSs6WqVSc7g1VTzTwNWuaePWKPU0Y/preview
8. If you want to have students test for the presence of sugars, fats and even proteins in various foods including milk and ice cream, the following lesson resource provides chemistry background information and procedures for students to test for the presence of the three main categories of food components. Refer to http://seplessons.ucsf.edu/node/362.
9. Another experiment with ice cream (indirectly showing the air bubbles in ice cream or its foam state) is outlined (and explained in terms of results) at the following Web site: http://thehappyscientist.com/science-experiment/ice-cream-foam.
10. Teaching about mixtures, you could use a table of colloids such as the one referenced here: http://www.edinformatics.com/math_science/suspensions_colloids.htm to show students the variety of types of colloids, and then ask them to choose the category to which ice cream belongs.
Out-of-class Activities and Projects (student research, class projects)
1. For the students who want to do more sophisticated chemistry outside of class (using the school laboratory under teacher supervision), they can isolate lactose sugar from non-fat powdered milk. The entire procedure can be found at http://infohost.nmt.edu/~jaltig/Lactose.pdf).
2. Students could do a group project investigating the contents of various ice cream brands. They could bring the cartons (cleaned out at home) from their own ice cream to school for comparison.
3. Students could bring in different brands of ice cream for a class taste test, ranking the different brands for taste, texture, etc. and then relate their choices to the ingredients contained in each that account for those differences in qualities.
41

The references below can be found on the ChemMatters 30-year CD (which includes all
articles published during the years 1983 through April
2013 and all available Teacher’s Guides). The CD is in production and will be available from the
American Chemical Society at this site: http://ww.acs.org/chemmatters.Selected articles and the complete set of
Teacher’s Guides for all issues from the past three years are also available free online on the same
site. (The complete set of ChemMatters articles and Teacher’s Guides are available on the 30-year CD for all past issues, (up to April 2013.)
Some of the more recent articles (2002 forward) may also be available online at the link
above. Simply click on the “Past Issues” button directly below the “M” in the ChemMatters logo at the top of the Web page. If the article is available online, you will find it there.
30 Years of ChemMatters !
References (non-Web-based information sources)
Cote, G.L. Polysaccharides. ChemMatters 1986, 4 (2), pp 12–14. This article covers the broad topic of polysaccharides, including a discussion about seaweed polymers, some of which are used as stabilizers in ice cream. There is a useful chart listing all the various polysaccharides including their source and use. Some of the emulsifiers and stabilizers for ice cream are on this list.
Baxter, R. Making Ice Cream. ChemMatters 1995, 13 (4), pp 4–7. This article on making ice cream provides very useful illustrations of molecular structures of various components of milk that are found in the ice cream. Recipes are also included, not that they are necessarily different from the common listings found in standard ice cream recipes. There is also a Classroom Guide for this article that includes an experiment for making ice cream (“Synthesis of a Frozen Colloid”!) that requires students to make temperature measurements of the ice-salt water slurry while the ice cream mix is being kneaded in a plastic bag. After-lab questions concerning the temperature behavior (freezing point depression) of the salt-water mix are provided in this Classroom Guide.
Rohrig, B. Not Milk—Living With Lactose Intolerance. ChemMatters 2013, 31 (2), pp 17–19. A complete discussion of lactose intolerance is found in this article along with the Teacher’s Guide that can be accessed at the ACS Web site for ChemMatters referred to in the introductory information above.
42
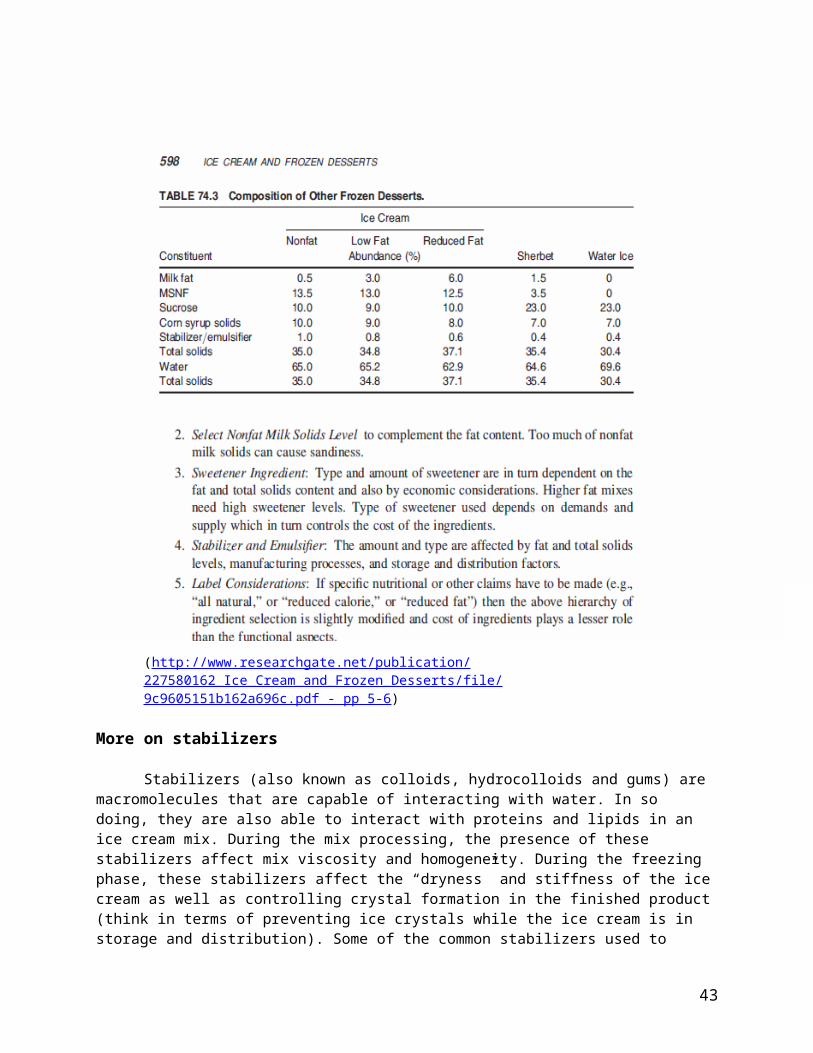
Web Sites for Additional Information (Web-based information sources)
More sites on molecular behavior at the freezing point
In order for students to better understand what happens at the molecular level when a solute is added to a solvent to lower the freezing point of the solvent, refer to the following Web site which provides an interactive simulation of molecular activity, first when water molecules undergo freezing, then when a solute is added. Temperature of the system can also be changed. A detailed narrative explanation of events at the molecular level is also provided. Refer to the following Web site: http://antoine.frostburg.edu/chem/senese/101/solutions/faq/why-salt-melts-ice.shtml.
A student support Web site for understanding and doing the calculations associated with freezing point depression is found at http://www.kentchemistry.com/links/Math/BPFP.htm.
More sites on ice cream making with liquid nitrogen
The making of ice cream with liquid nitrogen has gone from the lab demo to commercial application. Several videos clearly show the equipment and technique employed in making ice cream using liquid nitrogen as the coolant. The advantage of the quick freeze is that ice crystals are extremely small, producing a very smooth ice cream. Further, there is no need to add emulsifiers or stabilizers because large ice crystals are not formed in making the ice cream; further it is consumed as soon as made—no need to store.
The following two videos are from the same California operation, Smitten Ice Cream, with good explanations about the science behind the technique. Refer to http://www.youtube.com/watch?v=e52fXpS9YCY for an in depth interview with the creator of this establishment. A complementary video of the same establishment’s operation is shorter and clearer about the equipment and science behind the procedure. Refer to http://www.youtube.com/watch?v=IRz0eXkYlj4.
Another commercial operation that is not as sophisticated but more direct is found at http://www.youtube.com/watch?v=B8D02bcELUM. In this video, the end point for mixing is determined by sight, whereas the previous operation above in California uses a computer program to end the mixing process at the correct time.
A typical school demo is shown in an unsophisticated manner at http://www.youtube.com/watch?v=Yog-muVV1Tw.
An interesting collection of various methods to make ice cream, including a different way to incorporate ice into the mix to produce an ice cream texture similar to that made through liquid nitrogen cooling, is shown at http://www.youtube.com/watch?v=EPk71IgKJks. If nothing else, students might be amazed at the one recipe that includes bacon!
More sites on ice cream properties
43

An article from Chemical and Engineering News (C&E N) that talks about the physical and chemical properties of ice cream that make it a desirable thing to consume is found at http://pubs.acs.org/cen/whatstuff/stuff/8245icecream.html.
Two other articles that might be fun for students to read about the social aspects of ice cream can be found at http://articles.chicagotribune.com/2004-06-30/entertainment/0406300068_1_ice-cream-homemade-ice-ice-crystals-form and http://blogs.smithsonianmag.com/food/2009/07/ice-cream-chemistry/. This latter article discusses, among other things, ice cream for astronauts, Mexican “fried” ice cream, and a few other quirky ice cream dishes along with several reference articles to read about other unusual ice cream mixes.
More sites on making your own ice cream
A nifty recipe builder for making your own ice cream concoction (including a variety of ingredients you can add to the virtual mixing bowl) is found at http://www.finecooking.com/articles/cyor/ice-cream.aspx.
Another source for making your own ice cream without using a standard ice cream mixer (known as “still freezing”) includes a discussion about different ways to produce a product without ice crystals. The reference is also set up for experimenting with the various necessary ingredients, something students could refer to in carrying out their investigations into what ingredients and their quantities are really necessary for mixing (tinkering). The Web site can be found at http://www.icecreamnation.org/freezer-only-make/. A complementary page from the same basic home address (“Ice Cream Nation”) that addresses the role of the various basic ingredients in ice cream in straight forward terms is http://www.icecreamnation.org/science-of-ice-cream/.
This site called “Ice Cream Science” contains 10 recipes, including ones for blue cheese chocolate, earl grey tea, and strawberry and balsamic vinegar ice creams: http://icecreamscience.com/recipes-3/. The recipes are very specific and detailed, using only the freshest of organic ingredients.
A very complete treatise on the manufacture of ice cream can be found in the 42-page chapter 74, Ice Cream and Frozen Desserts, from the book Handbook of Food Products Manufacturing. Here’s a pdf copy of that chapter: http://www.researchgate.net/publication/227580162_Ice_Cream_and_Frozen_Desserts. A more user-friendly version of this chapter can be found here: http://kanakh.com/upload/uploads/12999258461.pdf
The most complete Web site that discusses all aspects of ice cream, including the functioning of the various ingredients, the manufacturing of ice cream, scientific principles and recipes (once again) for classroom activities is found at https://www.uoguelph.ca/foodscience/sites/uoguelph.ca.foodscience/files/FindingScienceInIceCream.pdf. This is a Web site from the Univ. of Guelph in Ontario, Canada.
44

Going the Distance: Searching for Sustainable Shoes
Background Information (teacher information)
More on shoe manufacture and design
Take a peek in someone’s closet and you’ll likely see at least a small collection of shoes—shoes for exercising, shoes for dressing up, boots for slushy weather, slippers for lounging around, all available in stores in an array of colors and styles to fit our individual tastes. Those who participate in sports may have shoes specific to their own activity, such as track shoes with spikes, basketball shoes that offer particular support, etc. We have shoes to fit many different situations, but the main purposes of shoes are to protect and support our feet. A history of shoes suggests this as well, from the earliest times:
There is much evidence that a foot covering was one of the first things made by our primitive ancestors. Necessity compelled them to invent some method of protecting their feet from the jagged rocks, burning sands, and rugged terrain over which they ranged in pursuit of food and shelter.
The history of human development shows that the importance of protecting the foot was early recognized [sic]. Records of the Egyptians, the Chinese and other early civilizations all contain references to shoes. The shoe is repeatedly mentioned in the Bible and the Hebrews used it in several instances with a legal significance, notably in binding a bargain. …
In its first form the shoe was just a simple piece of plaited grass or rawhide which was strapped to the feet. Among the relics of early Egyptians are some sandals made from plaited papyrus leaves, beautifully and artistically wrought. Records show that sandalmaking had become a well-recognized art early in the history of that country. (http://www.shoeinfonet.com/about shoes/history/history your shoes/history your shoes.htm)
To purchase a new pair of shoes in earlier years, one did not visit a store as we do, but rather made arrangements with a cobbler, who would make a custom pair of shoes fitted to the specific customer. For example, if you have read the book Farmer Boy from Laura Ingalls Wilder’s Little House on the Prairie series, set in the 1860s, a cobbler came to visit the home of the main character. (Wilder, L.I. Farmer Boy. New York: HarperCollins, 2008) Even though the children had grown out of their shoes earlier, the family had to wait for the cobbler to arrive. Each person who needed shoes needed to be there for him to properly measure their feet. From those measurements, he would whittle wooden lasts shaped like their feet, to properly fit and shape each new pair of shoes.
Eventually shoemaking processes evolved:
The nature of shoemaking in the U.S. changed right after the Revolutionary War. When the U.S. became a country in its own right, its newfound nationhood resulted in an increase in population, thereby increasing the demand for shoes and making it necessary to mass produce shoes. That was the beginning of the division of labor in shoe manufacturing. Instead of cobblers, shoemakers became craftspersons and began to specialize in making only one part of the shoe, such as making the sole or attaching the
45
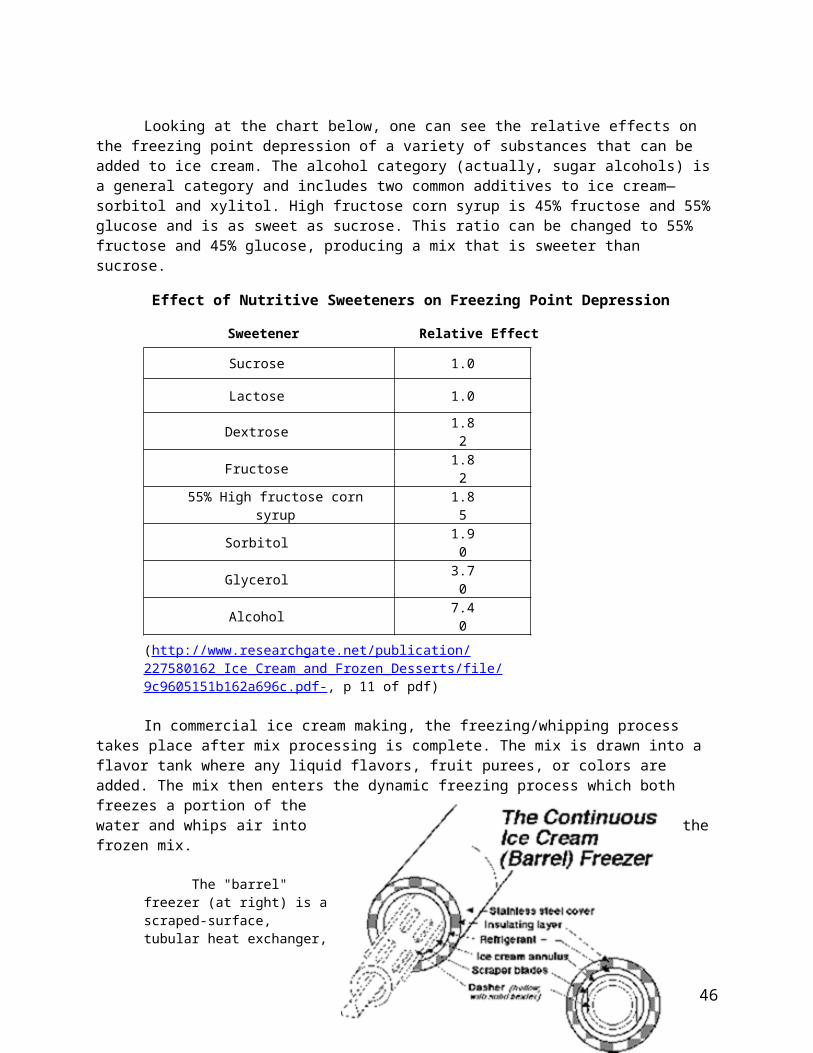
sole to the upper part of the shoe.
The gradual specialization of shoemaking increased as we entered the 19th century. Factories appeared that were dedicated to only one step of the shoe manufacturing process. Then, machines were used to stitch uppers to the soles rather than stitching the shoes by hand.
The advent of the Civil War increased the demand for shoes to be manufactured quickly and cheaply. The War also resulted in the first widespread standardizing of shoe sizes. Standardized sizes made it easier for soldiers to receive the correct size of army boots.
By the end of the 19th century, shoes could be made in a fraction of the time it took to make a pair of shoes by hand. By the 20th century, the shoe manufacturing process was divided into 150 distinct steps.(http://www.toptenwholesale.com/news/the-history-of-shoe-manufacturers-in-the-united-states-3302.html)
Part of this evolution in manufacturing included the development of various machines that aided in the shoemaking process.
In 1845 the first machine to find a permanent place in the shoe industry came into use. It was the Rolling Machine, which replaced the lapstone and hammer previously used by hand shoemakers for pounding sole leather, a method of increasing wear by compacting the fibres.
This was followed in 1846 by Elias Howe's invention of the sewing machine. … In 1858, Lyman R. Blake, a shoemaker, invented a machine for sewing the soles of shoes to the uppers.(http://www.shoeinfonet.com/about shoes/history/history your shoes/history your shoes.htm)
These machines provided a start to the mechanization of the process. However, at least some steps still needed to be done by hand. At one point, people thought it would not be possible to ever make shoes completely by machine. An additional invention changed that.
Other inventors had managed to create machines to cut out the different parts of the shoe and to sew together the leather that made up the top, but the last and hardest part still had to be done by hand. Skilled shoemakers would shape the leather upper part of the shoe over a foot-shaped wooden mold called a last and then sew it onto the sole, or bottom, of the shoe. An expert shoe laster could make about fifty pairs of shoes a day. When [Jan] Matzeliger was thirty years old, he created a machine that could make 150 to 700 pairs a day…that’s fourteen times as many as a skilled person! …
Matzeliger’s shoe-lasting machine was so efficient that it cut the price of shoes in half after it went into production in 1885. Thanks to him, new shoes became much more affordable for average Americans. (http://www.ci.lynn.ma.us/aboutlynn_shoemaking_history.shtml)
The requirements for a pair of shoes that provides sufficient support and protection is described in the ChemMatters article “Make the Shoe Fit,” which focused more specifically on shoes for basketball players. The article included the diagram below, along with a description of each part, and the materials used to construct them.
46

A shoe has six basic parts: the upper (top part); the tongue; the outsole (which grips surfaces and provides traction); the insole and midsole (which are the core); and the last (the form on which the shoe is made).
The upper is usually leather or synthetic leather … and it has air holes or mesh for ventilation. Most have extra eyelets so the shoes can be laced in different ways to tighten around your ankle or the top of your foot.
Some basketball shoes do not have tongues; they slide on your foot like a sock. The important characteristics for the tongue, if present, are that it feels comfortable and does not slip or rub during play. As a result, the tongue usually has foam backing.
The outsole of the shoe is important in traction. The heel resists wearing because of the strength of the rubber, which has carbon fibers added. The rest of the shoe is usually softer rubber carved with grooves and bumps to provide grip.
The shock absorption and arch support come from the insole. It is made from EVA polymers (ethylene–vinyl acetate copolymers) or polyurethane. These polymers are foams that are spongy and cushion the foot as it hits the floor.
In the midsole of athletic shoes, air and gel chambers are added for more shock absorption. In the past, athletic shoes contained sealed pockets of pressurized air to absorb shock; however, if the pocket was punctured, the shoe lost its shock absorption ability. … Another shoe manufacturer, Fila, uses cells of air in a rubber-like polymer to provide the necessary cushioning. These cells are open, leaving them unpressurized, so the air doesn’t escape if a cell is ruptured. …
The shoe last is the form on which the shoe is made. A board-lasted shoe contains a fiberboard shape that is attached to the upper, making a moderately stiff and stable shoe. For a flexible shoe, the last is slipped out of the shoe after the parts are stitched together. Some shoes have a combination last: The last in the front is taken out after assembly, but the board in the heel remains in place.
With time and use, though, the parts of the shoe wear out. The EVA or polyurethane foam will pack down and lose some of its cushioning character. The leather uppers begin to stretch with the foot instead of supporting it. It’s important to replace worn-out shoes before you injure yourself.(Baxter, R. Make the Shoe Fit. ChemMatters 1999, 17 (1), pp 9–10)
In 2008, the American Chemical Society National Chemistry Week theme was titled “Having a Ball with Chemistry” and focused on sports. The Celebrating Chemistry newspaper included another illustration of the parts of a shoe and the materials used to make them.
47
(http://www.acs.org/content/dam/acsorg/education/whatischemistry/scienceforkids/articles/shoe-anatomy.pdf)
As seen in the description of some of the materials used, the properties of particular materials can be fine-tuned through chemistry to meet different needs. For example, it discusses controlling how rubber is made, to produce a harder or softer type of rubber.
More on “green” shoes
Nolte’s ChemMatters article focuses on the PUMA company’s efforts to use green chemistry principles to develop the PUMA Re-Suede shoes. Many other companies are also working to produce greener shoes, sports apparel, and many other products. For example, in its document “Shoe Industry Steps into Green Manufacturing,” the Daniel Green company, which makes slippers and casual shoes, discusses practices that it and other companies use. These
48

include the use of wind and solar energy in manufacturing; converting waste products into usable energy; energy conserving machinery; green and recycled textiles such as recycled wool, recycled polyester, PET, organic cotton, bamboo, and hemp; green packaging made of recycled and post-consumer paper with soy ink; and the donation of overstock and outdated shoes to organizations that can make use of them. (http://www.danielgreen.com/productcart/pc/Eco-Friendly-Footwear.asp)
The blog “Benvironment” discusses the availability of compostable shoes. These include shoes made by OneMoment, which claims their shoes biodegrade in six months. The blog describes these fairly thin shoes: “The design is apparently inspired by the indigenous peoples of the Amazon, who would paint the soles of their feet with natural latex for protection during the rainy season.” It also mentions OAT shoes: “The lining in the shoes is apparently embedded with saplings [actually a wildflower mix], so that soon after you’ve buried your stinky shoes in the soil they’ll turn into something rather lovely… whilst decomposing.” (http://benvironment.org.uk/post/23223454252/compostableshoes)
Part of the application of green chemistry principles can mean thinking about a process or product in a new way. Shoes themselves are being re-imagined, as this description of an “origami shoe” illustrates:
For hundreds of thousands of people around the world, shoes aren’t something to collect—they’re actually so cost-prohibitive people can’t afford a single pair. Supplying poverty-stricken countries with shoes has been the focus of many a humanitarian effort, but few have gone beyond the Santa Claus gifting mindset to actually change the way they’re made, distributed and priced around the world.
But a new project from Horatio Yuxin Han, a recent graduate of the Pratt Institute, and his professor Kevin Crowley, is totally re-imagining how shoes could be manufactured. Called Unifold, Han used the principles of origami to build a cheap and relatively sturdy pair of shoes.
From a single piece of ethylene vinyl acetate (foam rubber), people can cut out a pattern and fold it up into a wearable pair of shoes. This eliminates the need for the expensive machinery that’s usually required to produce footwear. “I tried to figure out how to make them with the simplest tool possible,” explains Han. “With the Unifold, all you need is die-cut machine and a die, and then you could start a production line.”
The idea is that by simplifying the process, it not only reduces cost, but it localizes production, too. Han says the original focus of the project was not necessarily humanitarian, though with a few design and material tweaks, it certainly could be. Rather, the goal was more holistic: replace traditional manufacturing with a process that makes shoes less expensive and more accessible for people everywhere. (http://www.wired.com/design/2013/09/can-this-origami-shoe-change-the-way-we-manufacture-footwear/)
The larger shoe companies are also making various changes to shoe designs. The article “Nike, Adidas, Puma, and rest in pursuit of ultimate sustainable shoe” from The Oregonian mentions several. (http://www.oregonlive.com/playbooks-profits/index.ssf/2012/02/post_3.html) In 2012, Nike introduced a “Flyknit” shoe, which has an upper portion made from what looks like mesh. The company says the new design “eliminates one of the main culprits in shoe waste: discarded cuttings. … [I]t reduces waste because the one-piece upper does not use the multiple materials and material cuts used in traditional sports footwear manufacture.” The article also mentions
49

Adidas, which with its “ForMotion soles,” has been able to “use 50 percent less material in production than for a typical sports shoe sole. The manufacturing processes also reduce or eliminate waste from other aspects of production.” It also mentions an overall benefit as shoes often become lighter through their re-designs: “And, as the entire sports footwear industry races to build a lighter running shoe, they're enjoying a side benefit in the process by reducing the fuel needed to ship the product to market. Several companies are reducing the sizes of the recyclable packaging for the same reason.”
Besides the shoes themselves, the processes used to make them are also undergoing green updates.
John Frazier, director of sustainable chemistry for Nike, offered another case study. But his company, in addition to creating a list of toxic substances to avoid actually went ahead and developed its own less toxic alternatives.
The first success story was environmentally preferred rubber. The company identified five chemicals in its original shoe rubber that are hazardous and worked to eliminate them.
In the original rubber, those five toxic chemicals made up 12 percent of the product by weight. The “green rubber” that Nike created has only one of the five chemicals in it, and that chemical makes up only 1 percent of the product by weight. …
The company was also successful in reducing zinc in its shoes. Using zinc meant emitting 340 grams of volatile organic compounds for every pair of shoes during the manufacturing process.
But Nike engineers discovered the zinc wasn’t really that essential to the shoes.
“It was there because it’s always been there,” said Frazier.
Nike engineers were able to remove 80 to 90 percent of the zinc in the shoe manufacturing process – reducing toxic emissions from 340 grams per pair in 1995 to 15 grams in 2006.
“It’s a huge difference,” Frazier said. “The consumer will never notice it, but the workers in the factories could tell the difference.”
It wasn’t easy to change those products, he said.
“These things are technical. You have to work with engineering teams. You have to make sure you don’t lose performance and make sure you don’t put yourself at a competitive disadvantage businesswise.” (http://www.opb.org/news/blog/ecotrope/replacing-toxic-products-with-green-chemistry/)
Many companies have made efforts to adjust some of their products to fit a greener viewpoint. However, although these efforts can create buzz among consumers and the media about green products and their benefits, the final decision about these products staying on the market comes down to consumers making actual purchases. Some products, although green, may be unpopular for other reasons and may not last long on the market. For example, Nike introduced the “Trash Talk” shoe in 2008. The upper portion of the shoe was made using pieces left over from the cutting of other shoes. Its life on the market was short-lived, surviving only
50
until 2009. As another example, Patagonia manufactured the “Sugar & Spice” shoe. At the end of its useful life, the pieces of the shoe could be disassembled, making recycling the parts easy.
[It] features components that snap together and use minimal glues or cement. There are a couple of reasons why it never quite took off, theorizes Les Horne, senior product manager of Patagonia’s footwear division and one of the designers behind the disassembling shoe. “It’s great to have an eco-friendly story,” he told Ecouterre over the phone, “but the bottom line is people buy shoes for the aesthetics.” The Sugar & Spice, he admits, is on the heavy side, and the fact that it isn’t feminine (or conversely, masculine) enough doesn’t boost its case. “We went for a more unisex style, instead of making two different molds,” he says.(http://www.ecouterre.com/patagonias-sugar-spice-a-disassembling-shoe-that-makes-recycling-a-snap/)
A final part of applying the green chemistry process is what to do with shoes when they have no useful life left for wearing as the original shoes. Recycling shoes to use their components and materials as something else can be difficult, due to the complications of separating out the multiple types of materials that make up a shoe. This can be helped by looking at shoe design at the start, to make changes with the end of the shoes in mind that allow them to be more easily recycled. A recycling system has also been developed that overcomes the difficulties:
[S]cientists at Loughborough University in the UK announced last week that they have created and trialled "the world’s first comprehensive system for separating and recovering useful materials from old footwear."
The recycling system was developed at the university's Innovative Manufacturing and Construction Research Centre, and is the end result of a 10-year research program.
The process begins with shoes being manually sorted into broad categories (such as "trainers"), and having metal components such as eyelets removed. They are then automatically shredded and granulated, ending up as tiny fragments. Those fragments are sorted according to material, using three main methods – cyclonic separation, zigzag separation, and vibrating tables.
In the cyclonic separation process, a tornado-like vortex of air is created within an enclosed cylindrical chamber. The lightest fragments are picked up by that vortex and carried out of the chamber through an outlet tube in the top, while heavier fragments remain behind on the bottom.
Next, in the zigzag separation process, fragments are fed into the top of an enclosed column, and fall to the bottom by "zig-zagging" back and forth between alternating sloping platforms. Along the way, jets of air blowing in from the sides push the lighter fragments off to other receptacles, allowing only the heavier ones to reach the bottom.
Finally, when mixed fragments are placed on a sieve-like screen built into a vibrating table, the vibrations cause the smaller fragments to fall through the gaps in the screen, with the larger ones remaining on top.
By the time they get to the end of the line, the shoe fragments are sorted into four material types: leather, foam, rubber and other materials. The leather fragments could then be used to create sheets of bonded leather (real leather mixed with synthetic); the foam could go into items such as carpet underlays; the rubber could be used either in
51

playground-surfacing materials or even in the soles of new shoes; and the mixed materials might find use as building insulation.
The university is now working with "major footwear manufacturers" to develop methods of designing footwear that would make it as recycling-friendly as possible. This could include using materials of very different densities, as doing so would make the separation process quicker and thus cheaper.(http://www.gizmag.com/shoe-recycling-system/29479)
You may already have come in contact with used and recycled Nike shoes. The company describes where you might find them:
Nike Reuse-a-Shoe takes worn out athletic shoes and grinds them down to create a new material called Nike Grind, which is used to make high-quality sports surfaces including courts, turf fields, tracks and more. Since 1990, we’ve transformed 28 million pairs of shoes and 36,000 tons of scrap material into Nike Grind for use in more than 450,000 locations around the world.(http://www.nike.com/us/en_us/c/better-world/stories/2013/05/reuse-a-shoe)
PUMA also invites consumers to drop off old clothes and shoes (its own brand or others) in “Bring Me Back” bins. PUMA describes what happens then: “Almost every item gets a new life, whether it is re-worn, up-cycled for industrial use, or recycled and turned into raw materials to produce new products.” (http://www.puma.com/bringmeback)
More on green chemistry
One way to view the move toward green chemistry would be to say it has flipped the focus for hazardous wastes. Instead of being concerned with how to deal with hazardous materials and waste—what to do with the pollution generated by the use of these hazardous materials, how waste can be cleaned up after it is generated, how to deal with those who violate disposal laws, etc., green chemistry considers hazardous materials before they are even used and works toward replacing them with more benign alternatives. Instead of trying to contain pollution that using a hazardous material generates, is there a different material that that could be used to avoid generating the pollution in the first place? Instead of trying to clean up hazardous waste, what could be used to reduce or eliminate the waste? Green chemistry thinks about the process at the start and how it could be changed to positively affect the end, rather than just cleaning up the end.
The April 2003 ChemMatters Teacher’s Guide discusses the history of the beginning of the “Green Chemistry movement”:
The movement really began with the Pollution Prevention Act of 1990. It became a formal focus of the Environmental Protection Agency in 1991. Although something like 100 laws had been passed prior to the passage of the 1990 Act, these laws addressed the issues related to the cleanup of hazardous wastes, limiting the spread of pollutants, and assessing fines or penalties for violators.
The act encouraged both industry and academia to develop new technologies that would avoid the use of hazardous materials, and technologies that would replace those consuming vital and diminishing resources with processes consuming renewable resources.(ChemMatters Teacher’s Guide. April 2003, p 12)
52

The American Chemical Society Green Chemistry Institute (ACS GCI) lists further key events in the history of green chemistry:
Early 1990’sGreen Chemistry gained its current standing as a scientific discipline as well as practical means to pollution prevention as the result of collaboration between the US government, Industry, and Academia. In the early 1990's, Paul Anastas, who was then the chief of the Industrial Chemistry Branch at the US EPA, moved forward the concept of Green Chemistry
Mid 1990'sPaul Anastas and John Warner developed the 12 Principles of Green Chemistry: a framework to help us think about how to prevent pollution when inventing new chemicals and materials. Paul Anastas and John Warner's work as founders of a new field called Green Chemistry, based on the productive collaboration of government and industry, was just beginning.
1993A white paper entitled "Chemistry for a Clean World," published by the European Community's Chemistry Council in June, attracted a great deal of attention in Europe.
1995President Bill Clinton established the Presidential Green Chemistry Challenge Awards to recognize chemical technologies that incorporate the principles of sustainable chemistry into chemical design, manufacture and use.
1996The first Presidential Green Chemistry Challenge Awards winners were announced. The awards increased awareness of Green Chemistry in industry and government by annually acknowledging individuals, groups, and organizations in academia, industry, and the government for their innovations in cleaner, cheaper, smarter chemistry. This remains the only award given by the President of the United States specifically for work in chemistry.
1997After more than a year of planning by individuals from industry, government, and academia, the Green Chemistry Institute (GCI) was incorporated in 1997 as a not-for-profit 501(c)3 corporation — devoted to promoting and advancing green chemistry.
1998John Warner and Paul Anastas published the seminal book Green Chemistry: Theory and Practice, which gave a precise definition to Green Chemistry and enumerated the Twelve Principles fundamental to the science. The definition and principles have become the generally accepted guidelines for Green Chemistry. Since it was first published, the book has been re-printed in several languages. …
2001GCI joined the American Chemical Society (ACS) in an increased effort to address global issues at the intersection of chemistry and the environment.
2006The International Union of Pure and Applied Chemistry formed a special subcommittee on Green Chemistry and launched a bi-annual international conference. The first was held in Germany, the second in Russia, and the 2010 conference was slated for Canada.
53

2007John Warner returned to industry to develop green technologies, partnering with Jim Babcock to found the first company completely dedicated to developing green chemistry technologies, the Warner Babcock Institute for Green Chemistry. The Institute was created with the mission to develop nontoxic, environmentally benign, and sustainable technological solutions for society.
Simultaneously, John Warner founded a non-profit foundation, Beyond Benign, to promote K-12 science education and community outreach.
2009In May 2009, President Barack Obama nominated Paul Anastas to lead the U.S. Environmental Protection Agency's (EPA's) Office of Research and Development. The nomination is a decisive achievement for the adoption and advancement of the principles of Green Chemistry.
TodayThe United States is just one of many countries that have green chemistry programs, centers, and educational initiatives. Others include Australia, China, Germany, India, Italy, the Netherlands, Spain, and the United Kingdom, to mention but a few.ACS Green Chemistry Institute (ACS GCI) (http://www.acs.org/content/acs/en/greenchemistry/about/green-chemistry-at-a-glance.html)
Paul Anastas, mentioned several times in the timeline above, including as one of the founders of green chemistry and co-author of the book that listed its twelve principles, published a related article “Design through the Twelve Principles of Green Engineering.” The twelve principles of green chemistry, as stated directly in the name, provide guidelines specific to chemistry. The principles of green engineering provide guidelines more related to the actual design process; for example, the design of the green shoes described in the Nolte article. The twelve principles of green engineering are:
Principle 1: Designers need to strive to ensure that all materials and energy inputs and outputs are as inherently nonhazardous as possible.
Principle 2: It is better to prevent waste than to treat or clean up waste after it is formed.
Principle 3: Separation and purification operations should be designed to minimize energy consumption and materials use.
Principle 4: Products, processes, and systems should be designed to maximize mass, energy, space, and time efficiency.
Principle 5: Products, processes, and systems should be “output pulled” rather than “input pushed” through the use of energy and materials.
Principle 6: Embedded entropy and complexity must be viewed as an investment when making design choices on recycle, reuse, or beneficial disposition.
Principle 7: Targeted durability, not immortality, should be a design goal.
Principle 8: Design for unnecessary capacity or capability (e.g., “one size fits all”) solutions should be considered a design flaw.
Principle 9: Material diversity in multicomponent products should be minimized to promote disassembly and value retention.
54

Principle 10: Design of products, processes, and systems must include integration and interconnectivity with available energy and materials flows.
Principle 11: Products, processes, and systems should be designed for performance in a commercial “afterlife.”
Principle 12: Material and energy inputs should be renewable rather than depleting.
(Anastas, P.T.; Zimmerman, J.B. Design Through the 12 Principles of Green Engineering. Environ. Sci. Technol. 2003, 37 (5), pp 94A–101A; see http://pubs.acs.org/doi/pdf/10.1021/es032373g)
As the green chemistry movement has progressed through history, its growth has been aided by developments within the field of chemistry. For example, even a ChemMatters Teacher’s Guide published 15 years ago notes back then:
The U.S. Environmental Protection Agency (EPA) introduced green chemistry as a formal focus area in 1991. The significant growth of green chemistry since then has been driven by
New knowledge of what is hazardous and what is innocuous, An ever-increasing ability of chemists to manipulate molecules to create only the
substances they want, and Dramatically increased costs of using and disposing of hazardous substances.
(ChemMatters Teacher’s Guide. December 1999, p 12)
How much more of an increase in knowledge and technology has been achieved since that writing!
Students may wonder about some of the specific benefits of applying the principles of green chemistry, rather than a generalized statement: “It helps health and the environment.” The U.S. Environmental Protection Agency describes some specific benefits:
Human health: Cleaner air: Less release of hazardous chemicals to air leading to less damage
to lungs Cleaner water: less release of hazardous chemical wastes to water leading to
cleaner drinking and recreational water Increased safety for workers in the chemical industry; less use of toxic materials;
less personal protective equipment required; less potential for accidents (e.g., fires or explosions)
Safer consumer products of all types: new, safer products will become available for purchase; some products (e.g., drugs) will be made with less waste; some products (i.e., pesticides, cleaning products) will be replacements for less safe products
Safer food: elimination of persistent toxic chemicals that can enter the food chain; safer pesticides that are toxic only to specific pests and degrade rapidly after use
Less exposure to such toxic chemicals as endocrine disruptors
Environment: Many chemicals end up in the environment by intentional release during use
(e.g., pesticides), by unintended releases (including emissions during manufacturing), or by disposal. Green chemicals either degrade to innocuous products or are recovered for further use
55

Plants and animals suffer less harm from toxic chemicals in the environment Lower potential for global warming, ozone depletion, and smog formation Less chemical disruption of ecosystems Less use of landfills, especially hazardous waste landfills
Economy and business: Higher yields for chemical reactions, consuming smaller amounts of feedstock to
obtain the same amount of product Fewer synthetic steps, often allowing faster manufacturing of products,
increasing plant capacity, and saving energy and water Reduced waste, eliminating costly remediation, hazardous waste disposal, and
end-of-the-pipe treatments Allow replacement of a purchased feedstock by a waste product Better performance so that less product is needed to achieve the same function Reduced use of petroleum products, slowing their depletion and avoiding their
hazards and price fluctuations Reduced manufacturing plant size or footprint through increased throughput Increased consumer sales by earning and displaying a safer-product label (e.g.,
DfE labeling) Improved competitiveness of chemical manufacturers and their customers.
(http://www2.epa.gov/green-chemistry/benefits-green-chemistry)
More on perfluorinated compounds
Looking deeper into the topic of long-chain fluorinated chemicals is made more difficult by the fact that these types of compounds are referred to by different names. Some terms include: perfluorinated chemicals, perfluorochemicals, perfluoroalkyls, perfluorinated alkyl acids, polyfluorinated chemicals, polyfluorinated compounds, polyfluoroalkyl substances. (http://www.niehs.nih.gov/health/materials/perflourinated_chemicals_508.pdf) Perfluorinated compounds as a group are succinctly described in the book Polyfluorinated Chemicals and Transformation Products, including their properties, uses in products, and the current state of knowledge about their use.
Perfluorinated compounds are a chemical family of all organic compounds consisting of a carbon backbone fully surrounded by fluorine and represent a large and complex group of organic substances with unique characteristics. They are used in several industrial branches, but they also occur in a large range of consumer products. Because of their extraordinary properties such as chemically inert, non-wetting, very slippery, nontoxic, nonstick, highly fire resistant, very high-temperature ratings, highly weather resistant, they are applied in fluoropolymer-coated cookware, sports clothing, extreme weather-resistant military uniforms, food handling equipment, medical equipment, motor oil additives, fire fighting foams, paint and ink as well as water-repellent products. Currently, the knowledge of the exact chemical compositions in articles and preparations of perfluorinated compounds is very limited. Since the exact composition of perfluorinated compounds in consumer products is mostly confidential, a range of analytical studies concerning the content of perfluorinated compounds in consumer products have been carried out over the past years with the intention to better understand the intentional and residual content and release of fluorinated substances from consumer products and their impact to health and the environment.
56

(Posner, S. (2012). Perfluorinated Compounds: Occurrence and Uses in Products. In T.P. Knepper & F.T. Lange (Eds.), Polyfluorinated Chemicals and Transformation Products, Springer, p 25. See http://link.springer.com/chapter/10.1007/978-3-642-21872-9_2 - page-1)
Exposure to these compounds is thought to happen through contact with products that use them and through water or food that has been contaminated with the compounds. There are conflicting reports over their potential effects on the human body. A fact sheet produced by the National Institute of Environmental Health Sciences (part of the National Institutes of Health, U.S. Department of Health and Human Services) discusses these issues:
There is widespread wildlife and human exposure to several PFCs [perfluorinated chemicals], including perfluorooctanoic acid (PFOA) and perfluorooctane sulfonate (PFOS). Both PFOA and PFOS are byproducts of other commercial products, meaning they are released into the environment when other products are made, used, or discarded. PFOS is no longer manufactured in the United States, and PFOA production has been reduced and will soon be eliminated. More research is needed to fully understand all sources of human exposure, but people are most likely exposed to these compounds by consuming PFC-contaminated water or food, or by using products that contain PFCs. Unlike many other persistent chemicals, PFCs are not stored in body fat. However, PFCs are similar to other persistent chemicals, because the half-life, or the amount of time it takes for 50% of the chemical to leave the human body, for some of these chemicals, is several years. This slow elimination time makes it difficult to determine how changes in lifestyle, diet, or other exposure-related factors influence blood levels.
In animal studies, some PFCs disrupt normal endocrine activity; reduce immune function; cause adverse effects on multiple organs, including the liver and pancreas; and cause developmental problems in rodent offspring exposed in the womb. Data from some human studies suggests that PFCs may also have effects on human health, while other studies have failed to find conclusive links. Additional research in animals and in humans is needed to better understand the potential adverse effects of PFCs for human health.(http://www.niehs.nih.gov/health/materials/perflourinated_chemicals_508.pdf)
The company W.L. Gore & Associates, the developers of GORE-TEX fabrics, describe the relation of these compounds to the clothing products they manufacture and their move toward greener chemicals.
All GORE-TEX® garments have an ultra-thin treatment called DWR - a durable water repellent polymer - applied to the outermost fabric layer so that water beads up and rolls off rather than soaking in.
State-of-the-art treatments are based on fluorocarbons because they provide a combination of stain and water repellence with high breathability and durability. Treatments that do not contain fluorinated compounds like Silicone or Polyolefine based treatments typically lack one of these properties, either resulting in lower comfort or requiring more frequent water repellent treatment by the consumer. This is why developing a PFC-free DWR is a challenge for the whole industry.
Gore has been using PFOA-free water repellents since 2011. They are made with perfluorinated molecules that have shorter carbon chains (C6 or shorter) than the long-chain structure (C8 to C12) that was typically used in PFOA-related DWRs.
57

Short-chain repellents (including possible break down products/impurities) have proven to have a better toxicological and environmental profile compared to long-chain chemistry, although they are also stable in the environment.(http://www.gore-tex.com/remote/Satellite?blobcol=urldata&blobheader=application%2Fpdf&blobkey=id&blobtable=MungoBlobs&blobwhere=1289379069326&ssbinary=true)
What does the future hold? Even though certain companies are making moves to reduce or eliminate the use of these compounds, there is no quick fix because of the persistence of the chemicals themselves. “In any case, this is unlikely to be the last people will be hearing about PFCs. Even if their production ceased today, they'd still be around in the environment for many decades or longer. And while their production is being phased out in many parts of the world, PFOS production has increased dramatically in China since 2003. Many other PFCs remain in commercial use worldwide.” (http://www.theatlantic.com/health/archive/2012/01/pfcs-from-food-wrappers-could-reduce-effectiveness-of-vaccines/252044/)
Connections to Chemistry Concepts (for correlation to course curriculum)
1. Green Chemistry—The April 2003 ChemMatters Teacher’s Guide casts a wide net in relation to the connection of green chemistry to the curriculum, stating, “Since the topic of Green Chemistry is so general, it can connect to virtually anything that might be included in a typical curriculum, depending on the specific process being examined. It clearly and strongly connects to the topics of atoms, reactions, solvents, energy, catalysis, pollution, and renewable and nonrenewable resources, all of which are probably covered in most high school courses.” (ChemMatters Teacher’s Guide. April 2003, p 16)
2. Polarity—The discussion of long-chain fluorinated chemicals includes information about their polarity in contrast to that of water.
3. Bonding—The discussion of long-chain fluorinated chemicals also touches on the idea of bonding, including the strength of particular bonds, such as the carbon–fluorine bond.
Possible Student Misconceptions (to aid teacher in addressing misconceptions)
1. “Green chemistry has nothing to do with my life.” Decisions you make have an impact and can be related to the principles of green chemistry. For example, similar to the author of the ChemMatters article, you decide which shoes, clothing, and other items to purchase. Your decisions could be at least partially based on whether the manufacturers are attempting to follow the principles of green chemistry. Your decisions about disposing of items can also make a difference, for example, are there items you can recycle? Do certain items, such as batteries and electronics, need to be disposed of in a special way? A past ChemMatters article also points out that decisions you and your teacher make in the classroom chemistry laboratory can be related to green chemistry: “What chemicals do we need? (Are they safe? Expensive? Can we use less and still get good results?) What solvent should we use? (Again, is it safe? Will water work as well?) How shall we heat the reaction vessel? (Will it go just as well at room temperature if we wait? Hot plate? Bunsen Burner? Microwave?) And what should we do with the wastes that accumulate? (Down the
58

drain? In the trash can?)” (La Merrill, M.; Parent, K.; Kirchhoff, M. Green Chemistry—Stopping Pollution Before It Starts. ChemMatters 2003, 21 (2), p 7)
2. “A company wouldn’t use something that’s really harmful when they’re making a product.” Decisions companies make have to balance many inputs—what works best to make a product, what is cost-effective, plus possible consideration of what can reduce or eliminate effects on the environment and health. Sometimes what works best is not the most benign compound to use in terms of effects on the environment. We also continue to learn more about the hazards of different compounds, about new compounds to use, and about how to adjust manufacturing processes so they are “greener.”
Anticipating Student Questions (answers to questions students might ask in class)
1. “How can I tell whether something I want to buy is made in a green way?” It can be difficult to tell. For example, for the article, Nolte looked for information about PUMA Re-Suedes to see how many of the 12 Principles of Green Chemistry the shoe design met. She had to include question marks for several of the principles because some information is just not available to consumers. Promotional information included with the product or on the company’s Web site is a natural place to start. Additional internet searches can provide more information but can only go so far.
2. “What is ‘greenwashing’?” Greenwashing is the practice of a company falsely presenting itself and/or its products as being more environmentally-friendly than they actually are. Claiming that something is supposedly “green” is one way to hype a product; we may need to dig deeper to find out what “green” really means in a situation.
3. “Do green products cost more?” Green products can cost more. Sometimes the materials or processes used to make them greener cost more than typical methods. It can vary greatly, depending on the product; cost differences can range from large to small or non-existent. Nolte mentions that the PUMA Re-Suedes cost $70 a pair; this is comparable to other shoes.
In-class Activities (lesson ideas, including labs & demonstrations)
1. Students could have a taste of making choices based on green chemistry principles by using the laboratory experiment “Green Energy—It’s Your Decision.” They collect data to calculate the efficiency of each of three methods used to heat water (Bunsen burner, an electric hot plate, and a microwave oven). They use information on efficiency, dollar cost, and environmental cost to “make a recommendation on how best to minimize the energy used to heat substances in your school lab.” (Green Energy—It’s Your Decision. ChemMatters 2003, 21 (2), pp 8–9)
2. Students can take a closer look at shoe construction as they transform a used pair of their shoes into a slip-on sandal version using instructions online. They could discuss how this further use of the shoes does/does not support green chemistry principles. (http://www.instructables.com/id/DIY-Slip-On-Sandals-from-Old-Shoes/?ALLSTEPS)
3. Print out eye-catching green chemistry bookmarks from the U.S. Environmental Protection Agency for students to use. One side of the bookmark lists the 12 principles of green chemistry. (http://www2.epa.gov/sites/production/files/documents/green-chemistry-bookmarks-4page.pdf)
59

4. A vitamin C clock reaction experiment uses only household materials and leads students to consider the idea of risk, especially in relation to the use of a chemical substance. It addresses the green chemistry principle of using safer starting materials for a process. (“Getting Off to a Safe Start,” Introduction to Green Chemistry: Instructional Activities for Introductory Chemistry. Washington, DC: American Chemical Society, 2002, pp 5–11; see http://www.beyondbenign.org/professional/community_college/Vitamin C Clock.pdf)
5. Several examples of interactive displays that illustrate green chemistry to use at educational science expos are described. For example, visitors compare cellulose-based packing peanuts with polystyrene peanuts. (http://www.acs.org/content/dam/acsorg/greenchemistry/education/resources/green-chemistry-interactive-displays.pdf)
Out-of-class Activities and Projects (student research, class projects)
1. Students could research how the PUMA Re-Suede shoes meet the six of the twelve green chemistry principles mentioned in the article and the “Student Questions” section (#8) above. In addition, students could consider any other consumer product, and research and analyze whether/how it meets any of the twelve green chemistry principles.
2. Students and instructors could work together to select a demonstration or experiment currently used in the chemistry classroom and analyze it to suggest ways it could be made “greener.” This could be done with everyday activities outside of the classroom as well. The April 2003 ChemMatters Teacher’s Guide describes one example to modify to make it more green: “We cut our grass in the summer and then dispose of the clippings. Later we go to the local nursery and purchase fertilizer for our garden instead of composting the grass clippings and using them in place of the fertilizer.” (ChemMatters Teacher’s Guide. April 2003, p 16)
3. American Chemical Society (ACS) student chapters on the university level are encouraged to work toward the “Green Chemistry Student Chapter Award” by participating in at least three green chemistry activities during the school year. Multiple ideas for activities are available at http://www.acs.org/content/acs/en/funding-and-awards/awards/gci/greensa.html and could be adapted for high school chemistry clubs or classes.
60
The references below can be found on the ChemMatters 30-year CD (which includes all
articles published during the years 1983 through April
2013 and all available Teacher’s Guides). The CD is in production and will be available from the
American Chemical Society at this site: http://ww.acs.org/chemmatters.Selected articles and the complete set of
Teacher’s Guides for all issues from the past three years are also available free online on the same
site. (The complete set of ChemMatters articles and Teacher’s Guides are available on the 30-year CD for all past issues, (up to April 2013.)
Some of the more recent articles (2002 forward) may also be available online at the link above. Simply click on the “Past Issues” button directly below the “M” in the ChemMatters logo at the top of the Web page. If the article is available online, you will find it there.
30 Years of ChemMatters !
References (non-Web-based information sources)
The almost-20-year-old ChemMatters article “PET Recycling” discusses the recycling of polyethylene terephthalate (PET) from used soda bottles to create products such as clothing and shoes. (Plummer, C. PET Recycling. ChemMatters 1994, 12 (3), pp 7–9)
The ChemMatters article “Green Chemistry—Benign by Design” briefly discusses green chemistry, and then describes three products/processes that won Presidential Green Chemistry Challenge Awards. (Ryan, M.A. Green Chemistry—Benign by Design. ChemMatters 1999, 17 (4), pp 9–11)
The ChemMatters article “Green Chemistry—Stopping Pollution Before It Starts” summarizes green chemistry and relates it to decisions made in both a student’s life and in industry. (La Merrill, M.; Parent, K.; Kirchhoff, M. Green Chemistry—Stopping Pollution Before It Starts. ChemMatters 2003, 21 (2), pp 7, 10)
The ChemMatters article “Biomimicry—Where Chemistry Lessons Come Naturally” discusses several examples of how researchers have taken examples from nature as inspiration for greener chemistry methods. (Parent, K.E.; Young, J.L. Biomimicry—Where Chemistry Lessons Come Naturally. ChemMatters 2006, 24 (2), pp 15–17)
A ChemMatters interview with an environmental and sustainability chemist at Nike highlights the role of chemists at the company, particularly in connection with designing and producing “greener” shoes. (Brownlee, C. The Swoosh Goes Green: Interview with John
61

Frazier, Environmental and Sustainability Chemist at Nike. ChemMatters 2008, 26 (3), pp 18–19)
Web Sites for Additional Information (Web-based information sources)
More sites on shoe manufacture and design
Information on the history of how shoes have been made, along with multiple illustrations, is available here: http://www.shoeinfonet.com/about shoes/history/history your shoes/history your shoes.htm.
A “History of the Athletic Shoe” infographic shows many of the steps on the road of the development of shoes, from the earliest shoes to running shoes to minimalist shoes. (http://visual.ly/history-athletic-shoe)
This company focuses on constructing shoes (mostly by hand) to the individual’s unique specifications rather than mass-produced shoes, but the video provides an overview of the general steps of the shoe-making process. (http://www.youtube.com/watch?v=JfmBTXLg5wc)
An Engineering and Physical Sciences Research Council (EPSRC) video shows a system that can be used to recycle the materials from old shoes and describes its development. (http://www.youtube.com/watch?v=uAH0K7porxw - t=49)
A Red Wing Shoes employee describes the making and use of molds to create the soles of shoes. (http://www.redwingshoes.com/red-wing-video-sole-molds)
3D printing is mentioned in this article as a method for producing shoe features that would normally not be able to be easily manufactured using ordinary processes. (http://www.shapeways.com/blog/archives/1938-nike-use-3d-printing-to-manufacture-the-vapor-laser-talon-football-shoe.html)
A blogger describes a project-based learning experience centering on shoe design and the ability to view and solve problems in a new way. (http://www.edutopia.org/blog/design-thinking-opportunity-problem-solving-suzie-boss)
The Tread Project is described as “a 7 week experimental design studio which aims to educate and inspire students with creative problem solving skills through the vehicle of footwear design.” (http://vimeo.com/treadproject)
Learn about high school art students who entered a national competition, designing Vans-brand shoes. (http://pbcommercial.com/sections/accent/features/star-city-high-school-art-2-students-design-shoes-2013-vans-custom-culture)
More sites on “green” shoes
The Nike company discusses its choices in materials and design, and their relation to green chemistry. (http://www.nikeresponsibility.com/report/content/chapter/chemistry)
62

Artificial “eco-leather” that can be used in shoe manufacture is in development. The professor mentioned at this site eventually won a 2013 Presidential Green Chemistry Challenge Award for his work. (http://www.acs.org/content/acs/en/pressroom/newsreleases/2013/june/green-eco-leather-could-revolutionize-fashion-industry.html)
A paper for a university-level course “Sustainability Science” provides a “Sustainability Assessment of Nike Shoes.” (http://www.uvm.edu/~shali/pdf.pdf)
The PUMA company uses packaging for its shoes and products that fits the green chemistry mindset. Instead of a typical shoebox, they use a reusable shoe bag. (http://www.puma.com/cleverworld/cleverlittlepackaging)
More sites on green chemistry
The American Chemical Society Green Chemistry Institute quotes the twelve principles of green chemistry as laid out by Anastas and Warner. Each principle is then linked to a short contribution by a green chemistry expert; these pieces were published once each month in 2013. (http://www.acs.org/content/acs/en/greenchemistry/about/principles/12-principles-of-green-chemistry.html)
The American Chemical Society Green Chemistry Institute offers downloadable “Green Chemistry Pocket Guides” that concisely summarize green chemistry and its guiding principles. One guide is designed for scientists, science students, and professors, the other for the general public. (http://www.acs.org/content/acs/en/greenchemistry/education/resources/green-chemistry-pocket-guides.html)
The U.S. Environmental Protection Agency has produced the video “Green Chemistry for a Sustainable and Healthy Economy.” It describes green chemistry, examples of how and where it has been used, and its benefits. (http://www.youtube.com/watch?v=rIE4T2HLW7c)
A listing of the Presidential Green Chemistry Challenge Award winners is available online, along with technology summaries and for some of the winners, podcasts. (http://www2.epa.gov/green-chemistry/presidential-green-chemistry-challenge-winners)
For a more advanced reader, three green chemistry case studies help to link green chemistry technology to the business side of the developments. The case studies focus on 2012 winners of the Presidential Green Chemistry Challenge Awards. (http://www.acs.org/content/acs/en/greenchemistry/industriainnovation/business-case-studies-pgcca-winners.html)
A Chemical & Engineering News article “Honoring Green Chemistry” highlights the 2013 winners of the Presidential Green Chemistry Challenge Awards. One of the winners, Richard P. Wool, has made materials useful to shoe manufacture. (http://cen.acs.org/articles/91/i50/Honoring-Green-Chemistry.html)
More sites on perfluorinated compounds
The National Institute of Environmental Health Services offers a fact sheet on perfluorinated chemicals. It includes information on what they are, studies that are being done,
63

and how to avoid exposure. (http://www.niehs.nih.gov/health/materials/perflourinated_chemicals_508.pdf)
A Huffington Post article discusses research on potential effects that perfluorinated compounds can have on the human body. (http://www.huffingtonpost.com/2013/07/18/pfc-thyroid-functioning-women-perfluorinated-chemicals_n_3606398.html)
A Bloomberg Businessweek article focuses on plans shoe and clothing manufacturers have made to eliminate the use of certain chemicals. Perfluorinated compounds are mentioned. (http://www.businessweek.com/news/2013-06-18/clothing-shoe-makers-plan-out-route-to-safer-chemicals-by-2020)
More Web Sites on Teacher Information and Lesson Plans (sites geared specifically to teachers)
A 2010 ACS/NSTA Web seminar focused on green chemistry. Presenters Michael Tinnesand and Barbara Sitzman described how and why green chemistry can be integrated into the classroom, with examples of activities and other resources. (http://learningcenter.nsta.org/products/symposia_seminars/ACS/webseminar2.aspx)
Beyond Benign offers a collection of high school lesson plans centering on green chemistry. (http://www.beyondbenign.org/K12education/highschool.html)
The University of Oregon has a database of chemistry education materials for teaching green chemistry, called “Greener Education Materials for Chemists” (GEMs). The database is searchable by keyword and/or category. (http://greenchem.uoregon.edu/Pages/Search.php)
64

It’s Not Easy Being Green… Or Is It?
Background Information (teacher information)
More on life cycle analysis
Author Tinnesand describes life cycle analysis (LCA) this way: “LCA examines every part of the production, use, and final disposal of a product.” A slightly more detailed definition from the Environmental Protection Agency (EPA) may shed more light on the subject.
Life cycle assessment is a “cradle-to-grave” approach for assessing industrial systems. “Cradle-to-grave” begins with the gathering of raw materials from the earth to create the product and ends at the point when all materials are returned to the earth. LCA evaluates all stages of a product’s life from the perspective that they are interdependent, meaning that one operation leads to the next. LCA enables the estimation of the cumulative environmental impacts resulting from all stages in the product life cycle, often including impacts not considered in more traditional analyses (e.g., raw material extraction, material transportation, ultimate product disposal, etc.). By including the impacts throughout the product life cycle, LCA provides a comprehensive view of the environmental aspects of the product or process and a more accurate picture of the true environmental trade-offs in product and process selection.
The term “life cycle” refers to the major activities in the course of the product’s life-span from its manufacture, use, and maintenance, to its final disposal, including the raw material acquisition required to manufacture the product. Exhibit 1-1 illustrates the possible life cycle stages that can be considered in an LCA and the typical inputs/outputs measured.
65

(Scientific Applications International Corporation. Life Cycle Analysis: Principles and Practice. EPA/600/R-06/060, May 2006, p 1, http://www.epa.gov/nrmrl/std/lca/lca.html) Scroll down and click on “LCA 101 document (PDF)” tab, then choose your download method at upper right of new screen; or select individual chapters to download.)
And this definition from another EPA publication provides a bit more information about the LCA’s importance and more details about the process.
Life-cycle assessment (LCA) is a systems-based approach to quantifying the human health and environmental impacts associated with a product's life from “cradle to grave.” A full LCA addresses all stages of the product life-cycle and should take into account alternative uses as well as associated waste streams, raw material extraction, material transport and processing, product manufacturing, distribution and use, repair and maintenance, and wastes or emissions associated with a product, process, or service as well as end-of-life disposal, reuse, or recycling. In some cases, LCA is applied with restricted boundaries, such as “cradle to [loading] gate.” Environmental footprint analysis … is a type of bounded LCA.
LCA typically return two specific types of information: • A comprehensive life-cycle inventory of relevant energy and material inputs and
environmental releases throughout the system. • Estimates of the resulting impacts for a wide range of impact categories including
global climate change, natural resource depletion, ozone depletion, acidification, eutrophication, human health, and ecotoxicity.
This information allows an analyst to consider multiple parts of a system and multiple environmental endpoints in developing effective policies.(U.S. EPA. Sustainability Analytics: Assessment Tools & Approaches. March 7, 2013, p 76, http://www.epa.gov/sustainability/analytics/docs/sustainability-analytics.pdf)
The International Organization for Standardization, (ISO) (more on this organization later) contains a specific standard for LCAs. There are four major steps in an LCA study, as described in ISO’s Standard 14040:
The LCA process is a systematic, phased approach and consists of four components: goal definition and scoping, inventory analysis, impact assessment, and interpretation as illustrated in Exhibit 1-2:1. Goal Definition and Scoping - Define and describe the product, process or activity. Establish the context in which the assessment is to be made and identify the boundaries and environmental effects to be reviewed for the assessment.2. Inventory Analysis - Identify and quantify energy, water and materials usage and environmental releases (e.g., air emissions, solid waste disposal, waste water discharges).
66

3. Impact Assessment - Assess the potential human and ecological effects of energy, water, and material usage and the environmental releases identified in the inventory analysis. 4. Interpretation - Evaluate the results of the inventory analysis and impact assessment to select the preferred product, process or service with a clear understanding of the uncertainty and the assumptions used to generate the results.(Scientific Applications International Corporation. Life Cycle Analysis: Principles and Practice. EPA/600/R-06/060, May 2006, p 2,
http://www.epa.gov/nrmrl/std/lca/pdfs/chapter1_frontmatter_lca101.pdf)
Life cycle analyses may seem like a panacea for all problems environmental but, in truth, any life cycle must, of necessity, establish limitations or boundaries beyond which it does not purport to go.
Limitations of Conducting an LCA
Performing an LCA can be resource and time intensive. Depending upon how thorough an LCA the user wishes to conduct, gathering the data can be problematic, and the availability of data can greatly impact the accuracy of the final results. Therefore, it is important to weigh the availability of data, the time necessary to conduct the study, and the financial resources required against the projected benefits of the LCA.
LCA will not determine which product or process is the most cost effective or works the best. Therefore, the information developed in an LCA study should be used as one component of a more comprehensive decision process assessing the trade-offs with cost and performance, e.g., Life Cycle Management.
(Scientific Applications International Corporation. Life Cycle Analysis: Principles and Practice. EPA/600/R-06/060, May 2006, p 5, http://www.epa.gov/nrmrl/std/lca/pdfs/chapter1_frontmatter_lca101.pdf)
LCA is a very complete (and usually very complex) method of evaluating the environmental impact an object or a process has. Many other, mostly simpler, processes that
67

are related to LCA can be and are being used by industries and governments to accomplish similar goals. Here is a list of some of them.
Benefit-cost analysis Eco-efficiency analysis Life cycle inventory Ecosystem service valuation Green accounting Environmental justice analysis Health impact assessment Social impact assessment Social network analysis Chemical alternatives assessment Environmental footprint analysis
Exposure assessment Green accounting Green chemistry -- Inherent property
analysis Green engineering Integrated assessment modeling Life cycle assessment Resilience analysis Human health risk assessment Risk assessment Sustainability impact assessment Collaborative problem-solving
The source below provides background information on each of the methods, including: how each method can contribute to sustainability; what the main steps in each method are; what the strengths and limits of each method are, in a sustainability context; how the analyses obtained from each method are used to support EPA decision-making; where to find more information on each method; and illustrative approaches applying each method. (U.S. EPA. Sustainability Analytics: Assessment Tools and Approaches, March 7, 2013, pp 24–92, http://www.epa.gov/sustainability/analytics/docs/sustainability-analytics.pdf)
More on ISO
The International Organization for Standardization (ISO) has developed sets of standards which are used globally by countries. These standards involve procedures by business, government and society. Life cycle analyses are just a small (but important) part of the work ISO does. More than 160 countries participate in ISO standardization processes. Each country has its own standards organization that communicates and partners with ISO. The organization in the United States playing this role is ANSI, The American National Standards Institute.
ISO, the International Organization for Standardization, is the world authority on production and processing standards used by more than 160 countries around the world. These standards involve procedures by businesses, governments and societies. Each country has its own standards organization that communicates and partners with ISO. The organization in the United States playing this role is ANSI, The American National Standards Institute.
According to the ISO Web site,
ISO (International Organization for Standardization) is the world’s largest developer of voluntary International Standards. International Standards give state of the art specifications for products, services and good practice, helping to make industry more efficient and effective. Developed through global consensus, they help to break down barriers to international trade.
ISO develops International Standards. We were founded in 1947, and since then have published more than 19 500 International Standards covering almost all aspects of
68

technology and business. From food safety to computers, and agriculture to healthcare, ISO International Standards impact all our lives.http://www.iso.org/iso/home/about.htm
Life cycle analyses are just a small (but important) part of the work ISO does. It has developed a series of standards, ISO 14000, which addresses the management of the environment. Part of this stewardship process involves life cycle analysis.
Graphics are often used to simplify life cycle analysis results for the consumer. Here are a few graphics that depict life cycle analyses, or the impact of these analyses.
This graphic illustrates the usual steps in a life cycle analysis: resource extraction, material processing, product manufacture, distribution, use and end of life/recycle/reuse:(http://
www.claritycommunicationsconsulting.com/wp-content/uploads/2011/10/LCA.png)
69
This graphic visually compares environmental factors involved in the manufacture and use of incandescent bulbs (Inc) vs. compact fluorescent lamps (CFL) vs. two different types of light emitting diode bulbs (LED). It compares resource use, atmospheric, water and land impacts of each. There is a LOT of information contained in this graphic.
(http://www.ecobuildtrends.com/2012_06_01_archive.html)
This graphic compares the carbon footprint of The Xlerator® hand-dryer, a standard electric dryer, paper towels and 100% recycled paper towels against the 5 major steps in a life cycle analysis. (The Xlerator® wins.)
70
(http://www.exceldryer.com/PressKit/Green.php)

More on the history of life cycle analysis (LCA)
Life cycle analysis is a relatively new phenomenon, being only about 50 or so years old.
A Brief History of Life-Cycle Assessment
Life Cycle Assessment (LCA) had its beginnings in the 1960’s. Concerns over the limitations of raw materials and energy resources sparked interest in finding ways to cumulatively account for energy use and to project future resource supplies and use. In one of the first publications of its kind, Harold Smith reported his calculation of cumulative energy requirements for the production of chemical intermediates and products at the World Energy Conference in 1963.
Later in the 1960’s, global modeling studies published in The Limits to Growth (Meadows et al 1972) and A Blueprint for Survival (Goldsmith et al 1972) resulted in predictions of the effects of the world’s changing populations on the demand for finite raw materials and energy resources. The predictions for rapid depletion of fossil fuels and climatological changes resulting from excess waste heat stimulated more detailed calculations of energy use and output in industrial processes. During this period, about a dozen studies were performed to estimate costs and environmental implications of alternative sources of energy.
In 1969, researchers initiated an internal study for The Coca-Cola Company that laid the foundation for the current methods of life cycle inventory analysis in the United States. In a comparison of different beverage containers to determine which container had the lowest releases to the environment and least affected the supply of natural resources, this study quantified the raw materials and fuels used and the environmental loadings from the manufacturing processes for each container. Other companies in both the United States and Europe performed similar comparative life cycle inventory analyses in the early 1970’s. At that time, many of the available sources were derived from publicly-available sources such as government documents or technical papers, as specific industrial data were not available.
The process of quantifying the resource use and environmental releases of products became known as a Resource and Environmental Profile Analysis (REPA), as practiced in the United States. In Europe, it was called an Ecobalance. With the formation of public interest groups encouraging industry to ensure the accuracy of information in the public domain, and with the oil shortages in the early 1970’s, approximately 15 REPAs were performed between 1970 and 1975. Through this period, a protocol or standard research methodology for conducting these studies was developed. This multistep methodology involves a number of assumptions. During these years, the assumptions and techniques used underwent considerable review by EPA and major industry representatives, with the result that reasonable methodologies were evolved.
From 1975 through the early 1980’s, as interest in these comprehensive studies waned because of the fading influence of the oil crisis, environmental concerns shifted to issues of hazardous and household waste management. However, throughout this time, life cycle inventory analysis continued to be conducted and the methodology improved through a slow stream of about two studies per year, most of which focused on energy requirements. During this time, European interest grew with the establishment of an Environment Directorate (DG X1) by the European Commission. European LCA practitioners developed approaches parallel to those being used in the USA. Besides working to standardize pollution regulations throughout Europe, DG X1 issued the Liquid Food Container Directive in 1985, which charged member companies with monitoring the
71

energy and raw materials consumption and solid waste generation of liquid food containers.
When solid waste became a worldwide issue in 1988, LCA again emerged as a tool for analyzing environmental problems. As interest in all areas affecting resources and the environment grows, the methodology for LCA is again being improved. A broad base of consultants and researchers across the globe has been further refining and expanding the methodology. The need to move beyond the inventory to impact assessment has brought LCA methodology to another point of evolution (SETAC 1991; SETAC 1993; SETAC 1997).
In 1991, concerns over the inappropriate use of LCAs to make broad marketing claims made by product manufacturers resulted in a statement issued by eleven State Attorneys General in the USA denouncing the use of LCA results to promote products until uniform methods for conducting such assessments are developed and a consensus reached on how this type of environmental comparison can be advertised non-deceptively. This action, along with pressure from other environmental organizations to standardize LCA methodology, led to the development of the LCA standards in the International Standards Organization (ISO) 14000 series (1997 through 2002).
In 2002, the United Nations Environment Programme (UNEP) joined forces with the Society of Environmental Toxicology and Chemistry (SETAC) to launch the Life Cycle Initiative, an international partnership. The three programs of the Initiative aim at putting life cycle thinking into practice and at improving the supporting tools through better data and indicators. The Life Cycle Management (LCM) program creates awareness and improves skills of decision-makers by producing information materials, establishing forums for sharing best practice, and carrying out training programs in all parts of the world. The Life Cycle Inventory (LCI) program improves global access to transparent, high quality life cycle data by hosting and facilitating expert groups whose work results in web-based information systems. The Life Cycle Impact Assessment (LCIA) program increases the quality and global reach of life cycle indicators by promoting the exchange of views among experts whose work results in a set of widely accepted recommendations.(Scientific Applications International Corporation. Life Cycle Analysis: Principles and Practice. EPA/600/R-06/060, May 2006, http://www.epa.gov/nrmrl/std/lca/pdfs/chapter1_frontmatter_lca101.pdf)
More on “life cycle thinking”
Life cycle thinking is a way of thinking about things we use in a totally holistic way, and it is a natural follow-up to life cycle analysis.
Life Cycle Thinking (LCT) seeks to identify possible improvements to goods and services in the form of lower environmental impacts and reduced use of resources across all life cycle stages. This begins with raw material extraction and conversion, then manufacture and distribution, through to use and/or consumption. It ends with re-use, recycling of materials, energy recovery and ultimate disposal.
The key aim of Life Cycle Thinking is to avoid burden shifting. This means minimising impacts at one stage of the life cycle, or in a geographic region, or in a particular impact category, while helping to avoid increases elsewhere. For example, saving energy during the use phase of a product, while not increasing the amount of material needed to provide it. …
Why take a life cycle approach?
72

For many years, reducing environmental impacts focused on production processes, treatment of waste and effluent streams. This remains important. These actions help, for example, to successfully address the issues of reducing air and water pollution from a specific operation. However, this does not necessarily reduce the negative environmental impacts related to the consumption of materials and resources. It also does not account for the shifting of burdens – solving one problem while creating another. Solutions therefore may not be optimal and may even be counter-productive.
A win-win situationLife Cycle Thinking can help identify opportunities and lead to decisions that help
improve environmental performance, image, and economic benefits. This approach demonstrates that responsibility for reducing environmental impacts is being taken. Looking at the bigger picture: Businesses do not always consider their supply chains or the ‘use’ and ‘end-of-life’ processes associated with their products. Government actions often focus on a specific country or region, and not on the impacts or benefits that can occur in other regions or that are attributable to their own levels of consumption.
In both cases, without consideration of the full life cycle of goods and services (supply/use/end-of-life), the environment suffers – resulting in poorer financial performance and higher potential for reputation damage.
Life Cycle Thinking provides a broader perspective. As well as considering the environmental impacts of the processes within our direct control, attention is also given to the raw materials used, supply chains, product use, the effects of disposal and the possibilities for re-use and recycling.(The Joint Research Center from the European Commission Web page: http://lct.jrc.ec.europa.eu/index_jrc)
More on cradle to cradle certification
Other types of certifications have arisen that may appear to compete with ISO Standards and life cycle analyses; however, these are not nearly as widely recognized or accepted. One new organization is now encouraging companies to undergo their brand of testing, and if the company passes the tests, they are given a Cradle to Cradle Certification. There are varying degrees of compliance to the testing, ranging including basic, bronze, silver, gold and platinum. There are no platinum winners as of this writing. ALCOA Aluminum company for instance has won several silver awards and several cleaning products from Method Products PBC have won gold certifications.
Cradle to Cradle Certification is a multi-attribute eco-label that assesses a product’s safety to humans and potential impact on the natural environment. Unlike single-attribute eco-labels, this independent certification program developed by MBDC (McDonough Braungart Design Chemistry) takes a comprehensive approach to evaluating the sustainability of a product and the practices employed in manufacturing the product. The materials and manufacturing practices of each product are assessed in five categories: material health, material reutilization, renewable energy use, water stewardship, and social responsibility.(http://www.mbdc.com/cradle-to-cradle/cradle-to-cradle-certified-program/)
More on grocery bags—paper or plastic (and reusable vs. disposable)
73

The table below summarizes the findings of the Carrefour life cycle analysis of plastic grocery bags. Carrefour is a huge chain of department stores, only slightly smaller than Wal-Mart globally. It conducted a life cycle analysis on grocery bags in order to give its customers the best bag possible, for the money and for the environment. As you can see from the table below that summarizes the findings very succinctly, paper bags were deemed to be less environmentally friendly than one-use polyeth(yl)ene plastic bags, and way less environmentally friendly than multiple-use bags (‘bags for life’).
Figure 4.1 Summary of the environmental impacts of different carrier bags from the Carrefour LCA
Incr
easi
ng
adve
rse
envi
ronm
enta
l im
pact
Reusable polyethene [polyethylene] plastic carrier bags (‘bags for life’)
Lightweight polyethene plastic carrier bags
Paper carrier bags
(adapted from Proposed Plastic Bag Levy - Extended Impact Assessment Final Report, Volume 1 of Main Report, AEA Technology Environment, 2005, p 24: http://www.scotland.gov.uk/Resource/Doc/57346/0016899.pdf)
More on cold drink containers—plastic, glass or aluminum
The Back2Tap Web site focuses on elimination of the disposable water bottle, claiming it is an ecological disaster. (It should be noted that Back2Tap sells all types of non-disposable water bottles via the company, Green Benefits.) The site contains teacher resources at http://www.back2tap.com/school-groups/teaching-resources/.
The resources include: A school video (9:03) on where water comes from and discusses the life cycle of
disposable bottles. It includes a short student quiz, the effect of which is to discourage the use of disposable bottles, and it touts the use and re-use of non-disposable water bottles as a means to achieve sustainability. (http://www.back2tap.com/school-groups/school-video/). The video can be downloaded and saved.
A worksheet for students (at the “Worksheet” link). This sheet contains photos of various parts of the life cycle of the disposable water bottle. Students are instructed to cut out the photos and put them in their proper order in the cycle.
An answer key for the completed exercise, at the “Answer Key” link.
A follow-up activity for students to add in the ecological and societal impacts to make a more complete life cycle analysis of the bottle, as described in the link “Writing exposition on the life cycle of a plastic water bottle”.
Other activities that seem to be better suited to elementary/middle schools.
More on eco-efficiency
74

Eco-efficiency is another way of analyzing data and reporting findings. It is a bit outside a typical LCA because it deals with the economics of the object, which typically is outside the boundaries of the LCA.
Bengt Steen, leader of the team of international experts who developed ISO 14045 [international standard for eco-efficiency assessment] explained its significance: “Eco-efficiency is an aspect of sustainability relating the environmental performance of a product life cycle to its value. In a world with growing economies, an eco-efficiency assessment is a necessary management tool to decrease the overall environmental impact.” …
The goal of eco-efficiency assessment is to optimize the performance value of the product system, for example, its resource, production, delivery or use efficiency, or a combination of these. The value may be expressed in monetary terms or other value aspects. The result: doing more with less.
In practice, eco-efficiency is achieved through the pursuit of three core objectives:
Increasing product or service value Optimizing the use of resources Reducing environmental impact
Bengt Steen concludes: “Eco-efficiency is presently measured in a number of ways. To some extent, this may be motivated by varying goal and scope. ISO 14045, however, harmonizes the assessment of eco-efficiency and makes it more transparent, giving increased credibility to assessments that sometimes are regarded as ‘green-washing’".
The key objectives of ISO 14045 are to: Establish clear terminology and a common methodological framework for eco-
efficiency assessment Enable the practical use of eco-efficiency assessment for a wide range of product
(including service) systems Provide clear guidance on the interpretation of eco-efficiency assessment results Encourage the transparent, accurate and informative reporting of eco-efficiency
assessment results
Within eco-efficiency assessment, environmental impacts are evaluated using life cycle assessment (LCA) as prescribed by other International Standards (ISO 14040, ISO 14044).(“Green with envy - Less waste, more results thanks to new ISO standard for eco-efficiency assessment”, http://www.iso.org/iso/home/news_index/news_archive/news.htm?refid=Ref1644)
Eco-efficiency analysis (EEA) is a tool for quantifying the relationship between economic value creation and environmental impacts, throughout the entire lifecycle of a product or service. The term ‘eco-efficiency’ evolved from the work of the World Business Council for Sustainable Development (WBCSD) in response to the first United Nations Earth Summit. The WBCSD defines eco-efficiency as “the delivery of competitively-priced goods and services that satisfy human needs and bring quality of life, while progressively reducing ecological impacts and resource intensity throughout the life-cycle.” In other words, to be eco-efficient is to add more value to a good or service while simultaneously decreasing adverse environmental impacts. EEA evaluates products and services by
75

examining their environmental impact in proportion to their cost-effectiveness. BASF Chemical Corp. was one of the first companies to establish an EEA methodology in the early 1990s with the goal of reducing the environmental impact and costs of its products and processes. BASF’s EEA tool quantifies the sustainability of products or processes throughout their entire life-cycle, beginning with the extraction of raw materials through the end of life disposal or recycling of the product. It compares two or more products analyzed from the end-use perspective to obtain comprehensive data on the total cost of ownership and the impact on the environment.
EEA differs from benefit-cost analysis [BCA] … in that it does not seek to monetize environmental benefits or costs and compare them to non-environmental benefits or costs. Whereas BCA typically seeks to evaluate the net social benefits of a policy or program compared to a baseline without the policy or program, EEA calculates the ratio of the total value of goods and services produced (output) to the sum of the environmental pressures created by the production of those goods and services (input). More sustainable alternatives have a higher output to input ratio, or eco-efficiency ratio.
(http://www.epa.gov/sustainability/analytics/eco-efficiency.htm)
More on life cycle analysis of events
Yes, even events can benefit from life cycle analysis! ISO developed Standard 20121 to cover social events, and its first use was for the 2012 Summer Olympic Games in London.
ISO 20121 has been developed to help ensure that events, ranging from local celebrations to “mega events” such as the Olympic and Paralympic Games, leave behind a positive legacy in terms of economic, environmental and social benefits, with minimum material waste, energy consumption, or strain on local communities.
The new management standard was created by the event industry for the event industry. It is applicable to any organization that wishes to establish, implement, maintain and improve an event sustainability management system as a framework for identifying the potentially negative impacts of events, removing or reducing them, and capitalizing on the more positive impacts through improved planning and processes. (http://www.iso.org/iso/home/news_index/news_archive/news.htm?refid=Ref1690)
76

More on social life cycle analysis
While life cycle analyses focus primarily on physical and biological impacts of production and use of products on the environment, another variant of the LCA, the social life cycle analysis has developed.
It used to be that when consumers had to choose between two similar products, it was a pretty easy decision to make: just weigh the benefits of cost and quality then pick the item and brand that suited your needs. Today, the choices are many, and more difficult. Buyers are now drived [sic] to be conscious of the effects their choices have on our environment and on the local economies. Do we buy from the farm stand or the supermarket? Which choice will result in a less polluted, more sustainable globe? Perhaps even more daunting is the fact that some of our choices will have social and socio-economic effects as well, not only on workers but also on entire communities where production takes place. These social and socio-economic consequences are the primary concern of a social and socio-economic life cycle assessment (S-LCA).(United Nations Environment Programme (UNEP). “Guidelines for Social Life Cycle Assessment of Products”, 2009, p 8: http://www.unep.fr/shared/publications/pdf/DTIx1164xPA-guidelines_sLCA.pdf)
Connections to Chemistry Concepts (for correlation to course curriculum)
1. Thermochemistry—Energy considerations play a large role in making decisions about choices we make involving chemistry and chemicals.
2. Sustainability—Although this may not be a specific topic in high school chemistry courses, it must, of necessity, be something that citizens of the world are made aware of in order to ensure that we do not use up Earth’s resources. Chemistry class is the ideal place to begin cultivating “world citizens” that can make informed decisions about scientific/political issues that affect us all.
3. Properties of matter—It is the properties (e.g., molar mass, solubility) of these various materials that helps scientists and non-scientists alike decide which materials to use for what purposes. Only if they have properties appropriate for the final use can they be used in LCAs to see if they are also environmentally appropriate.
4. Stoichiometry, % yield, and atom economy—“The concept of ‘atom economy’ [in Green Chemistry] is an interesting one, and differs from what many of us typically consider a ‘good yield’ in a chemical reaction. The % yield in a reaction is calculated with the formula:% Yield = (Actual yield of product/Theoretical yield of product) x 100 %But what this formula ignores is that although a given process may produce a high % yield, it can at the same time produce many additional [potentially unwanted] products, some of which may at worst be hazardous and at the very least represent atoms of reactants that were never converted into anything useful. We may calculate that if we use a given amount of A, B, C, D, and E, we can theoretically produce a certain amount of F. If the actual synthesis comes close to that amount, we may conclude that we have a good synthesis [high yield]. But if at the same time we also produce substances G, H, I, J, and K, then we have only converted a small percentage of the atoms contained in the reactants into the desired product, F. Atom economy relates to how many of the atoms in the reactants actually ended up in the final desired product.
77

A [synthesis] reaction like: 2H2 + O2 → 2H2O would have an atom economy of 100%, since all the reactant atoms ended up in the final product.” (ChemMatters Teacher’s Guide to accompany “Green Chemistry”, April 2003)
Possible Student Misconceptions (to aid teacher in addressing misconceptions)
1. “It is simply the up-front costs that determine which material to use for a specific purpose; e.g., plastic or paper for grocery bags.” This is a pretty good summary of the way things have always been for businesses, but with increasing population with increasing demands for raw materials, and with decreasing amounts of those raw materials, we anno longer operate with “business as usual.” There are many factors to consider in making such a decision. As the author points out, other factors to consider include initial energy costs, energy costs to maintain an article, other maintenance costs, source of the material—renewable vs. non-renewable, cleanliness/antimicrobial condition, mass/density of the material, transportation costs, and disposal—and even more factors, like societal and political issues—and all should ultimately play a role in the final decision.
2. “Everybody knows that a reusable cloth grocery bag is better than either paper or plastic bags, because you don’t throw it away.” If you only look at the fact that the bag is being reused innumerable times vs. throwing away a new bag each time you shop, you would reach that exact conclusion, but the article points out that the other factors involved: cost to manufacture, environmental effects of production of the raw material (cotton), and effects on society if illness ensues due to bacterial growth within the bag due to food contamination, all make the decision far more complicated than the oversimplified original quote.
3. “Plastic bottles are obviously better than glass because they don’t break if you drop them.” OK, this isn’t really a misconception, but it is an oversimplified statement because it does not take into account any of the other factors involved in the life cycle analysis. In this case, plastic wins out on almost all factors that compare plastic and glass containers.
Anticipating Student Questions (answers to questions students might ask in class)
1. “If greenhouse gases are such a problem for life on Earth, maybe we should just get rid of ALL greenhouse gases. What would happen then?” The complete answer involves some complex thinking [just like any life-cycle analysis]. Basically, we know how much energy reaches the Earth from the Sun. We know how much of this energy is absorbed by the Earth and how much is reflected. The energy that is absorbed warms the Earth. The Earth, like all objects, emits energy, and if it became warmer, it would emit even more energy. Of course the energy arriving on the Earth and the energy leaving the Earth must be equal. Otherwise the Earth would either be getting hotter or colder. So from this “energy balance,” scientists can calculate how warm the Earth would be in order to emit the same amount of energy it receives every day. That comes out to be –18 oC. Brrrrr.” (from the September 2005 ChemMatters Teacher’s Guide article on greenhouse gases) So, maybe SOME amount of greenhouse gases in the atmosphere isn’t such a bad thing, eh?
2. “What’s the worst that could happen if we don’t do life cycle analyses to evaluate products and materials?” Students probably don’t want to go there! At the worst, if we
78

continue to use Earth’s materials in non-sustainable and environmentally destructive ways, we could wind up with an uninhabitable Earth. LCAs can help us prevent that scenario.
3. “So, life cycle analyses give us ALL the information we need to make environmentally friendly decisions.” Well, they usually don’t give us ALL the information we need, but they certainly can shed light on environmental impacts of which we may not have been aware otherwise. No other method of analysis gives us as much information on which to make decisions as does LCA.
In-class Activities (lesson ideas, including labs & demonstrations)
1. “… [F]inding a solution to the world’s energy crises will loom large in decades to come. ChemMatters April 2003 featured an activity titled ‘Green Energy—It’s Your Decision’. The activity challenged students to select the most efficient method in terms of energy and cost for heating 200 mL of water to a required temperature. They were to consider a laboratory hot plate, a [B]unsen burner, and a microwave oven. The activity was adapted from Introduction to Green Chemistry: Instructional Activities for Introductory Chemistry, published by the American Chemical Society, 2002. The activity is included on the … [30-year CD] … of ChemMatters articles available for purchase on this ChemMatters website.” (quote from ChemMatters Teacher’s Guide to accompany “Greenhouse Gases”, September 2005) (source of activity: Green Energy—It’s Your Decision. ChemMatters 2003, 21 (2), pp 8–9)
2. This classroom activity “Environmental Activities for the Classroom: Product Life-Cycle Analysis” has students do a basic paper-and-pencil LCA of their own shoe. (http://www.wmrc.uiuc.edu/main_sections/info_services/library_docs/TN/99-031.pdf)
3. This site provides background information to teach about life cycle analysis and other concerns of the environment for teachers of materials science: http://www.materials.ac.uk/guides/environmental.asp.
4. “Buy, Use, Toss? A Closer Look at the Things We Buy” is a 10-day interdisciplinary unit from Facing the Future that analyzes our consumption behaviors. It involves cross-curricular activities and almost all of them at least one of the National Science Education Standards. (https://www.facingthefuture.org/Curriculum/PreviewandBuyCurriculum/tabid/550/CategoryID/4/List/1/Level/a/ProductID/1/Default.aspx) You must register (free) to access materials on the site.
5. This site from Michigan Tech is a multi-screen interactive module on the life cycle analysis of paper and plastic bags that could be used as an in-class activity: http://techalive.mtu.edu/meec/module14/title.htm.
6. There is a difference between atom economy, a Green Chemistry goal, and % yield, which has traditionally been an accepted measure of the efficiency of a synthesis process. See “Connections to Chemistry Concepts” #3 above for a further explanation of this difference. A good class activity might be to take some typical synthesis reactions, either real or hypothetical (including byproducts and subsequent reactions thereof), and provide the students with some data about the amount of each reactant used and the amount of each product produced. Students could then compute and compare both the theoretical yields and the atom conservation for each process. See the slide presentations in #3 below.Here is a great source of a number of problems for calculating slightly more difficult problems involving atom economy: http://cann.scrantonfaculty.com/organicmodule.html. These could be given to students for practice after they’ve been introduced to the concept of atom economy, possibly via one of the two slide presentations discussed in #3.
79

7. Here is a very simple 7-slide presentation (Slide Share) on the difference between % yield and atom economy, with an example for each, that you could use in class to teach about atom economy: http://www.slideshare.net/rei64/chemistry-calculations-percent-yield-and-atom-economy.Here is another slide presentation (PowerPoint), this one is 17 slides and provides 3 examples of atom economy calculations. It begins with a few slides explaining Green Chemistry as an introduction to atom economy. (http://www.educationscotland.gov.uk/highersciences/chemistry/principlestoproduction/reactants/percentageyield.asp)And this is a whole series of PowerPoints and Word documents about & yield and atom economy from ShareMyLesson. They consist of tutorials, handouts, activities and “bellwork”. (http://www.sharemylesson.com/teaching-resource/Atom-Economy-and-Percentage-Yield-6159421/) The site requires you to register, but it’s very simple information and registration is free. Then you can access their entire inventory of teacher-prepared materials. (Of course, it is hoped that you will upload some of your work as well.)
8. This is a short 7-question interactive quiz (with answers after all have been tried) about % yield and atom economy from BBC’s Bitesize that you could ask students to take after a lesson on both % yield and atom economy: http://www.bbc.co.uk/schools/gcsebitesize/science/add_ocr_gateway/chemical_economics/atomeconomy/quiz/q57401596/.
9. This word document from ShareMyLesson provides 4 experiments involving the synthesis of magnesium sulfate from sulfuric acid and a variety of magnesium compounds. Questions are posed about % yield and atom economy. Caution: the experiments require heating of the H2SO4. You must register to access teacher work, but it’s free. (http://www.sharemylesson.com/Download.aspx?storycode=6159421&type=X&id=50145553)
10. You can have students actually draft and perform a rudimentary life cycle analysis on an item or object of their choice (e.g., a cell phone, a water treatment plant, prescription drugs, the atmosphere, etc. Obviously, some of these choices will be easier than others.) See some of the articles in the “References (Non-Web-based Information Sources)” section, and the sites cited in the “More sites on life analyses for specific objects” section, below, for articles and ideas to get you and them started.
Out-of-class Activities and Projects (student research, class projects)
1. “There are many environmental regulations and public policies under scrutiny and debate at the national and international level. Students could work in groups to research the underlying science and the various positions taken by opposing groups. Some of these regulations involve emissions of specific chemicals like arsenic, mercury, and various organic species.” They could begin here: ChemMatters Teacher’s Guide, September 2005, to accompany “Greenhouse Gases”.
2. “Regulations often refer to industry standards for pollutants and emissions. Students will find that these standards translate into the thresholds below which the presence of these substances are legal. Sometimes the decisions made about setting standards revolve around the limits of affordable testing equipment. An amount that can be detected using expensive analytical tests in laboratories might go undetected with the day to day equipment used in the field. Students might interview water-quality or air-quality experts for more information on the subject of regulations and standards.” (ChemMatters Teacher’s Guide, September 2005, to accompany “Greenhouse Gases”)
80

3. The debate continues on plastic vs. paper grocery bags. Students could research and report on the debate that occurred in Illinois in 2012 over Senate Bill 3442, The Plastic and Film Recycling Act, that sought to ban local governments within Illinois from enacting their own legislation to ban plastic grocery bags. They could begin here: http://www.foxnews.com/politics/2012/07/11/illinois-governor-faced-with-bill-to-ban-plastic-bag-bans/.
References (non-Web-based information sources)
Downey, C. Biodegradable Bags. ChemMatters 1991, 9 (3), pp 4–6. Author Downey discusses new-at-the-time plastic bags made of supposedly biodegradable plastic. This article, in conjunction with several other articles published in ChemMatters since then (e.g., the 1999 article by H. Black, cited below) could be used by students as the start of an experiment designed to do a life-cycle analysis of the plastics in biodegradable bags.
Alper, J. Mystery Matters: Biosphere II. ChemMatters 1995, 13 (1), pp 8–11. In a mystery setting, the author discusses the major problem that arose in Biosphere II, a self-contained, self-sustaining 3-acre glass-enclosed mini “Earth” that failed after two years of trials. Failure was evidenced in dropping levels of oxygen. You’ll have to read the article to find out what happened and why it failed. This grand experiment might have benefited from a life cycle analysis. Actually, it WAS a life cycle analysis.
Black, H. Putting a High Grade on Degradables. ChemMatters 1999, 17 (2), pp 14–15. The author discusses the use and manufacture of biodegradable plastics, to minimize the amount of material sent to landfills. Polylactic acid, a biodegradable plastic made from corn, is a focus of the article.
Ryan, M. Green Chemistry: Benign by Design. ChemMatters 1999, 17 (4), pp 9–11.
The references below can be found on the ChemMatters 30-year CD (which includes all
articles published during the years 1983 through April
2013 and all available Teacher’s Guides). The CD is in production and will be available soon from the
American Chemical Society at this site: http://ww.acs.org/chemmatters.Selected articles and the complete set of
Teacher’s Guides for all issues from the past three years are also available free online on the same
site. (The complete set of ChemMatters articles and Teacher’s Guides are available on the 30-year CD for all past issues, (up to April 2013.)
Some of the more recent articles (2002 forward) may also be available online at the link above. Simply click on the “Past Issues” button directly below the “M” in the ChemMatters logo at the top of the Web page. If the article is available online, you will find it there.
30 Years of ChemMatters!
81

Author Ryan discusses winners of three awards whose products were designed to meet the principles of green chemistry for society. One of the awards is Pyrocool, mentioned in the firefighting foam 2001 ChemMatters article below.
The Teacher’s Guide for the December 1999 green chemistry article above discusses the 12 principles of green chemistry, as adopted by the U.S. Environmental Protection Agency (Anastas, P. T.; Warner, J. C. Green Chemistry: Theory and Practice, Oxford University Press. New York. 1998, p 30.)
Bottles or Cans? Run Some Tests Before You Decide. ChemMatters 2000, 18 (3), p 11.Life cycle analyses depend on the availability of sufficient valid data upon which to make decisions. Experiments are one of the best ways scientists have to gather that data. This article discusses various experiments students can perform to determine which type of beverage container is best for which purposes. One of the experiments is based on the type of material that comprises the container and the life cycle of that material.
Kirchoff, M. Green Chemistry: A Supercritical Clean Machine. ChemMatters 2000, 18 (4), pp 14–15. This article discusses the development of supercritical carbon dioxide as a solvent of choice to replace perchloroethylene in dry cleaning of clothes.
Zelaya-Quesada, M. Chemical Foams in the Line of Fire. ChemMatters, 2001, 19 (4), pp 8–9. The main focus of this article is on the use of chemical foams to extinguish forest fires and the need for removal of the foam after the fire has been extinguished, but the last page focuses specifically on the firefighting foam Pryocool that won a presidential award for use of green chemistry. The foam contains inactive bacteria that, when exposed to water when used in a fire, eat up the remaining foam after the fire has been extinguished. There is no need to suck/soak up this foam after use (as must be done with other foams so they don’t damage plant and animal life after the fire), as this foam will biodegrade.
La Merrill, M.; Parent, K.; Kirchhoff, M. Green Chemistry: Stopping Pollution Before It Starts. ChemMatters, 2003, 21 (4), pp 7–10. This article gives a very detailed discussion of several of the 12 principles of green chemistry, focusing on economy of atoms, sustainability and safety in use of chemicals in materials production. The article includes a 2-page lab activity for students, challenging them to devise a procedure that uses the least amount of energy to accomplish the task of heating a specific amount of water a specific number of degrees.
Parent, K. Building a Better Bleach: A Green Chemistry Challenge. ChemMatters, 2004, 22 (2), pp 17–19. Author Parent discusses the modern use of peroxides to replace chlorine bleach, based on the hazards of chlorine compounds in our environment.
Parent, K.; Young, J. Green Chemistry: Biomimicry—Where Chemistry Lessons Come Naturally. ChemMatters 2006, 24 (4), pp 15–17. The author discusses various ways chemists are using naturally occurring process to try to make similar products, minimizing hazards and waste.
The Teacher’s Guide to the Benign by Design article above contains background on the green chemistry movement and biomimicry.
Brownlee, C. The Swish Goes Green. ChemMatters 2008, 26 (3), pp 18–19.This article, like another article in this issue, focuses on manufacturing a sustainable shoe, this one from Nike. The author interviewed John Frazier, a chemist at Nike, to discover that Nike
82

uses cotton grown without pesticides, and incorporates very low-level volatile organic compounds (VOCs) in its adhesives and solvents. The company seems committed to the use of green chemistry in the manufacture of its shoes and other products.
Vos, S. Cleaning Up The Air. ChemMatters 2011, 29 (1), pp 14–15 The author describes the problems caused by excess CO2 in the atmosphere, and ways to ameliorate the problem. This is similar to the final steps of a life cycle—after the data have been submitted and attack of the problem begins.
____________________
Anastas, P.T. and Warner, J.C. Green Chemistry: Theory and Practice. Oxford University Press: New York, 1998. This book is the original publication by the two scientists who are regarded as the fathers of the green chemistry movement. This is the source of the 12 principles of green chemistry. (See the article on Green Shoes also in this issue for more information on Green Chemistry.)
Web Sites for Additional Information (Web-based information sources)
More sites on green chemistry (see “Going the Distance”—another article in this issue, and its Teacher’s Guide for more information on this topic)
Visit this American Chemical Society Web page to find out more about Green Chemistry. This particular page contains a timeline of green chemistry development: http://www.acs.org/content/acs/en/greenchemistry/about/green-chemistry-at-a-glance.html.
And this page from the ACS Green Chemistry Web site contains information about the 12 principles of Green Chemistry and the 12 principles of Green Engineering, as well as a 30-second video clip with Dr. John Warner, one of the two founders of Green Chemistry, defining the subject: http://www.acs.org/content/acs/en/greenchemistry/about/principles.html.
Here’s another video (9:22) interview with Dr. John Warner, one of the founders of Green Chemistry. He encourages teachers to educate students about the importance of chemistry in solving the problems of today’s world: http://www.youtube.com/watch?feature=player_embedded&v=VRJLmKAhdyw
Beyond Benign offers a wealth of high school activities in the area of Green Chemistry, including many experiments, some of which are classified as “replacement experiments”, using more environmentally friendly materials(e.g., sublimation using caffeine tablets instead of naphthalene). (http://www.beyondbenign.org/K12education/highschool.html)
More sites on life cycle analysis
This 80-page primer about life cycle analysis from the EPA, “Life Cycle Analysis: Principles and Practice” (2006) provides a very good basic coverage of what a life cycle analysis is. “This document is designed to be an educational tool for someone who wants to learn the basics of LCA, how to conduct an LCA, or how to manage someone conducting an LCA.”
83

(http://www.epa.gov/nrmrl/std/lca/pdfs/chapter1_frontmatter_lca101.pdf) Another way to reach the document is via this Web page: http://www.epa.gov/nrmrl/std/lca/lca.html. Scroll down and click on the “LCA 101 document (PDF)” tab, then choose your download method at upper right of new screen; or you can select individual chapters to download.
This site from the Society of the Plastics Industry’s Bioplastics Council, “Life Cycle Analysis Primer: What, Why and How” (2012) provides an overview of a life cycle analysis from the viewpoint of an industry, rather than a governmental organization:http://www.plasticsindustry.org/files/about/BPC/Life%20Cycle%20Analysis%20White%20Paper%20-%200212%20Date%20-%20FINAL.pdf. The paper explains the need to take a simpler route than the usual (and, to them, complex) ISO 14040 series standards for life cycle analyses.
This 21-minute video, “The Story of Stuff”, discusses the things we buy and use—where the stuff comes from and where it goes—and what we should be doing with them, instead of throwing them out: http://www.youtube.com/watch?v=gLBE5QAYXp8&feature=player_embedded. It includes discussion of LCAs.
More sites on graphics depicting the process of life cycle analysis
Any of the graphics below can be enlarged slightly simply by clicking on a corner of the diagram and dragging it to enlarge it. If that is the only change you make, you can restore the original size by hitting <Z> (that’s the control key and Z simultaneously). Or you can copy it and paste it into a new Word document and enlarge it there.
This represents a basic LCA: http://greenresearch.files.wordpress.com/2011/03/lca.jpg.
This graphic represents the life cycle analysis of a T-shirt: https://www.e-education.psu.edu/egee401/content/p10_p5.html. If the site can’t be accessed by clicking on the link, copy and paste it into your browser and access it that way.
84

This graphic includes inputs and outputs: http://www.lbl.gov/publicinfo/newscenter/features/2008/apr/assets/img/hires/LCA.jpg.
This is an artistic rendering of the typical LCA: http://www.ruthtrumpold.id.au/designtech/pmwiki.php?n=Main.LifeCycleAnalysis.
This graphic represents the LCA of paper vs. plastic grocery bags:http://www.flickr.com/photos/snre/5622182541/.
This graphic represents the LCA comparison of plastic and glass: http://lmc.gatech.edu/~agupta31/nibha/portfolio/.
85
The LCA of coffee is represented in this graphic: http://www.sustainability-ed.org.uk/pages/look4-1.htm.
This graphic represents the life cycle analysis of aluminum: http://withfriendship.com/images/f/26313/Life-cycle-assessment-picture.gif
More sites on life cycle analyses for specific objects
“Good Stuff?” by Worldwatch.org provides one page of information each about 27 different products we use every day. Links on each page provide more information, some of which include rudimentary life cycle analyses. (http://www.worldwatch.org/system/files/GoodStuffGuide_0.pdf)
This 73-page pdf document from the Plastics Division of the American Chemistry Council (April 7, 2010) is a good example of a life cycle analysis. It discusses the “Life Cycle Inventory of 100% PostConsumer HDPE and PET Recycled Resin from Post-Consumer Containers and Packaging”: http://www.container-recycling.org/assets/pdfs/plastic/LCA-RecycledPlastics2010.pdf. Although it is a very complex study, it shows the need for such a detailed study in order to provide all the information needed to make informed decisions.
This site provides a life cycle analysis of the US $1 paper bill vs. the Sacajawea $1 coin. The three-member research team from Michigan State University that did the analysis then made a recommendation to the U.S. Mint based on their findings: “Life Cycle Assesment [sic] of Environemental [sic] Impact of United States Dollar Note and Coin”, https://www.msu.edu/~alocilja/undergrad/BE230/dollar_vs_coin.pdf. (I see why the U.S. Mint might not have believed them.)
Here’s a life cycle analysis focusing on Li-ion batteries: http://www.life-cycle.org/?p=1688.
This life cycle analysis from the EPA focuses on recycled plastic lumber: http://www.epa.gov/wastes/conserve/tools/greenscapes/pubs/lumber.pdf.
ALCOA aluminum’s Web site contains a page (OK, more than one) dealing with sustainability. This one contains a very basic version of a life cycle analysis: http://www.alcoa.com/sustainability/en/info_page/products_design_lifecycle.asp#cradle.
86
This document, “Life Cycle Assessment of Aluminum: Inventory Data for the Worldwide Primary Aluminum Industry”, from the International Aluminum Institute Web page also provides a life cycle analysis of aluminum—this one deals with aluminum on the international level: http://transport.world-aluminium.org/uploads/media/1274452849Global_LCI_Report.pdf.
This life cycle inventory studies paper and plastic packaging used in shipping items, but it does NOT discuss grocery bags: “Life Cycle Inventory of Packaging Options for Shipment of Retail Mail-Order Soft Goods, Final Peer-Reviewed Report”. The report spends almost two pages discussing the parameters it did NOT study. (This is typical for a detailed life cycle analysis.) (http://www.deq.state.or.us/lq/pubs/docs/sw/packaging/LifeCycleInventory.pdf)
This site from the U.S. Department of Energy, “Life-Cycle Assessment of Energy and Environmental Impacts of LED Lighting Products”, provides a 2012 life cycle analysis of light bulbs, comparing incandescent, CFL and LED bulbs: http://apps1.eere.energy.gov/buildings/publications/pdfs/ssl/2012_LED_Lifecycle_Report.pdf.
And here is an abbreviated life cycle analysis of laundry detergent tablets from Unilever, “Tablet Detergents: Towards a More Sustainable Future”: http://www.unilever.com/images/2000%20Tablet%20Detergents%20Towards%20A%20More%20Sustainable%20Future_tcm13-5327.pdf.
Excel Dryer, Inc. commissioned a life cycle analysis of its Xlerator® Hand Dryers. The extensive 54-page report from Mr. Jon Dettling and Dr. Manuele Margni of Quantis, entitled “Comparative Environmental Life Cycle Assessment of Hand Drying Systems: The XLERATOR Hand Dryer, Conventional Hand Dryers and Paper Towel Systems”, can be found at http://www.exceldryer.com/pdfs/LCAFinal9-091.pdf. The report is replete with charts and graphs. Obviously, Xlerator® is better than the other methods for drying our hands, but now we can know why. The report came was obtained from the Excel Dryer, Inc Web site, “Go Green” page at http://www.exceldryer.com/PressKit/Green.php.
This site discusses the LCA of ZipLoc bags: http://www.behance.net/gallery/Life-Cycle-Analysis-eco-sandwich-bags/7111605.
And this one reports on the LCA of Chopsticks: http://michengdesign.com/49581/455508/projects/chopsticks-life-cycle-assessment.
This site provides a full-page interactive illustration of the 6-step life cycle analysis of a soccer ball: http://www.epa.gov/wastes/education/pdfs/life-soccer.pdf. The back side contains much information relating to soccer, including a description of the 6-step method of life cycle analysis.
This site provides a full-page illustration of the 6-step life cycle analysis of a cell phone, with a series of student activities on the second/back page: http://blog.wirelesszone.com/Portals/41194/docs/life-cell.pdf.
This site discusses sustainability and uses the life cycle of coffee in one example: http://www.sustainability-ed.org.uk/pages/look4-1.htm.
More sites on managing the environment
87

ISO, the International Organization for Standardization, is the world authority on production and processing standards. It has developed a series of standards, ISO 14000, which addresses the management of the environment. Part of this stewardship process involves life cycle analysis. You can find a 12-page introduction to the ISO 14000 family of standards, “Environmental management: The ISO 14000 family of International Standards”, here: http://www.iso.org/iso/theiso14000family_2009.pdf. The actual individual standards are available for sale online in pdf format, but they are very pricey(e.g., ISO 14064-2:2006 on greenhouse gases costs $156.00 from ANSI, the US ISO member organization).
More sites on ISO standards
This ISO document deals with product labels and how ISO standards help keep manufacturers honest in their claims to be “clean and green”: “Environmental Labels and Declarations: How ISO Standards Help”(http://www.iso.org/iso/environmental-labelling.pdf)
This 2-minute video explains a bit about what ISO is and what it does: http://www.youtube.com/watch?v=XoU_eMZ4FvY&list=PLD1CD58D7A5035F2B.
Here is a 13-slide presentation outlining various aspects of ISO’s standards, including climate change, energy efficiency, water and nutrition: http://www.eos.org.eg/NR/rdonlyres/8911472A-A0D0-47CC-970B-39451C0F24EE/1139/ISO.pdf.
This 56-page pdf document from ISO, the International Organization for Standardization, discusses how ISO standards are helping to address climate change: http://www.iso.org/iso/ghg_climate-change.pdf.
More sites on events sustainability
This pdf shows how ISO Standard 20121 can be used by events planners to help their organization manage a sustainable event: http://www.iso.org/iso/sustainable_events_iso_2012.pdf.
More sites on recycling plastics
http://www.plasticsrecycling.org/news/news-archives/8-news-archives/104-2009-pet-rate-report
This is a series of slides focuses on recycling (not exclusively plastics) in Florida. Some of the slides are generic, some specific to Florida. You choose which ones to use. (http://www.dep.state.fl.us/waste/quick_topics/publications/shw/recycling/recycling_from_bin_to_products.pdf)
More sites on plastic bags vs. paper bags
Many states and local governments have enacted legislation involving paper or plastic grocery bags. In fact, only 13 states do NOT have legislation on the books You can view information about the 37 states (and their local governments) that DO have legislation, by clicking on a particular state on their map, here: http://baglaws.com/.
88

As more and more states and municipalities are enacting legislation banning plastic grocery bags, the legislature of the state of Illinois in 2012 was considering something slightly different: a ban on the ability of municipalities and local governments to ban the bags (see http://www.foxnews.com/politics/2012/07/11/illinois-governor-faced-with-bill-to-ban-plastic-bag-bans/). SB3442, The Plastic Bag and Film Recycling Act, had as its main focus increasing the recycle rate of bags by consumers, and the “ban on bag bans” within the state was only a small part of the law. Nevertheless, the bag ban got the most publicity. After the bill had passed the Senate, a petition—begun by a middle school girl—signed by more than 150,000 Illinois residents opposing the bill finally forced the governor to veto the bill. This could be a topic of research and discussion by students, to investigate the concerns of industry and society in this political controversy. (There were a lot of parts of this bill that benefited plastic bag manufacturers.)
This site is a 5-page “Review of Life Cycle Data Relating to Disposable, Compostable, Biodegradable and Reusable Grocery Bags”. It is referred to as the “ULS Report” (Use Less Stuff). (http://www.deq.state.mi.us/documents/deq-ess-p2-recycling-PaperPlasticSummary_2.pdf) While it is far from a life cycle analysis (only 5 pages long), it attempts to provide a review of 3 large-scale studies on various types of bags and draws some conclusions.
The site plasticbagslaws.org has a long list of links concerning legislation about plastic bags: http://plasticbaglaws.org/useful-links/. The site is obviously pro-legislation limiting the use of plastic bags, as evidenced by the annotations for the internet links that are sponsored by the plastic bag industry (e.g., for one link it says, “Recycling industry blog that (surprise!) supports plastic bag recycling as the ultimate answer.”) Nevertheless, as long as students recognize the bias in the articles, they can be useful.
Here is another site by the state of Florida that shows “Retail Bags Report Maps and Related Detailed Lists”: http://www.dep.state.fl.us/waste/retailbags/pages/mapsandlists.htm. It also contains a report entitled, “Retail Bags Report for the Legislature”, here: http://www.dep.state.fl.us/waste/quick_topics/publications/shw/recycling/retailbags/Retail-Bag-Report_01Feb10.pdf.
This site has lots of information about plastic bags and paper bags: http://www.allaboutbags.ca/.
89

An Explosion of Diamonds
Background Information (teacher information)
More on diamonds
Most of your students will likely know that a diamond is actually a crystalline form of carbon. It is one of carbon’s allotropic forms, the others being graphite, graphene, fullerenes and amorphous carbon. See below for more on graphite. Amorphous carbon does not have a crystalline structure. The most common example is carbon black or soot. Fullerenes include buckyballs, carbon nanotubes and nanofibers.
In this section of the Teacher’s Guide we will list two sets of properties. First we will look at the properties of diamonds as chemical substances and relate the properties to the structure and bonding. Later in this section we will describe diamonds as gems.
Diamonds as chemical substances
Diamond is the hardest naturally occurring substance. Interestingly, graphite is one of the softest materials. (See more on this below.) Diamond is an electrical insulator but an excellent heat conductor. Diamonds are transparent to light from far UV to infrared. In theory diamonds should also be colorless, but due to impurities they are typically white or yellow, sometimes blue or gray in color. Boron, which lends a bluish color, and nitrogen, which adds a yellow cast, are common trace impurities. Diamonds are not easily compressed. Other properties of the substance include:
Mohs scale = 10Density = 3.51 g/cm3
Refractive index = 2.417Luster = adamantineMelting point = does not melt at atmospheric pressureSublimation point = 3900 KTriple point = 10.8 MPa and 4600 K
Even though it is rated the hardest natural substance, the “10” on the Mohs scale does not convey how hard diamonds actually are. The Mohs scale was invented in 1812 using the ten minerals still used today—in order from softest to hardest, talc, gypsum, calcite, fluorite, apatite, orthoclase, quartz, topaz, corundum and diamond. The scale is only relative in this sense: if a material can be scratched by topaz (8) but not by quartz (7) it is assigned a hardness of 7.5.
However, the Mohs scale does not measure absolute hardness. This can be measured with a device called a sclerometer. This instrument measures hardness with the use of a standardized diamond head which is dragged across the material being tested. Hardness is determined by finding out how much pressure is needed to create a visible scratch. The device is widely used in materials science. Below is the Mohs scale with absolute hardness numbers included:

Mohs AbsoluteHardness Mineral Hardness
1. Talc—Mg3Si4O10(OH)2 12 Gypsum—CaSO4•2H2O 23 Calcite—CaCO3 94 Fluorite—CaF2 215 Apatite—Ca5(PO4)3(OH–,Cl–,F–) 486 Orthoclase—Ca5(PO4)3(OH–,Cl–,F–) 727 Quartz—SiO2 1008 Topaz—Al2SiO4(OH–,F–)2 2009 Corundum—Al2O3 400
10 Diamond—C 1500
So it is obvious using an absolute hardness scale that diamonds are 3.75 times harder that corundum, not twice as hard, as the Mohs scale seems to indicate. We can relate the hardness property to the bonding in diamonds. See below.
Diamonds are good conductors of heat—four times better than copper—due to the strong covalent bonding between the carbon atoms and the close packing of the atoms. They are not, however, good conductors of electricity, but if they contain boron impurities they can be semi-conductors. They have very high reflectance and index of refraction. Diamonds do not react with acids or bases. They are water resistant. Diamonds are flammable at very high temperatures in an oxygen atmosphere.
The properties of diamonds are due to the arrangement of the constituent carbon atoms. In a diamond each carbon atom (see yellow colored atom in diagram at right) is strongly bonded to four other carbon atoms in a rigid tetrahedral shape in which each carbon atom is equidistant from its neighboring atoms. The tetrahedral shape is repeated throughout the diamond. (http://www.weldons.ie/fancy-coloured-diamonds/)
The crystal structure of a diamond is a face-centered cube (FCC), as seen in the diagram to the left. The covalent bonds between each carbon are very strong, giving diamond its hardness and its very high melting point and boiling point. Since all the valence electrons are used in bonding, there are no free electrons available to move through the lattice and so diamonds are not conductors of electricity.(http://ecee.colorado.edu/~bart/book/bravais.htm#fcc)
91

Most diamonds in the world are slightly colored with traces of yellow or brown, although they can exist in almost any color. In increasing order of rarity, yellow diamond is followed by brown, colorless, then by blue, green, black, pink, orange, purple, and red. The color of diamonds is the result of impurities, as noted above. Blue is caused by atoms of boron that replace carbon atoms in the lattice. Nitrogen atoms cause diamonds to be yellow, the most common color. Red, pink and strong brown are caused by crystal lattice defects, during the formation of the diamond. Green is caused by exposure to natural radiation in the earth.
Diamonds as gems
If we look at diamonds as gems rather than chemical substances, we find that they are classified by the type and amount of impurities in them. The most common impurity in diamond is nitrogen, which can comprise up to 1% of a diamond by mass. Most nitrogen enters the diamond lattice as individual atoms (i.e., nitrogen-containing molecules dissociate before incorporation); however, molecular nitrogen can be an impurity as well. Below is the classification of diamonds based on nitrogen impurity;
Type ImpurityIa Up to 0.3% (3000 ppm) nitrogen—most natural diamondsIb Up to 500 ppm—very rare in nature, but most synthetic diamondsIIa Nitrogen impurity not easily detected by UV or IR analysis—rareIIb Lower nitrogen than IIa—boron replaces nitrogen as impurity
A note about IIb diamonds and semi-conductivity—if a few boron atoms replace carbon atoms in the crystal lattice the diamond can be a semi-conductor—the result of a process called doping. This is due to the fact that a boron atom has one less electron than carbon and so creates an electron hole (the absence of an electron in a certain state) in the lattice. These holes can move in an electric field and create the semi-conductor state. These electron holes also allow the diamond to release red light, creating rare “red” diamonds.
Diamonds are also characterized by “brilliance” and “fire.” The Teacher’s Guide for the December 2004 article “Two Faces of Carbon” says that
Brilliance refers to a diamond’s ability to reflect back any light that enters it. Diamonds have the highest refractive index of any gemstone. This means that light entering a diamond undergoes a significant change in its path, that is, it is “bent” as it enters. This bending, coupled with the cutter’s art in cutting facets or faces on the diamond results in all of the entering light being returned out the face of the diamond—its “brilliance.” “Fire” refers to the ability of a diamond to separate white light into the many colors of the rainbow.
That same Teacher’s Guide provides a description of other gemstone properties of diamond:
Diamonds are valued according to what are often called the “four C’s,” namely cut, clarity, color, and carat.
Cut Diamonds were first crudely cut during the late Middle Ages. Before that they were simply left in their natural state. Early cutting did little to improve the beauty and radiance. One cut, called a table cut, basically involved cutting away about half of the natural crystal. A
92
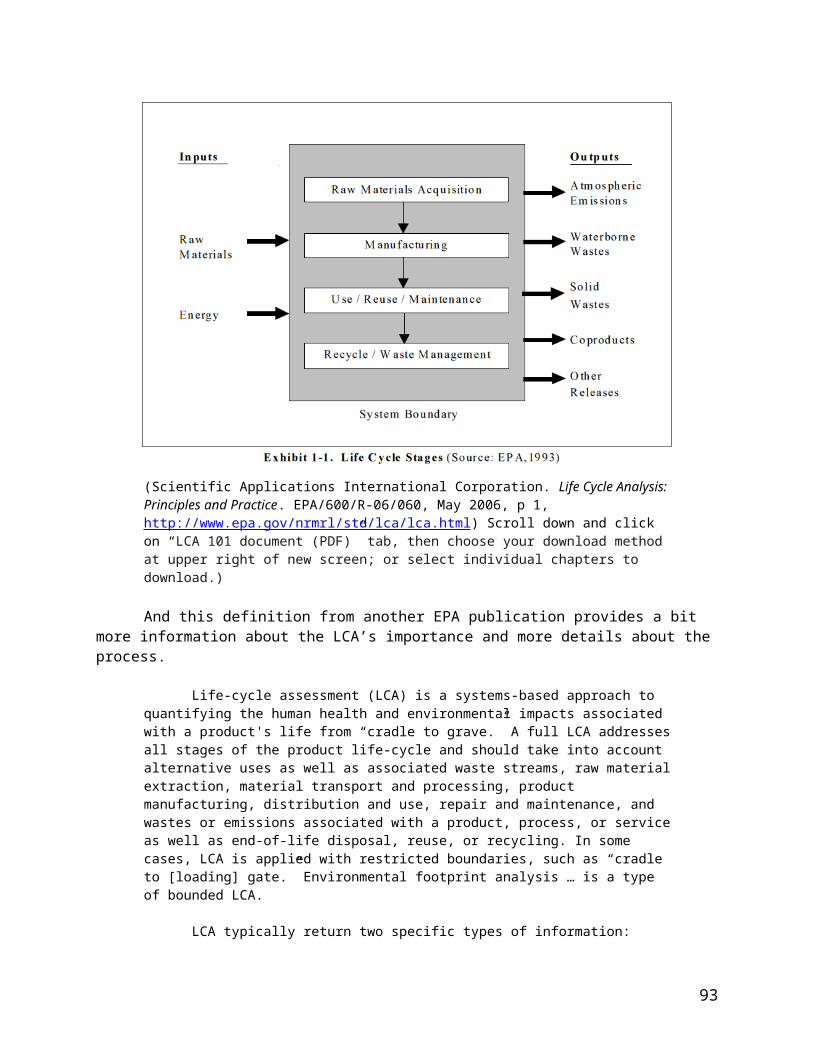
table cut diamond would appear black to the eye. Many paintings made during that time show diamonds that way.
In 1676 the rose cut was created by Belgian cutters. This was the first genuine multifaceted cut.
Around 1900 good diamond saws and jewelry lathes were developed. This created modern cuts, such as the round and the brilliant.
Cutting a diamond always results in a great loss of weight. Even with modern knowledge and cutting tools, a cut diamond is rarely more than half as big as the uncut stone from which it was made.
The article carries an illustration of how all the light entering a diamond is refracted out of the face of the diamond. It should be noted that this only happens if the diamond is an ideal cut, i.e., the ratios of the depth to the width, to some of the other dimensions of the diamond have the ideal values. If a diamond is cut “too deep” or “too shallow,” some of the entering light will not be refracted out the front.
Why wouldn’t a diamond be cut to ideal dimensions? The answer is simple. As mentioned previously, much of the weight of a diamond is lost in cutting. Cutters would like to retain as many carats of the original diamond as possible, so sometimes a compromise is made between cutting for weight vs. cutting for a given set of dimensions.
Clarity “Clarity” measures the amount of internal imperfections that exist within a diamond. These imperfections are referred to as inclusions.
There is more than one agency that grades diamond clarity. The one that is most common in the United States is done by the Gemological Institute of America. You may have heard the term “GIA” attached to a clarity rating.
The GIA grades diamond clarity according to the following scale:
FL—“flawless”—this means that there are no inclusions visible at 10X magnification.
IF—“internally flawless”—this means that while no inclusions are visible at 10X magnification, some small blemishes may be visible.
VVS1 and VVS2—the “VVS” stands for “very very small.” This means that the diamond may contain very very small inclusions that are visible, but very difficult to see at anything under 10X magnification. VVS1 is better than VVS2.
VS1 and VS2—this means that very small inclusions are visible under magnification, but are not visible to the naked eye.
SI1 and SI2—“SI’ stands for “small inclusions.” This means that small inclusions may be visible to the naked eye if you know where to look.
I1, I2 and I3—“imperfect” These grades have inclusions that are visible to the naked eye. For I3, the inclusions impact the brilliance of the diamond and are large and obvious.
Color The GIA specifies the color of a diamond by using the letters “D” to “Z.”
colorless: D, E, F
near colorless: G, H, I, J
faint yellow or brown: K, L, M
very light yellow or brown: N, O, P, Q, R
light yellow or brown: S, T, U, V, W, X, Y, Z
93

Colorless diamonds carry a higher price tag than yellow diamonds, but interestingly, when a diamond’s color gets beyond the “Z” grading it now is classified as a “fancy color,” and may actually demand a premium price. This is especially true if the color is intense and rare. Fancy color diamonds come in virtually all colors of the rainbow. One famous example is the Hope Diamond, which is a deep blue color.
Color differences are very subtle. When a gemologist is attempting to specify the color of a diamond, it is often placed against a white background and next to a diamond whose color has previously been established.
There is another color factor called fluorescence, which more accurately should be called photoluminescence. When a diamond contains trace amounts of the element boron it will fluoresce when exposed to ultraviolet light. This fluorescence should be described on the diamond’s certificate as none, faint, medium, medium blue, strong, strong blue, and intense blue. This can be considered a “plus” or a “minus,” depending upon the specific characteristics of a particular diamond and the purchaser’s personal preference.
Carat This, of course, refers to the size (or more correctly, the mass) of a diamond. One carat is equal to 0.200 g, or 200 mg. A “point” is one-hundredth of a carat. A “10 point” diamond is 0.10 carat. Doesn’t “10 point” sound more impressive than “two-hundredths of a gram?”
It is interesting, then, to think about diamonds as chemical substances, minerals or as gems. Each of those “lenses” provides another perspective on this unique substance. In the next section of the Teacher’s Guide we will look at the formation of diamonds and so emphasize their mineral nature.
More on the formation of diamonds
Diamonds form in the Earth’s mantle, which begins about 100 km below the surface of the Earth. The diagram shows the interior structure of the Earth which consists of three concentric layers—the core, mantle, and crust. This structure was created within a few hundred million years of Earth's formation 4.5 billion years ago. The core is primarily an iron-nickel alloy and makes up most of the mass of Earth. The mantle is sandwiched between the core and the thin crust and is composed predominantly of magnesium and iron silicate minerals.
Beginning at a depth of about 100 km there is sufficient pressure and temperature for diamonds to form. At this depth the pressure is 435,113 pounds per square inch (that’s about 3,000,000 kPa) and 752 oF (400 oC), sufficient to form diamonds. At greater depths the temperatures and pressures are greater. Below the ocean, depths of at least 200 km are required to achieve the necessary temperature and pressure since the oceans are somewhat cooler and less dense than the crust.
(http://science.howstuffworks.com/environmental/earth/geology/diamond1.htm)
94

These diamond-forming conditions occur naturally only in the lithospheric mantle (see diagram at right). The correct combination of temperature and pressure is only found in the thick, ancient, and stable parts of continental plates where regions of lithosphere known as cratons exist. Presence in the cratonic lithosphere for long periods of time allows diamond crystals to grow larger.
Using analysis methods employing carbon’s stable isotopes C-12 and C-13 and using radioactive dating methods that involve other impurities in diamonds, it has been shown that the carbon found in diamonds comes from both inorganic and organic sources. Some diamonds, known as harzburgitic, are formed from inorganic carbon originally found deep in the Earth's mantle, carbon that was present when the earth was formed. In contrast, eclogitic diamonds contain organic carbon from organic material like carbonates and hydrocarbons that have been pushed down from the surface of the Earth's crust through subduction (the process in which a tectonic plate moves under another plate and sinks into the Earth’s mantle) before being transformed into diamond. These two different source carbons have measurably different C-13 : C-12 ratios. Diamonds that have come to the Earth's surface are generally very old, ranging from under 1 billion to 3.3 billion years old. The youngest diamond is 900 million years old, and the oldest is 3.2 billion years old. The article notes that diamonds do not form from coal since coal deposits are located just 2-3 miles under the Earth’s surface.
The article briefly describes how diamonds that are formed—remember, more than 100 km under the Earth’s surface—make it to the surface. In the distant past, diamonds were carried to the surface via streams of molten volcanic material that flow violently upward through existing spaces in the Earth’s mantle and crust. The molten material containing diamonds eventually cooled and formed mounded cones called kimberlites, and it is in and around these mounds that diamonds are typically found today.
Kimberlite is a bluish rock that diamond miners look for when seeking out diamond deposits. The result of the upward rush of material from the mantle produces a region of cooled diamond-containing magma in the rough cone shape—narrower at the root and wider near the surface. The pipes may be as wide as several hundred meters at the surface and narrowing to one to ten meters at the root. The pipe
95
(http://www.universetoday.com/73597/what-is-lithosphere/)
(http://hosting.soonet.ca/eliris/geoforum/diamonds.htm)
may extend two to three kilometers deep. In these pipes is where diamonds can be found. The diagram above shows an idealized version of a kimberlite pipe with its three major regions—the crater near the surface, the diatreme which contains most of the diamonds and the root that leads to the mantle.
The eruptions bringing diamonds near the surface must have occurred quickly because diamonds made it to the surface intact. Had the process been slower the crystalline diamonds would have been subjected to a slower cooling process and would have been converted to graphite since at lower temperatures and pressures graphite is the more stable allotrope of carbon. What provided the upward force? Until 2012, scientists were uncertain how it was possible for tons of molten material to speed upward against gravity at 20–30 miles per hour. Research done at Ludwig-Maximilians-Universität München (LMU) in Munich, Germany, provides an explanation:
Exactly how kimberlites acquire the necessary buoyancy for their long ascent through Earth's crust has, however, been something of a mystery.
An international research team led by Professor Donald Dingwell, Director of the Department of Geo- and Environmental Sciences at LMU, has now demonstrated that assimilated rocks picked up along the way are responsible for the [sic] providing the required impetus. The primordial magma is basic, but the incorporation of silicate minerals encountered during its ascent makes the melt more acidic. This leads to the release of carbon dioxide in the form of bubbles, which reduce the density of the melt, essentially causing it to foam. The net result is an increase in the buoyancy of the magma, which facilitates its continued ascent. "Because our results enhance our understanding of the genesis of kimberlite, they will be useful in the search for new diamond-bearing ores and will facilitate the evaluation of existing sources," says Dingwell.
Most known kimberlites formed in the period between 70 and 150 million years ago, but some are over 1200 million years old. Generally speaking, kimberlites are found only in cratons, the oldest surviving areas of continental crust, which form the nuclei of continental landmasses and have remained virtually unchanged since their formation eons ago. Kimberlitic magmas form about 150 km below Earth's surface, i.e. at much greater depths than any other volcanic rocks. The temperatures and pressures at such depths are so high that carbon can crystallize in the form of diamonds. When kimberlitic magmas are forced through long chimneys of volcanic origin called pipes, like the water in a hose when the nozzle is narrowed, their velocity markedly increases and the emplaced diamonds are transported upwards as if they were in an elevator. This is why kimberlite pipes are the sites of most of the world's diamond mines. But diamonds are not the only passengers. Kimberlites also carry many other types of rock with them on their long journey into the light.
In spite of this "extra load," kimberlite magmas travel fast, and emerge onto Earth's surface in explosive eruptions. "It is generally assumed that volatile gases such as carbon dioxide and water vapour play an essential role in providing the necessary buoyancy to power the rapid rise of kimberlite magmas," says Dingwell, "but it was not clear how these gases form in the magma." With the help of laboratory experiments carried out at appropriately high temperatures, Dingwell's team was able to show that the assimilated xenoliths play an important role in the process. The primordial magma deep in the Earth's interior is referred to as basic because it mainly consists of carbonate-bearing components, which may also contain a high proportion of water. When the rising magma comes into contact with silicate-rich rocks, they are effectively dissolved in the molten phase, which acidifies the melt. As more silicates are incorporated, the saturation
96

level of carbon dioxide dissolved in the melt progressively increases as carbon dioxide solubility decreases. When the melt becomes saturated, the excess carbon dioxide forms bubbles.
"The result is a continuous foaming of the magma, which may reduce its viscosity and certainly imparts the buoyancy necessary to power its very vehement eruption onto the Earth's surface," as Dingwell explains. The faster the magma rises, the more silicates are entrained in the flow, and the greater the concentration of dissolved silicates -- until finally the amounts of carbon dioxide and water vapor released thrust the hot melt upward with great force, like a rocket.
The new findings also explain why kimberlites are found only in ancient continental nuclei. Only here is the crust sufficiently rich in silica-rich minerals to drive their ascent and, moreover, cratonic crust is exceptionally thick. This means that the journey to the surface is correspondingly longer, and the rising magma has plenty of opportunity to come into contact with silicate-rich minerals.
(http://www.sciencedaily.com/releases/2012/01/120123094523.htm)
Diamonds, then, were deposited millions of years ago on or near the Earth’s surface by the kimberlite eruptions. Diamonds were first discovered in India nearly 3,000 years ago. In modern times, diamond mining is an important industry in Russia, Canada, Brazil, Angola, Botswana and many other central and South African countries. The United States produces no commercial diamonds, but a well-known “recreational” diamond site in the United States is Crater of Diamonds State park near Murfreesboro, Arkansas. Here are excerpts from the park’s Web site:
Arkansas The Natural State is blessed with an abundance of geological wonders. Crater of Diamonds State Park, the only diamond-producing site in the world open to the public, stands out as a unique geological "gem" for you to explore and enjoy.Here you can experience a one-of-a-kind adventure hunting for real diamonds. You'll search over a 37 1/2-acre plowed field, the eroded surface of an ancient volcanic crater that 100 million years ago brought to the surface the diamonds and some of the semi-precious stones lucky visitors find here today.
In 1906, John Huddleston, the local farmer who owned this property then, found the first diamonds near Murfreesboro, Arkansas, and started the diamond mining rush. According to the history of Crater of Diamonds State Park, after a series of ill-fated diamond mining ventures, followed by tourist attractions, the diamond mine site became an Arkansas state park in 1972.
Within the park boundary, many remnants of old mining ventures remain, including the Mine Shaft Building, the Guard House, mining plant foundations, old mining equipment and smaller artifacts. Nowhere else is North American diamond mining history as evident or as well preserved as here. (http://www.craterofdiamondsstatepark.com/)
The most common method of diamond mining is the open pit method. The diamond-containing kimberlite is loosened at the surface and removed to other locations for sorting and processing. Continued mining results in an open pit being formed with perimeter roadways leading to the bottom where the mining process occurs. Once the open pit method fails to produce diamonds in sufficient quantity and of sufficient value, underground mining methods are used. Tunnels are dug into the kimberlite pipe and material is removed for processing.
97

In nearby processing plants the diamondiferous material is carefully crushed to release the raw diamonds. Large quantities of kimberlite are crushed to produce small quantities of diamonds. The kimberilte ore may be milled to release the diamonds. In the milling process the kimberlite is placed in large rotating drums containing water. Slowly the water erodes away the kimberlite, leaving raw diamonds. The diamonds are then washed and screened to separate out various size gems. An alternative method to screening sends a conveyer belt containing washing material under an x-ray machine. If the x-ray machine detects a diamond, a trap door is opened, letting the diamond fall into a separate container. The final steps include polishing and cutting the raw diamonds to produce gem-quality stones for use in jewelry.
The most popular cut is the round brilliant because of its ability to give a stone the greatest possible brilliance and fire with the minimal amount of weight loss. The rough diamond is divided into two parts by sawing or cleaving. Most stones are sawed across the "grain" (visible evidence of the diamond's crystal structure) by a paper-thin metal disc coated with diamond dust revolving at high speed, or they are cut by laser. The stones that are marked for cleaving are split along the grain by a single blow from a steel blade. After cleaving or sawing, the corners of the diamond are rounded off by a process known as bruting or girdling. The stone is cemented into a lathe, a holder that fits on a turning shaft. Another diamond is cemented to the end of a long rod held under the bruter's arm. As the lathe rotates, the two diamonds are brought together and ground to shape. The stones are then polished. One by one, facets will be ground on to the stone. A facet is the tiny plane or surface that traps the light and makes a diamond sparkle. Most diamond cuts have 58 facets.
In 2012, diamonds valued at more than $12.6 billion were produced world-wide. As noted above, Russia was the leading producer, followed by the Democratic Republic of Congo, Botswana, Zimbabwe, Australia and Angola.
Diamond mining has been controversial not because of its science but because the proceeds from some diamond mining have been used to fund civil wars, insurgencies and other inter- and intra-country conflicts. These conflicts are too numerous to list here. Diamonds mined to fund conflicts are called “conflict diamonds” or “blood diamonds.” If you want to have your class explore this topic, see Web sites and the classroom activities near the end of this Teacher’s Guide. Conflict diamonds are a central plot point throughout the 2002 James Bond film Diamonds Are Forever (1971) and the 2006 film Blood Diamond.
Since 2003, “conflict-free” diamonds are regulated by the Kimberley Process, a set of requirements to insure that the proceeds from diamond mining are not funding wars and other violent conflicts. A few details from the Kimberley Process site:
KP Basics
The Kimberley Process started when Southern African diamond-producing states met in Kimberley, South Africa, in May 2000, to discuss ways to stop the trade in ‘conflict diamonds' and ensure that diamond purchases were not financing violence by rebel movements and their allies seeking to undermine legitimate governments.
In December 2000, the United Nations General Assembly adopted a landmark resolution supporting the creation of an international certification scheme for rough diamonds. By November 2002, negotiations between governments, the international diamond industry and civil society organisations resulted in the creation of the Kimberley Process Certification Scheme (KPCS). The KPCS document sets out the requirements for
98

controlling rough diamond production and trade. The KPCS entered into force in 2003, when participating countries started to implement its rules.
Who is involved?
The Kimberley Process (KP) is open to all countries that are willing and able to implement its requirements. The KP has 54 participants, representing 81 countries, with the European Union and its Member States counting as a single participant. KP members account for approximately 99.8% of the global production of rough diamonds. In addition, the World Diamond Council, representing the international diamond industry, and civil society organisations, such as Partnership-Africa Canada, participate in the KP and have played a major role since its outset.
How does the Kimberley Process work?
The Kimberley Process Certification Scheme (KPCS) imposes extensive requirements (*) on its members to enable them to certify shipments of rough diamonds as ‘conflict-free' and prevent conflict diamonds from entering the legitimate trade. Under the terms of the KPCS, participating states must meet ‘minimum requirements' and must put in place national legislation and institutions; export, import and internal controls; and also commit to transparency and the exchange of statistical data. Participants can only legally trade with other participants who have also met the minimum requirements of the scheme, and international shipments of rough diamonds must be accompanied by a KP certificate guaranteeing that they are conflict-free.(http://www.kimberleyprocess.com/en/about)
Students can learn more about conflict diamonds by referring to a lesson plan developed by the PBS Newshour at http://www.pbs.org/newshour/extra/teachers/lessonplans/world/conflict_diamonds_12-06.html.
The high pressure and temperature required for diamond formation also occur during meteorite impact. Tiny diamonds, known as microdiamonds or nanodiamonds, have been found in meteorite impact craters. These can be used as one indicator of ancient impact craters. Also, diamonds formed in extraterrestrial space, then deposited on earth by meteorites, have been found in South America and Africa.
More on artificial diamonds
Artificial (or synthetic) diamonds have been produced since the 1950s. Currently more than 100 tons of the artificial stones are produced annually. Claims of diamond synthesis were first reported between 1879 and 1928 but were not confirmed. After World War II, the U.S., Sweden and Russia began diamond synthesis research in earnest using the high pressure-high temperature and chemical vapor deposition methods (see below for more on these methods). In the early 1950s teams from Sweden and the U.S. successfully synthesized diamonds.
The article describes three methods of creating artificial diamonds. These methods make diamonds in a laboratory rather than the natural geological method. The oldest synthetic method, according to the article, “uses large circular presses to provide the necessary high pressure and high temperature. A carbon material is fed into the presses along with a catalyst. The press applies pressure and temperature to mimic the conditions that form natural diamonds.” This is called the high pressure-high temperature (HPHT) method. There are three kinds of presses that create the needed pressure—the belt press, the cubic press and the split-sphere press.
99
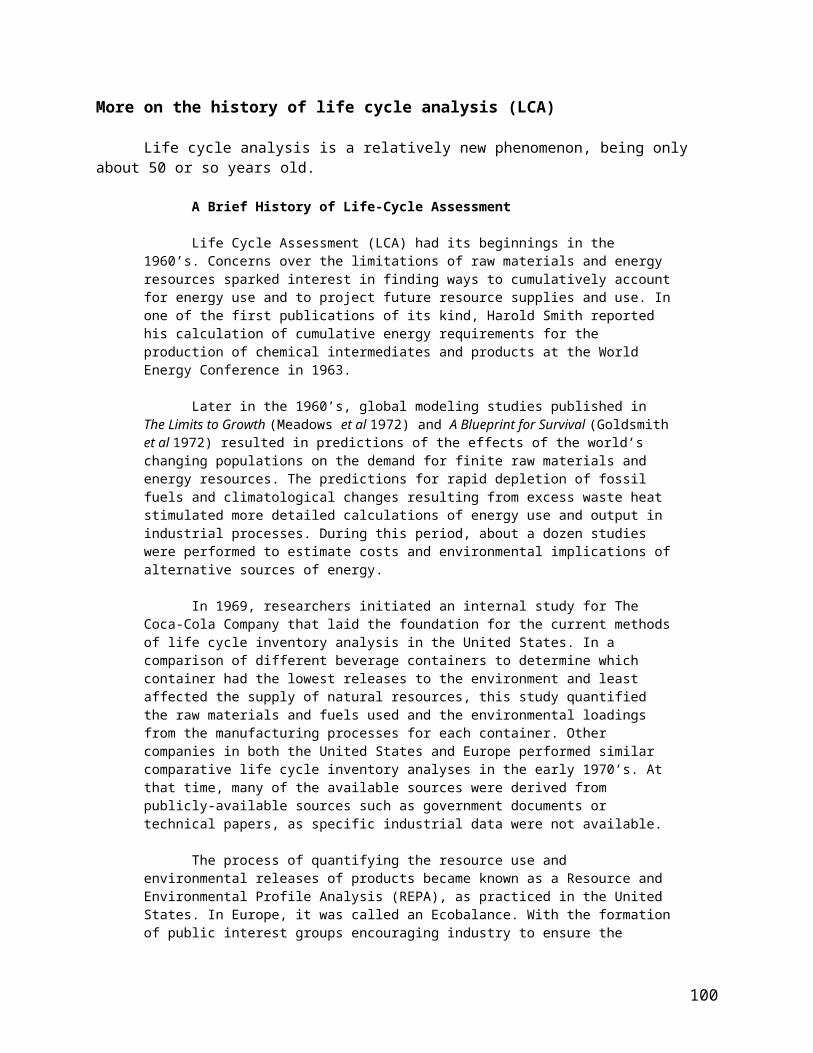
In the cubic press used by USSynthetic, a company based in Orem, Utah that makes synthetic diamonds for drill bits, the process is called sintering, in which diamonds are made from powdered diamonds and carbide. USSynthetic says:
Diamond sintering requires the application of extreme heat and pressure. Typically, diamond is sintered at a temperature of around 1400°C (2550°F). At room pressure, these extreme temperatures would cause the diamond to revert to graphite. Maintaining extremely high pressure during the sintering process allows the diamond to remain in its natural form. This typically requires pressures of around 60 kbar (nearly 1,000,000 psi)—the equivalent of a 240 km (160 mile) high column of granite.
To achieve these extremely high temperatures and pressures simultaneously, US Synthetic uses proprietary cubic press technology. The
cubic press consists of six large pistons, each of which is capable of supplying several thousand tons of force (photo at left). Each piston pushes on a small tungsten carbide anvil, which in turn compresses a cubic pressure cell that contains the raw materials (carbide and diamond crystals). As soon as the cubic press reaches the desired pressure, electric current flows through a resistance heater embedded in the pressure cell to generate the required high temperatures. These conditions are maintained long enough to ensure complete diamond-to-diamond bonding of the individual crystals.(http://www.ussynthetic.com/site/rd-sub/273/)
The belt press method applies pressure from above and below to a central cylinder. The upper and lower chambers also act as electrodes to supply the voltage needed to create the high temperature. The pressure is developed hydraulically in this press. The photo at right shows H. Tracy Hall, a member of General Electric’s Project Superpressure team that in 1954 invented the press that created some of the earliest artificial diamonds. This original press is no longer used, but an adapted version is still in current use.
The BARS apparatus (diagram on next page) is the most compact of all the diamond-producing presses. In the center of a BARS device, there is a ceramic cylindrical capsule, about 2
100
(http://www.nysun.com/obituaries/h-tracy-hall-88-created-man-made-diamonds/82789/)

cm3 in size. It is placed into a cube of pressure-transmitting material, such as a ceramic material, which is pressed by inner anvils. The outer cavity is pressed by 8 steel anvils. The whole assembly is locked in a disc-type barrel with a diameter about 1 meter. The barrel is filled with oil, which pressurizes upon heating, and the oil pressure is transferred to the
central cell. The synthesis capsule is heated up by a graphite heater.
The article says that a second method of producing artificial diamonds is chemical vapor deposition (CVD). This method involves mixing methane gas with hydrogen gas at a temperature of 700 °C to 1,200 °C. The mixture is put into a partial vacuum where the hydrogen and methane react to form a highly reactive carbon-hydrogen compound. This compound then attaches itself to diamond seed crystals or similar substrate, and in the process the carbon-hydrogen compound loses its hydrogen, leaving diamond crystals. The resulting diamonds have a structure like that of the seed crystals.
The process requires a very small volume (1–5%) of methane at pressures as low as 26 kPa but temperatures as high as 1,200 oC. Methane is the carbon source for the synthetic diamonds. The high temperature is required to form the hydrogen radicals that are the keys to this process. Hydrogen radicals reduce the methane, leaving the carbon and also eliminate any graphite that forms under these conditions.
The third method involves inserting explosives into a steel tube which is surrounded by water and setting off those explosives. The explosion creates the temperature and pressure needed to form diamonds which are typically very small—nanodiamonds. The carbon source is the carbon in the explosives. Water serves to cool the tube rapidly and prevent formation of the more stable graphite allotrope.
Uses for synthetic diamonds, in addition to jewelry, include as abrasives in cutting and polishing processes There are electronic uses as well—high-power switches and light-emitting diodes and lasers.
101

More on graphite and other allotropes
The article compares diamonds to graphite, both of which are allotropes of carbon. Graphite is interesting on its own, but even more so when compared to diamond. Remember that the two are made entirely of carbon atoms, but in different arrangements. As noted above, in a diamond each carbon atom is strongly bonded to four other carbon atoms in a rigid tetrahedral shape in which each carbon atom is equidistant from its neighboring atoms. The tetrahedral shape is repeated throughout the diamond.
In graphite each atom is bonded trigonally to three others in a plane composed of fused hexagon rings. The bonds are sp2-hybrid bonds. The resulting network is two-dimensional, and the resulting flat sheets are stacked and loosely bonded by weak van der Waals forces. These weak inter-plane bonds make graphite a good lubricant and as the “lead” in pencils. Lead pencils contain graphite, or "black lead" as it was once known, which is mixed with clay (20% to 60% by weight) and then baked to form a ceramic rod. Increasing the percentage of clay makes the pencil harder, so that less graphite is deposited on the paper
This difference in the arrangement of atoms means that diamonds and graphite have very different properties. A summary of those properties:
Diamond GraphiteMohs scale = 10 Mohs scale = 1–2Abrasive LubricantElectrical insulator Electrical conductorExcellent heat conductor Both insulator and conductor of heatTransparent OpaqueCubic system crystal Hexagonal system crystalDensity = 3.51 g/cm3 Density = 2.26 g/cm3
It is tempting to think about converting graphite into diamond. If we look at the heat of formation for diamond, the process looks easy. Beginning with heats of combustion we see:
C(s, graphite) + O2 → CO2 ΔHo = – 393.5 kJ/molC(s, diamond) + O2 → CO2 ΔHo = – 395.41 kJ/mol
Since we want to form diamond, we need to reverse the second equation which also, then, changes the sign of the ΔH:
C(s, graphite) + O2 → CO2 ΔHo = – 393.5 kJ/molCO2 → C(s, diamond) + O2 ΔHo = + 395.41 kJ/mol
Applying Hess’ Law: C(s, graphite) + O2 → CO2 ΔHo = – 393.5 kJ/mol
CO2 → C(s, diamond) + O2 ΔHo = + 395.41 kJ/mol__________________________________________________________________________________________________________________________________________________________
C(s, graphite) → C(s, diamond) ΔHo = + 1.9 kJ/mol
102

This calculation leads us to believe that a relatively small amount of energy should be required to convert graphite into diamond. However, what the calculation does not show is that the temperature-pressure conditions needed for this conversion are very high, making it impossible to easily convert graphite to diamond. Refer to the carbon phase diagram at right.
Graphite is usually found as veins, lenses, pockets and in thin layered deposits. It is found often with feldspar, mica, or quartz as impurities. There was no graphite produced in the United States in 2012. Imports came primarily from China, India and Mexico.
According to the United States Geological Service, the major uses of natural graphite in 2012 were refractory (high heat) applications, 27%; brake linings, 15%; and batteries, foundry operations, and lubricants, 8%. The uses depend on the type of graphite produced: flake, lumpy (crystalline) or amorphous. Flake graphite has low electrical resistivity and so is used in making electrodes and batteries. The flake form is also used to make graphite crucibles by combining the graphite with clay and sand at high temperatures. Such crucibles are used to melt non-ferrous metals like brass and aluminum. Both amorphous and crystalline graphite are used in lubricants because of their low coefficient of friction. The graphite is suspended in oil to form the lubricant. Amorphous graphite is also the form of choice in pencil manufacture because it is best at leaving residue on paper. The finer the graphite powder is, the darker the streak. In addition to its use in pencils, graphite is used to make battery electrodes, in composites where strength is important (tennis racquets, golf clubs, helicopter blades), artificial heart valves, lubricants, and as a nuclear power plant moderator.
Other allotropic forms of carbon are fullerenes, which include buckyballs, graphene and carbon nanotubes. In fullerenes, carbon atoms are arranged a lot like they are in graphite
except that in addition to hexagonal packing there are pentagons and heptagons. This difference causes fullerenes to be cylindrical, elliptical or spherical in shape. These forms of carbon are not found in nature but must be synthesized artificially.
Buckminsterfullerene Carbon nanotube(http://en.wikipedia.org/wiki/Buckminsterfullerene) (http://mitangles.wordpress.com/hyer/)
The graphene allotrope is made up of carbon atoms bound to each other in hexagons that form a very thin single layer—a million times thinner than a sheet of paper. Despite its thinness graphene is thought to be the strongest material known. The carbon nanotubes
103
(http://www2.chemistry.msu.edu/courses/cem152/snl_cem152_SS12/pracprob/practiceexam1.html)

referenced above are made of rolled up graphene. It is a good conductor of electricity, it is very flexible and it is transparent to visible light.
Carbon also occurs in amorphous forms. These are essentially graphite but not held in a crystalline structure. It is typically present as a powder, and is the main constituent of substances such as charcoal, lampblack (soot) and activated carbon.
Connections to Chemistry Concepts (for correlation to course curriculum)
1. Carbon chemistry—Since diamonds are made up of the element carbon, there are many aspects of carbon chemistry included here.
2. Allotropes—Diamond is one allotrope of carbon and the one featured in this article. Many other elements also exist in allotropic forms—phosphorus, oxygen, sulfur, selenium, boron, silicon, tin and iron to name several.
3. Crystal structure—The allotropes of carbon differ in the arrangement of carbon atoms in a crystalline structure. These structures are the result of a variety of chemical bonding between carbon atoms.
4. Chemical Bonding—The carbon to carbon bonding in diamonds is sp3 hybrid bonding whereas in graphite the bonding is sp2. This difference leads to differences in properties of the two forms. In addition, in graphite van der Waals forces also play an important role by weakly holding the graphite sheets together. The weakness of these intermolecular bonds enables graphite’s use as a lubricant and in pencils.
5. Chemical synthesis—Artificial diamonds are synthesized as a common practice. The various forms of syntheses are all chemical reactions carried out under different conditions.
6. Geochemistry—It is important for students to be aware of the fact that many processes usually studied in geology are actually chemical processes.
7. Chemistry and society—the issue of conflict diamonds (also known as “blood diamonds”) is an important one throughout the world and provides another example for students showing that chemistry is everywhere.
Possible Student Misconceptions (to aid teacher in addressing misconceptions)
1. “Diamonds are made from coal.” The article states, “One common belief is that diamonds are formed from the metamorphism of coal, as pressure compresses coal into diamonds. In reality, this is rarely true. Coal seldom exists at depths greater than 2 miles (3.2 km) below the Earth’s surface. Diamonds, on the other hand, are formed deep under the surface of the Earth, some 90 miles (150 km) down. Diamonds can only be formed under very high pressure and high temperatures. These conditions exist in some parts of the Earth’s mantle, where temperatures reach more than 2000 °F (1050 °C). These areas are also under enormous pressure from the weight of the overlying rock.”
2. “Since diamonds are so expensive, they must be really rare.” Up until the middle of the 19th Century diamonds were, in fact, rare. But when diamond mines were discovered in Africa the supply of the gems increased dramatically in a short period of time. In order to keep the price of diamonds at their high levels, De Beers, the company that controls about 90 per cent of the diamond supply world-wide, devised a marketing plan to convince the
104

public that diamonds were expensive because they were rare. The campaign worked so well that most people today believe that diamonds are the rarest gems on earth. They are not. Emeralds, sapphires and rubies are much rarer than diamonds but are also much less expensive.
Anticipating Student Questions (answers to questions students might ask in class)
1. “Can you make diamonds from graphite?” Considering the relatively small amount of heat needed to make this conversion, the answer should be “yes,” but, in fact, the conditions needed to accomplish this conversion are so extreme, that the reaction will not occur. See “More on graphite and other allotropes.”
2. “How can diamonds and graphite both be made entirely of carbon? They have very different properties” This is a good opportunity to explain how the arrangement of atoms and the bonding between atoms can affect the properties of the material. In the case of diamonds, carbon atoms are arranged in a tetrahedral shape and are bonded by sp3 bonding. This leads to diamond’s hardness, inability to conduct and electric current and other properties. Graphite, on the other hand, is made up of carbon atoms that are arranged in sheets via sp2 bonding with the sheets held together by weak van der Waals forces. Graphite is much softer and conducts a current.
3. “Is carbon the only element that has allotropes?” There are other elements that exist in allotropic forms. Phosphorus exists in several forms—white and red phosphorus primarily. Sulfur has a large number of allotropes. Students probably know about molecular oxygen and ozone, two allotropes of oxygen. Other elements that exist in varying forms include boron, silicon, arsenic, tin, iron and antimony.
In-class Activities (lesson ideas, including labs & demonstrations)
1. You can conduct a lab activity in which students grow crystals and observe the resulting shapes. A typical procedure can be found here: http://scme-nm.org/files/1-3%20Structure%20Crystals%20%20LAB%20Growing%20Crystals%20Rev%203.pdf . Here is another procedure: http://nobel.scas.bcit.ca/debeck_pt/science/crystals/crystals_p1.htm. And this procedure stresses nanotechnology and self-assembly: http://scme-nm.org/files/1-3%20Structure%20Crystals%20%20LAB%20Growing%20Crystals%20Rev%203.pdf.
2. Here is a series of videos and exercises on nanotubes and other forms of carbon (diamond, graphite, buckyballs, and nanotubes. The videos can be used as a class presentation on the individual allotropes. (http://mrsec.wisc.edu/Edetc/cineplex/nanotube/index.html)
3. Obtain a set of mineral samples from an earth science teacher and review the Mohs scale of hardness that students may have encountered in an earlier course. Graphite and diamond appear at the extremes of the scale. Graphite is grouped with minerals similar to talc and is given a value of 1.5 on the hardness scale. Diamond, on the other hand, is given a value of 10, the highest number used in the scale. A simple lesson plan can be accessed here and adapted for your grade level: http://209.7.198.36/geologyonline/lessons/4.4/lesson.pdf.
4. This nicely-done booklet from the Caterpillar Corporation has a series of lessons on geology and mineralogy, including a lesson on using the Mohs scale to identify minerals. (https://mining.cat.com/cda/files/2793342/7/GroundRules-Geology-15-18.pdf)
105

5. The following Web site is a complete classroom unit of study on the allotropes of carbon: http://www.nsec.northwestern.edu/Curriculum%20Projects/Carbon%20Allotropes.pdf.
6. Students can perform lab activities related to crystal structures from this site: http://www.yale.edu/ynhti/curriculum/units/1989/6/89.06.04.x.html.
7. This lab activity investigates crystals, unit cells and heat transfer through graphite: http://www.orau.org/science-saturdays/documents/crystal-science-lesson-plan.pdf.
8. This lab focuses on carbon structures including diamonds: http://www.thirteen.org/edonline/ntti/resources/lessons/s_diamonds/b.html.
9. This is a Web-based short course in crystals (requires free registration): http://education-portal.com/academy/lesson/crystal-structures-and-the-unit-cell.html#tp.
10. If you would like your class to learn more about conflict diamonds, this lesson plan will be helpful: http://www.pbs.org/newshour/extra/teachers/lessonplans/world/conflict_diamonds_12-06.html.
11. This extensive set of lessons, tests, essays and background material is based on Ian Fleming’s Diamonds Are Forever: http://www.bookrags.com/lessonplan/diamonds-are-forever/. Much of this is not science but will be of interest to students.
12. Your students can engage in a series of lessons on Blood Diamonds using this site: http://socialsciences.dadeschools.net/files/African%20american%20history%20lessons/Blood%20Diamonds%20and%20how%20they%20Affect%20Us.pdf.
Out-of-class Activities and Projects (student research, class projects)
1. Students might interview local jewelers about the traits of diamonds and other gems and combine their results in a classroom display. Be sure to coordinate the list of jewelers so that multiple students don’t contact the same jeweler.
2. Students or teams of students can research topics related to conflict diamonds and present findings to the class. (See Web sites below.) You might want to pair up with a social studies teacher to connect the chemistry to the societal issues arising from diamond mining.
3. Students might enjoy researching and reporting on famous diamonds like the Hope Diamond, the Koh-I-Noor Diamond, the DeBeers, the Blue Hope, the Great Star of Africa, the Kimberley or the Taylor-Burton. A list of famous diamonds can be found here: http://famousdiamonds.tripod.com/famousdiamonds.html.
4. Much of the history of diamonds can be found in the history of the DeBeers Company. Students might be interested in researching DeBeers and debating some of their business practices.
5. Assign students to research all the allotropes of carbon and prepare posters or videos or papers on their findings.
6. Students can learn more about crystal shapes by making paper cut-outs of various basic shapes: http://www.ellenjmchenry.com/homeschool-freedownloads/earthscience-games/documents/Crystalshapes.pdf. This activity provides a few more technical details: http://crystallography.org.uk/wp-content/uploads/2011/07/crystal_classes.pdf.
7. If your students are at all artistic and interested in origami, here is a template for making paper diamonds: http://www.minieco.co.uk/images/apr12/paper-diamond-template.pdf, with directions here: http://www.minieco.co.uk/3d-paper-diamonds/.
8. Build a diamond model. The April 1990 issue of ChemMatters included a template for constructing a diamond model. The template is reproduced below. It may be resized and copied onto stiff paper. Students may use the template to construct individual models, or
106

they may combine templates to construct a much larger model. A series of the individual models could be artistically combined to create a diamond “mobile.”
107

The references below can be found on the ChemMatters 30-year CD (which includes all
articles published during the years 1983 through April
2013 and all available Teacher’s Guides). The CD is in production and will be available from the
American Chemical Society at this site: http://ww.acs.org/chemmatters.Selected articles and the complete set of
Teacher’s Guides for all issues from the past three years are also available free online on the same
site.(The complete set of ChemMatters articles and Teacher’s Guides are available on the 30-year CD for all past issues, (up to April 2013.)
Some of the more recent articles (2002 forward) may also be available online at the link above. Simply click on the “Past Issues” button directly below the “M” in the ChemMatters logo at the top of the Web page. If the article is available online, you will find it there.
30 Years of ChemMatters !
References (non-Web-based information sources)
Zaugg, H. Growing Diamonds ChemMatters 1990, 8 (2), pp 10–14. The author examines properties of carbon allotropes and emphasizes ways of producing diamond films for industrial uses. At the end of the article there is a template that can be used to create a cut-out mobile of the crystal structure of a diamond.
Davenport, D. Burning Diamonds and Squeezing Peanuts. ChemMatters 1990, 8 (2), pp 14–15. The second diamond article in this edition (see Zaugg, below) focuses on methods of converting diamonds to graphite and the reverse. Includes some interesting history.
Wood, C. Two Faces of Carbon, ChemMatters 2004, 22 (4), pp 4–6. The “hook” in this article is a company that combines carbon from cremated human remains with added carbon to produce diamonds. The article actually describes that structure and properties of diamonds and the uses of the gems and compares these to graphite.
Ritter, S. Pencils & Pencil Lead, Chemmatters 2007, 25 (2), pp 11–12. The role of graphite in pencil “lead” is one feature of this article on how pencils are made.
Sicree, A. Graphite vs. Diamond: Same Element but Different Properties, ChemMatters 2009, 27 (3), pp 13–14. Sicree compares diamonds to graphite, especially in terms of their respective structures and describes how diamonds are produced, naturally and synthetically.
108

Tinnesand, M. Graphene: The Next Wonder Material? ChemMatters 2012, 30 (3), pp 6–8. This article describes the properties and uses of one allotrope of carbon. Graphene is the thinnest but strongest form of matter known to man.
Web Sites for Additional Information (Web-based information sources)
More sites on diamonds
Properties of diamonds are highlighted in this site from the BBC in Britain: http://www.bbc.co.uk/schools/gcsebitesize/science/add_ocr_gateway/chemical_economics/nanochemistryrev1.shtml.
The Royal Society of Chemistry provides a very nice site on the advanced uses of diamonds: http://www.rsc.org/chemistryworld/Issues/2011/September/DiamondsAreForEverything.asp.
A very readable number of Web pages can be found on this “How Diamonds Work” site, including properties, formation, structure and more. (http://science.howstuffworks.com/environmental/earth/geology/diamond.htm)
There are sections on this Web page from the Natural History Museum on properties of diamonds, age, formation and exhibits of diamonds at the museum: http://www.nhm.ac.uk/nature-online/earth/rock-minerals/diamonds/index.html.
Although this site from Purdue University is about the chemistry of carbon, it includes some basic information about diamonds: http://chemed.chem.purdue.edu/genchem/topicreview/bp/ch10/carbon.php.
More sites on diamond formation
This documentary from the BBC explains how diamonds are formed, both naturally and synthetically: http://www.youtube.com/watch?v=_wJYkWpd6OY.
Smithsonian Magazine offers this article on diamond formation: http://www.smithsonianmag.com/science-nature/diamond.html.
Along with many other facets (no pun intended) of diamonds, this DeBeers site describes how mined diamond ore is processed: http://www.debeersgroup.com/Operations/Mining/diamond-processing/.
Scientific American explains about the geology and formation of diamonds here: http://blogs.scientificamerican.com/guest-blog/2013/05/09/some-facets-of-the-geology-of-diamonds/.
This is a very extensive and technical essay on the geology of diamonds. It was published in Reviews in Mineralogy & Geochemistry, a publication of the Mineralogical Society of America. (http://www.minsocam.org/msa/rim/RiM75/RIM075_C12.pdf)
109

More sites on artificial diamonds
This online article from the pages of the American Chemical Society’s C&E News details the production and uses of artificial diamonds: http://pubs.acs.org/cen/coverstory/8205/8205diamonds.html.
Nature Magazine provides detailed information on artificial diamonds: http://www.nature.com/physics/looking-back/diamond/index.html.
More sites on carbon and its allotropes
A complete description of all of the allotropes of carbon can be found at http://www.nanoscienceworks.org/nanopedia/carbon-allotropes.
To view an interactive page on the structure of graphite, diamond and buckminsterfullerenes, see http://www.creative-chemistry.org.uk/molecules/carbon.htm.
More sites on conflict diamonds
In this New York Times article the role of conflict diamonds and in the world supply of diamonds is chronicled: http://www.nytimes.com/library/world/africa/040600africa-diamonds-article1.html.
Amnesty International published this brief on conflict diamonds: http://www.amnestyusa.org/our-work/issues/business-and-human-rights/oil-gas-and-mining-industries/conflict-diamonds. Note the link to a conflict diamond curriculum guide on this page.
This 2011 report from CNN explains conflict diamonds: http://www.cnn.com/2011/12/05/world/africa/conflict-diamonds-explainer/. It includes a video.
If you are willing to take a one-question survey that gives you access to this article, Geology.com offers basic information on conflict diamonds and links to other classroom resources, like a map of African countries where conflict diamonds have been mined. (http://geology.com/articles/blood-diamonds.shtml)
The jewelry industry organization Brilliant Earth publishes this site that contains links to other reports and stories about conflict diamonds and related issues: http://www.brilliantearth.com/confict-diamond-trade/.
110

From Waste to Energy… Thanks to Methane
Background Information (teacher information)
More on methane generation in landfills
Methane generation around the world has different sources as well as uses. A short history about methane generation includes the following:
Scientific interest in the manufacturing of gas produced by the natural decomposition of organic matter was first reported in the 17th century by Robert Boyle and Stephen Hale, who noted that flammable gas was released by disturbing the sediment of streams and lakes. In 1808, Sir Humphry Davy determined that methane was present in the gases produced by cattle manure. The first anaerobic digester was built by a leper colony in Bombay, India, in 1859. In 1895, the technology was developed in Exeter, England, where a septic tank was used to generate gas for the sewer gas destructor lamp, a type of gas lighting. Also in England, in 1904, the first dual-purpose tank for both sedimentation and sludge treatment was installed in Hampton. In 1907, in Germany, a patent was issued for the Imhoff tank, an early form of digester.”(Source: http://en.wikipedia.org/wiki/Anaerobic_digestion)
In the United States, methane generation is done not only at landfills but also in various agricultural settings, including small livestock holdings, as well as large, commercial cattle feedlots. There are some 150 active biodigesters producing methane gas at various livestock operations both large and small. The EPA estimates that there are some 8000 additional sites that could be outfitted to produce methane gas.
There are some 600 active landfill sites that generate an estimated 500 billion cubic feet of methane per year. There is actually a computer-based software tool available from the Environmental Protection Agency (EPA) for estimating the amount of various gases that might be emitted from a landfill. It is called the Landfill Gas Emissions Model (see http://www.epa.gov/ttn/catc/dir1/landgem-v302-guide.pdf). This number of active landfills is in contrast to what the ChemMatter’s author said, that “In the United States collecting methane and converting it into energy is relatively rare…”.This energy production offsets almost 2 million tons of coal per year. There are other sources for collecting methane gas generated from the anaerobic decomposition of animal waste at farms and cattle feedlots. There is a very useful map of the USA showing how many methane generators are in operation as well as the number of potential sites for development. Refer to page16 of the pdf at http://epa.gov/lmop/documents/pdfs/overview.pdf.
Although there are some 600 landfills currently generating methane gas, there is the potential to develop another 400. The important reason for setting up a land fill to collect methane gas is to prevent the methane gas, normally generated in a landfill, from escaping into the atmosphere. Methane is a greenhouse gas that is 20 times more effective than carbon dioxide in absorbing infrared radiation that is responsible for the heating effect in the atmos-phere (global warming). Another benefit to the environment is that fact that using methane gas offsets the use of non-renewable energy sources such as coal and oil which in turn reduces the amount of gaseous emissions of sulfur dioxide, nitrogen oxide compounds, particulate matter, and carbon dioxide (particularly when using coal). Besides performing this preventive exercise,
111

there are obvious financial benefits in the commercial use of the captured gas for generating electricity (for 1.2 million homes), providing a heating source (for 750 thousand homes), powering vehicles, and as a stock material for synthesizing a variety of chemicals including ethanol (rather than using fermentation of corn).
Several issues about landfill natural gas generation include startup costs, the lifespan of a landfill, and several environmental issues including leaking liners for the landfill and whether or not heavy metals and other toxins can escape into the atmosphere. But some well known companies are making use of landfill-generated methane to power their operations. In the case of Microsoft, they have deliberately built a new facility near to a landfill for methane acquisition. In this particular case, they are also being very innovative because they are using the methane to power fuel cells for electricity generation rather than channeling the gas through an electric turbine for power generation. Another company, SC Johnson in Racine Wisconsin, is also using methane from a landfill to generate electricity to power up their plant operation. The United States Environmental Protection Agency (EPA) is actively promoting the use of landfill-generated methane (LFGM) for industrial use. Their Web site (http://www.epa.gov/lmop/projects-candidates/index.html) provides information to interested commercial operations who want to use LFNM. At this site you can find a map of the USA that shows the number of LFGM sites currently in operation and how many more potential sites exist.
More on biochemical activity in landfills
The biological and chemical activity in a landfill is well documented in terms of the expected outcomes for the final degradation products. Interaction between different types of bacteria and their physical/chemical environments is explained below.
The Four Phases of Bacterial Decomposition of Landfill Waste
Bacteria decompose landfill waste in four phases. The composition of the gas produced changes with each of the four phases of decomposition. Landfills often accept waste over a 20- to 30-year period, so waste in a landfill may be undergoing several phases of decomposition at once. This means that older waste in one area might be in a different phase of decomposition than more recently buried waste in another area.
Phase IDuring the first phase of decomposition, aerobic bacteria—bacteria that live only in the presence of oxygen—consume oxygen while breaking down the long molecular chains of complex carbohydrates, proteins, and lipids that comprise organic waste. The primary byproduct of this process is carbon dioxide. Nitrogen content is high at the beginning of this phase, but declines as the landfill moves through the four phases. Phase I continues until available oxygen is depleted. Phase I decomposition can last for days or months, depending on how much oxygen is present when the waste is disposed of in the landfill. Oxygen levels will vary according to factors such as how loose or compressed the waste was when it was buried.
Phase IIPhase II decomposition starts after the oxygen in the landfill has been used up. Using an anaerobic process (a process that does not require oxygen), bacteria convert compounds created by aerobic bacteria into acetic, lactic, and formic acids and
112

alcohols such as methanol and ethanol. The landfill becomes highly acidic. As the acids mix with the moisture present in the land-fill, they cause certain nutrients to dissolve, making nitrogen and phosphorus available to the increasingly diverse species of bacteria in the landfill. The gaseous byproducts of these processes are carbon dioxide and hydrogen. If the landfill is disturbed or if oxygen is somehow introduced into the landfill, microbial processes will return to Phase I.
Phase IIIPhase III decomposition starts when certain kinds of anaerobic bacteria consume the organic acids produced in Phase II and form acetate, an organic acid. This process causes the landfill to become a more neutral environment in which methane-producing bacteria begin to establish themselves. Methane-and acid-producing bacteria have a symbiotic, or mutually beneficial, relationship. Acid-producing bacteria create compounds for the methanogenic bacteria to consume. Methanogenic bacteria consume the carbon dioxide and acetate, too much of which would be toxic to the acid-producing bacteria.
Phase IV Phase IV decomposition begins when both the composition and production rates of landfill gas remain relatively constant. Phase IV landfill gas usually contains approximately 45% to 60% methane by volume, 40% to 60% carbon dioxide, and 2% to 9% other gases, such as sulfides. Gas is produced at a stable rate in Phase IV, typically for about 20 years; however, gas will continue to be emitted for 50 or more years after the waste is placed in the landfill (Crawford and Smith 1985). Gas production might last longer, for example, if greater amounts of organics are present in the waste, such as at a landfill receiving higher than average amounts of domestic animal waste.
(http://www.atsdr.cdc.gov/HAC/landfill/html/ch2.html)
The various conditions that affect bacterial and chemical activity in a landfill include the following:
Waste composition. The more organic waste present in a landfill, the more landfill gas (e.g., carbon dioxide, methane, nitrogen, and hydrogen sulfide) is produced by the bacteria during decomposition. The more chemicals disposed of in the landfill, the more likely NMOCs and other gases will be produced either through volatilization or chemical reactions.
Age of refuse. Generally, more recently buried waste (i.e., waste buried less than 10 years) produces more landfill gas through bacterial decomposition, volatilization, and chemical reactions than does older waste (buried more than 10 years). Peak gas production usually occurs from 5 to 7 years after the waste is buried.
Presence of oxygen in the landfill. Methane will be produced only when oxygen is no longer present in the landfill.
Moisture content. The presence of moisture (unsaturated conditions) in a landfill increases gas production because it encourages bacterial decomposition. Moisture may also promote chemical reactions that produce gases.
Temperature. As the landfill's temperature rises, bacterial activity increases, resulting in increased gas production. Increased temperature may also increase rates of volatilization and chemical reactions. The box on the following page provides more detailed information about how these variables affect the rate and volume of landfill gas production.
113
(http://www.atsdr.cdc.gov/HAC/landfill/html/ch2.html
The chemical equation for the production of methane by bacteria is:CO2 (g) + 4H2 (g) CH4 (g) + 2 H2O
The bacteria are using this biochemical reaction to generate energy through electron transfer that occurs in the production of the chemical, adenosine triphosphate (ATP). The carbon dioxide is the oxidizing agent and the hydrogen is the reducing agent. The hydrogen is the “waste” end product from the metabolism of other heterotrophic microorganisms. Heterotrophic bacteria chemically change carbon-containing compounds into water and carbon dioxide, an energy-generating process for the bacteria. Both the carbon dioxide and hydrogen are then available in the environment for the bacteria that generate methane.
(Note: The methane-generating bacteria are not considered bacteria, technically speaking. They belong to the domain, archaea, which are considered to be ancient life forms that evolved separately from bacteria and blue-green algae. Sometimes they are referred to as Archaea methanogens.)
More on anaerobic digesters (methane) for livestock excrement
In the United States, there are productive methane generators using the excrement of various types of livestock including beef and dairy cattle, swine, and poultry. The methane produced is used on site for electricity and heat production needed in various aspects of a farm operation. Large livestock feedlots generate enough methane for electricity production to be self-sufficient in electrical usage.
114

(http://www.epa.gov/agstar/anaerobic/ad101/index.html)
From analysis, it is felt that the residue left over in a biodigester contains organic material that is actually of higher nutritive content for fertilizer use than the original animal dung.
A good example of an integrated approach (called a closed loop system) for a manure-based biodigester generates methane for heat and electricity to power an ethanol production plant. In this the setup, the ethanol plant uses locally grown corn crops to produce the alcohol through fermentation. The fermentation tanks are kept at an optimum temperature through heating, using some of the methane gas produced by the bio digester. The biodigester utilizes the manure gathered from cattle feedlots in the area. And the cattle feed includes the spent distillers’ grains left over from the ethanol fermentation tanks.
(http://www.extension.org/pages/67633/anaerobic-digestion-of-finishing-cattle-manure#.Up4rNCeZcx4)
More on biodigesters for local (home) use
Both India and China have actively promoted the use of biodigesters for home use for well over thirty years. Consequently they have had much experience in modifying the design of these permanently installed devices. One of the important concepts behind the efficient operation of the biodigester is to have the proper ratio of a nitrogen-to-carbon mix. When the fermentation rate decreases (other than due to too low an operating temperature), operators are advised to alter the N:C ratio of 1:30. Usually the system has too high a nitrogen content
115

(primarily from excrement) which can be modified by adding a carbon source such as plant material—in particular, plant stalks and leaves. The addition of something like grass is a good choice.
In China, government programs to promote the use of biodigesters in rural areas have been successful because the poor people recognized the economic value of producing usable energy as well as fertilizer from the compost. Figures for 2006 show some 22,600 biogas tanks supplying 30,000 households in more than 3,100 villages in the province of Guangxi. For the town of Fada in that province farmers have been freed from having to spend a lot of their time collecting firewood which allows them to be more productive on their farms. It is estimated that some 56,600 tons of firewood can be saved each year. And agriculture production has increased—tea production has gone from 400 kilograms to 2,500 kilograms per day. Average income has quadrupled from 26 US cents to US $1.00. The poverty line in this area is 26 US cents per day. More information on China’s biogas projects can be found at http://www.ruralpovertyportal.org/country/voice/tags/china/biogas. Several videos that show villages in China involved in biogas projects can be found at http://www.youtube.com/watch?v=sfHZJ6w77Io and http://www.youtube.com/watch?v=bCRps9Jnwbk.
In the U.S., the most likely place to find local methane generators utilizing animal dung is on farms. The states of New York and Vermont are actively promoting such projects to supplement the source of methane gas (as opposed to fracking operations) for utility usage (generating electricity). These farms, most often dairy farms, use the methane for both heat and electricity to run all aspects of the farm operation. Some of the heat is used to keep the biodigester at an optimum operating temperature, particularly in the winter time. Excess electricity is sent out into the electric grid in general, but also to local residents who pay the farmer for the utility. According to the New York project Summit attendees set a 2020 goal that 40 percent of all manure from New York dairy farms goes through the anaerobic digestion process, which captures methane from manure and generates clean, renewable energy. The energy produced from this effort could power 32,000 homes while strengthening the economic vitality of New York's dairy farms. It also would reduce New York's greenhouse gas emissions by 500,000 metric tons of carbon, equivalent to taking 100,000 cars off the road. This project is modeled after the Vermont Cow Power project. Information about this project, including a PBS video shot at one of the participating dairy farms, can be found at http://www.greenmountainpower.com/innovative/cow/how-it-works/.
Another agricultural application of a biodigester is increasingly found on pig farms, particularly those large “factory” farms that produce very large volumes of manure that is routinely flushed into outdoor open lagoons. These lagoons often represent an improperly managed resource. If you have ever been near a pig farm, you know the very unpleasant odors associated with the operation. Further, these open lagoons obviously emit plenty of methane gas, a wasted resource. They are also subject to overflow during heavy rainfalls. The overflow does pollute local streams and rivers, which can damage their ecosystems. There have been major lawsuits in recent years brought on by local residents as well as government entities because of the air and water pollution problems. Utilizing large scale biodigesters not only eliminates the aforementioned problems but generates the methane gas which can, once again, reduce operating costs for energy, both in terms of heat and electricity. Further, the remaining product from the digester is an excellent fertilizer. It can also be used for animal bedding because it is essentially odorless. For pig producers not to use a biodigester is to ignore an important financial asset for the farm operation. A Web site (http://www.biogas-energy.com/site/pig.html) for a commercial developer of biogas generators for pig operations explains all about the value and application of digester equipment.
116

For the other probable location for agricultural biodigesters, look to large scale feed lots. One interesting example of an integrated operation is in Hereford, Texas. Hereford is known as the cattle capital of the world with more than one million head of cattle and 100,000 dairy cows located within a 100 mile radius of the town. The area is supplying a new ethanol plant with fuel in the form of manure from the cattle feed yards, eliminating the need to burn natural gas. The projected energy savings are equivalent to 1,000 barrels of oil PER DAY, with transportation costs also reduced. The facility is also making use of gray water from the city wastewater facility.
In Texas, large feedlots for livestock have created economic opportunity in the agribusiness. Hogs, beef and dairy cattle, along with poultry, are often fed in close proximity to maximize efficient production and keep costs low. By processing the manure into fuel and a residual product that can be used as fertilizer, among other things, many environmental issues are addressed, including the release of a variety of odors and greenhouse gases such as methane and carbon dioxide along with nitrous oxides, and ammonia. With manure not spread over the landscape, additional environmental problems are eliminated including the uncontrolled runoff of phosphorus and nitrates, known chemicals that can damage a water ecosystem.
More on environmental hazards of landfill-generated natural gas
Landfill gas is the single largest source of man-made methane emissions in the United States, contributing to almost 40% of methane emissions each year (EPA 1996). Consequently, a growing trend at landfills across the country is to use recovered methane gas from landfills as an energy source. Collecting landfill gas for energy use greatly reduces the risk of explosions, provides financial benefits for the community, conserves other energy resources, and potentially reduces the risk of global climate change.(http://www.atsdr.cdc.gov/hac/landfill/html/ch5.html )
According to an organization called the Energy Justice Network, there are some potential hazards associated with the use of methane gas generated by landfills. Besides the obvious gases of methane, carbon dioxide, varying amounts of nitrogen, oxygen, water vapor, and sulfur compounds, there are also a variety of other contaminants such as mercury and radioactive compounds such as tritium found in the gas mixture. There is also concern for halogenated hydrocarbons being produced in landfills. This type of hydrocarbon is potentially carcinogenic. The organization raises a number of questions about the safety (environmental and health-related) of burning landfill gas (LG). These questions contain a variety of answers that have a “scientific-looking” context. They are worth considering—see http://www.energyjustice.net/lfg and the included reference, “Primer on Landfill Gas as Green Energy”. For example, although non-methane organic compounds make up only about 1% of the landfill gases, they include such toxic chemicals as benzene, toluene, chloroform, vinyl chloride, carbon tetrachloride, and 1,1,1 trichloroethane. At least 41 of these are halogenated compounds.
Many others are non-halogenated toxic chemicals. If these halogenated compounds are later burned in the presence of hydrocarbons, they can recombine into highly toxic compounds such as dioxins and furans, some of the most toxic chemicals ever studied. Burning at high temperatures doesn't solve the problem, as dioxins are formed at low temperatures and can be formed as the gases are cooling down after the combustion process. The Energy Justice Network paper provides technology options if one is going to use landfill gases as fuel, given
117

some of the potential hazards when burning this toxic gas mixture. This study is also presented in a very detailed, data-laden PowerPoint (www.energyjustice.net/files/lfg/landfilgas.ppt) that could be used in the classroom.
A government-produced document (http://www.atsdr.cdc.gov/hac/landfill/html/ch5.html) from the Centers for Disease Control and Prevention (CDC) (in the 1990s, no longer maintained) corroborates some of the concerns expressed by the Energy Justice Network above. There are specific admonitions when extracting landfill gas as a fuel. Some of the chapters in the document include:
Landfill Gas Basics Landfill Gas Safety and Health Issues Monitoring of Landfill Gases Landfill Gas Control Measures
Both the realized and the potential landfill-generated methane gas sites are shown in the map below. As one can see, there still remain more opportunities for reducing the amount of methane that escapes into the atmosphere to become a greenhouse gas, as well as the obvious economic benefit of tapping this gas source as a fuel for vehicle propulsion (municipal vehicles) and usable heat in a variety of applications including public heating and electricity generation.
118

(http://www.epa.gov/lmop/index.html)
Connections to Chemistry Concepts (for correlation to course curriculum)
1. Energy production/use—The whole story of biogas and methane revolves around man’s need for energy and his ability to find alternate sources.
2. Anaerobic biological activity and energy conversion—This biochemical condition that operates in the absence of oxygen restricts what particular microorganisms, primarily bacteria and fungi, can still be involved in energy transfer and what products are produced. Anaerobic biological activity (fermentation, methanogenesis) is less efficient as an energy conversion process than the aerobic process found in respiration.
3. Combustion—It is the burning of biogas and methane that produces the energy people need in all these locations within the article.
4. Organic chemistry—The world of carbon is particularly important in the biological realm. The biochemical activities in such processes as respiration, anaerobic decay, and photosynthesis recycle carbon while generating chemical potential energy. Methane production is an oxidation reduction process that captures the energy from electron transfer in the formation of an important organic compound, adenosine triphosphate (ATP) in the anaerobic bacteria responsible for generating methane gas.
5. Hydrolysis—This is one of four steps in the process of anaerobic decay. In this step, complex organic matter is decomposed into simple soluble organic molecules using water to split the chemical bonds between the substances. The other processes that follow include fermentation (or acidogenesis) in which carbohydrates are decomposed by enzymes, bacteria, and yeasts in the absence of oxygen. These fermentation products are converted into acetate, hydrogen and carbon dioxide by acetogenic bacteria. Finally, a methane-producing process (methanogenesis) by specific bacteria utilizes the acetate, hydrogen, and carbon dioxide to form the methane.
Possible Student Misconceptions (to aid teacher in addressing misconceptions)
1. “Methane gas from landfills has a distinct and unpleasant odor.” Pure methane gas is actually odorless. The odors from a landfill are from other gases such as hydrogen sulfide. Because methane gas is odorless, gas-providing companies add an odorant to the gas (especially, in this country, “natural” gas is primarily methane) so that a leak in a house or public area can be noticed and dealt with before an explosion might occur. In chemical terms, the odorant is a mercaptan or methanethiol, a chemical family that includes several chemical compounds found in a skunk’s spray.
Anticipating Student Questions (answers to questions students might ask in class)
1. “Isn’t the production of methane gas a dangerous household activity?” Since the gas is usually generated in a biogas generator that maintains a positive pressure due to the presence of the gas (and sometimes, a floating cover), it would exit the gas tank (going from
119

higher pressure to lower pressure outside) to be ignited. The ignited gas would not back up into the biogas generator tank because of the gas pressure difference. You can show the same thing with a gas jet in the chemistry lab—igniting the escaping gas does not produce an explosion. The other reason it can’t explode inside the tank is because there is no oxygen in the tank. Combustion (even rapid combustion, as in an explosion), requires oxygen. So burning can only occur outside the tank, as the gas exits the tank.
2. “Carbon dioxide doesn’t burn or support combustion, so does it need to be separated out from the mixture with methane gas produced in home biogas generators before the methane is used as a fuel? If so, how is that done?” Carbon dioxide gas is more soluble in the water solution of the biogas generator than the methane gas, although the amount that dissolves may not be significant. Even so, the carbon dioxide that remains does not have to be separated from the methane gas since it does not lower the BTU value of the methane enough to make it unusable. Pure methane has a value of about 1000 BTUs per 1 cubic foot of gas; a methane/carbon dioxide mix has a value of 600 BTUs per cubic foot of gas. In addition to all this, the article mentions that the lower density of methane compared to carbon dioxide (16:44) results in the two gases separating, and the (mostly) methane is removed for burning through the pipe at the top of the septic tank.
3. “Is exposure to the bacteria involved in biogas production dangerous or unhealthy?” Actually, any pathogenic bacteria in the biogas unit (or biodigester) can be killed by the fact that many of these bacteria require oxygen to survive, and oxygen is not present in the anaerobic conditions for methane production. This lack of oxygen is the main killer of the pathogenic bacteria. And depending on the physical setup (insulation) and the composition of the fermenting biomass, temperatures can sometimes rise above 40 oC, which can also kill some of the pathogenic bacteria. Some biogas generators are actually provided with heat to maximize the preferred operating temperature of the methane-generating (methanogenic) bacteria. In the mix of methanogenic bacteria, some of them are more resistant to the negative effects of higher temperatures (above 37 oC) than pathogenic bacteria.
In-class Activities (lesson ideas, including labs & demonstrations)
1. Under teacher supervision, students can construct a biogas generator. A reference for instructions on the construction and operation of a biogas generator can be found at http://www.nrel.gov/education/pdfs/educational_resources/middle_school/biogas_generator.pdf.
2. A second set of lesson plans and instructions for building a biogas generator are found at http://www.re-energy.ca/biogas-generator/.
3. Selected slides from the 45-slide pdf document “An Overview of Landfill Gas Energy in the United States” from the EPA could be used in class to discuss how landfills are both reducing the amount of the greenhouse gas methane going into the atmosphere, and using methane from the landfills to serve as an energy source: http://epa.gov/lmop/documents/pdfs/overview.pdf.
4. A fun demonstration that always catches the students’ interest (and requests for repeat performances later in the year!) is to bubble methane gas through a soapy water solution, producing soap bubbles filled with methane gas that float into the air. They can be safely ignited before they reach the ceiling. A simple but effective “lighter” is made from a meter stick with a lit candle on one end. You can control the size of the bubbles by the speed with which the methane gas is bubbled through the water container. An approach that shows the setup for generating methane bubbles is found in a video produced by Flinn Scientific in
120

which the demonstrator, Bob Becker (well known for innovative demos and lab activities), shows how to produce a tall column of small methane bubbles that looks like an undulating snake, hence the term “methane mamba”. Refer to the video at http://elearning.flinnsci.com/StandalonePlayer.aspx?vid=EL1618.flv . A printed lab protocol for generating methane bubbles, including a diagram of the setup that is worth referencing is found at http://www.nce-mstl.ie/_fileupload/Science%20resources/Chemistry%20resources/Class%20Activity-%20Methane%20Mamba.pdf .
5. You can use a virtual experiment (a simulation) online at the Virtual Chemistry Web site, http://www.chm.davidson.edu/vce/Calorimetry/HeatOFCombustionOfMethane.html, to have students calculate the heat of combustion of methane. This version requires students to include the calorimeter constant and heat produced by the ignition wire, so it is slightly more complex than the typical heat of combustion of candle wax experiment.
6. If you’re really careful (Safety first, remember?), you can do a demonstration to show the explosiveness of methane in a paint can. The directions can be found here: http://www.csun.edu/scied/4-discrpeant-event/schuster/. And if you don’t want to risk actually doing the demonstration, you can simply show students the 5-second video clip of the explosion the experimenter recorded to show on the site.
Out-of-class Activities and Projects (student research, class projects)
1. Students could make use of one particular reference, http://www.energyjustice.net/lfg/, for a class presentation (PowerPoint) to educate students about the environmental issues associated with landfill-generated methane as well as delving into the reasons that landfill-generated methane is not as widespread as it potentially could be. Among other reasons is the financial investment needed, relative to the life of the landfill. What is the average life expectancy of a methane-producing landfill? Can these landfills be actively maintained to extend the natural lifespan?
2. The pressing environmental and health issues from cooking with wood should be investigated and presented to the class by students who are most likely not aware of the consequences of depending on wood fuel. There is ample evidence about the environ-mental destruction caused by wood gathering. Denuding hillsides in China, for instance, is directly related to many instances of soil erosion and massive flooding in recent years. There are other countries on the African continent which have similar problems. For starters, the health issue from cooking-smoke inhalation can be researched from the National Geographic Web site (referenced earlier) at http://news.nationalgeographic.com/news/energy/2013/05/130529-surprising-facts-about-energy-poverty/.
3. Students could research landfills in their area to see if (and how) they are generating methane. The map cited above might be a good place to start.
121

The references below can be found on the ChemMatters 30-year CD (which includes all
articles published during the years 1983 through April
2013 and all available Teacher’s Guides). The CD is in production and will be available from the
American Chemical Society at this site: http://ww.acs.org/chemmatters.Selected articles and the complete set of
Teacher’s Guides for all issues from the past three years are also available free online on the same
site.(The complete set of ChemMatters articles and Teacher’s Guides are available on the 30-year CD for all past issues, (up to April 2013.)
Some of the more recent articles (2002 forward) may also be available online at the link above. Simply click on the “Past Issues” button directly below the “M” in the ChemMatters logo at the top of the Web page. If the article is available online, you will find it there.
30 Years of ChemMatters !
References (non-Web-based information sources)
Barnwell, G., Your Personal Greenhouse. ChemMatters 1990, 8 (4), pp 8–10. Thinking in broader terms, this article shows how taking personal responsibility for conserving electricity actually becomes a contribution to reducing greenhouse gases and global warming. Since generating electricity usually requires burning some kind of fossil fuel which, in turn, produces carbon dioxide (a greenhouse gas), reducing electricity consumption reduces the amount of electricity generated and fossil fuel burned. These days methane gas is the fuel of choice rather than coal. Charts from the article help with a number of calculations to show the impact of various fuels on the generation of greenhouse gases.
Garber, C.L. Wastewater. ChemMatters 1992, 10 (2), pp 12–15. A different perspective on biodigesters is found when one looks at processing of sewage in the U.S. Although the goal is to produce water from the sewage that can be safely introduced back into the environment, along the way, some methane gas is produced in one stage of the biological digesting that is needed as a heat source for keeping the methane-producing bacteria (methanogens) alive and working at an optimum temperature. This article also contains a lot of practical chemistry that is important to the multiple steps in the wastewater treatment process.
Black, H. The Exploding Cabin (“Mystery Matters”). ChemMatters 1994, 12 (3), pp. 4–6. Students may find this an interesting article since it provides an investigation into the cause of an explosion in an abandoned government fire tower. The two possible sources of the gas that exploded are methane (from bats) and propane (from a tank used for heating). As it turns out, the explosion is from methane but not produced by bats in the anaerobic decay of their dung but
122
by methane produced in a septic tank that once received human waste which also underwent anaerobic decay (a biodigester). The article presents all the various hypotheses and the evidence needed to support them in this scientific investigation.
Banks, P. Ice That Burns, ChemMatters 1995, 13 (3), pp.8–11. This article deals with one of the more promising but difficult to reach sources of methane called methane hydrates (gas trapped in ice crystals). Students are probably not aware of the current interest in this developing methane source. Who knows how the future world market will impact availability and price of such gas for those who currently depend on producing their own methane from biodigesters?
Sitzman, B., Goode, R. Less Meat = Less Heat. ChemMatters 2011, 29 (1), p 2.Because methane is considered to be a very effective greenhouse gas, students may need some basics on the issue of global warming and greenhouse gases. The one gas more talked about is carbon dioxide even though methane, molecule for molecule, is twenty times more effective in absorbing infrared. This article has a nice illustration/diagram of the various greenhouse gases and their role in global warming.
Although not directly related to methane biodigesters, the October 2013 issue of ChemMatters contains an article on the fracking process for obtaining methane gas.(Karabin, S. The Fracking Revolution. ChemMatters 2013, 31 (3), pp 15–17)This issue also has a useful Teacher’s Guide about methane in general and fracking in particular. Because the guide is not yet available on the ChemMatters CD, the Teacher’s Guide can be accessed at the ACS Web site, using the following URL: http://www.acs.org/content/acs/en/education/resources/highschool/chemmatters/past-issues.html. Scroll down to the article, “The Fracking Revolution”, and note the Teacher’s Guide link for that article.
Web Sites for Additional Information (Web-based information sources)
More sites on biodigesters on farms and homes
There are several videos which show the construction of large biodigesters. For activities in China, refer to http://www.youtube.com/watch?v=sfHZJ6w77Io.
Another construction project of a biodigester in Uganda is found at http://www.youtube.com/watch?v=s4EWOoPY5OY.
And from India, this video shows biogas projects, at http://www.youtube.com/watch?v=txT-1uTfZh8.
From Pakistan, a video on an integrated farm operation utilizing biogas power is found at http://www.youtube.com/watch?v=5lQWiVhjSvo.
An interesting article about a successful recycling program in Cairo that includes the use of biodigesters is found at http://blogs.scientificamerican.com/guest-blog/2013/05/13/second-helpings-recycling-cairos-food-waste/.
123

A very detailed and scientifically-based biogas project in India can be found athttps://c919f6a6-a-5ed2e098-s-sites.googlegroups.com/a/engindia.net/main/completedsolutions/JoannaRead-ANovelDesignforaBiogasGeneratorinDevelopingCountr%E2%80%A6.pdf?attachauth=ANoY7coXJdyjkLLaZS6ut4E5QJuGaJ9KIedduDQoB7LSotVO2pjE7BAFo3cqz5HJihwNOet0xw6avGJ41yJlOomYOKjQEOpnMnOIO-5mx0FWPGu4yruFQmaZ6b9smcoHgw8pfc5iUL2-D079UHwBIDTxohYgqnZGOSTAWkcBVy8Pl9Kqd9A1xqjWlUvYdyzHjQ4eCo5PF7JYk2hE5tH0KPDjgCdN6bpfav3TzXaQTJEokhghb96c5Nj7ZE2tkqk2SReL1UGlPkBWVv-P8s1kfTXbBTLWAwznu-flqrMva6sYcoxIoD3MheFDhZvi3F9KkGF-_HGiq2LV&attredirects=0.Included in the extensive report are diagrams of the various types of biodigesters used, including the “floating dome” type which is actually a good design compared with structures that have fixed domes. The floating dome both seals the operation as well as maintains a constant pressure equal to atmospheric pressure, thereby insuring positive gas pressure for delivery to a house.
A good example of an integrated approach (actually called a closed loop system), using a manure-based biodigester that generates methane for heat and electricity to power an ethanol production plant, is found at http://www.extension.org/pages/67633/anaerobic-digestion-of-finishing-cattle-manure#.Up4rNCeZcx4. There is also a video presentation at this Web site.
A Web site for a commercial company involved in designing and building methane generators for swine operations is found at http://www.biogas-energy.com/site/pig.html. Among other things the site provides many reasons for having biodigesters on farms, particularly when pigs are involved. (Keep in mind that this Web site represents a company that sells these devices, so they have a vested interest in encouraging the use of such methane generators.)
An extensive collection of reference materials from the US government’s EPA AgStar Web site concerning all aspects of agricultural biodigesters is found at http://www.epa.gov/agstar/lib/index.html.
All the “poop” about animal waste being used in various types of biodigesters with useful flowcharts to show the integration of the various steps from animal waste collection to gas production and utilization (along with the various evaluative concerns about biodigesters) is found at http://www.epa.gov/agstar/documents/recovering_value_from_waste.pdf.
More sites on landfill methane generation
Here is an EPA Web site that provides an automated tool (LandGEM) for estimating emission rates for total landfill gas, individual gas production of methane, carbon dioxide, non-methane organic compounds (NMOC’s), and individual air pollutants from a landfill. Refer to http://www.epa.gov/ttn/catc/dir1/landgem-v302-guide.pdf.
Two related government sites that provide statistics on energy production related to renewable sources in general, and biomass sources (methane generation) are found at http://www.eia.gov/renewable/ and http://www.eia.gov/energy_in_brief/article/renewable_electricity.cfm. You will also find explanations for why usage of renewables like methane is not as wide spread, compared with that of the more common energy sources like fossil fuels.
124

The general Web site for the US Energy Information offices, which includes the above mentioned Web site for renewables is found at http://www.eia.gov/. There are lots of good statistics (various visual presentations) related to energy production of all categories.
More sites on respiratory problems from wood and biomass cook stoves
Most people in the developed world are unaware of the respiratory problems caused by indoor air pollution in the poorer countries, where wood and other biomass fuels are burned without proper ventilation or are used in combustion/cooking devices that are not designed to reduce or eliminate smoke production. There are cook stove designs that are more efficient with significantly reduced smoke emissions through better combustion (more air intake) and/or the use of chimneys. It is estimated that about 3.5 million people, mainly women and children die each year from these smoke-related respiratory illnesses. A good reference about this problem, and the need to use more smokeless burning fuels (and better designed stoves), is found at National Geographic: http://news.nationalgeographic.com/news/energy/2013/05/130529-surprising-facts-about-energy-poverty/.
125