Embed Size (px)
Citation preview
Henderson Group plc 47 Esplanade St Helier Jersey JE1 0BD Registered in Jersey Company No. 101484 ABN 67 133 992 766
29 February 2012
Financial highlights
Amounts in £m unless otherwise stated
Year ended 31 December 2011
Audited
Year ended31 December 2010
Audited
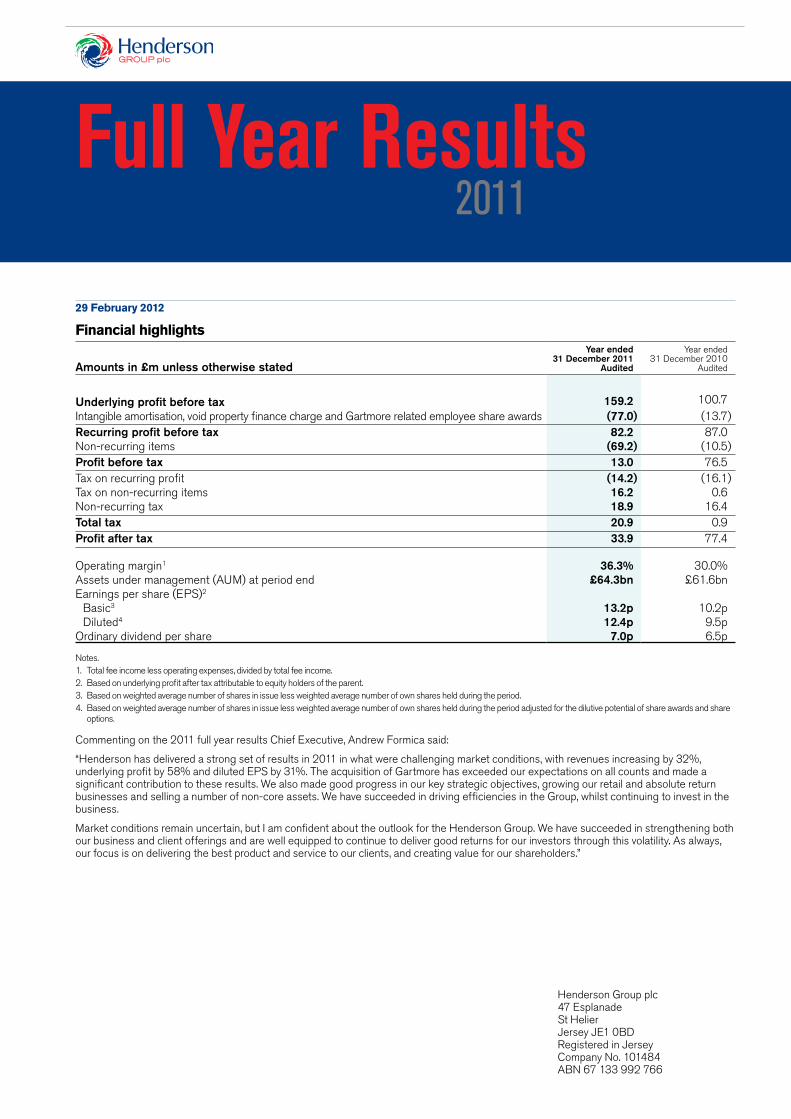
Underlying profit before tax 159.2 100.7Intangible amortisation, void property finance charge and Gartmore related employee share awards (77.0) (13.7)Recurring profit before tax 82.2 87.0Non-recurring items (69.2) (10.5)Profit before tax 13.0 76.5Tax on recurring profit (14.2) (16.1)Tax on non-recurring items 16.2 0.6Non-recurring tax 18.9 16.4Total tax 20.9 0.9Profit after tax 33.9 77.4
Operating margin1 36.3% 30.0%Assets under management (AUM) at period end £64.3bn £61.6bnEarnings per share (EPS)2
Basic3 13.2p 10.2p Diluted4 12.4p 9.5pOrdinary dividend per share 7.0p 6.5p
Notes.1. Total fee income less operating expenses, divided by total fee income.2. Based on underlying profit after tax attributable to equity holders of the parent. 3. Based on weighted average number of shares in issue less weighted average number of own shares held during the period.4. Based on weighted average number of shares in issue less weighted average number of own shares held during the period adjusted for the dilutive potential of share awards and share
options. Commenting on the 2011 full year results Chief Executive, Andrew Formica said:
“Henderson has delivered a strong set of results in 2011 in what were challenging market conditions, with revenues increasing by 32%, underlying profit by 58% and diluted EPS by 31%. The acquisition of Gartmore has exceeded our expectations on all counts and made a significant contribution to these results. We also made good progress in our key strategic objectives, growing our retail and absolute return businesses and selling a number of non-core assets. We have succeeded in driving efficiencies in the Group, whilst continuing to invest in the business.
Market conditions remain uncertain, but I am confident about the outlook for the Henderson Group. We have succeeded in strengthening both our business and client offerings and are well equipped to continue to deliver good returns for our investors through this volatility. As always, our focus is on delivering the best product and service to our clients, and creating value for our shareholders.”
Full Year Results2011

Henderson Group Full Year Results 2011
Key financial highlights
• Underlying profit before tax up 58% to £159.2m
• Operating margin increased to 36.3%
• Compensation ratio lower at 41.6%
• Good investment performance over three years; 66% of funds meet or exceed benchmarks
• AUM £64.3bn at 31 December 2011
• Diluted underlying EPS up 31% to 12.4p
• Board recommending final dividend of 5.05 pence per share; 8% increase in total dividend
Forward-looking statements
This announcement contains forward-looking statements with respect to the financial condition, results and business of the Group. By their nature, forward-looking statements involve risk and uncertainty because they relate to events, and depend on circumstances, that will occur in future. The Group’s actual future results may differ materially from the results expressed or implied in these forward-looking statements. Nothing in this announcement should be construed as a profit forecast.
Market briefing
Management will present these results on 29 February 2012 at 8:00pm (Sydney time)/9:00am (London time). Teleconference detailsWe recommend participants start dialling in 5 to 10 minutes prior to the start of the presentation. To telephone link-up to the briefing, dial one of the following numbers from 7:50pm (Sydney time)/8:50am (London time):
From: United Kingdom 0500 5510 87 (free call) Australia 1800 9889 41 (free call) All other countries +44 (0)20 7162 0077 (this is not a free call number) Conference title Henderson Group, Full Year Results Briefing Chairperson Andrew Formica Reference 910223
Replay number from: United Kingdom +44 (0)20 7031 4064 Access code 910223 Australia +61 (0)2 8223 9748 Access code 910223 (available from 29 February to 6 March 2012).
Webcast detailsYou can logon to a webcast of the results briefing which will start at 8:00pm (Sydney time)/9:00am (London time). Go to www.henderson.com/group and click on the relevant link on the homepage. An archive of the webcast will be available shortly after the event.
Further information www.henderson.com or
Investor enquiries Media Enquiries Mav Wynn, Head of Investor Relations Richard Acworth, Head of Corporate Communications +44 (0) 20 7818 5135 or +44 (0) 20 7818 5310 +44 (0) 20 7818 3010 [email protected] or [email protected] [email protected]
Bojana Flint, Deputy Head of Investor Relations Australia: Cannings United Kingdom: Maitland+44 (0) 20 7818 6117 or +44 (0) 20 7818 5310 Luis Garcia Peter Ogden/Rebecca Mitchell [email protected] or [email protected] +61 (0) 2 8284 9990 +44 (0) 20 7379 5151
2011 Full Year Results

Henderson Group Full Year Results 2011
Contents
1 Results for Announcement to the Market2 Five Year Financial Summary3 Business Review5 Financial Review and KPIs9 Risk Management11 Consolidated Income Statement12 Consolidated Statement of Comprehensive Income13 Consolidated Statement of Financial Position14 Consolidated Statement of Changes in Equity15 Consolidated Statement of Cash Flows16 Company Income Statement16 Company Statement of Comprehensive Income16 Company Statement of Financial Position17 Company Statement of Changes in Equity17 Company Statement of Cash Flows18 Notes to the Financial Statements – Group and Company
18 1. Authorisation of financial statements and statement of compliance with IFRS
18 2. Accounting policies23 3. Income23 4. Expenses24 5. Employee compensation and benefits24 6. Finance costs24 7. Non-recurring items26 8. Tax27 9. Earnings per share28 10. Share-based payments32 11. Dividends paid and proposed33 12. Segmental information34 13. Intangible assets35 14. Investments in subsidiaries, associates and joint ventures36 15. Plant and equipment37 16. Fair value of financial instruments39 17. Deferred acquisition and commission costs39 18. Trade and other receivables39 19. Cash and cash equivalents40 20. Debt instruments in issue40 21. Retirement benefits47 22. Provisions48 23. Deferred tax49 24. Trade and other payables49 25. Share capital50 26. Reserves51 27. Non-controlling interests51 28. Financial risk management56 29. Leases56 30. Capital commitments56 31. Related party transactions57 32. Contingent liabilities58 33. Acquisitions and disposals of subsidiaries59 34. Events after the reporting date60 Directors’ Responsibilities Statement61 Independent Auditors’ Report62 Glossary
The information contained in this document should be read in conjunction with the Henderson Group plc (the Company) Annual Report for the year ended 31 December 2011 and any public announcements made by the Group in accordance with the continuous disclosure obligations arising under the Corporations Act 2001, the Companies (Jersey) Law 1991 and the Australian Securities Exchange (ASX) Listing Rules. This report includes the full year information required to be given to the ASX under Listing Rule 4.3A.
Preliminary Final Report for the Year Ended 31 December 2011 Incorporating the Requirements of ASX Appendix 4E

01 Henderson Group Full Year Results 2011
The results of Henderson Group plc for announcement to the market are as follows:
12 months to 31 December
2011 Audited
£m
12 months to 31 December
2010 Audited
£mMovement
%
Revenue from recurring activities 682.8 487.9 40Underlying profit after tax attributable to equity holders of the parent1 125.7 80.6 56Profit after tax attributable to equity holders of the parent1 34.0 77.9 (56)
Note1. Excluding a non-controlling interests loss of £0.1m (FY10: £0.5m loss).
Dividends
On 28 February 2012, the Directors recommended the payment of a final dividend in respect of the year ended 31 December 2011 of 5.05 pence per share.
Amount per security
pence
Franked amount per security
pence
2011 interim dividend (paid on 23 September 2011) 1.95 –Recommended 2011 final dividend 5.05 –Proposed record date 4 May 2012Planned payment date 25 May 2012
Henderson Group plc does not offer a dividend reinvestment plan.
Net tangible assets per ordinary share
31 December 2011 pence
31 December 2010 pence
Net tangible assets per ordinary share 2 1
“Net tangible assets” are defined by the ASX as being total assets less intangible assets less total liabilities ranking ahead of, or equally with, claims of ordinary shares.
Results for Announcement to the Market

02Henderson Group Full Year Results 2011
Five Year Financial Summary Consolidated Financial ResultsFor the year ended 31 December 2011
2011 £m
2010 £m
2009 £m
2008 £m
2007 £m
IncomeManagement fees (net of commissions) 360.5 282.5 226.8 221.9 258.0Transaction fees 51.1 36.8 24.9 16.5 17.8Performance fees 65.2 42.8 31.6 32.0 86.9Total fee income 476.8 362.1 283.3 270.4 362.7Finance income 3.3 0.8 4.3 15.3 25.7Total income 480.1 362.9 287.6 285.7 388.4ExpensesFixed employee compensation and benefits (96.6) (83.7) (77.4) (74.9) (77.5)Variable employee compensation and benefits (103.3) (77.4) (48.9) (51.6) (116.1)
Employee compensation and benefits (199.9) (161.1) (126.3) (126.5) (193.6)Investment administration (28.1) (23.3) (22.6) (16.4) (16.0)Information technology (14.0) (12.7) (11.5) (9.6) (9.8)Office expenses (16.4) (16.2) (16.2) (13.2) (14.1)Depreciation (3.0) (3.2) (3.2) (2.3) (2.5)Other expenses (42.3) (37.0) (25.2) (25.0) (37.7)Total operating expenses (303.7) (253.5) (205.0) (193.0) (273.7)Finance expenses (17.2) (8.7) (8.9) (12.3) (8.0)Total expenses (320.9) (262.2) (213.9) (205.3) (281.7)
Underlying profit 159.2 100.7 73.7 80.4 106.7Non-operating recurring items (77.0) (13.7) (10.7) (0.1) –Recurring profit before tax 82.2 87.0 63.0 80.3 106.7Non-recurring items (69.2) (10.5) (47.5) (97.3) 40.5Profit/(loss) before tax 13.0 76.5 15.5 (17.0) 147.2Tax on underlying profit (33.6) (20.6) (16.3) (8.6) (12.4)Tax on non-operating recurring items 19.4 4.5 3.0 – –Tax on non-recurring items 16.2 0.6 12.3 4.8 (2.6)Non-recurring tax credit 18.9 16.4 – – –Total tax 20.9 0.9 (1.0) (3.8) (15.0)Profit/(loss) after tax 33.9 77.4 14.5 (20.8) 132.2Attributable to: Equity holders of the parent 34.0 77.9 13.8 (20.9) 132.1Non-controlling interests (0.1) (0.5) 0.7 0.1 0.1
Operating margin1 (%) 36.3 30.0 27.6 28.6 24.5Compensation ratio2 (%) 41.6 44.4 43.9 44.3 49.8Average number of employees 1,043 941 933 920 921AUM as at 31 December (£bn) 64.3 61.6 58.1 49.5 59.2Average AUM for the period (£bn) 67.6 58.7 53.0 53.7 61.1Total fee margin (bps) 70.6 61.7 53.5 50.4 59.4Management fee margin (bps) 53.3 48.2 42.8 41.3 42.2Net margin3 (bps) 23.6 17.2 13.9 15.0 17.5Basic and diluted earnings per share (EPS)Weighted average number of ordinary shares for basic EPS (m) 954.1 788.4 759.3 660.6 804.6Weighted average number of ordinary shares for diluted EPS (m) 1,012.7 849.2 809.4 715.0 847.5Basic on underlying profit4 (p) 13.2 10.2 7.5 10.8 11.7Basic (p) 3.6 9.9 1.8 (3.2) 16.4Diluted on underlying profit4 (p) 12.4 9.5 7.0 10.0 11.1Diluted (p) 3.4 9.2 1.7 (3.2) 15.6Dividends per share (p) 7.0 6.5 6.1 6.1 6.1Investment performance5
Funds at or exceeding benchmark over one year (%) 59 70 70 41 48Funds at or exceeding benchmark over three years (%) 66 62 64 49 54
Notes 1. Total fee income less operating expenses divided by total fee income. 4. Based on underlying profit after tax attributable to equity holders of the parent. 2. Employee compensation and benefits divided by total income. 5. Asset weighted of funds measured over one and three years to 31 December.3. Net margin calculated on underlying profit before tax.

03 Henderson Group Full Year Results 2011
Demand for our US retail funds was adversely impacted as US investors shunned European and international equities. However, we continue to build our US retail business and in 2011 we celebrated the 10 year anniversary of our flagship fund, International Opportunities. Our second largest US mutual fund, Global Equity Income, is top quartile over five years providing further strength to our US product offering. We continue to grow our US institutional business and we plan to develop further products for that market.
Our absolute return business performed well in the year with positive net flows into liquidity, agriculture and a number of our AlphaGen funds (previously Gartmore funds). We are particularly encouraged by the flows in the AlphaGen funds which resumed shortly after we completed the Gartmore acquisition. The asset weighted performance of our absolute return funds compares favourably to industry experience and our proven long-term track record of delivering strong, risk-adjusted investment performance across a range of established absolute return strategies continues to drive investor interest. We expect to strengthen the absolute return product offering as evidenced by the launch of two liquidity strategies and the recent take-on of a team focused on agriculture.
Our UK fixed income business remains strong in the institutional marketplace. We value the importance of our relationships with institutional clients and consultants in all geographies and have worked hard to strengthen these ties. As a result, we hope to continue sourcing new business from existing regions and also expand distribution of our capabilities into the Nordics, South America, Japan and China.
David Jacob Managing Director and Chief Investment Officer
Business Review
The acquisition of Gartmore cements our position as a UK retail fund manager where we are now ranked sixth by AUM. Financially, the acquisition has already delivered and we are starting to see the strategic benefits flow through. We have enhanced our product range, in particular, our absolute return product offering, and we are beginning to fill gaps in two priority areas - Global Equities and Emerging Markets Equities. We also extended our distribution network into areas such as Japan and further enhanced our global hedge distribution capability. The integration of funds and people was seamless and, from a client perspective, it was business as usual in record time.
Following the successful integration of Gartmore we reviewed our business structure to ensure that we allocate resources to those capabilities we anticipate clients will demand. While Gartmore added or enhanced capabilities that we wish to grow, we sold non-core businesses such as Henderson Liquid Assets Fund (HLAF) and New Star Institutional Managers Limited (NSIM), and closed other funds or adjusted the way in which some are managed. For example, we closed our global currency fund and we have partnered with EIRIS, a leading provider of independent research into the environmental, social, governance and ethical performance of companies, to provide detailed research and analysis to support our SRI capability. We are focused on delivering core product to our clients which will entail some new product launches and at the same time, we will continue to rationalise our product range in order to provide additional clarity to clients regarding our offerings.
Investment performance in most of our funds across asset class and product type continued to be good with performance in our fixed income products in particular remaining strong over one and three years. Our equity funds’ three year performance remains good, although one year performance suffered somewhat as some of our larger funds underperformed.
Our core distribution markets are in the UK and Continental Europe and we are increasing our presence in the US and Asia. In the UK, we have seen an improvement in our brand awareness following our successful completion of two acquisitions in the past three years. In addition, we launched a bold advertising campaign which has shown some impressive results over a short time frame. We held our third successful investment conference for UK financial advisers and recently launched HGi, which is both an online and print platform designed to bring together the views and commentary of our experts and deliver them to our clients, helping them to follow the fund managers, topics and funds that are most relevant.
We had positive net flows in a broad range of funds including UK retail absolute return, Strategic and Corporate Bond funds, Long Dated Credit, Multi-Manager and Cautiously Managed funds. We continue to see good demand for our fixed income funds with three of our funds topping £1bn in assets. Anticipated market volatility in 2012 is likely to make investor demand difficult to predict, but we think that both fixed income and absolute return funds will remain in demand.
Investment trusts remain a sizeable and important part of our business and we are especially pleased with being named Best Investment Trust Provider 2011 by Investment Life & Pensions Moneyfacts.
With the continued eurozone turbulence and falling investor confidence, it is not surprising that flows in our pan-European equity funds were volatile and overall disappointing in 2011. However, given our good investment performance, the strength and the quality of our team, we have a strong proposition and we are confident that we are well placed for when investor demand returns.
We have established a new relationship with Manulife Asset Management in Taiwan to help us continue to build our existing presence in this market. We will be celebrating the 10 year anniversary of our Hong Kong business in 2012 and will support this with a marketing and advertising campaign as well as a number of client events.
Focus on core products our clients want
Net sales growth is a key priority
Investment performance continues to be good
Investment Management

04Henderson Group Full Year Results 2011
Despite ongoing challenges in the economic environment in 2011, we continued to see consistent levels of activity in our Property business. Throughout the year, we successfully marketed four new funds, were involved in over 90 asset deals and saw a supply of new equity from existing and new clients.
Property AUM grew by £598m from £11.8bn to £12.4bn due to favourable market and foreign exchange rate movements of £310m and net flows of £270m. We completed first closings for the Henderson CASA V Fund, another in the series of our North American multi-family funds, Warburg-Henderson Austria No. 2 and Warburg-Henderson Koop Fund, a pan-European specialist fund. We also completed first and second closings for the Henderson German Retail Income Fund and won mandates for segregated clients totalling £152m.
Total uninvested client commitments at 31 December 2011 were £1.4bn (2010: £1.4bn), with £776m investments made, offset by £892m new equity and debt. We plan to deploy this equity in the US and Europe for selective purchases over the next few years. We invested in our distribution team to support future growth in these two markets where we are already well established and also newer markets, where we see strong potential. We plan to grow our existing sovereign wealth network, expand into new geographies and explore opportunities within the private wealth sector.
Most of the funds we launched followed our historical ‘pooled fund’ route, however the structure of the Warburg-Henderson Koop Fund represents a ‘club’ mandate for four pension funds. Increasingly, institutional clients are looking for more bespoke fund and investment solutions. By joining club deals such as these, it allows investors with similar investment and distribution strategies to group their equity together whilst also receiving individual client service and manager expertise. It is a route we plan to focus on more in the future.
We selectively invested in high quality, defensive assets with strong cash flows. We took advantage of a range of opportunities
through our European infrastructure and network which brought us a number of off-market deals. We also exited a number of investments where we had delivered on our business plan through either asset management or beneficial timing and where capital could be returned or re-invested. To ensure we deliver the best results for our clients, we take a long-term view on investment strategy and every transaction is considered accordingly.
Several of our larger specialist funds continued to be top performers in their sector e.g. the c.£1.1bn Henderson UK Retail Warehouse Fund was reported as being the top performing specialist retail warehouse fund for the year ended 31 December 2011. A number of our funds with absolute return objectives, remain challenged to reach benchmarks which were set pre downturn in 2007. However, the properties held within our funds compare very favourably to those of our peers and we are well placed to deliver long-term performance as a result of the strategies in place.
One of the highlights and most talked about property deals of the year was our acquisition of the ‘Leadenhall Triangle’ from its administrators. These properties are in one of the City of London’s largest development sites and were bought on behalf of our two Central London Office Funds and a Canadian wealth manager, Alberta Investment Management Corporation.
We continue to see opportunities in a number of countries and we are confident that we can continue to offer the right products which aim to meet the needs and aspirations of current and prospective clients.
James Darkins Managing Director
Private Equity
Launched four new funds and participated in over 90 asset deals
Took opportunities to unlock value for clients
Property
Total AUM increased from £806m to £955m as positive market and foreign exchange rate movements of £310m offset net outflows of £93m. Towards the end of the year, we sold our interest in Hermes GPE, a private equity fund of funds joint venture with Hermes Fund Managers,
acquired as part of the Gartmore acquisition.
In December 2011, Henderson Equity Partners (GP) Limited and Henderson Equity Partners Limited, two subsidiaries of Henderson Group plc, were served with legal proceedings, which allege breach of mandate and misrepresentation, by a majority of the investors in Henderson PFI Secondary Fund II L.P. The proceedings do not quantify the sums claimed and will be defended vigorously.
In the infrastructure business, we continued to make good progress with fund valuations either improving or remaining stable in the 12 month period to 30 September 2011. Underlying this improvement was good trading at John Laing which saw new investment volumes resilient despite the impact of the UK Government’s austerity programme on infrastructure projects. At the same time, John Laing recorded further significant gains on the disposal of mature public-private partnership (PPP) assets to secondary investors. Our expectation is that the valuation of our infrastructure Fund I will continue to improve up to 31 December 2011. However, we expect that the valuation of Fund II, notwithstanding the good progress in the John Laing business, will have declined as at 31 December 2011 due to a widening of the pension deficit in John Laing as a result of falling UK gilt rates.
The Asia private equity funds continue to perform well. The first fund has delivered a net IRR of 15% per annum over a 10 year period. The two remaining investments in this fund are expected to be realised in 2012. The second fund is now fully invested, after completing the final investment in an Indian consulting company during the year. The fund continues to perform well. Leveraging the track record of the first two funds, the private equity business is in the process of launching another Asia fund focused on investing in India.
The Fund of Funds business has had a strong year. The listed Fund of Funds vehicle, Henderson Private Equity Investment Trust plc, made significant progress in its realisation strategy, reducing its discount to net asset value to 20% from 33%. It sold six limited partnership commitments and a direct investment holding during the year. The combination of asset sale proceeds and distributions from its remaining limited partnership fund investments allowed it to cancel its bank facilities in October. In December, the trust made an initial cash return of £12.4m to shareholders, representing 18% of the share capital in issue.
The unlisted global Fund of Funds continues to perform well and has now delivered a net IRR of 13% per annum over 10 years.
Priscilla Davies Managing Director
Continued focus on improving valuations of infrastructure funds
Solid long-term performance of Asia funds

05 Henderson Group Full Year Results 2011
Financial Review and KPIs
Financial performance
Underlying profit before tax increased 58% to £159.2m. This was primarily as a result of the acquisition of Gartmore contributing nine months of profits, and continued cost control in the business. As a result, the operating margin improved to 36.3%, and diluted earnings per share on underlying profit, as shown in the graph below, increased 31% to 12.4 pence per share.
0
5
10
15
Earnings per share (p)
BasicDiluted
KPI
FY07 FY08 FY09 FY10 FY11
Income and fee margins
Management fees increased by 28% to £360.5m, principally due to nine months of fees from Gartmore.
Transaction fees increased by 39% to £51.1m, primarily due to the inclusion of Gartmore transaction fees.
Performance fees increased by 52% to £65.2m primarily driven by increases in performance fees earned on hedge funds, including funds acquired as part of the Gartmore acquisition and SICAV funds. The main contributors to performance fees are illustrated in the following chart:
Sources of performance fees (%)
Institutional clientsSICAVsInvestment TrustsPropertyOEICs
Absolute return funds
35
33
21
6 32
These increases in income helped to improve fee margins as shown in the chart below.
Total fee margin increased by 14% to 70.6bps through increasing management fee margins along with higher transaction and performance fees. Management fee margins increased by 11% to 53.3bps, largely resulting from the acquisition of Gartmore and some institutional outflows at a lower margin.
010203040506070
Fee margin (bps)
Total fee marginManagement fee margin
Net margin
KPI
FY07 FY08 FY09 FY10 FY11
Operating expenses
Operating expenses, including depreciation, increased by 20% to £303.7m, largely due to the acquisition of Gartmore.
Employee compensation and benefits increased by £38.8m to £199.9m. Fixed staff costs increased by £12.9m as headcount rose by approximately 100, mainly due to Gartmore staff transferring to the Henderson business, and salary inflation. Variable staff costs increased by £25.9m, reflecting the staff’s share of higher performance fees and the increased number of staff, predominantly fund managers and distribution personnel, following the Gartmore acquisition. The average number of full-time employees increased by 11% to 1,043, mainly as a result of the Gartmore acquisition. Whilst total staff costs increased, the compensation ratio decreased to 41.6%, as shown in the chart below, reflecting the scale benefits of the Gartmore acquisition.
Other operating expenses increased by 12% as the increase in the number of funds and headcount following the Gartmore acquisition required additional administration and support.
The operating margin in FY11 increased to 36.3% as a result of integrating the Gartmore business at a higher operating margin along with higher performance fees and continued cost control.
0
10
20
30
40
50
60
Operating margin andcompensation ratio (%)
Compensation ratioOperating margin
KPI
FY07 FY08 FY09 FY10 FY11
Finance income and finance expenses
Finance income increased by £2.5m to £3.3m in 2011 as higher cash balances generated increased interest income and FY10 included an impairment charge for a seed investment in a property fund.
Finance expenses increased by £8.5m to £17.2m, due to the issuance of the £150.0m 2016 Notes, to help repay Gartmore’s pre-acquisition debt.
Non-recurring items
The Group recognised four non-recurring items in FY11, resulting in a net post-tax charge of £34.1m.
The cost of acquiring and integrating Gartmore amounted to £69.7m and, following the acquisition, a reassessment of previously unrecognised tax losses in the Group and Gartmore tax liabilities was carried out, resulting in the recognition of an £18.9m non-recurring tax credit.
A further £6.0m of restructuring costs were incurred in 4Q11 as a result of cost saving measures taken in response to the market volatility in the second half of 2011. Additionally, £6.5m of the void property provision was released relating to properties acquired at the time of the New Star acquisition.
Please refer to note 7 to the Financial Statements on page 24 for a more detailed analysis.
Underlying profit up 58%
Diluted underlying EPS up 31%
Management fee margin up to 53.3bps
Improved operating margin to 36.3%
Reduced compensation ratio to 41.6%
Average AUM of £67.6bn
06Henderson Group Full Year Results 2011
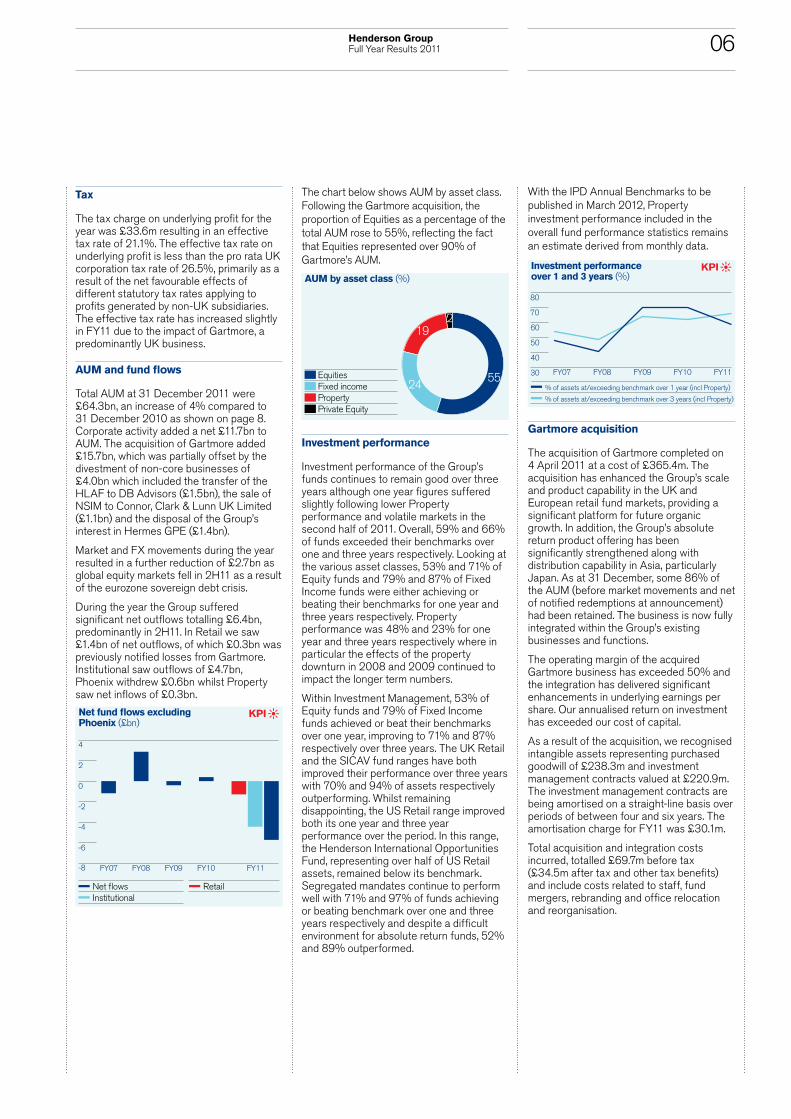
Tax
The tax charge on underlying profit for the year was £33.6m resulting in an effective tax rate of 21.1%. The effective tax rate on underlying profit is less than the pro rata UK corporation tax rate of 26.5%, primarily as a result of the net favourable effects of different statutory tax rates applying to profits generated by non-UK subsidiaries. The effective tax rate has increased slightly in FY11 due to the impact of Gartmore, a predominantly UK business.
AUM and fund flows
Total AUM at 31 December 2011 were £64.3bn, an increase of 4% compared to 31 December 2010 as shown on page 8. Corporate activity added a net £11.7bn to AUM. The acquisition of Gartmore added £15.7bn, which was partially offset by the divestment of non-core businesses of £4.0bn which included the transfer of the HLAF to DB Advisors (£1.5bn), the sale of NSIM to Connor, Clark & Lunn UK Limited (£1.1bn) and the disposal of the Group’s interest in Hermes GPE (£1.4bn).
Market and FX movements during the year resulted in a further reduction of £2.7bn as global equity markets fell in 2H11 as a result of the eurozone sovereign debt crisis.
During the year the Group suffered significant net outflows totalling £6.4bn, predominantly in 2H11. In Retail we saw £1.4bn of net outflows, of which £0.3bn was previously notified losses from Gartmore. Institutional saw outflows of £4.7bn, Phoenix withdrew £0.6bn whilst Property saw net inflows of £0.3bn.
-8
-6
-4
-2
0
2
4
Net fund flows excludingPhoenix (£bn)
Net flowsInstitutional
Retail
KPI
FY07 FY08 FY09 FY10 FY11
The chart below shows AUM by asset class. Following the Gartmore acquisition, the proportion of Equities as a percentage of the total AUM rose to 55%, reflecting the fact that Equities represented over 90% of Gartmore’s AUM.
AUM by asset class (%)
Fixed incomePropertyPrivate Equity
Equities 5524
192
Investment performance
Investment performance of the Group’s funds continues to remain good over three years although one year figures suffered slightly following lower Property performance and volatile markets in the second half of 2011. Overall, 59% and 66% of funds exceeded their benchmarks over one and three years respectively. Looking at the various asset classes, 53% and 71% of Equity funds and 79% and 87% of Fixed Income funds were either achieving or beating their benchmarks for one year and three years respectively. Property performance was 48% and 23% for one year and three years respectively where in particular the effects of the property downturn in 2008 and 2009 continued to impact the longer term numbers.
Within Investment Management, 53% of Equity funds and 79% of Fixed Income funds achieved or beat their benchmarks over one year, improving to 71% and 87% respectively over three years. The UK Retail and the SICAV fund ranges have both improved their performance over three years with 70% and 94% of assets respectively outperforming. Whilst remaining disappointing, the US Retail range improved both its one year and three year performance over the period. In this range, the Henderson International Opportunities Fund, representing over half of US Retail assets, remained below its benchmark. Segregated mandates continue to perform well with 71% and 97% of funds achieving or beating benchmark over one and three years respectively and despite a difficult environment for absolute return funds, 52% and 89% outperformed.
With the IPD Annual Benchmarks to be published in March 2012, Property investment performance included in the overall fund performance statistics remains an estimate derived from monthly data.
30
40
50
60
70
80
Investment performanceover 1 and 3 years (%)
% of assets at/exceeding benchmark over 1 year (incl Property)
% of assets at/exceeding benchmark over 3 years (incl Property)
KPI
FY07 FY08 FY09 FY10 FY11
Gartmore acquisition
The acquisition of Gartmore completed on 4 April 2011 at a cost of £365.4m. The acquisition has enhanced the Group’s scale and product capability in the UK and European retail fund markets, providing a significant platform for future organic growth. In addition, the Group’s absolute return product offering has been significantly strengthened along with distribution capability in Asia, particularly Japan. As at 31 December, some 86% of the AUM (before market movements and net of notified redemptions at announcement) had been retained. The business is now fully integrated within the Group’s existing businesses and functions.
The operating margin of the acquired Gartmore business has exceeded 50% and the integration has delivered significant enhancements in underlying earnings per share. Our annualised return on investment has exceeded our cost of capital.
As a result of the acquisition, we recognised intangible assets representing purchased goodwill of £238.3m and investment management contracts valued at £220.9m. The investment management contracts are being amortised on a straight-line basis over periods of between four and six years. The amortisation charge for FY11 was £30.1m.
Total acquisition and integration costs incurred, totalled £69.7m before tax (£34.5m after tax and other tax benefits) and include costs related to staff, fund mergers, rebranding and office relocation and reorganisation.

07 Henderson Group Full Year Results 2011
Liquidity and capital resources
The Group’s business continued to generate positive operating cash flows during 2011 with net cash flows from operating activities, after funding Gartmore integration costs, totalling £90.6m. Net cash flows from investing and financing activities were dominated by the funding for the acquisition of Gartmore, with the Group raising a net £116.7m in March 2011 through the issuance of the 2016 Notes and the associated exchange of the 2012 Notes. Immediately following the Gartmore acquisition, the Group repaid Gartmore’s £245.4m euro and dollar denominated debt by utilising Gartmore’s cash resources and part of the proceeds of the debt issuance.
During the year, the Group has recognised a £23.5m credit in the Consolidated Statement of Changes in Equity which represents monies unclaimed by former shareholders in respect of an exchange for the cancellation of shares in 2005.
Cash and cash equivalents at 31 December 2011 were £273.9m, an increase of £97.3m in FY11 and gross debt, at par, amounted to £292.6m. Therefore, at 31 December 2011 net debt, excluding restricted and manager dealing account balances, stood at £28.0m. On 2 May 2012, the Group will repay the 2012 Notes of £142.6m in full from its existing cash resources.
To ensure sufficient funds were available for the repayment of Gartmore debt and subsequent working capital, the Group entered into a £200m multi currency term facility on 12 January 2011. On 3 February 2012, the remaining elements of this facility were cancelled. Also on 12 January 2011, the Group entered into a £75m revolving credit facility which expires in April 2014. To date, this facility has not been drawn and remains available to the Group.
Pension schemes
The Group has five pension schemes. A defined benefit scheme and a defined contribution scheme, together forming the Henderson Group Pension Scheme (HGPS), the Gartmore Pension Scheme (GPS) and three smaller unapproved pension top-up schemes for former executives.
There was a net surplus in HGPS of £136.8m, after tax deducted at source, at 31 December 2011. The increase in the surplus was mainly due to better than expected returns on the assets and the move from the Retail Prices Index to the Consumer Prices Index as the basis for future increases in deferred pensions following legislation announced by the Government during the year. A reduction in the discount rate used to value the liabilities partially offset these gains.
The defined benefit GPS, which is closed to future accrual, had a net surplus of £54.1m, after tax deducted at source, as at 31 December 2011. The increase in the surplus, since acquisition, arose as a result of better than expected returns on assets, partly offset by a reduced discount rate used to value the liabilities. The liability in respect of the Group’s unapproved pension schemes amounted to £6.5m at 31 December 2011.
Regulatory requirements
The Group is subject to regulatory oversight and inspection by the FSA and other international regulatory bodies. Consequently, the Group’s internal controls, governance, procedures and capital are reviewed on a continuous basis. Both management and the Board of Directors ensure that the Group is compliant with its regulatory obligations at all times. In 2011, as part of the Gartmore acquisition process, the Group was granted a new waiver from consolidated supervision which is valid until April 2016.
The regulatory capital surplus of the Group, under the parent financial holding company test, amounted to £623m at 31 December 2011 (2010: £304m). The increase in capital surplus is primarily as a result of shares issued in respect of the Gartmore acquisition.
Dividends
The Board is recommending a final dividend for 2011 of 5.05 pence per share which will bring the total dividend for the year to 7.0 pence per share, an increase of 0.5 pence per share from 2010. The proposed final dividend will be paid on 25 May 2012 to shareholders on the register at 4 May 2012.
The Board has adopted a progressive dividend policy and will continue to apply a dividend formula where the next interim dividend will be 30% of the total dividend of the previous year, assuming the Group has the resources to fund the dividend.
Shirley Garrood Chief Financial Officer
Financial Review and KPIs continued

08Henderson Group Full Year Results 2011
Summary of movements in AUM£m
Opening AUM 2011
Gartmore take-on AUM
Henderson net flows
Gartmore net flows1
Group net flows Transfers2
Markets/ FX
Closing AUM 2011
Closing AUM Ave
net mngt fee bps4
INVESTMENT MANAGEMENT UK OEICs/Unit Trusts 9,758 6,456 283 (344) (61) 207 (1,634) 14,726 SICAVs 5,075 3,027 (697) (234) (931) – (1,004) 6,167 US Mutuals 3,649 – (314) – (314) – (454) 2,881 Investment Trusts 3,639 383 19 (24) (5) – (434) 3,583Total Retail 22,121 9,866 (709) (602) (1,311) 207 (3,526) 27,357 UK OEICs/Unit Trusts 4,487 172 (582) (35) (617) – 278 4,320 SICAVs 139 178 115 (97) 18 – (55) 280 Offshore Absolute Return Funds 1,630 1,694 139 (154) (15) – (330) 2,979
Investment Trusts 32 – (5) – (5) – – 27 Managed CDOs 1,210 – (289) – (289) – 115 1,036 Segregated Mandates 9,251 2,411 (3,411) (426) (3,837) 201 (44) 7,982 Liquidity Funds 2,278 60 79 (60) 19 (1,889) (9) 459 NSIM Mandates 1,092 – 66 – 66 (1,137) (21) –Total Institutional 20,119 4,515 (3,888) (772) (4,660) (2,825) (66) 17,083TOTAL INVESTMENT MANAGEMENT 42,240 14,381 (4,597) (1,374) (5,971) (2,618) (3,592) 44,440 57Consisting of:
Absolute Return Retail 292 656 111 286 397 – (30) 1,315 Absolute Return Institutional 1,811 1,694 146 (173) (27) – (223) 3,255Total Absolute Return 2,103 2,350 257 113 370 – (253) 4,570PROPERTY UK OEICs/Unit Trusts 840 – (45) – (45) – (13) 782Total Retail 840 – (45) – (45) – (13) 782 Property Funds 8,977 – 247 – 247 – 289 9,513 Segregated Mandates 1,993 – 68 – 68 18 34 2,113Total Institutional 10,970 – 315 – 315 18 323 11,626TOTAL PROPERTY 11,810 – 270 – 270 18 310 12,408 45PRIVATE EQUITY Investment Trusts 78 – (22) – (22) – 7 63Total Retail 78 – (22) – (22) – 7 63 Private Equity Funds3 728 – (34) – (34) – 198 892 Hermes JV – 1,334 – (37) (37) (1,402) 105 –Total Institutional 728 1,334 (34) (37) (71) (1,402) 303 892TOTAL PRIVATE EQUITY 806 1,334 (56) (37) (93) (1,402) 310 955PHOENIX UK OEICs/Unit Trusts 3,238 – (240) – (240) – (166) 2,832 Segregated Mandates 2,307 – (85) – (85) 864 471 3,557 Private Equity Funds 118 – (31) – (31) – 5 92 Liquidity Funds 1,090 – (226) – (226) (864) – –TOTAL PHOENIX 6,753 – (582) – (582) – 310 6,481TOTAL GROUP 61,609 15,715 (4,965) (1,411) (6,376) (4,002) (2,662) 64,284 55
Notes1. Since acquision, after taking into account previously net notified redemptions, Gartmore outflows total £1,043m.2. These represent transfer of HLAF to DB Advisors, and sales of NSIM and Hermes GPE JV during 2011.3. Private Equity AUM is based on 30 September 2011 valuations.4. Private Equity AUM and net management fees (including Hermes JV) are excluded from this analysis due to the confidential nature of these fee arrangements and, therefore, also excluded from the average management fee basis points.

Our framework embeds the management of risk at all levels within our organisation. The framework also ensures that we meet our business objectives without exceeding our risk appetite and is subject to continuous review to ensure it recognises both new and emerging risks in the business. The risk management framework is set out in more detail in the Corporate Governance Statement.
09 Henderson Group Full Year Results 2011
Risk Management
Acquisition Credit Foreign currency
Key personnel
Liquidity
Description
The risk of organisational stress through the potential demands made on staff and resources through the need to integrate acquired businesses. This risk is aligned to the Group’s long-term strategy that involves willingness to consider the acquisition of businesses.
Description
The risk of a counterparty to the Group defaulting on funds deposited with it or the non-receipt of a trade debt.
Description
The risk that the Group will sustain losses through adverse movements in exchange rates.
Description
The risk of losing either a member of the Executive Committee (ExCo) or one of the Group’s key investment or distribution professionals. This could have an adverse effect on both the growth of the business and/or the retention of existing business.
Description
The risk that the Group may be unable to meet its payment obligations as they fall due.
Mitigation
We only consider acquisitions where they fit with our strategic goals and meet our financial criteria such that we can realise value for our shareholders. Thorough due diligence is performed before any acquisition is made and this includes assessing the ability of the Group to integrate successfully the acquired business. During the year, and as more fully explained on page 6, Gartmore was acquired and integrated successfully within the Henderson business. Governance structures were established to identify, monitor and control acquisition related risks. Acquisition integration activities have been completed.
Mitigation
We have an established credit risk policy to ensure counterparties meet minimum rating requirements consistent with the Group’s risk appetite. Furthermore, the Credit Risk Committee meets regularly to approve, review and set limits for all new and existing counterparties. As a result of the market conditions during 2011, there has been heightened focus on monitoring counterparties and limits have been changed accordingly.
Mitigation
We mitigate this risk through either the effect of natural hedges i.e. holding financial assets and liabilities of equal value in the same currency, and by limiting the net exposure to an individual currency or by hedging exposure arising from available-for-sale securities. A Hedge Committee oversees the risk and reports to the Board monthly. As a result of the market conditions during 2011, there has been heightened focus on monitoring euro denominated assets.
Mitigation
We operate competitive remuneration structures designed to recognise and reward performance. We also have succession planning to ensure that there is cover for key roles should they become vacant. In addition, staff surveys identify any issues which could adversely impact staff retention and comprehensive training is offered ensuring skills and knowledge reside in more than one individual.
Mitigation
We manage liquidity on a daily basis within the Finance function, to ensure the Group has sufficient cash and/or highly liquid assets available to meet its liabilities. The Group ensures that it has access to funds to cover all forecast commitments for at least the following 12 months. Henderson does not bear any liquidity risk associated with our clients’ funds and has no obligation to provide short-term liquidity to our clients.

10Henderson Group Full Year Results 2011
Key risks and their mitigationThe key risks faced by the Group fall into a number of distinct categories and the means adopted to mitigate them are both varied and relevant to the nature of the risk concerned.
Go online www.henderson.com for the Group’s risk management and capital disclosures in accordance with chapter 11 of the FSA’s Prudential Sourcebook for Banks, Building Societies and Investment Firms (Pillar 3 disclosures).
Investment performance
Market Operational Regulatory/legal
Reputational
Description
The risk that funds fail to achieve performance hurdles or benchmarks. This might cause clients to redeem their investments, which in turn would result in a reduction in revenue earned by the Group. Poor fund performance will also result in lower performance fees.
Description
The risk that market conditions lead to a decline in the value of Group available-for-sale financial assets and/or a reduction in the value of clients’ AUM, which would result in a reduction in the level of the revenue that is based on the value of clients’ AUM.
Description
The risk that the Group will sustain losses through inadequate or failed internal processes, people, systems and external events. This includes the risk arising from failing to manage key outsourced service providers properly and also the risk arising from business disruption (the occurrence of events which could have a material impact on the operations of the business).
Description
The risk that a change in laws and regulations will materially affect the Group’s business or markets in which it operates. The Group’s business is subject to many regulations in different jurisdictions and currently the pace of change is significant and may affect the business either directly or indirectly by reducing investors’ appetite for our products, increasing capital requirements or in some other way.
Description
The risk that negative publicity regarding the Group will lead to a loss of revenue or litigation. The risk of damage to the Group’s reputation is more likely to result from one of the risks materialising rather than as a standalone risk.
Mitigation
We mitigate this risk through a robust investment process which includes detailed research. We also have a clearly articulated investment philosophy and analyse our funds by comparing their performance against appropriate benchmarks. We also have a broad range of funds to reduce the probability of all funds underperforming at the same time.
Mitigation
We mitigate the risk on the Group’s available-for-sale assets by investing in a diversified range of assets and mitigate a fall in the value of clients’ AUM by having a broad range of clients by distribution channel, product, asset class and region. In addition, the Group actively seeks fee bases which are not solely related to one market value of AUM and makes a significant amount of its expense base variable. As explained more fully on page 5 staff costs have been reduced in the latter part of 2011 in response to reduced market levels in order to maintain an acceptable level of profitability.
Mitigation
We operate a system of controls which is designed to ensure operational risks are mitigated to an acceptable level. The operation and effectiveness of the controls are regularly assessed and confirmed through the work of the Group’s assurance functions: Risk, Compliance and Internal Audit. Outsourced service providers are overseen by the relevant line function and, for key relationships, their controls are also reviewed by the Group’s assurance functions. We maintain and test business continuity plans which are designed to ensure that, should an event occur which disrupts business activity, we are able to maintain our operations without irreparable damage being done to the business.
Mitigation
We continuously monitor regulatory developments and where there is likely to be an impact, we have working groups in place to implement the changes. The Compliance team in particular monitors ongoing regulatory obligations and engages in dialogue with our main regulator.
Mitigation
We believe that reputational risk is mitigated through the effective mitigation of the other key risks. In addition, we regularly update clients and the market and in doing so, mitigate the risk of reputational damage.

11 Henderson Group Full Year Results 2011
Consolidated Income Statement For the year ended 31 December 2011
Notes2011
£m2010
£m
IncomeGross fee income and commissions 3 682.8 487.9Finance income 3 3.3 0.8Gross income 686.1 488.7Commissions and fees payable 3 (206.0) (125.8)Total income 480.1 362.9
ExpensesOperating expenses 4.1 (300.7) (250.3)Depreciation (3.0) (3.2)Total expenses before finance costs (303.7) (253.5)Finance expenses 6 (17.2) (8.7)Total expenses (320.9) (262.2)
Underlying profit before tax 159.2 100.7Intangible amortisation 13 (41.7) (11.6)Void property finance charge 22 (2.1) (2.1)Gartmore related employee share awards 5.3 (33.2) –Recurring profit before tax 82.2 87.0Non-recurring items 7 (69.2) (10.5)Profit before tax 13.0 76.5Tax on recurring profit (14.2) (16.1)Tax on non-recurring items 7 16.2 0.6
Non-recurring tax 7 18.9 16.4Total tax 8 20.9 0.9Profit after tax 33.9 77.4
Attributable to:Equity holders of the parent 34.0 77.9Non-controlling interests (0.1) (0.5) 33.9 77.4
DividendsDividends declared and charged to equity during the year 11 69.9 49.0Dividends proposed 11 55.4 38.8
Earnings per shareBasic 9.2.2 3.6p 9.9pDiluted 9.2.2 3.4p 9.2p

12Henderson Group Full Year Results 2011
Consolidated Statement of Comprehensive IncomeFor the year ended 31 December 2011
Notes2011
£m2010
£m
Profit after tax 33.9 77.4
Other comprehensive incomeExchange differences on translation of foreign operations 0.2 0.3
Available-for-sale financial assets:Net gains on revaluation 5.5 3.0Tax effect of available-for-sale financial assets movements 8 (0.2) (0.6)Translation reserve transfer on impairment – (0.3)
Actuarial gains:Actuarial gains on defined benefit pension schemes 21 41.6 14.8Actuarial gains on post-retirement medical scheme 0.1 0.2Tax effect of actuarial gains 8 – (3.9)Other comprehensive income after tax 47.2 13.5
Total comprehensive income after tax 81.1 90.9
Attributable to:Equity holders of the parent 81.2 91.4Non-controlling interests (0.1) (0.5)
81.1 90.9

13 Henderson Group Full Year Results 2011
Consolidated Statement of Financial PositionAs at 31 December 2011
Notes2011
£m2010
£m
Non-current assetsIntangible assets 13 765.1 345.0Investments accounted for using the equity method 14.2 3.7 6.8Plant and equipment 15 19.7 21.2Retirement benefit assets 21 190.9 112.5Deferred tax assets 23 45.3 30.3Deferred acquisition and commission costs 17 71.4 58.3 1,096.1 574.1Current assetsAvailable-for-sale financial assets 16 54.3 46.6Financial assets at fair value through profit or loss 16 10.5 1.2Current tax asset 3.9 –Trade and other receivables 18 168.3 141.6Deferred acquisition and commission costs 17 83.3 55.3Cash and cash equivalents 19.1 273.9 176.6 594.2 421.3
Total assets 1,690.3 995.4
Non-current liabilities
Debt instruments in issue 20 148.0 179.1Trade and other payables 24 2.7 –Retirement benefit obligations 21 6.5 6.2Provisions 22 18.7 25.3Deferred tax liabilities 23 88.5 50.1Deferred income 72.8 58.4 337.2 319.1Current liabilitiesDebt instruments in issue 20 143.4 –Trade and other payables 24 303.3 222.0Provisions 22 20.7 27.4Deferred income 85.4 56.3Current tax liabilities 12.9 15.7 565.7 321.4Total liabilities 902.9 640.5Net assets 787.4 354.9
Capital and reservesShare capital 25.2 137.2 104.2Share premium 679.0 261.0Own shares held (115.6) (52 .4)Translation reserve 6.4 6.2Revaluation reserve 10.5 5.0Profit and loss reserve 69.5 30.4Shareholders’ equity 787.0 354.4Non-controlling interests 27 0.4 0.5Total equity 787.4 354.9
The financial statements were approved by the Board of Directors and authorised for issue on 28 February 2012. They were signed on its behalf by:
Rupert Pennant-ReaChairman

14Henderson Group Full Year Results 2011
Share capital
£m
Share premium
£m
Own shares held £m
Translation reserve
£m
Revaluation reserve
£m
Profit and loss reserve
£m
Non-controlling
interests £m
Total equity
£m
At 1 January 2010 103.1 250.7 (51.6) 6.2 2.0 (29.2) 1.0 282.2Total comprehensive income after tax – – – – 3.0 88.4 (0.5) 90.9Dividends paid to equity shareholders – – – – – (49.0) – (49.0)Purchase of own shares – – (13.5) – – – – (13.5)Issue of shares for share schemes 1.1 10.3 (9.1) – – (1.2) – 1.1Vesting of share schemes – – 21.8 – – (21.8) – –Movement in equity-settled share scheme expenses – – – – – 18.0 – 18.0Tax movement on share scheme expenses – – – – – 25.2 – 25.2At 31 December 2010 104.2 261.0 (52.4) 6.2 5.0 30.4 0.5 354.9Total comprehensive income after tax – – – 0.2 5.5 75.5 (0.1) 81.1Dividends paid to equity shareholders – – – – – (69.9) – (69.9)Purchase of own shares – – (24.5) – – – – (24.5)Issue of shares for Gartmore acquisition 30.3 389.7 (70.0) – – – – 350.0Vesting of share schemes – – 57.4 – – (57.4) – –Share allotment 0.1 1.0 – – – – – 1.1Share issue costs – (0.1) – – – – – (0.1)Issue of shares for share schemes 2.6 27.4 (26.1) – – (1.6) – 2.3Fair value of share-based payment awards exchanged – – – – – 15.4 – 15.4Movement in equity-settled share scheme expenses – – – – – 54.0 – 54.0Tax movement on share scheme expenses – – – – – (0.4) – (0.4)Recognition of unclaimed capital distributions – – – – – 23.5 – 23.5At 31 December 2011 137.2 679.0 (115.6) 6.4 10.5 69.5 0.4 787.4
Consolidated Statement of Changes in EquityFor the year ended 31 December 2011

15 Henderson Group Full Year Results 2011
Consolidated Statement of Cash FlowsFor the year ended 31 December 2011
Notes2011
£m2010
£m
Cash flows from operating activitiesProfit before tax 13.0 76.5Adjustments to reconcile profit before tax to net cash flows from operating activities:– debt instrument interest expense 6 16.0 8.5– financing arrangement fees 3.6 –– share-based payment charges 10.2 23.9 18.0– Gartmore related employee share awards charge 10.2 30.1 –– intangible amortisation 13 41.7 11.6– computer software disposal 13 – 0.9– goodwill impairment 13 – 8.7– share of profit of associates and joint ventures 14.2 (0.7) (2.0)– impairment of associate 0.3 –– plant and equipment depreciation 15 3.3 3.2– available-for-sale financial assets impairment – 1.8– loss/(gain) on disposal of available-for-sale financial assets 0.5 (0.1)– net deferred acquisition and commission costs and deferred income amortisation (5.6) 0.1– contributions to the Henderson Group Pension Scheme in excess of costs recognised (6.8) (7.5)– New Star void property provision release 22 (6.5) –– Towry Law International provision release – (5.8)– other provisions releases 22 (0.5) (0.1)– void properties finance charge 22 2.1 2.1Cash flows from operating activities before changes in operating assets and liabilities 114.4 115.9Changes in operating assets and liabilities 19.2 (11.0) 16.5Net tax (paid)/received (12.8) 1.8Net cash flows from operating activities 90.6 134.2
Cash flows from investing activitiesAcquisition of subsidiaries, including cash acquired 200.8 –Proceeds from sale of associates and joint ventures 15.9 –Proceeds from sale of available-for-sale financial assets 13.6 9.7Dividends from associates and distributions from joint ventures 4.4 1.8Purchases of:– available-for-sale financial assets (7.2) (12.4)– plant and equipment 15 (1.4) (1.1)– intangible assets 13 (0.2) –– interests in associates and joint ventures – (0.2)Net cash flows from investing activities 225.9 (2.2)
Cash flows from financing activitiesProceeds from issue of shares 2.1 0.2Purchase of own shares (24.5) (13.5)Dividends paid to equity shareholders 11 (69.9) (49.0)Interest paid on debt instruments in issue (15.5) (11.4)Recognition of unclaimed capital distributions 23.5 –Financing arrangement fees (3.6) –Debt issue costs (2.1) –Net proceeds from issue of 2016 Notes 116.7 –Repayment of Gartmore borrowings (245.4) –Net cash flows from financing activities (218.7) (73.7)Effects of exchange rate changes (0.5) (0.7)Net increase in cash and cash equivalents 97.3 57.6Cash and cash equivalents at beginning of year 176.6 119.0Cash and cash equivalents at end of year 19.1 273.9 176.6

16Henderson Group Full Year Results 2011
Company Income StatementFor the year ended 31 December 2011
Notes2011
£m2010
£m
Administration costs (1.7) (1.1)Total expenses before finance costs (1.7) (1.1)Finance costs 6 (2.1) –Loss before tax (3.8) (1.1)Tax 8 – –Loss after tax (3.8) (1.1)
Company Statement of Comprehensive IncomeFor the year ended 31 December 2011
2011 £m
2010 £m
Loss after tax (3.8) (1.1)Total comprehensive expense after tax (3.8) (1.1)
Company Statement of Financial PositionAs at 31 December 2011
Notes2011
£m2010
£m
Non-current assetsInvestment in subsidiaries 14.1 934.0 460.7 934.0 460.7Current assetsTrade and other receivables 18 1.6 0.1Financial assets at fair value through profit or loss 7.4 –Cash and cash equivalents 19.1 0.1 0.1 9.1 0.2Total assets 943.1 460.9
Current liabilitiesTrade and other payables 24 91.2 3.3Total liabilities 91.2 3.3Net assets 851.9 457.6
Capital and reservesShare capital 25.2 137.2 104.2Share premium 679.0 261.0Own shares held (115.6) (52.4)Profit and loss reserve 151.3 144.8Total equity 851.9 457.6
The financial statements were approved by the Board of Directors and authorised for issue on 28 February 2012. They were signed on its behalf by:
Rupert Pennant-ReaChairman

17 Henderson Group Full Year Results 2011
Company Statement of Changes in EquityFor the year ended 31 December 2011
Share capital
£m
Share premium
£m
Own shares held £m
Profit and loss reserve
£m
Total equity
£m
At 1 January 2010 103.1 250.7 (51.6) 153.3 455.5Total comprehensive expense after tax – – – (1.1) (1.1)Purchase of own shares – – (13.5) – (13.5)Issue of shares for share schemes 1.1 10.3 (9.1) (1.2) 1.1Vesting of share schemes – – 21.8 (21.8) –Movement in equity-settled share scheme expenses – – – 15.6 15.6At 31 December 2010 104.2 261.0 (52.4) 144.8 457.6Total comprehensive expense after tax – – – (3.8) (3.8)Dividends paid to equity shareholders – – – (0.1) (0.1)Purchase of own shares – – (24.5) – (24.5)Issue of shares for Gartmore acquisition 30.3 389.7 (70.0) – 350.0Vesting of share schemes – – 57.4 (57.4) –Share allotment 0.1 1.0 – – 1.1Issue of shares for share schemes 2.6 27.4 (26.1) (1.6) 2.3Share issue costs – (0.1) – – (0.1)Fair value of share-based payment awards exchanged – – – 15.4 15.4Movement in equity-settled share scheme expenses – – – 54.0 54.0At 31 December 2011 137.2 679.0 (115.6) 151.3 851.9
Company Statement of Cash FlowsFor the year ended 31 December 2011
Notes2011
£m2010
£m
Cash flows from operating activitiesLoss before tax (3.8) (1.1)Changes in operating assets and liabilities 19.2 26.3 13.7Net cash flows from operating activities 22.5 12.6
Cash flows from financing activitiesProceeds from issue of shares 2.1 0.2Purchase of own shares (24.5) (13.5)Dividends paid to equity shareholders (0.1) –Net cash flows from financing activities (22.5) (13.3)Net decrease in cash and cash equivalents – (0.7)Cash and cash equivalents at beginning of year 0.1 0.8Cash and cash equivalents at end of year 19.1 0.1 0.1

18Henderson Group Full Year Results 2011
Notes to the Financial Statements Group and Company
1. Authorisation of financial statements and statement of compliance with IFRS
The Group and Company financial statements for the year ended 31 December 2011 were authorised for issue by the Board of Directors on 28 February 2012 and the respective Statements of Financial Position were signed on the Board’s behalf by the Chairman, Rupert Pennant-Rea. Henderson Group plc is a public limited company incorporated in Jersey and tax resident in the Republic of Ireland. The Company’s ordinary shares are traded on the LSE and CDIs are traded on the ASX.
The Group and Company financial statements have been prepared in accordance with IFRS and the provisions of the Companies (Jersey) Law 1991.
The significant accounting policies adopted by the Group and by the Company are set out in note 2.1.
2. Accounting policies 2.1 Significant accounting policies
Basis of preparationThe Group and Company financial statements have been prepared on a going concern basis and on the historical cost basis, except for certain financial instruments that have been measured at fair value.
The Group and Company financial statements are presented in GBP and all values are rounded to the nearest one hundred thousand pounds (£0.1m), except when otherwise indicated.
Basis of consolidationThe consolidated financial statements of the Group comprise the financial statements of Henderson Group plc and its subsidiaries as at 31 December each year.
The financial statements of all the Group’s significant subsidiaries are prepared to the same year end date as that of the Company. The accounts of all material subsidiaries are prepared under either IFRS or UK GAAP. Where prepared under UK GAAP, balances reported by subsidiaries are adjusted to meet IFRS requirements for the purpose of the consolidated financial statements.
The results of subsidiaries acquired or disposed of during the year are included in the Consolidated Income Statement from the effective date of acquisition, being the date on which the Group obtains control, and continue to be consolidated until the date that the control ceases. Non-controlling interests represent the equity interests in subsidiaries not held by the Group.
Interests in property closed-ended funds, private equity infrastructure funds, Open-Ended Investment Companies (OEICs) and unit trusts are accounted for as subsidiaries, associates, joint ventures or other financial investments depending on the holdings of the Group and on the level of influence and control that the Group exercises. The Group’s investment in associates, where the Group has the ability to exercise significant influence as well as joint ventures where there is joint control, are accounted for using the equity method of accounting.
Income recognitionFee income and commission receivableFee income includes management fees, transaction fees and performance fees (including earned carried interest). Management fees and transaction fees are recognised in the accounting period in which the associated investment management or transaction services are provided. Performance fees are recognised when the prescribed performance hurdles have been achieved and it is probable that the fee will crystallise as a result. The Group accrues 95% of the expected fee on satisfaction that the recognition criteria have established a performance fee is due, with the balance recognised on cash settlement. Initial fees and commission receivable are deferred and amortised over the anticipated period in which services will be provided, determined by reference to the average term of investment in each product on which initial fees and commissions are earned. Other income is recognised in the accounting period in which services are rendered.
Carried interestThe Group is entitled to receive a share of profits (carried interest) from certain private equity funds it manages, once the funds meet certain performance conditions. Where the funds’ investments constitute large volumes in relatively illiquid markets, the Group does not deem it appropriate to recognise unearned carried interest based on current fair values. However, where the value of the carried interest will be determined by the future disposal of investments which are quoted on a recognised exchange, then the Group will recognise carried interest to the extent deemed prudent. Carried interest for all other types of investments is only recognised when investments are disposed of and performance conditions are met.
Finance incomeInterest income is recognised as it accrues using the effective interest rate method. Dividend income from investments is recognised on the date that the right to receive payment has been established.
Realised and unrealised gains and losses on financial assetsSee the policy set out under financial instruments on page 20.
Operating leasesAll leases are classified as operating leases. Operating lease payments are recognised as an expense in the Consolidated Income Statement on a straight-line basis over the lease term. Benefits received and receivable as an incentive to enter into an operating lease are also spread on a straight-line basis over the lease term.
Post-employment benefitsThe Group provides employees with retirement benefits through both defined benefit and defined contribution schemes. The assets of these schemes are held separately from the Group’s general assets in trustee administered funds.
Defined benefit obligations and the cost of providing benefits are determined annually by independent qualified actuaries using the projected unit credit method. The obligation is measured as the present value of the estimated future cash outflows using a discount rate based on AA rated corporate bond yields of appropriate duration. The resulting surplus or deficit of defined benefit assets less liabilities is recognised in the Consolidated Statement of Financial Position, net of any taxes that would be deducted at source. The Group’s expense related to these schemes is accrued over the employees’ service lives, based upon the actuarial cost for the accounting period, having considered interest costs and the expected return on assets. Actuarial gains and losses, to the extent these are recognised, are included in the Consolidated Statement of Comprehensive Income in the accounting period in which they occur, net of any taxes that would be deducted at source. Normal contributions to the defined contribution scheme are expensed in the Consolidated Income Statement as they become payable in accordance with the rules of the scheme.
Other post-employment benefits, such as medical care and life insurance, are also provided for certain employees. The costs of such benefits are accrued over the employees’ service lives, based upon the actuarial cost for the accounting period using a methodology similar to that for defined benefit pension schemes.

19 Henderson Group Full Year Results 2011
2. Accounting policies continued
Share-based payment transactionsThe Group issues equity-settled and cash-settled share-based payments to certain employees. The valuation methodology, assumptions and schemes are disclosed in note 10.
Equity-settled share-based payments are measured at the fair value of the equity instruments at the grant date. The awards are expensed, with a corresponding increase in reserves, on either a straight-line basis or a graded basis (depending on vesting conditions) over the vesting period, based on the Group’s estimate of shares that will eventually vest. Based on the Group’s estimate, the expected life of the awards used in the determination of fair value is adjusted for the effects of non-transferability, exercise restrictions, market performance and behavioural considerations.
The cost of cash-settled transactions is measured initially at fair value at the grant date. The fair value is expensed over the period until vesting, with recognition of a corresponding liability. The liability is remeasured at each reporting date up to and including the settlement date, with changes in fair value recognised in the Consolidated Income Statement.
Income taxesThe Group provides for current tax expense according to the tax laws of each jurisdiction in which it operates, using tax rates that have been enacted or substantively enacted by the reporting date.
Deferred tax is provided, using the liability method, on temporary differences at the reporting date between the tax bases of assets and liabilities and their carrying amounts for financial reporting purposes. Deferred tax liabilities are generally recognised for all taxable temporary differences and deferred tax assets are recognised to the extent that it is probable that taxable profits will be available against which deductible temporary differences can be utilised. Deferred tax assets or liabilities are not recognised if they arise from goodwill, however, they are recognised on separately identified intangible assets. If the deferred tax arises from the initial recognition of an asset or liability in a transaction, other than a business combination, that at the time of the transaction affects neither the accounting nor taxable profit or loss, it is not accounted for. The carrying amount of deferred tax assets is reviewed at each reporting date and reduced to the extent that it is no longer probable that sufficient taxable profits will be available to allow all or part of the asset to be recovered.
Deferred tax liabilities are not recognised for taxable differences arising on investments in subsidiaries, branches, associates and joint ventures where the Group controls the timing of the reversal of the temporary differences and where the reversal of the temporary differences is not anticipated in the foreseeable future.
Deferred tax is calculated at the tax rates that are expected to apply in the period when the liability is settled or the asset is realised, based on tax rates and tax laws that have been enacted or substantively enacted by the reporting date.
Income tax relating to items recognised in the Consolidated Statement of Comprehensive Income is also recognised in that statement and not in the Consolidated Income Statement.
Sales taxesExpenses and assets are recognised net of the amount of sales tax, except where the sales tax is not recoverable, in which case the sales tax is recognised as part of the cost of acquisition of the asset or as part of expenses. Receivables and payables are stated with the amount of sales tax included. The net amount of sales tax recoverable from, or payable, to the tax authority, is included separately in receivables or payables in the Consolidated Statement of Financial Position.
Business combinationsUnder the requirements of IFRS 3 Business Combinations, all business combinations are accounted for using the purchase method (acquisition accounting). The cost of a business combination is the aggregate of the fair values, at the date of exchange, of assets given, liabilities incurred or assumed and equity instruments issued by the acquirer. The fair value of a business combination is calculated at the acquisition date by recognising the acquiree’s identifiable assets, liabilities and contingent liabilities that satisfy the recognition criteria, at their fair values at that date. The acquisition date is the date on which the acquirer effectively obtains control of the acquiree. The cost of a business combination in excess of fair value of net identifiable assets or liabilities acquired, including intangible assets identified, is recognised as goodwill. Any costs incurred in relation to a business combination after 1 July 2009 are expensed when the services are received.
GoodwillGoodwill arising on acquisitions is capitalised in the Consolidated Statement of Financial Position. Goodwill on acquisitions prior to 1 January 2004 is carried at its value on 1 January 2004 less any subsequent impairments.
Goodwill arising on investments in associates and joint ventures is included within the carrying value of the equity accounted investments.
Impairment of goodwillGoodwill is reviewed for impairment annually or more frequently if changes in circumstances indicate that the carrying value may be impaired. For this purpose, management prepares a valuation for each cash generating unit based on value in use. This valuation is based on the approved forecasts for future years, extrapolated for expected future growth rates and discounted at a risk adjusted discount rate based on the Group’s post-tax weighted average cost of capital. Where the value in use is less than the carrying amount, an impairment is recognised. Where goodwill forms part of an entity or sub-group and the entity or sub-group or part thereof is disposed of, the goodwill associated with the entity or sub-group disposed of is included in the carrying amount of the operation when determining the gain or loss on disposal. Any impairment is recognised immediately through the Consolidated Income Statement and cannot subsequently be reversed.
Investment management contractsInvestment management contracts have been identified as a separately identifiable intangible asset arising on the acquisition of subsidiaries. Intangible assets are recognised at the present value of the expected future cash flows of the investment management contracts acquired. The intangible asset is amortised on a straight-line basis over the expected life of the investment management contracts, currently estimated at between three and eight years.
Computer softwareThe costs of purchasing and developing computer software, together with associated relevant expenditure, are capitalised where it is probable that future economic benefits that are attributable to the assets will flow to the Group and the cost of the assets can be measured reliably. Computer software is included in the Consolidated Statement of Financial Position as an intangible asset and is recorded initially at cost and then amortised over its expected useful life, of between three and five years, on a straight-line basis.
Plant and equipmentPlant and equipment is valued at cost and depreciated on a straight-line basis over its useful economic life of between two and 20 years.
An item of plant and equipment is removed upon disposal or when no future economic benefits are expected to arise from the continued use of the asset. Any gain or loss arising on the disposal of the asset, calculated as the difference between the net disposal proceeds and the carrying amount of the asset, is included in the Consolidated Income Statement in the year the item is sold or retired.
Notes to the Financial Statements Group and Company continued
20Henderson Group Full Year Results 2011
Investments in subsidiariesInvestments by the Company in subsidiary undertakings are held at cost less any impairment where circumstances indicate that the carrying value may not be recoverable.
Equity accounted investmentsEquity accounted investments comprise investments in associates and joint ventures held by the Group. Investments are recognised initially at cost. The investments are subsequently carried at cost adjusted for the Group’s share of profits or losses and other changes in comprehensive income of the associate or joint venture, less any dividends or distributions received by the Group. The Consolidated Income Statement includes the Group’s share of profits or losses for the year or period of ownership, if shorter.
Deferred acquisition and commission costsIncremental acquisition costs incurred in obtaining investment management business are deferred to the extent that they are recoverable out of future income. This includes initial commission paid by the Group in respect of certain investment products. These costs are amortised over the period in which they are expected to be recovered from matching revenues from related contracts. At the end of each accounting period, deferred acquisition and commission costs are reviewed for recoverability against future revenues from the related contracts in force at the reporting date.
Placement fees are deferred and amortised over the expected investment period of the fund. Where the actual investment period is significantly shorter than expected, the amortisation rate is accelerated accordingly.
Impairment of assets (excluding goodwill and financial assets)At each reporting date, the Group assesses whether there is any indication that an asset may be impaired. Where an indicator of impairment exists, the Group makes an estimate of the recoverable amount, being the higher of an asset’s fair value less cost to sell, and its value in use. In assessing value in use, the estimated future cash flows are discounted to their net present value using a risk adjusted discount rate based on the Group’s post-tax weighted average cost of capital.
Where the carrying amount of an asset exceeds its recoverable amount, the asset is considered to be impaired and is written down to its recoverable amount. An impairment loss is recognised in the Consolidated Income Statement.
Financial instrumentsFinancial assets and liabilities are recognised in the Consolidated Statement of Financial Position when the Group becomes party to the contractual provisions of an instrument, at fair value adjusted for transaction costs except for financial assets classified at fair value through profit or loss, where transaction costs are immediately
recognised in the Consolidated Income Statement. Financial assets are derecognised when the rights to receive cash flows from the investments have expired or where they have been transferred and the Group has also transferred substantially all risks and rewards of ownership. Financial liabilities cease to be recognised when the obligation under the liability has been discharged, cancelled or has expired.
Financial assetsPurchases and sales of financial assets are recognised at the trade date, being the date when the purchase or sale becomes contractually due for settlement. Delivery and settlement terms are usually determined by established practices in the market concerned.
Debt securities, equity securities and holdings in authorised collective investment schemes are designated as either fair value through profit or loss, or available-for-sale, and are measured at subsequent reporting dates at fair value. The Group determines the classification of its financial assets on initial recognition. Financial assets classified as fair value through profit or loss comprise the Group’s manager box positions in OEICs and unit trusts and investments in the Group’s fund products on behalf of employee benefit trusts, which are recorded on a fair value basis. Where securities are designated as fair value through profit or loss, gains and losses arising from changes in fair value are included in the Consolidated Income Statement.
For available-for-sale financial assets, gains and losses arising from changes in fair value which are not part of a designated hedge relationship are recognised in the Consolidated Statement of Comprehensive Income. When an asset is disposed of, the cumulative changes in fair value, previously recognised in the Consolidated Statement of Comprehensive Income, are taken to the Consolidated Income Statement in the current accounting period.
Unrealised gains and losses on financial assets represent the difference between the fair value of financial assets at the reporting date and cost or, if these have been previously revalued, the fair value at the last reporting date. Realised gains and losses on financial assets are calculated as the difference between the net sale proceeds and cost or amortised cost.
Where a fall in the value of an investment is prolonged or significant, this is considered an indication of impairment. In such an event, the investment is written down to fair value and the amounts previously recognised in the Consolidated Statement of Comprehensive Income in respect of cumulative changes in fair value, are taken to the Consolidated Income Statement as an impairment charge.
Trade receivables, which generally have 30-90 day payment terms, are initially recognised at fair value, normally equivalent to the invoice amount. When the time value of money is material, the fair value is discounted. Provision for specific doubtful debts is made when there is evidence that the Group will not be able to recover balances in full. Balances are written off when the receivable amount is deemed irrecoverable.
Cash amounts represent cash in hand and on-demand deposits. Cash equivalents are short-term highly liquid government securities or investments in money market instruments with a maturity date of three months or less.
Financial liabilitiesFinancial liabilities are stated at amortised cost using the effective interest rate method. Amortised cost is calculated by taking into account any issue costs and any discount or premium on settlement. A financial liability ceases to be recognised when the obligation under the liability has been discharged, cancelled or has expired.
Derivative financial instruments and hedgingThe Group may, from time to time, use derivative financial instruments to hedge against price, interest rate, foreign currency and credit risk. Derivative financial instruments are classified as financial assets when the fair value is positive or as financial liabilities when the fair value is negative.
At the inception of a hedge, the Group formally designates and documents the hedge relationship to which the Group wishes to apply hedge accounting and the risk management objective and strategy for undertaking the hedge. Such hedges are expected to be effective in achieving offsetting changes in fair value and are assessed on an ongoing basis to determine that they have been effective throughout the reporting periods for which they were designated and are expected to remain effective over the remaining hedge period.
21 Henderson Group Full Year Results 2011
2. Accounting policies continued
Currency hedgesForward currency contracts are used to hedge the currency nominal value of certain Euro and US dollar denominated available-for-sale financial assets and are classified as fair value hedges. The change in the fair value of a hedging instrument is recognised in the Consolidated Income Statement. The change in the fair value of the hedged item, attributable to the risk being hedged, is also recognised in the Consolidated Income Statement, offsetting the fair value changes arising on the designated hedge instrument.
Fair value estimationThe fair value of financial instruments traded in active markets (such as publicly traded securities and derivatives) is based on quoted market prices at the reporting date. The quoted market price used for financial instruments is the current bid price. The fair value of financial instruments that are not traded in an active market is determined using valuation techniques commonly used by market participants, including the use of comparable recent arm’s length transactions, discounted cash flow analysis and option pricing models.
ProvisionsProvisions which are liabilities of uncertain timing or amount, are recognised when: the Group has a present obligation, legal or constructive, as a result of a past event; it is probable that an outflow of resources embodying economic benefits will be required to settle the obligation; and a reliable estimate can be made of the amount of the obligation. In the event that the time value of money is material, provisions are determined by discounting the expected future cash flows at a discount rate that reflects a current market assessment of the time value of money and, where appropriate, the risks specific to the liability. When discounting, the increase in the provision due to the passage of time is recognised as a finance charge.
Foreign currenciesThe functional currency of the Company is GBP. Transactions in foreign currencies are recorded at the appropriate exchange rate prevailing at the date of the transaction. Foreign currency monetary balances at the reporting date are converted at the prevailing exchange rate. Foreign currency non-monetary balances carried at fair value or cost are translated at the rates prevailing at the date when the fair value or cost is determined. Gains and losses arising on retranslation are taken to the Consolidated Income Statement, except for available-for-sale financial assets where the unhedged changes in fair value are recognised in the Consolidated Statement of Comprehensive Income.
On consolidation, the assets and liabilities of the Group’s overseas operations whose functional currency is not GBP are translated at exchange rates prevailing at the reporting
date. Income and expense items are translated at average exchange rates for the accounting period. Exchange differences arising, if any, are taken through the Consolidated Statement of Comprehensive Income to the translation reserve. In the period in which the operation is disposed of, these translation differences are then recognised in the Consolidated Income Statement.
Equity sharesThe Company’s ordinary equity shares of 12.5 pence each are classified as equity instruments. Equity shares issued by the Company are recorded at the fair value of the proceeds received or the market price on the day of issue. Direct issue costs, net of tax, are deducted from equity through share premium. When share capital is repurchased, the amount of consideration paid, including directly attributable costs, is recognised as a change in equity.
Own shares heldOwn shares held are equity shares of the Company acquired by or issued to employee benefit trusts. Own shares held are recorded at cost and are deducted from equity. No gain or loss is recognised in the Consolidated Income Statement on the purchase, issue, sale or cancellation of the Company’s own equity shares.
Dividend recognitionDividend distributions to the Company’s shareholders are recognised in the accounting period in which the dividends are paid and, in the case of final dividends, when these are approved by the Company’s shareholders at the AGM. Dividend distributions are recognised in equity.
2.2 Significant accounting judgements, estimates and assumptions
In the process of applying the Group’s accounting policies, management has made significant judgements involving estimations and assumptions which are summarised below:
Impairment of goodwillAs explained on page 19, goodwill is reviewed for impairment annually or more frequently if changes in circumstances indicate that the carrying value may be impaired.
The judgement exercised by management in arriving at this valuation includes the selection of market growth rates, fund flow assumptions, expected margins and costs. Further details are given in note 13.
Share-based payment transactionsThe Group measures the cost of equity-settled share schemes at fair value at the date of grant and expenses them over the vesting period based on the Group’s estimate of shares that will eventually vest.
The liability for cash-settled share schemes represents the estimated transaction cost up to the settlement date, taking into account historical experience of good and bad leavers.
Impairment of available-for-sale financial assetsAvailable-for-sale financial assets are reviewed for impairment at each reporting date or more frequently as required. In specific cases, where a quoted market price or fair value is not available, significant judgement is exercised by management in determining the extent of impairment, taking into account other available market data. Management also exercises judgement in determining whether a decrease in the value of an asset meets the prolonged or significant tests.
Pension and other post-employment benefitsThe costs of and period end obligations under defined benefit pension schemes are determined using actuarial valuations. The actuarial valuation involves making assumptions about discount rates, expected rates of return on assets, future salary increases, mortality rates and future pension increases. Due to the long-term nature of these schemes, such estimates are subject to significant uncertainty. Further details are given in note 21.
Deferred tax assetsDeferred tax assets are recognised for unused tax losses to the extent that it is probable that future taxable profits will be available against which the losses can be utilised. Significant judgement is required by management in determining the amount of deferred tax assets that can be recognised, based upon the likely timing and level of future taxable profits together with future tax planning strategies.
ProvisionsBy their nature, provisions often reflect significant levels of judgement by management. The nature and amount of the provisions included in the Consolidated Statement of Financial Position are detailed in note 22 and contingencies not provided for are disclosed in note 32.
Accrued incomeAccrued income is based on latest available information and involves a degree of estimation. The most significant estimation relates to the accrual of performance fees as described on page 18.
Notes to the Financial Statements Group and Company continued

22Henderson Group Full Year Results 2011
Consolidation of seed investmentsFrom time to time, the Group provides seed capital on the launch of its products, such as UCITSs, SICAVs, hedge funds and other investment vehicles. The seed capital investments vary in duration depending on the nature of the investment, with a typical range of less than one year for Investment Management products and between three and seven years for Private Equity and Property funds. Given the limited size and nature of these investments, the Group does not consider itself to have significant influence or control over the underlying funds to warrant accounting for them using the equity method or consolidating them in the Group’s financial statements.
2.3 Changes in accounting policies
The accounting policies adopted in this Annual Report and Accounts are consistent with those of the previous financial year. The Group has also adopted any IFRS or IFRIC interpretations that are effective for the first time for the financial year beginning on or after 1 January 2011. There were no new standards effective for the current year which had a material impact on the Group.
2.4 Future changes in accounting policies
During the course of the year, the IASB and the IFRIC issued a number of new accounting standards, amendments to existing standards and interpretations. The following new standards are not applicable to these financial statements but are expected to have an impact when they become effective. The Group plans to apply these standards in the reporting period in which they become effective.
IFRS 10 Consolidated Financial Statements defines the principle of control, and establishes control as the basis for consolidation in the preparation of consolidated financial statements. This standard has a mandatory effective date in 2013.
IFRS 11 Joint Arrangements states that when deciding how to account for joint ventures, the focus is on rights and obligations. This standard has a mandatory effective date in 2013.
IFRS 12 Disclosure of Involvement with Interests in Other Entities includes the disclosure requirements for all forms of interests in other entities, such as joint arrangements, associates and other off balance sheet vehicles. This standard has a mandatory effective date in 2013.
IFRS 9 Financial Instruments proposes revised measurement and classification criteria for financial assets. This standard has a mandatory effective date in 2015.
The Group is assessing the impact of the above standards on the Group’s future financial statements.

23 Henderson Group Full Year Results 2011
3. Income
Group
2011
£m2010
£m
Gross fee income and commissionsGross fee income 599.3 438.3Amortisation of deferred income 83.5 49.6
682.8 487.9Finance incomeInterest on cash and cash equivalents 2.0 1.5Net investment income from, and gains and (losses) on, available-for-sale financial assets 1.3 (0.7)Net gains/(losses) arising on derivatives in a designated fair value hedge accounting relationship 0.8 (1.1)Net (losses)/gains arising on adjustment for hedged items in a designated fair value hedge accounting relationship (0.8) 1.1 3.3 0.8Gross income 686.1 488.7
Commissions and fees payableCommissions and fees payable (128.2) (75.9)Amortisation of deferred acquisition and commission costs (77.8) (49.9) (206.0) (125.8)Total income 480.1 362.9
4. Expenses4.1 Operating expenses
Group
Note2011
£m2010
£m
Employee compensation and benefits 5.2 199.9 161.1Investment administration 28.1 23.3Information technology 14.0 12.7Operating leases 9.0 8.3
Office expenses 7.4 7.9Foreign exchange losses/(gains) 0.2 (1.6)Other expenses 42.1 38.6Total operating expenses 300.7 250.3
Other expenses include marketing, travel and subsistence, and legal and professional costs. In 2010, other expenses also included £3.0m of costs incurred in relation to the potential acquisition of RidgeWorth.
4.2 Auditors’ remuneration
Group and Company2011
£m2010
£m
Fees payable to the Group’s auditors for the audit of the Group’s consolidated financial statements 0.3 0.3Fees payable to the Group’s auditors and their associates for other services:– statutory audit of the Group’s subsidiaries 0.9 0.6– other services pursuant to legislation 0.4 0.3– other services – 0.2Total fees 1.6 1.4
The above analysis reflects the amounts billed by Ernst & Young LLP in the respective years. Included in the fees payable to the Group’s auditors for the audit of the Group’s 2011 consolidated financial statements are fees of £30,000 (2010: £30,000) for the audit of the Company’s 2011 financial statements.
Notes to the Financial Statements Group and Company continued

24Henderson Group Full Year Results 2011
5. Employee compensation and benefits5.1 Average number of employees
The average number of full-time employees of the Group was as follows:
Group Company
2011
no.2010
no.2011
no.2010
no.
Average number of employees 1,043 941 3 3
The total number of full-time employees (excluding those working on capitalised projects) at 31 December 2011 was 1,060 (2010: 965) for the Group and three (2010: three) for the Company.
5.2 Analysis of employee compensation and benefits expense
Employee compensation and benefits expense comprises the following:
Group Company
Note2011
£m2010
£m2011
£m2010
£m
Salaries, wages and bonuses 165.0 135.3 0.8 0.5Share-based payments 22.4 14.2 – –Social security costs 10.8 8.9 0.1 0.2Pension service cost 21 1.7 2.7 – –Total employee compensation and benefits expense 199.9 161.1 0.9 0.7
5.3 Gartmore related employee share awards
The £33.2m charge represents the post-acquisition share-based payment charge for awards to Gartmore employees originally made in 2010 and exchanged into Henderson Group plc shares upon acquisition on the same terms as the original awards.
6. Finance expenses
Group Company2011
£m2010
£m2011
£m2010
£m
Debt instrument interest 16.0 8.5 – –Bank facility fees 1.2 0.2 2.1 –Total finance expenses 17.2 8.7 2.1 –
Included in the Company’s bank facility fees are £1.2m of expenses to ensure adequate capital was available to complete the acquisition of Gartmore. These deal related costs are included in the non-recurring items (refer to note 7).
An interest rate swap was entered into at the time of issuing the 2012 Notes in May 2007, to swap the fixed coupon of 6.5% per annum into six month sterling LIBOR plus 85.75bps per annum. The swap was unwound on 9 December 2008 and the cumulative fair value adjustment to the debt carrying value, attributable to the hedged interest rate risk up to the date of unwinding, £10.5m, is being amortised over the remaining term of the debt to maturity on 2 May 2012. In 2011, the impact of the amortisation of the profit on unwinding the swap is a reduction in finance costs of £2.7m (2010: £3.1m).
7. Non-recurring items
GroupThe non-recurring items recorded in the Consolidated Income Statement comprise the following:
2011
£m2010
£m
Gartmore integration costs (69.7) –Restructuring costs (6.0) –New Star void property provision release 6.5 –FSCS interim levy – (7.6)Goodwill impairment – (8.7)Towry Law International provision release – 5.8Non-recurring items before tax (69.2) (10.5)Tax on non-recurring items 16.2 0.6Non-recurring tax 18.9 16.4
Non-recurring items after tax (34.1) 6.5

25 Henderson Group Full Year Results 2011
2011Gartmore integration costsOn 4 April 2011, the Group’s acquisition of Gartmore was completed. In relation to the acquisition and integration of Gartmore, costs of £69.7m before tax have been incurred during the period. These costs mainly relate to staff related expenses, legal and professional fees, transition of outsourced retail and investment operations, office relocation and reorganisation and fund mergers.
Restructuring costsIn response to the market downturn in the second half of 2011, the Group has restructured certain parts of its business, incurring staff related costs of £6.0m.
New Star void property provision releaseA void property provision recognised on the acquisition of New Star in 2009 has been reassessed resulting in a release of £6.5m.
Non-recurring taxFollowing the acquisition of Gartmore, the Group reassessed the potential utilisation of previously unrecognised tax assets and tax liabilities recognised by Gartmore in the first quarter of 2011. Consequently a deferred tax asset of £14.8m has been recognised in respect of the expected utilisation of these assets against future taxable profits and £4.1m of Gartmore tax liabilities have been released.
2010FSCS interim levyIn November 2010, the FSCS indicated that it would raise an interim levy on investment managers in respect of claims received primarily from investors in Keydata Investment Services Limited (in administration). The Group provided for this levy in full during 2010.
Goodwill impairmentThe goodwill allocated to the NSIM cash generating unit, (a specialised segregated company formerly part of New Star), as a result of an earn out deal in respect of that company, was impaired in full as a result of a 50% decline in AUM.
Towry Law International provision releaseDuring the second half of 2010, the majority of a previously recognised product mis-selling provision, relating to legacy Towry Law International products, was deemed no longer required and was released. This resulted in a £5.8m credit in 2010.
Non-recurring taxDuring the second half of 2010, HMRC closed enquiries into certain prior year tax filings, resulting in the Group releasing tax provisions of £16.4m.
Notes to the Financial Statements Group and Company continued
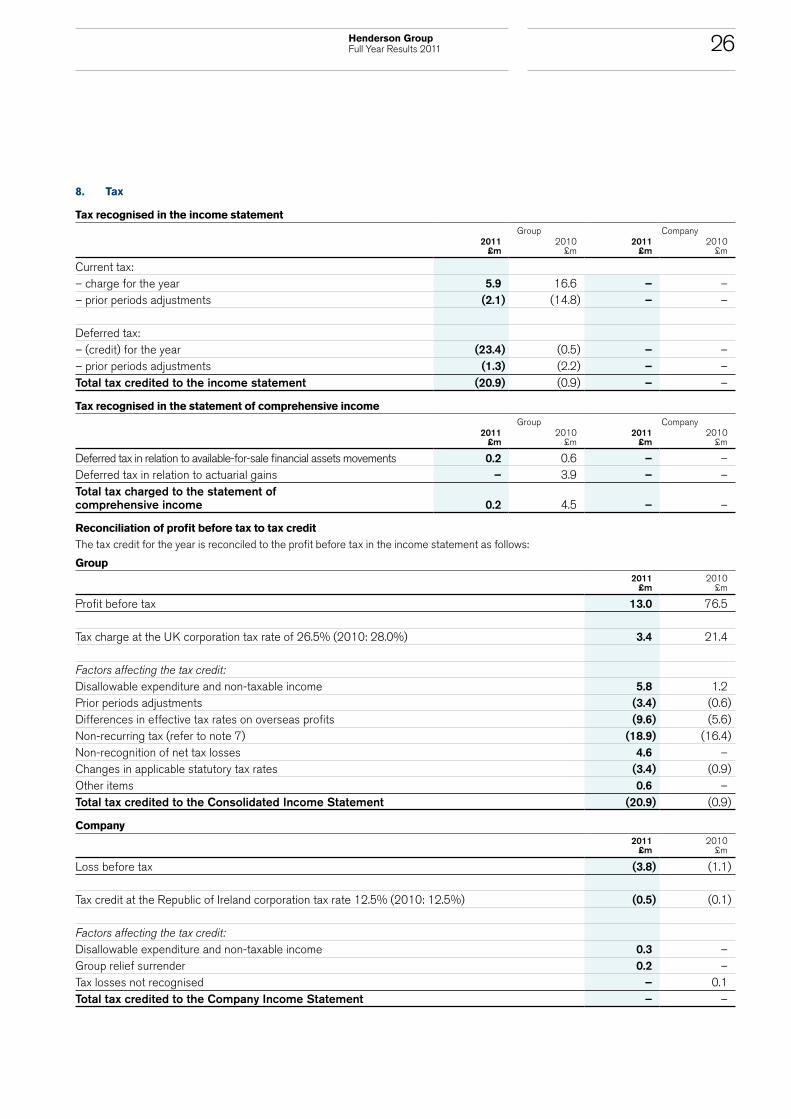
26Henderson Group Full Year Results 2011
8. Tax
Tax recognised in the income statement Group Company
2011 £m
2010 £m
2011 £m
2010 £m
Current tax:– charge for the year 5.9 16.6 – –– prior periods adjustments (2.1) (14.8) – –
Deferred tax: – (credit) for the year (23.4) (0.5) – –– prior periods adjustments (1.3) (2.2) – –Total tax credited to the income statement (20.9) (0.9) – –
Tax recognised in the statement of comprehensive income Group Company
2011 £m
2010 £m
2011 £m
2010 £m
Deferred tax in relation to available-for-sale financial assets movements 0.2 0.6 – –Deferred tax in relation to actuarial gains – 3.9 – –Total tax charged to the statement of comprehensive income 0.2 4.5 – –
Reconciliation of profit before tax to tax creditThe tax credit for the year is reconciled to the profit before tax in the income statement as follows:
Group2011
£m2010
£m
Profit before tax 13.0 76.5
Tax charge at the UK corporation tax rate of 26.5% (2010: 28.0%) 3.4 21.4
Factors affecting the tax credit:Disallowable expenditure and non-taxable income 5.8 1.2Prior periods adjustments (3.4) (0.6)Differences in effective tax rates on overseas profits (9.6) (5.6)Non-recurring tax (refer to note 7) (18.9) (16.4)Non-recognition of net tax losses 4.6 –Changes in applicable statutory tax rates (3.4) (0.9)Other items 0.6 –Total tax credited to the Consolidated Income Statement (20.9) (0.9)
Company2011
£m2010
£m
Loss before tax (3.8) (1.1)
Tax credit at the Republic of Ireland corporation tax rate 12.5% (2010: 12.5%) (0.5) (0.1)
Factors affecting the tax credit:Disallowable expenditure and non-taxable income 0.3 –Group relief surrender 0.2 –Tax losses not recognised – 0.1Total tax credited to the Company Income Statement – –
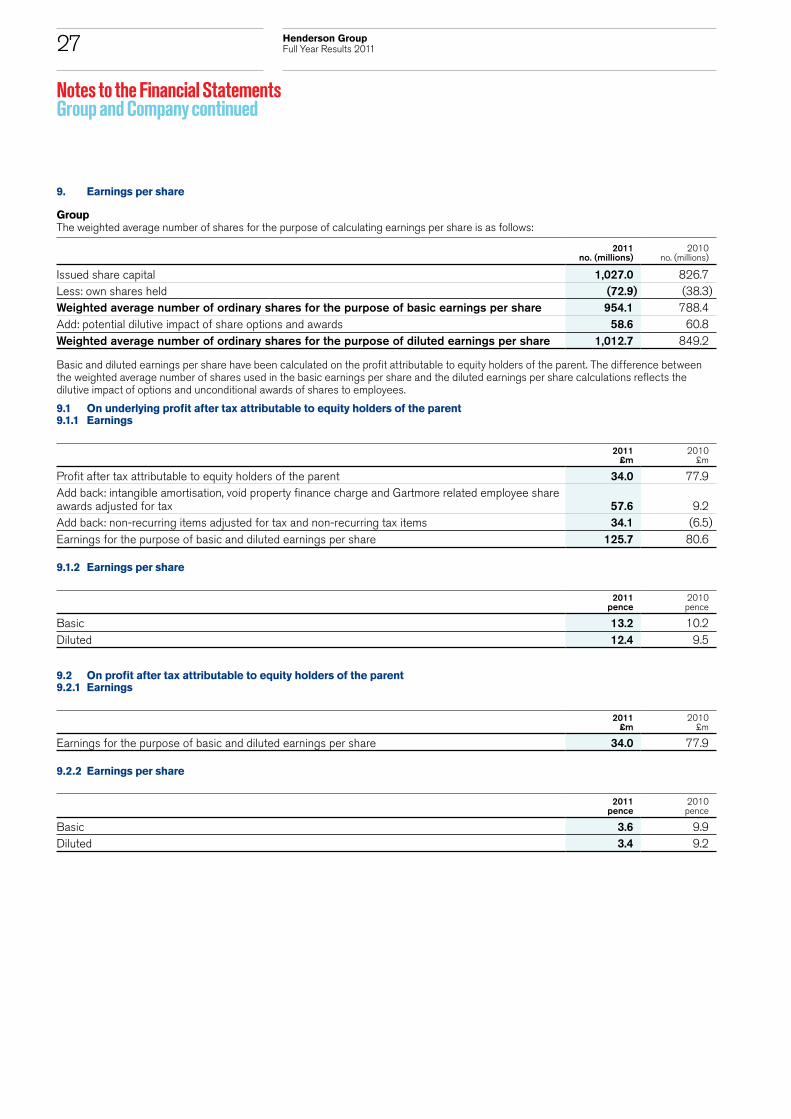
27 Henderson Group Full Year Results 2011
9. Earnings per share
GroupThe weighted average number of shares for the purpose of calculating earnings per share is as follows:
2011
no. (millions)2010
no. (millions)
Issued share capital 1,027.0 826.7Less: own shares held (72.9) (38.3)Weighted average number of ordinary shares for the purpose of basic earnings per share 954.1 788.4Add: potential dilutive impact of share options and awards 58.6 60.8Weighted average number of ordinary shares for the purpose of diluted earnings per share 1,012.7 849.2
Basic and diluted earnings per share have been calculated on the profit attributable to equity holders of the parent. The difference between the weighted average number of shares used in the basic earnings per share and the diluted earnings per share calculations reflects the dilutive impact of options and unconditional awards of shares to employees.
9.1 On underlying profit after tax attributable to equity holders of the parent9.1.1 Earnings
2011
£m2010
£m
Profit after tax attributable to equity holders of the parent 34.0 77.9Add back: intangible amortisation, void property finance charge and Gartmore related employee share awards adjusted for tax 57.6 9.2Add back: non-recurring items adjusted for tax and non-recurring tax items 34.1 (6.5)Earnings for the purpose of basic and diluted earnings per share 125.7 80.6
9.1.2 Earnings per share
2011 pence
2010 pence
Basic 13.2 10.2Diluted 12.4 9.5
9.2 On profit after tax attributable to equity holders of the parent9.2.1 Earnings
2011
£m2010
£m
Earnings for the purpose of basic and diluted earnings per share 34.0 77.9
9.2.2 Earnings per share
2011 pence
2010 pence
Basic 3.6 9.9Diluted 3.4 9.2
Notes to the Financial Statements Group and Company continued

28Henderson Group Full Year Results 2011
10. Share-based payments
Group
10.1 Share-based compensation plans
The following share-based compensation plans were in operation during 2011:
Restricted Share Plan (RSP)The RSP is a scheme that allows employees to receive shares in the Company for £nil consideration at a future point, usually after three years. The awards are made typically for staff recruitment and retention purposes and generally, the larger awards have a performance hurdle. The Remuneration Committee must approve all awards and the vesting of awards over £50,000. On vesting, in order to obtain the shares, the employee must satisfy any employee tax and social security obligations.
Employee Share Ownership Plan (ESOP)The 2008 ESOP enabled all staff, excluding Executive Directors, to defer part of their annual bonus into the ESOP, up to a specified limit, through the purchase of Company shares. The 2008 ESOP awarded one free matching share for every share purchased. To receive the matching shares, employees had to remain in the plan for three years. Matching shares for the 2008 ESOP vested in June 2011. Forfeiture conditions apply in the case of approved and unapproved leavers. No plan was offered in 2009 or 2010.
The 2011 ESOP enabled all staff, including the Executive Directors, to defer part of their annual bonus into the plan up to a specified limit through the purchase of Company shares. The 2011 ESOP awards up to three matching shares for every share purchased depending on the achievement of the Henderson Group TSR and Company share price performance. The plan is a five year plan with one third of the matching shares vesting on the third, fourth and fifth anniversary of the plan, if the conditions have been met on these anniversaries.
Long-Term Incentive Plan (LTIP)The LTIP is a scheme that grants selected employees restricted shares or nil cost options that have employment conditions and performance conditions attached as shown below. Employees who have been awarded nil cost options have five years to exercise their options following the three year vesting period:
Criteria
Amount vesting 2008 to 2011 plans
Henderson Group TSR less than the 50th percentile of the FTSE 350 General Financial Services companies nil%Henderson Group TSR at the 50th percentile of the FTSE 350 General Financial Services companies 25%Henderson Group TSR at or above the 75th percentile of the FTSE 350 General Financial Services companies 100%
For a Henderson Group TSR between the 50th and 75th percentiles, the amount vesting will increase on a linear basis. In addition, the Remuneration Committee must be satisfied the Henderson Group TSR reflects the underlying performance of the Group.
For the 2011 LTIP, employees who are US citizens have been awarded performance shares as opposed to nil cost options but the vesting and forfeiture criteria remain the same. The Henderson Risk team, because of the nature of their role, have different corporate risk related performance and vesting conditions that must be approved by the Board Risk Committee.
Employees are entitled to dividend equivalents. Dividend equivalents are paid based on the dividends declared during the three year vesting period in respect of the shares that vest at the end of the three year period. The dividend equivalents are payable in two equal tranches, at the end of years four and five.
The employees are not entitled to vote or receive dividends in respect of these awards until the vesting conditions are met, nor are they allowed to pledge, hedge or assign the expected awards in any way.
In accordance with the scheme terms, the 2008 LTIP met its vesting conditions on 31 December 2010 and the awards vested in February 2011. The TSR performance condition resulted in 100% of the award being capable of exercise. The 2009 LTIP met its vesting conditions on 31 December 2011 and the awards will vest in April 2012. The TSR performance condition resulted in 100% of the award being capable of exercise.
29 Henderson Group Full Year Results 2011
10. Share-based payments continued10.1 Share-based compensation plans continued
Deferred Equity Plan (DEP)Under the Group’s remuneration policy, for employees who receive cash based incentive awards, over a preset threshold, an element of their award is deferred. The majority of deferrals are deferred into the Company’s shares, with some deferrals into Group managed funds when deemed appropriate. The deferred monies are paid to the DEP trustee, who purchases shares or units or shares in Group products and holds them in trust subject to employment conditions. In 2008, these shares attracted one free matching share for every four shares awarded by the trustee. Since 2008, there has been no matching share element.
Hedge fund performance fee deferrals into hedge funds are held in trust for two years on a fully restricted basis and have no matching elements.
Forfeiture conditions apply in the case of approved and unapproved leavers.
Deferrals relating to 2009 awards were deferred into the Company’s shares for up to two years and vest in two equal tranches. Deferrals relating to 2010 and 2011 awards were deferred for up to three years and vest in three equal tranches. For those employees who elected to participate in the 2011 ESOP, their restricted shares upon vesting (three equal tranches in 2012, 2013 and 2014) automatically transfer into the 2011 ESOP as bonus shares and in order to obtain matching shares become subject to the performance and employment conditions of that plan.
The expense of deferred short term incentive awards is recognised in the Consolidated Income Statement over the period of deferral. As at 31 December 2011, £21.1m (2010: £14.1m) of deferred awards are to be recognised in future periods.
Buy As You Earn Share Plan (BAYE)The BAYE is a HMRC approved plan. Eligible employees who wish to purchase shares in the Company invest a monthly amount up to a maximum of £125, which is deducted from their gross salary. Each participating employee receives, for no additional payment, two free matching shares for each share purchased (partnership shares). Partnership shares will be forfeited if purchased shares are withdrawn from the trust within one year.
The Group introduced an international version of the BAYE during 2010. It operates on a similar basis to the UK version, the principal differences are that there is no forfeiture of shares awarded and that each participating employee receives one free matching share for each share purchased.
Company Share Option Plan (CSOP)The CSOP is a HMRC approved share option plan and the maximum value of unvested options at any time is limited to £30,000 for UK employees. No such restrictions apply for overseas employees. It is a global plan that provides employees with an opportunity to buy shares after a three year vesting period at an option price fixed at the start of the scheme. There are no Group performance conditions attached to the options. At vesting, the employee must choose whether or not to exercise the options within two years of the vesting date. Executive Directors are not eligible to participate in the CSOP because it has no Group performance conditions although they may hold awards made prior to their executive appointment.
Executive Shared Ownership Plan (ExSOP)The ExSOP is an employee shared ownership plan and is aimed at encouraging employee share ownership at middle management level. Executive Directors do not participate in the ExSOP.
Under the terms of the ExSOP, certain employees may be invited to acquire jointly with an employee benefit trust, the beneficial interest in a number of shares under the terms of a joint ownership agreement (JOA). Under a JOA, the employee will benefit from any growth in value of the jointly owned shares from the time of the award in excess of a hurdle amount fixed by the Board in respect of each award.
For the 2011 ExSOP, the market price at grant was £1.61 (2010: £1.24) per share. The hurdle price including the 9% carry charge was set at £1.76 (2010: £1.35) per share. The shares have a vesting period of three years. The employees then have a further two years to take their portion of the jointly owned shares.
Sharesave scheme (SAYE)The SAYE is a HMRC approved plan. UK employees may participate in more than one scheme but only up to a maximum of £250 per month across all schemes. Eligible employees who participate in the SAYE contribute a monthly amount from their net salary to a savings account. The SAYE vesting period is three years for UK employees.
A 2011 SAYE offering was made during the year. At the end of a three year period, the employees in the 2011 SAYE can choose to exercise their share options using the funds in their account, together with a bonus equivalent to 0.1 (2009 SAYE: 0.6 and 2010 SAYE: 0.3) times the monthly saving amount, to subscribe for shares at a preset price. This was £1.31 (2009 SAYE: £0.58 and 2010 SAYE: £1.00) per share, a 20% discount to the share price on the average share price of 7 to 11 March 2011 (2009 SAYE: 4 March 2009 and 2010 SAYE: average of first five working days of March 2010). Employees have up to six months after the three year period to exercise their options and subscribe for shares. Forfeiture provisions apply in the case of approved and unapproved leavers. The 2008 SAYE vested in 2011.
In 2006, the Group launched the USA Employee Share Purchase Plan (ESPP). The ESPP works broadly on the same principles as the UK SAYE but has a two year savings period, a lower discount level at 15% and no bonus element. In 2011, the preset option price was USD2.19 (2009 ESPP: USD0.88 and 2010 ESPP: USD1.62). Employees may participate in more than one plan but only up to a plan maximum of USD312.50 per month across all sharesave plans.
Gartmore plansThe Gartmore plans are schemes that allow employees to receive shares in the Company for £nil consideration at a future point, usually after three years. The awards were made by Gartmore, prior to the Group’s acquisition, typically for staff retention purposes. On vesting, in order to obtain the shares, the employee must still be in employment and must satisfy any employee tax and social security obligations. These awards are now governed by the rules covering the Group’s DEP and RSP awards.
Notes to the Financial Statements Group and Company continued
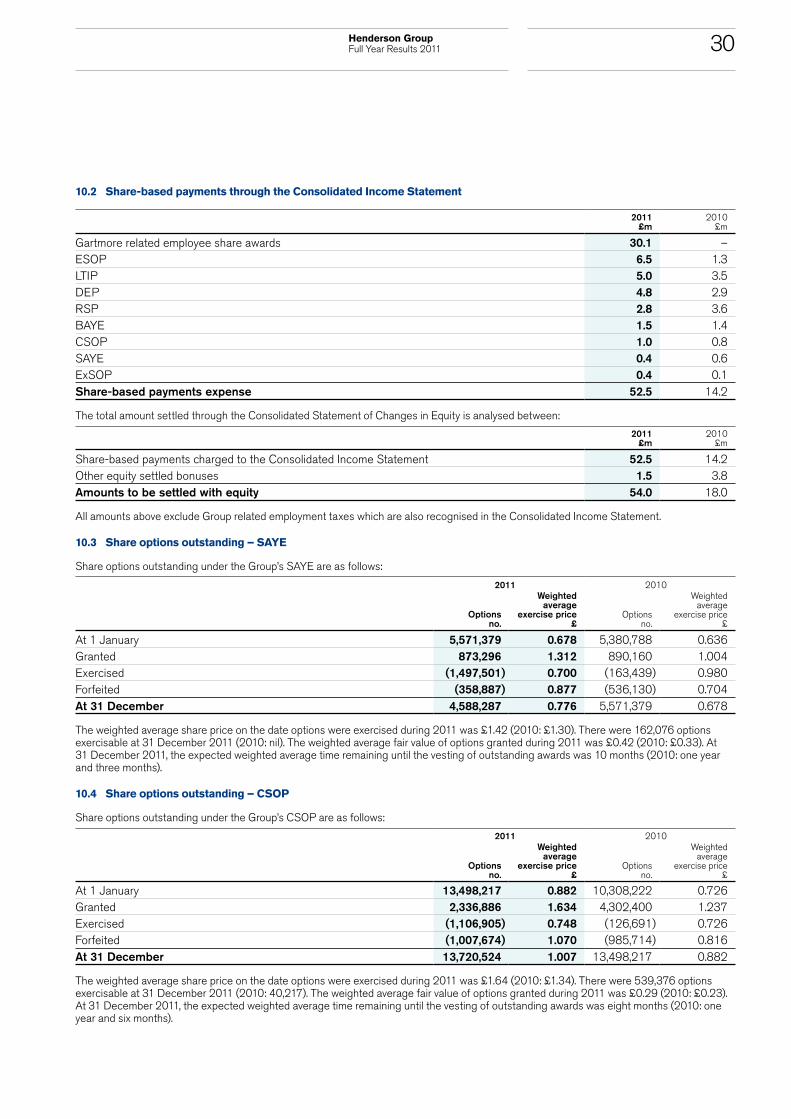
30Henderson Group Full Year Results 2011
10.2 Share-based payments through the Consolidated Income Statement
2011
£m2010
£m
Gartmore related employee share awards 30.1 –ESOP 6.5 1.3LTIP 5.0 3.5DEP 4.8 2.9RSP 2.8 3.6BAYE 1.5 1.4CSOP 1.0 0.8SAYE 0.4 0.6ExSOP 0.4 0.1Share-based payments expense 52.5 14.2
The total amount settled through the Consolidated Statement of Changes in Equity is analysed between:
2011
£m2010
£m
Share-based payments charged to the Consolidated Income Statement 52.5 14.2Other equity settled bonuses 1.5 3.8Amounts to be settled with equity 54.0 18.0
All amounts above exclude Group related employment taxes which are also recognised in the Consolidated Income Statement.
10.3 Share options outstanding – SAYE
Share options outstanding under the Group’s SAYE are as follows:
2011 2010
Options no.
Weighted average
exercise price£
Options no.
Weighted average
exercise price £
At 1 January 5,571,379 0.678 5,380,788 0.636Granted 873,296 1.312 890,160 1.004Exercised (1,497,501) 0.700 (163,439) 0.980Forfeited (358,887) 0.877 (536,130) 0.704At 31 December 4,588,287 0.776 5,571,379 0.678
The weighted average share price on the date options were exercised during 2011 was £1.42 (2010: £1.30). There were 162,076 options exercisable at 31 December 2011 (2010: nil). The weighted average fair value of options granted during 2011 was £0.42 (2010: £0.33). At 31 December 2011, the expected weighted average time remaining until the vesting of outstanding awards was 10 months (2010: one year and three months).
10.4 Share options outstanding – CSOP
Share options outstanding under the Group’s CSOP are as follows:
2011 2010
Options no.
Weighted average
exercise price £
Options no.
Weighted average
exercise price £
At 1 January 13,498,217 0.882 10,308,222 0.726Granted 2,336,886 1.634 4,302,400 1.237Exercised (1,106,905) 0.748 (126,691) 0.726Forfeited (1,007,674) 1.070 (985,714) 0.816At 31 December 13,720,524 1.007 13,498,217 0.882
The weighted average share price on the date options were exercised during 2011 was £1.64 (2010: £1.34). There were 539,376 options exercisable at 31 December 2011 (2010: 40,217). The weighted average fair value of options granted during 2011 was £0.29 (2010: £0.23). At 31 December 2011, the expected weighted average time remaining until the vesting of outstanding awards was eight months (2010: one year and six months).

31 Henderson Group Full Year Results 2011
10. Share-based payments continued10.5 Jointly owned shares outstanding – ExSOP
Jointly owned shares outstanding under the Group’s ExSOP are as follows:
2011 2010
Jointly owned shares
no.
Weighted average
exercise price £
Jointly owned shares
no.
Weighted average
exercise price £
At 1 January 3,597,000 1.240 – –Granted 2,399,040 1.758 3,640,800 1.240Exercised (21,048) 1.240 – –Forfeited (583,952) 1.401 (43,800) 1.240At 31 December 5,391,040 1.453 3,597,000 1.240
The weighted average share price on the date options were exercised during 2011 was £1.59. There were no shares exercised in 2010. There were no jointly owned shares exercisable at 31 December 2011 (2010: nil). The fair value of the jointly owned shares granted during 2011 was £0.23 (2010: £0.22). At 31 December 2011 the expected weighted average time remaining until the vesting of outstanding awards was one year and 10 months (2010: two years and six months).
10.6 Fair values of share-based compensation plans
The fair value amounts for the options and jointly owned shares granted under the SAYE, CSOP and ExSOP were determined using the Black Scholes option-pricing method, using the following assumptions:
2011 SAYE 2011 CSOP 2011 ExSOP 2010 SAYE 2010 CSOP 2010 ExSOP
Dividend yield 3.72% 3.90% 4.03% 5.36% 5.36% 5.36%Expected volatility 29.3% 29.2% 29.6% 35.8% 35.8% 35.8%Risk-free interest rate 3.73% 3.73% 3.54% 3.55% 3.55% 3.55%Expected life 3 years 3 years 3 years 3 years 3 years 3 yearsWeighted average share price £1.640 £1.665 £1.613 £1.250 £1.240 £1.240Exercise price £1.312 £1.634 £1.758 £1.004 £1.237 £1.240
Expected volatility has been calculated based on the historical volatility for the Company’s shares over three years.
Other share schemes involve the grant of shares for £nil consideration. The fair value of these grants is calculated using the share price at grant date, which is set out in the following table. No adjustments have been made for dividends.
2011 2010
Scheme
Shares granted
no.
Average grant share price
£
Shares granted
no.
Average grant share price
£
BAYE 1,909,477 1.472 1,737,536 1.281LTIP 8,417,000 1.731 13,375,000 1.267RSP 830,381 1.399 1,794,632 1.275DEP 6,708,516 1.413 4,305,306 1.301Gartmore related employee share awards (refer to note 5.3) 38,132,073 1.731 – –
The fair value calculation for the LTIP includes a statistical assessment of the likelihood of the Company achieving performance targets as set out in the plan.
Notes to the Financial Statements Group and Company continued

32Henderson Group Full Year Results 2011
11. Dividends paid and proposed
Company
2011
£m
2011 pence
per share2010
£m
2010 pence
per share
Dividends on ordinary shares declared and paid in the periodFinal dividend in respect of 2H10 (2H09) 49.2 4.65 34.1 4.25Interim dividend in respect of 1H11 (1H10) 20.7 1.95 14.9 1.85Total dividends paid and charged to equity 69.9 6.60 49.0 6.10
2011
£m
2011 pence
per share2010
£m
2010 pence
per share
Dividends proposed on ordinary shares for approval by the shareholders at the AGMFinal dividend for 2H11 (2H10) 55.4 5.05 38.8 4.65
The Board is recommending a final dividend for 2H11 of 5.05 pence per share which, when added to the interim 1H11 dividend of 1.95 pence per share, results in a total dividend for 2011 of 7.0 pence per share.
The dividend proposed in respect of 2H11 of £55.4m is based on the total number of ordinary shares in issue at 31 December 2011.
There is an increase of £9.8m between the proposed dividends (2H10 final: £38.8m, 1H11 interim: £21.3m), as reported in the 2010 Annual Report and Accounts and the Interim Results for the six months to 30 June 2011, versus the dividends paid out during the year (2H10 final: £49.2m, 1H11 interim: £20.7m). This represents an additional £11.3m of dividends paid as a result of the Gartmore acquisition offset by a decrease of £1.5m in relation to dividends waived by employee benefit trust trustees on shares held in trust on behalf of Group employees. The amount waived in respect of the final dividend declared for 2011 will be established by the employee benefit trust trustees on 4 May 2012, being the dividend record date.
Pursuant to the Income Access Share arrangements, shareholders in the Company are able to elect to receive their dividends from a UK source. Shareholders will be deemed to have elected to receive their dividends under the Income Access Share arrangements unless they have elected to receive them directly from the Company. All elections remain in force indefinitely unless revoked. Shareholders who have opted out of the Income Access Share arrangements will receive dividends from an Irish source and will be taxed accordingly.

33 Henderson Group Full Year Results 2011
12. Segmental information
Group operating income and net assetsHenderson is an investment manager, operating throughout Europe and with operations in North America and Asia. The Group manages a broad range of actively managed investment products for institutional and retail investors, across multiple asset classes, including equities, fixed income, property and private equity. Management operates across product lines, distribution channels and geographic regions. All investment product types are sold in most, if not all, of these regions and are managed in various locations.
Information is reported to the chief operating decision maker, the Board, on an aggregated basis. Strategic and financial management decisions are determined centrally by the Board and, on this basis, the Group is a single segment investment management business.
Entity-wide disclosures
Revenues by product 2011
£m2010
£m
UK OEIC/Unit Trusts 313.7 188.3SICAVs 112.2 63.2Property segregated mandates and funds 63.0 59.6Offshore absolute return funds 52.2 19.5Institutional segregated mandates and cash funds 57.5 57.3US mutuals 33.3 34.3Other 50.9 65.7Gross fee income and commissions 682.8 487.9
Geographic information
Revenues from clients2011
£m2010
£m
UK 513.1 386.2Luxembourg 86.0 44.4Americas 29.8 33.0Japan 13.3 –Singapore 13.0 8.2Ireland 4.6 2.4Other 23.0 13.7Gross fee income and commissions 682.8 487.9
The geographical revenue information is split according to the country in which the revenue is generated, not necessarily where the client is based.
The Group does not have a single client which accounts for more than 10% of revenues.
Non-current assets 2011
£m2010
£m
UK 853.5 421.4Other 6.4 9.9 859.9 431.3
Non-current assets for this purpose consist of intangible assets, investments accounted for using the equity method, plant and equipment and deferred acquisition and commission costs.
Notes to the Financial Statements Group and Company continued
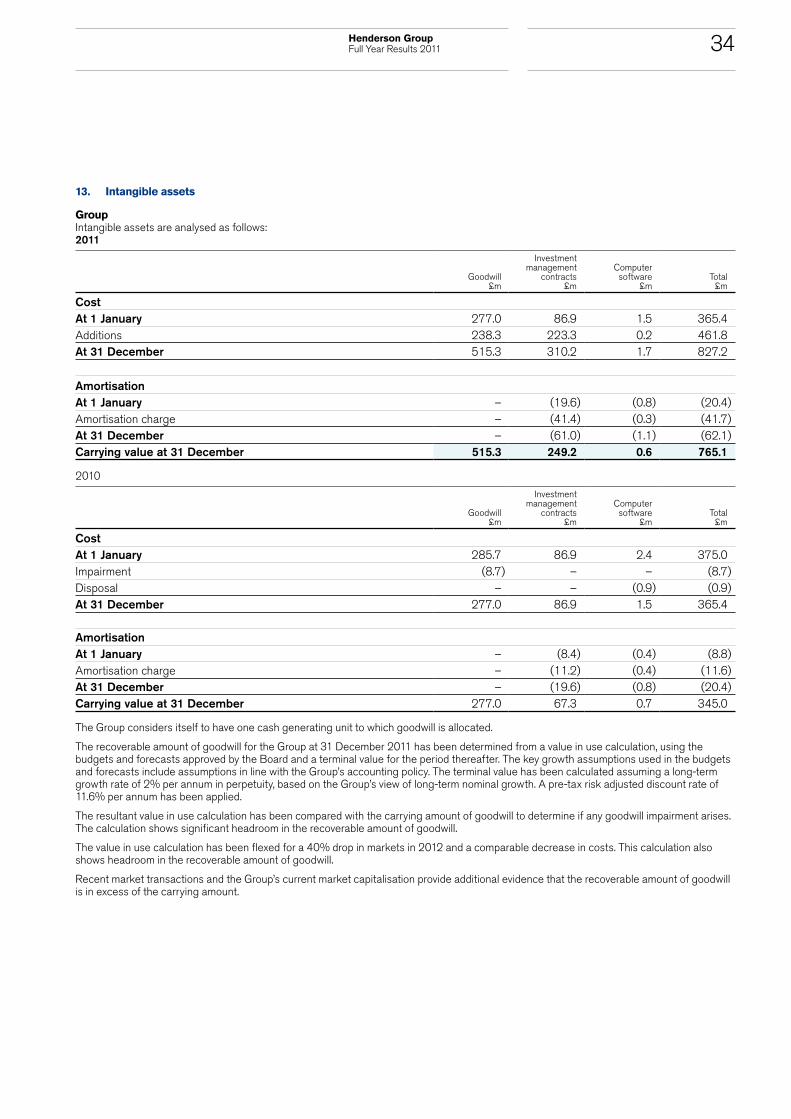
34Henderson Group Full Year Results 2011
13. Intangible assets
GroupIntangible assets are analysed as follows: 2011
Goodwill £m
Investment management
contracts £m
Computer software
£mTotal
£m
CostAt 1 January 277.0 86.9 1.5 365.4Additions 238.3 223.3 0.2 461.8At 31 December 515.3 310.2 1.7 827.2
AmortisationAt 1 January – (19.6) (0.8) (20.4)Amortisation charge – (41.4) (0.3) (41.7)At 31 December – (61.0) (1.1) (62.1)Carrying value at 31 December 515.3 249.2 0.6 765.1
2010
Goodwill £m
Investment management
contracts £m
Computer software
£mTotal
£m
CostAt 1 January 285.7 86.9 2.4 375.0Impairment (8.7) – – (8.7)Disposal – – (0.9) (0.9)At 31 December 277.0 86.9 1.5 365.4
AmortisationAt 1 January – (8.4) (0.4) (8.8)Amortisation charge – (11.2) (0.4) (11.6)At 31 December – (19.6) (0.8) (20.4)Carrying value at 31 December 277.0 67.3 0.7 345.0
The Group considers itself to have one cash generating unit to which goodwill is allocated.
The recoverable amount of goodwill for the Group at 31 December 2011 has been determined from a value in use calculation, using the budgets and forecasts approved by the Board and a terminal value for the period thereafter. The key growth assumptions used in the budgets and forecasts include assumptions in line with the Group’s accounting policy. The terminal value has been calculated assuming a long-term growth rate of 2% per annum in perpetuity, based on the Group’s view of long-term nominal growth. A pre-tax risk adjusted discount rate of 11.6% per annum has been applied.
The resultant value in use calculation has been compared with the carrying amount of goodwill to determine if any goodwill impairment arises. The calculation shows significant headroom in the recoverable amount of goodwill.
The value in use calculation has been flexed for a 40% drop in markets in 2012 and a comparable decrease in costs. This calculation also shows headroom in the recoverable amount of goodwill.
Recent market transactions and the Group’s current market capitalisation provide additional evidence that the recoverable amount of goodwill is in excess of the carrying amount.

35 Henderson Group Full Year Results 2011
14. Investments in subsidiaries, associates and joint ventures 14.1 Principal subsidiaries
CompanyInvestment in subsidiaries
2011
£m2010
£m
At 31 December 934.0 460.7
The directly held subsidiaries of the Company are as follows:
Country of incorporation and principal place of
operationFunctional
currencyPercentage
owned 2011Percentage
owned 2010
Henderson Global Group Limited Republic of Ireland GBP 100% 100%
GroupThe principal subsidiaries of the Group, excluding the directly held subsidiary of the Company shown above, are as follows:
Country of incorporation and principal place of
operationFunctional
currencyPercentage
owned 2011Percentage
owned 2010
Gartmore Group LimitedCayman Islands
and UK GBP 100% –Gartmore Investment Japan Limited Japan JPY 100% –Gartmore Investment Limited UK GBP 100% –Henderson Administration Limited UK GBP 100% 100%Henderson Alternative Investment Advisor Limited UK GBP 100% 100%Henderson Equity Partners Limited UK GBP 100% 100%Henderson Finances UK GBP 100% 100%Henderson Fund Management Limited UK GBP 100% 100%Henderson Global Investors (Holdings) Limited UK GBP 100% 100%Henderson Global Investors (International Holdings) BV Netherlands EUR 100% 100%Henderson Global Investors Limited UK GBP 100% 100%Henderson Global Investors (North America) Inc. USA USD 100% 100%Henderson Global Investors (Singapore) Limited Singapore SGD 100% 100%Henderson Holdings Group Limited UK GBP 100% 100%Henderson Holdings Group BV Netherlands GBP 100% 100%Henderson Holdings Limited UK GBP 100% 100%Henderson International Inc. USA USD 100% 100%Henderson Investment Funds Limited UK GBP 100% 100%Henderson Investment Management Limited UK GBP 100% 100%Henderson Management SA Luxembourg USD 100% 100%Henderson UK Finance plc UK GBP 100% –HGI Group Limited UK GBP 100% 100%
The information disclosed in the table above is only in respect of those subsidiaries which principally affect the figures shown in the Group’s consolidated financial statements. There are a number of other subsidiaries which do not materially affect the Group’s results or net assets. Particulars of these subsidiaries have been omitted for simplification purposes.
Notes to the Financial Statements Group and Company continued

36Henderson Group Full Year Results 2011
14.2 Associates and joint ventures
The Group holds interests in the following associates and joint ventures:
Country of incorporation and principal
place of operation
Functional currency
Percentage owned 2011
Percentage owned 2010
Asia Real Estate Fund Management Limited Singapore SGD 50% 50%
Asia Real Estate Fund Management BVI
British Virgin Islands and Singapore USD 50% 50%
Attunga Capital Pty Limited Australia AUD 30% 30%Henderson-mfi Shopping Centre Verwaltungs GmbH Germany EUR 50% 50%HGI Immobilien GmbH Germany EUR 50% 50%New Star Canada Inc. Canada CAD – 50%Warburg-Henderson Kapitalanlagegesellschaft für Immobilien mbH Germany EUR 50% 50%
As a result of the Group’s sale of WorldInvest Management Ltd. (refer to note 33.2), the Group disposed of its investment in New Star Canada Inc. In addition, during the year the Group acquired and disposed of an interest in Hermes GPE LLP.
The Group’s share of net assets and share of net profits from associates and joint ventures is as follows:
2011 £m
2010 £m
Share of aggregate net assets 3.7 6.8Share of aggregate net profits for the year 0.7 2.0
15. Plant and equipment
Group
2011
£m2010
£m
CostAt 1 January 35.8 34.4Additions 1.4 1.1Acquisitions through business combinations 0.5 –Disposals (0.2) (0.1)Foreign exchange movement – 0.4At 31 December 37.5 35.8
DepreciationAt 1 January (14.6) (11.4)Charge (3.3) (3.2)Disposals 0.1 –At 31 December (17.8) (14.6)Net book value at 31 December 19.7 21.2
Included in cost as at 31 December 2011 were fully depreciated assets amounting to £4.8m (2010: £2.8m).
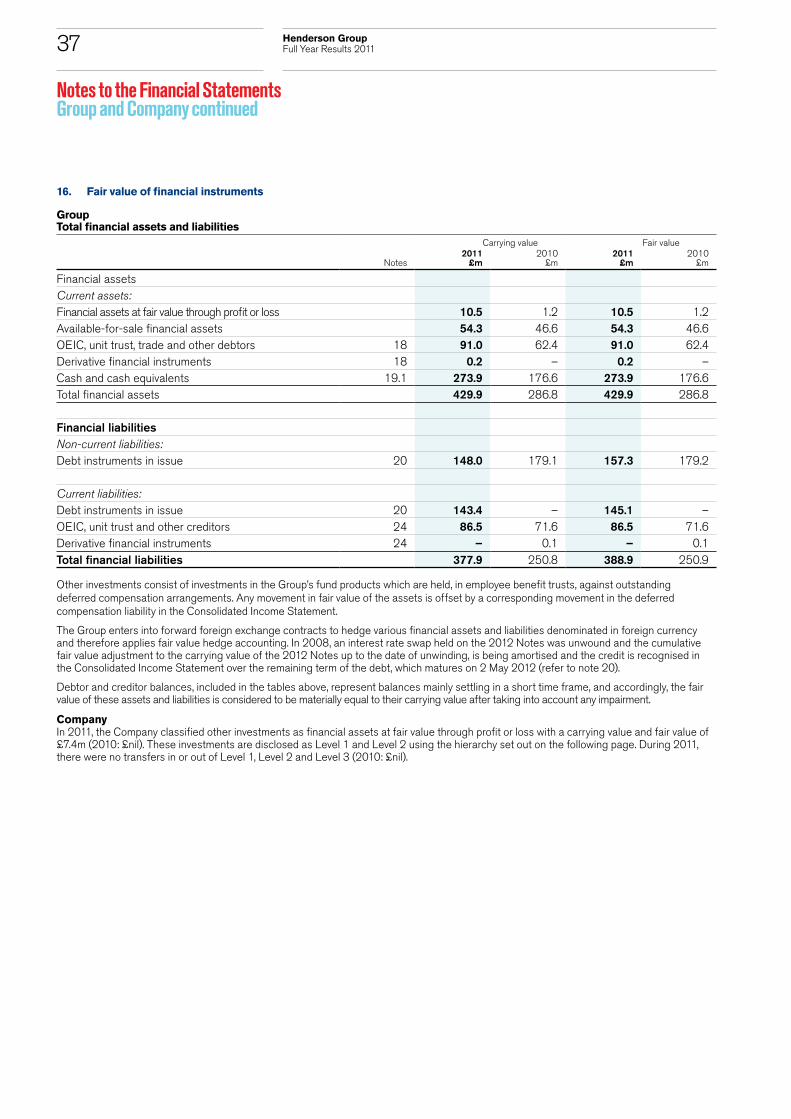
37 Henderson Group Full Year Results 2011
16. Fair value of financial instruments
GroupTotal financial assets and liabilities
Carrying value Fair value
Notes
2011 £m
2010 £m
2011 £m
2010 £m
Financial assetsCurrent assets:Financial assets at fair value through profit or loss 10.5 1.2 10.5 1.2Available-for-sale financial assets 54.3 46.6 54.3 46.6OEIC, unit trust, trade and other debtors 18 91.0 62.4 91.0 62.4Derivative financial instruments 18 0.2 – 0.2 –Cash and cash equivalents 19.1 273.9 176.6 273.9 176.6Total financial assets 429.9 286.8 429.9 286.8
Financial liabilitiesNon-current liabilities:Debt instruments in issue 20 148.0 179.1 157.3 179.2
Current liabilities:Debt instruments in issue 20 143.4 – 145.1 –OEIC, unit trust and other creditors 24 86.5 71.6 86.5 71.6Derivative financial instruments 24 – 0.1 – 0.1Total financial liabilities 377.9 250.8 388.9 250.9
Other investments consist of investments in the Group’s fund products which are held, in employee benefit trusts, against outstanding deferred compensation arrangements. Any movement in fair value of the assets is offset by a corresponding movement in the deferred compensation liability in the Consolidated Income Statement.
The Group enters into forward foreign exchange contracts to hedge various financial assets and liabilities denominated in foreign currency and therefore applies fair value hedge accounting. In 2008, an interest rate swap held on the 2012 Notes was unwound and the cumulative fair value adjustment to the carrying value of the 2012 Notes up to the date of unwinding, is being amortised and the credit is recognised in the Consolidated Income Statement over the remaining term of the debt, which matures on 2 May 2012 (refer to note 20).
Debtor and creditor balances, included in the tables above, represent balances mainly settling in a short time frame, and accordingly, the fair value of these assets and liabilities is considered to be materially equal to their carrying value after taking into account any impairment.
CompanyIn 2011, the Company classified other investments as financial assets at fair value through profit or loss with a carrying value and fair value of £7.4m (2010: £nil). These investments are disclosed as Level 1 and Level 2 using the hierarchy set out on the following page. During 2011, there were no transfers in or out of Level 1, Level 2 and Level 3 (2010: £nil).
Notes to the Financial Statements Group and Company continued

38Henderson Group Full Year Results 2011
Fair value hierarchy
The Group uses the following hierarchy for determining and disclosing the fair value of financial assets and liabilities by valuation technique:
Level 1: quoted (unadjusted) prices in active markets for identical assets or liabilities;
Level 2: other techniques where all inputs, which have a significant effect on the recorded fair value, are observable, either directly or indirectly; and
Level 3: techniques where inputs which have a significant effect on the recorded fair value that are not based on observable market data.
Note2011
£mLevel 1
£mLevel 2
£mLevel 3
£m
Financial assetsCurrent assets:Financial assets at fair value through profit or loss 10.5 8.5 2.0 –Available-for-sale financial assets 54.3 2.5 – 51.8Derivative financial instruments 18 0.2 0.2 – –Total financial assets 65.0 11.2 2.0 51.8
Note2010
£mLevel 1
£mLevel 2
£mLevel 3
£m
Financial assetsCurrent assets:Financial assets at fair value through profit or loss 1.2 1.2 – –Available-for-sale financial assets 46.6 3.1 3.1 40.4Total financial assets 47.8 4.3 3.1 40.4
Financial liabilitiesCurrent liabilities:Derivative financial instruments 24 0.1 0.1 – –Total financial liabilities 0.1 0.1 – –
During 2011, there were no transfers in or out of Level 1, Level 2 and Level 3 (2010: £nil).
The following is a reconciliation of the movements in the Group’s financial assets classified as Level 3 during the year:
2011
£m2010
£m
Fair value at 1 January 40.4 39.2Additions 5.5 1.4Disposals – (1.1)Fair value movements recognised in the Consolidated Statement of Comprehensive Income 5.9 2.7Impairment recognised in the Consolidated Income Statement – (1.8)Fair value at 31 December 51.8 40.4
As the fair value measurement of the financial assets included in Level 3 is based on both observable and non-observable inputs, a change in one or more underlying assumptions could result in a significant change in fair value. However, due to the numerous different factors affecting the assets, the impact cannot be quantified.

39 Henderson Group Full Year Results 2011
17. Deferred acquisition and commission costs
Group
2011 £m
2010 £m
At 1 January 113.6 77.0Costs and commissions capitalised 118.9 86.4Amortisation charge (77.8) (49.9)Foreign exchange movement – 0.1At 31 December 154.7 113.6
Non-current 71.4 58.3Current 83.3 55.3At 31 December 154.7 113.6
18. Trade and other receivables
Group Company2011
£m2010
£m2011
£m2010
£m
OEIC and unit trust debtors 62.7 42.1 – –Derivative financial instruments 0.2 – – –Trade debtors 13.1 8.2 – –Accrued income 70.0 71.9 – –Other debtors 15.2 12.1 – –Prepayments 7.1 7.3 – –Amounts owed by subsidiaries – – 1.6 0.1
168.3 141.6 1.6 0.1
19. Cash and cash equivalents 19.1 Cash and cash equivalents
Group Company2011
£m2010
£m2011
£m2010
£m
Cash at bank and in hand 170.4 48.7 0.1 0.1Cash equivalents 103.5 127.9 – –Cash and cash equivalents 273.9 176.6 0.1 0.1
Cash and cash equivalents consist of cash in hand, cash at bank and short-term highly liquid government securities or investments in money market instruments with a maturity date of three months or less.
Included within cash and cash equivalents as at 31 December 2011 is £4.7m (2010: £5.0m) of restricted cash. Restricted amounts represent £4.7m (2010: £4.7m) held in escrow for HGPS and £nil (2010: £0.3m) of funds held in employee benefit trusts. In addition, as at 31 December 2011 £4.6m (2010: £17.4m) of cash at bank and in hand was held in the Group’s manager dealing accounts which represent payments due to and from OEIC and units trusts as a result of client trading.
19.2 Changes in operating assets and liabilities
Group Company2011
£m2010
£m2011
£m2010
£m
Change in OEICs and unit trust debtors and creditors (23.4) 3.8 – –Increase in gross deferred acquisition and commission costs (118.9) (86.4) – –Decrease/(increase) in other assets 11.2 (0.3) (7.6) 12.3Increase in gross deferred income 127.0 88.2 – –(Decrease)/increase in provisions and other liabilities (6.9) 11.2 87.9 1.4Increase in investment in subsidiaries – – (54.0) –Changes in operating assets and liabilities (11.0) 16.5 26.3 13.7
Notes to the Financial Statements Group and Company continued
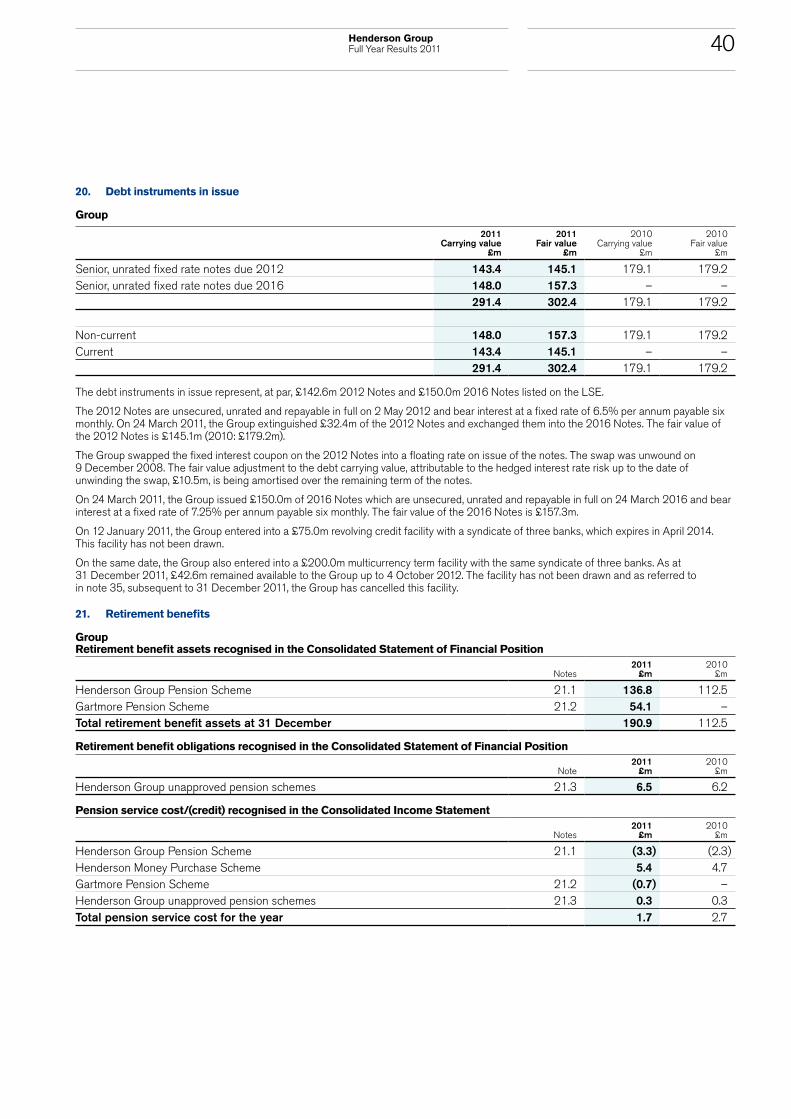
40Henderson Group Full Year Results 2011
20. Debt instruments in issue
Group
2011 Carrying value
£m
2011 Fair value
£m
2010 Carrying value
£m
2010 Fair value
£m
Senior, unrated fixed rate notes due 2012 143.4 145.1 179.1 179.2Senior, unrated fixed rate notes due 2016 148.0 157.3 – –
291.4 302.4 179.1 179.2
Non-current 148.0 157.3 179.1 179.2Current 143.4 145.1 – –
291.4 302.4 179.1 179.2
The debt instruments in issue represent, at par, £142.6m 2012 Notes and £150.0m 2016 Notes listed on the LSE.
The 2012 Notes are unsecured, unrated and repayable in full on 2 May 2012 and bear interest at a fixed rate of 6.5% per annum payable six monthly. On 24 March 2011, the Group extinguished £32.4m of the 2012 Notes and exchanged them into the 2016 Notes. The fair value of the 2012 Notes is £145.1m (2010: £179.2m).
The Group swapped the fixed interest coupon on the 2012 Notes into a floating rate on issue of the notes. The swap was unwound on 9 December 2008. The fair value adjustment to the debt carrying value, attributable to the hedged interest rate risk up to the date of unwinding the swap, £10.5m, is being amortised over the remaining term of the notes.
On 24 March 2011, the Group issued £150.0m of 2016 Notes which are unsecured, unrated and repayable in full on 24 March 2016 and bear interest at a fixed rate of 7.25% per annum payable six monthly. The fair value of the 2016 Notes is £157.3m.
On 12 January 2011, the Group entered into a £75.0m revolving credit facility with a syndicate of three banks, which expires in April 2014. This facility has not been drawn.
On the same date, the Group also entered into a £200.0m multicurrency term facility with the same syndicate of three banks. As at 31 December 2011, £42.6m remained available to the Group up to 4 October 2012. The facility has not been drawn and as referred to in note 35, subsequent to 31 December 2011, the Group has cancelled this facility.
21. Retirement benefits
GroupRetirement benefit assets recognised in the Consolidated Statement of Financial Position
Notes 2011
£m2010
£m
Henderson Group Pension Scheme 21.1 136.8 112.5Gartmore Pension Scheme 21.2 54.1 –Total retirement benefit assets at 31 December 190.9 112.5
Retirement benefit obligations recognised in the Consolidated Statement of Financial Position
Note2011
£m2010
£m
Henderson Group unapproved pension schemes 21.3 6.5 6.2
Pension service cost/(credit) recognised in the Consolidated Income Statement
Notes2011
£m2010
£m
Henderson Group Pension Scheme 21.1 (3.3) (2.3)Henderson Money Purchase Scheme 5.4 4.7Gartmore Pension Scheme 21.2 (0.7) –Henderson Group unapproved pension schemes 21.3 0.3 0.3Total pension service cost for the year 1.7 2.7
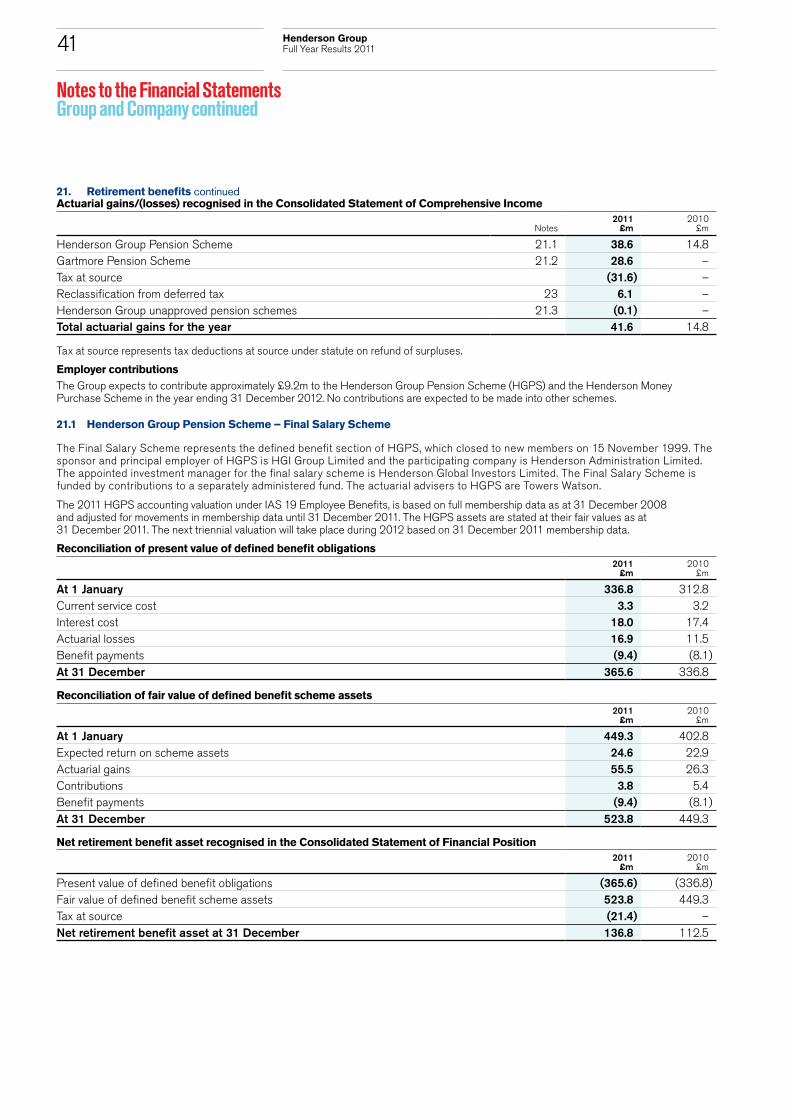
41 Henderson Group Full Year Results 2011
21. Retirement benefits continuedActuarial gains/(losses) recognised in the Consolidated Statement of Comprehensive Income
Notes 2011
£m2010
£m
Henderson Group Pension Scheme 21.1 38.6 14.8Gartmore Pension Scheme 21.2 28.6 –Tax at source (31.6) –Reclassification from deferred tax 23 6.1 –Henderson Group unapproved pension schemes 21.3 (0.1) –Total actuarial gains for the year 41.6 14.8
Tax at source represents tax deductions at source under statute on refund of surpluses.
Employer contributionsThe Group expects to contribute approximately £9.2m to the Henderson Group Pension Scheme (HGPS) and the Henderson Money Purchase Scheme in the year ending 31 December 2012. No contributions are expected to be made into other schemes.
21.1 Henderson Group Pension Scheme – Final Salary Scheme
The Final Salary Scheme represents the defined benefit section of HGPS, which closed to new members on 15 November 1999. The sponsor and principal employer of HGPS is HGI Group Limited and the participating company is Henderson Administration Limited. The appointed investment manager for the final salary scheme is Henderson Global Investors Limited. The Final Salary Scheme is funded by contributions to a separately administered fund. The actuarial advisers to HGPS are Towers Watson.
The 2011 HGPS accounting valuation under IAS 19 Employee Benefits, is based on full membership data as at 31 December 2008 and adjusted for movements in membership data until 31 December 2011. The HGPS assets are stated at their fair values as at 31 December 2011. The next triennial valuation will take place during 2012 based on 31 December 2011 membership data.
Reconciliation of present value of defined benefit obligations2011
£m2010
£m
At 1 January 336.8 312.8Current service cost 3.3 3.2Interest cost 18.0 17.4Actuarial losses 16.9 11.5Benefit payments (9.4) (8.1)At 31 December 365.6 336.8
Reconciliation of fair value of defined benefit scheme assets2011
£m2010
£m
At 1 January 449.3 402.8Expected return on scheme assets 24.6 22.9Actuarial gains 55.5 26.3Contributions 3.8 5.4Benefit payments (9.4) (8.1)At 31 December 523.8 449.3
Net retirement benefit asset recognised in the Consolidated Statement of Financial Position2011
£m2010
£m
Present value of defined benefit obligations (365.6) (336.8)Fair value of defined benefit scheme assets 523.8 449.3Tax at source (21.4) –Net retirement benefit asset at 31 December 136.8 112.5
Notes to the Financial Statements Group and Company continued

42Henderson Group Full Year Results 2011
Pension service credit recognised in the Consolidated Income Statement2011
£m2010
£m
Current service cost 3.3 3.2Interest cost 18.0 17.4Expected return on scheme assets (24.6) (22.9)Total pension service credit for the year (3.3) (2.3)
Actuarial gains recognised through the Consolidated Statement of Comprehensive Income2011
£m2010
£m
At 1 January 22.4 7.6Actuarial gains recognised in the Consolidated Statement of Comprehensive Income 38.6 14.8Tax at source (21.4) –At 31 December 39.6 22.4
Movements in net assets recognised in the Consolidated Statement of Financial Position2011
£m2010
£m
At 1 January 112.5 90.0Pension service credit recognised in the Consolidated Income Statement 3.3 2.3Contributions 3.8 5.4Actuarial gains recognised in the Consolidated Statement of Comprehensive Income 38.6 14.8Tax at source (21.4) –At 31 December 136.8 112.5
Pension scheme assetsThe major categories of assets in the final salary section of HGPS, were as follows:
Fair value of defined benefit scheme assets
Market value % as a total of assets Expected rate of return
2011 £m
2010 £m
2011 %
2010 %
2011 %
2010 %
Risk reducing portfolio 389.9 236.4 74 53 3.0 4.2Return seeking portfolio 130.5 199.1 25 44 6.3 7.2Cash portfolio 3.4 13.8 1 3 3.0 4.2Total 523.8 449.3 100 100 3.8 5.5
HGPS does not hold any investments in employer related companies.
The expected return on assets assumption is the weighted average of the expected returns from each of the portfolios as shown above. The expected rate of return on assets is based on long-term expectations as at 31 December 2011. The expected rate of return on bonds, constituting the risk reducing portfolio, has been set by reference to current market yields on long-dated government bonds. The rates of return for the equities, property and cash asset classes, constituting the return seeking and cash portfolios, have been based on the Group’s expectations of investment returns over the longer term.
Actual return on defined benefit scheme assets2011
£m2010
£m
Actual return on scheme assets 80.1 49.2

43 Henderson Group Full Year Results 2011
21. Retirement benefits continued21.1 Henderson Group Pension Scheme – Final Salary Scheme continued
Principal actuarial assumptions(a) Financial assumptions
2011 % per annum
2010 % per annum
Discount rate 4.9 5.4Expected rate of return on scheme assets 3.8 5.5Salary increases 2.5 2.5Pension increases:– where liability is the Retail Price Index (RPI) capped at 5% per annum 3.1 3.4– where liability is the RPI capped at 2.5% per annum 2.2 2.3– where liability is fixed At fixed
rateAt fixed
rateInflation (RPI) 3.2 3.6Inflation (CPI) 2.5 n/a
On 8 July 2010, the UK Government announced its intention that statutory minimum pension indexation for private sector UK pension schemes would, in future, be linked to the Consumer Price Index (CPI) rather than RPI. This was enacted in April 2011 and as a result in 2011, the Group has moved from RPI to CPI as the basis for revaluation of certain obligations.
(b) Demographic assumptionsThe demographic assumptions used as at 31 December 2011 are consistent with those underlying the last actuarial valuation of HGPS in 2008. Post-retirement mortality assumptions follow 100% of the SAPS ‘S1 Light’ tables and improvements from 2002 in line with the ‘medium cohort’ projections with an underpin of 1% per annum. The table below illustrates the implied life expectancies as at 31 December 2011 using this mortality assumption:
Male no. of years
Female no. of years
Life expectancy for a member who is currently 60 28.0 29.5Life expectancy at 60 for a member who is currently 45 29.4 31.0
(c) Historical amounts2011
£m2010
£m2009
£m2008
£m2007
£m
Defined benefit obligations (365.6) (336.8) (312.8) (251.9) (282.4)Defined benefit scheme assets 523.8 449.3 402.8 404.4 344.7Surplus in the scheme before tax at source 158.2 112.5 90.0 152.5 62.3
Experience (losses)/gains on scheme liabilities (2.2) (0.9) 12.1 (1.2) (0.5)Experience gains/(losses) on scheme assets 55.5 26.3 (18.5) 20.6 1.2Net experience gains/(losses) 53.3 25.4 (6.4) 19.4 0.7
21.2 Gartmore Pension Scheme – Final Salary Scheme
As part of the acquisition of Gartmore in April 2011, the Group acquired the assets and liabilities of the Gartmore Pension Scheme (GPS). GPS was closed to new entrants and future accrual for existing members in 2006. The sponsor and participating company is Gartmore Investment Management Limited. The actuarial advisors to GPS are Lane Clark & Peacock LLP.
The 2011 GPS accounting valuation under IAS 19, Employee Benefits, is based on full membership data as at 31 December 2008 and adjusted for movements in membership data until 31 December 2011. The GPS assets are stated at their fair values as at 31 December 2011. The next triennial valuation will take place during 2012 based on 31 December 2011 membership data.
Reconciliation of present value of defined benefit obligations
2011 £m
Balance at acquisition 87.1Interest cost since acquisition 3.3Actuarial losses since acquisition 9.0Benefit payments since acquisition (2.7)At 31 December 96.7
Notes to the Financial Statements Group and Company continued
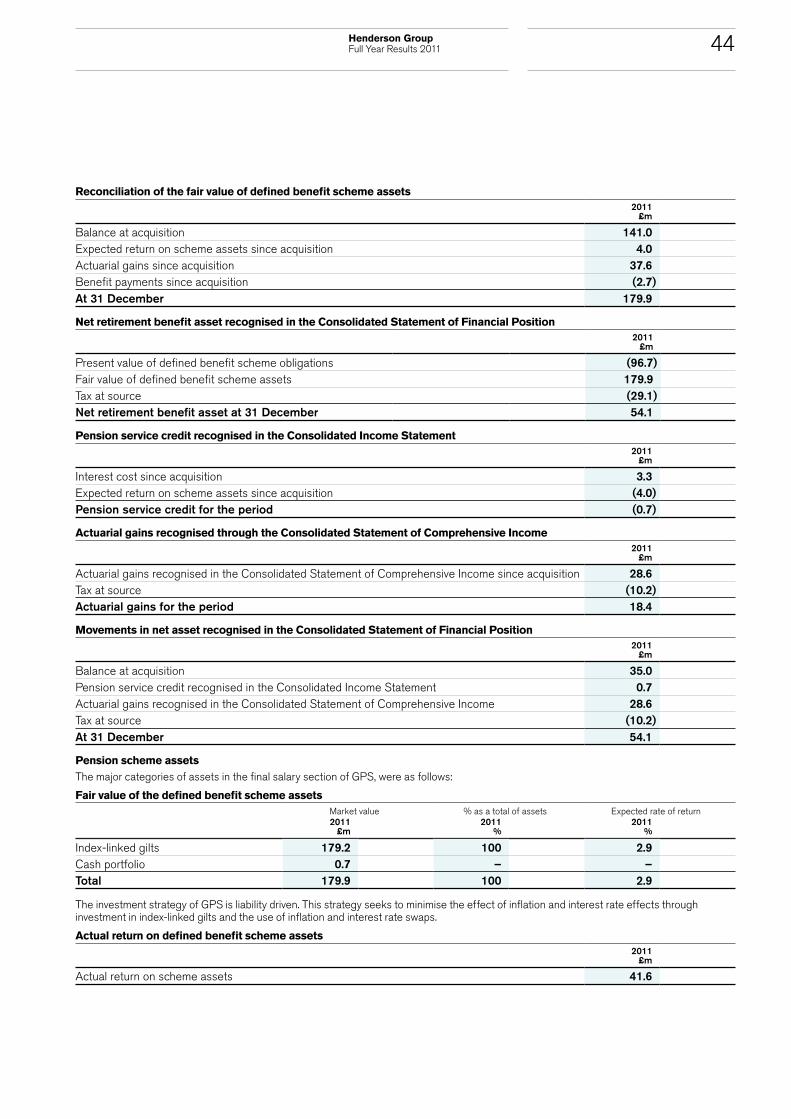
44Henderson Group Full Year Results 2011
Reconciliation of the fair value of defined benefit scheme assets2011
£m
Balance at acquisition 141.0Expected return on scheme assets since acquisition 4.0Actuarial gains since acquisition 37.6Benefit payments since acquisition (2.7)At 31 December 179.9
Net retirement benefit asset recognised in the Consolidated Statement of Financial Position2011
£m
Present value of defined benefit scheme obligations (96.7)Fair value of defined benefit scheme assets 179.9Tax at source (29.1)Net retirement benefit asset at 31 December 54.1
Pension service credit recognised in the Consolidated Income Statement2011
£m
Interest cost since acquisition 3.3Expected return on scheme assets since acquisition (4.0)Pension service credit for the period (0.7)
Actuarial gains recognised through the Consolidated Statement of Comprehensive Income2011
£m
Actuarial gains recognised in the Consolidated Statement of Comprehensive Income since acquisition 28.6Tax at source (10.2)Actuarial gains for the period 18.4
Movements in net asset recognised in the Consolidated Statement of Financial Position2011
£m
Balance at acquisition 35.0Pension service credit recognised in the Consolidated Income Statement 0.7Actuarial gains recognised in the Consolidated Statement of Comprehensive Income 28.6Tax at source (10.2)At 31 December 54.1
Pension scheme assetsThe major categories of assets in the final salary section of GPS, were as follows:
Fair value of the defined benefit scheme assetsMarket value % as a total of assets Expected rate of return2011
£m2011
%2011
%
Index-linked gilts 179.2 100 2.9Cash portfolio 0.7 – –Total 179.9 100 2.9
The investment strategy of GPS is liability driven. This strategy seeks to minimise the effect of inflation and interest rate effects through investment in index-linked gilts and the use of inflation and interest rate swaps.
Actual return on defined benefit scheme assets2011
£m
Actual return on scheme assets 41.6

45 Henderson Group Full Year Results 2011
21. Retirement benefits continued21.2 Gartmore Pension Scheme – Final Salary Scheme continued Principal actuarial assumptions(a) Financial assumptions
2011 % per annum
Discount rate 4.9Expected rate of return on scheme assets 2.9Pension increases 3.1Inflation 3.2
The expected rates of return on assets at 31 December 2011 have been determined as a weighted average of the expected returns for each asset class held by GPS at that date. GPS uses RPI as the basis for revaluation of certain obligations, in line with the trust deeds.
(b) Demographic assumptionsThe demographic assumptions used as at 31 December 2011 are consistent with those for HGPS. Post-retirement mortality assumptions follow 100% of the SAPS ‘S1 Light’ tables and improvements from 2002 in line with the ‘medium cohort’ projections with an underpin of 1% per annum. The table below illustrates the implied life expectancies as at 31 December 2011 using this mortality assumption:
Male no. of years
Female no. of years
Life expectancy for a member who is currently 60 28.0 29.5Life expectancy at 60 for a member who is currently 45 29.4 31.0
(c) Historical amounts
2011 £m
Defined benefit obligations (96.7)Defined benefit scheme assets 179.9Surplus in the scheme before tax at source 83.2
Experience losses on scheme liabilities (0.9)Experience gains on scheme assets 37.6Net experience gains 36.7
21.3 Henderson Group unapproved pension schemes
The Group operates three unapproved pension schemes, the details of which are provided below:
Pearl Executive Scheme. Members of this scheme are also members of HGPS. However, pensionable earnings under HGPS are limited to 1/60th for each year of service and the earnings cap. The Pearl Executive Scheme provides benefits at 1/30th for each year of service with a maximum of two thirds of salary after 20 years’ service based on pensionable earnings above the earnings cap, on an unfunded basis;
Henderson Top Up Scheme. Members of this scheme are also members of HGPS. However, pensionable earnings under HGPS are limited to the earnings cap, and the Henderson Top Up Scheme enables benefits to be based on pensionable earnings without restriction of the earnings cap. These additional uncapped benefits are provided on an unfunded basis; and there is also an unfunded liability in respect of one member, to whom the Group has made a contractual promise to pay a fixed pension from age 60.
Reconciliation of present value of defined benefit obligations2011
£m2010
£m
At 1 January 6.2 6.1Interest cost 0.3 0.3Actuarial losses 0.1 –Benefit payments (0.1) (0.2)At 31 December 6.5 6.2
Summary of defined benefit obligations at 31 December2011
£m2010
£m
Pearl Executive Scheme 5.3 5.1Henderson Top Up Scheme 1.0 0.9Individual contractual promise 0.2 0.2Total 6.5 6.2
Notes to the Financial Statements Group and Company continued

46Henderson Group Full Year Results 2011
Defined benefit obligations recognised in the Consolidated Statement of Financial Position2011
£m2010
£m
Present value of defined benefit obligations 6.5 6.2Fair value of defined benefit scheme assets – –Net benefit obligation at 31 December 6.5 6.2
Pension service cost recognised in the Consolidated Income Statement2011
£m2010
£m
Interest cost 0.3 0.3Pension service cost in the year 0.3 0.3
Actuarial losses recognised through the Consolidated Statement of Comprehensive Income2011
£m2010
£m
At 1 January 1.8 1.8Actuarial losses (0.1) –Actuarial losses 1.7 1.8
Movements in net obligation recognised in the Consolidated Statement of Financial Position2011
£m2010
£m
At 1 January 6.2 6.1Pension service cost recognised in the Consolidated Income Statement 0.3 0.3Actuarial losses recognised in the Consolidated Statement of Comprehensive Income 0.1 –Benefit payments (0.1) (0.2)At 31 December 6.5 6.2
Principal actuarial assumptions(a) Financial assumptions
2011 % per annum
2010 % per annum
Discount rate 4.9 5.4Salary increases n/a n/aPension increases:– where liability is the RPI 3.1 3.4– where liability is fixed At fixed rate At fixed rateInflation 3.2 3.6
(b) Demographic assumptionsThe demographic assumptions used as at 31 December 2011 are those underlying the last actuarial valuation of HGPS in 2008. Post-retirement mortality assumptions follow 100% of the SAPS ‘S1 Light’ tables and improvements from 2002 in line with the ‘medium cohort’ projections with an underpin of 1% per annum. The table below illustrates the implied life expectancies as at 31 December 2011 using this mortality assumption:
Male
no. of yearsFemale
no. of years
Life expectancy for a member who is currently 60 28.0 29.5Life expectancy at 60 for a member who is currently 45 29.4 31.0
(c) Historical amounts
2011 £m
2010 £m
2009 £m
2008 £m
2007 £m
Defined benefit obligations 6.5 6.2 6.1 4.7 5.2Defined benefit scheme assets – – – – –Deficit in the pension schemes 6.5 6.2 6.1 4.7 5.2Experience (losses)/gains on scheme liabilities – – – (0.1) 0.2

47 Henderson Group Full Year Results 2011
22. Provisions
GroupVoid
properties £m
Staff related
£m
FSCS interim levy£m
Other £m
Total £m
At 1 January 2011 16.2 3.9 7.6 25.0 52.7Additions 6.8 0.4 – 1.4 8.6Finance charge 2.1 – – – 2.1Provisions utilised (4.6) (0.3) (7.6) (4.5) (17.0)Provisions released (6.5) (0.5) – – (7.0)At 31 December 2011 14.0 3.5 – 21.9 39.4
Non-current 9.9 – – 8.8 18.7Current 4.1 3.5 – 13.1 20.7At 31 December 2011 14.0 3.5 – 21.9 39.4
Void propertiesThe void properties provision reflects the net present value of the excess of lease rentals and other payments on New Star and Gartmore properties, with onerous contracts, over the amounts expected to be recovered from subletting these properties. The discounting of expected cash flows will be unwound during the term of the underlying leases (maximum of 14 years) as a void property finance charge to the Consolidated Income Statement. During 2011, £6.5m was released in relation to a New Star property (refer to note 7).
Staff relatedStaff related provisions have been recognised in respect of a 2009 business restructuring and New Star and Gartmore staff legacy issues.
FSCS interim levyThe FSCS interim levy provision reflects the non-recurring charges raised in 2010 (refer to note 7).
OtherOther provisions relate to issues which have arisen as a result of litigation and obligations during the course of the Group’s business activities.
All provisions reflect the Group’s current estimates of amounts and timings.
Notes to the Financial Statements Group and Company continued
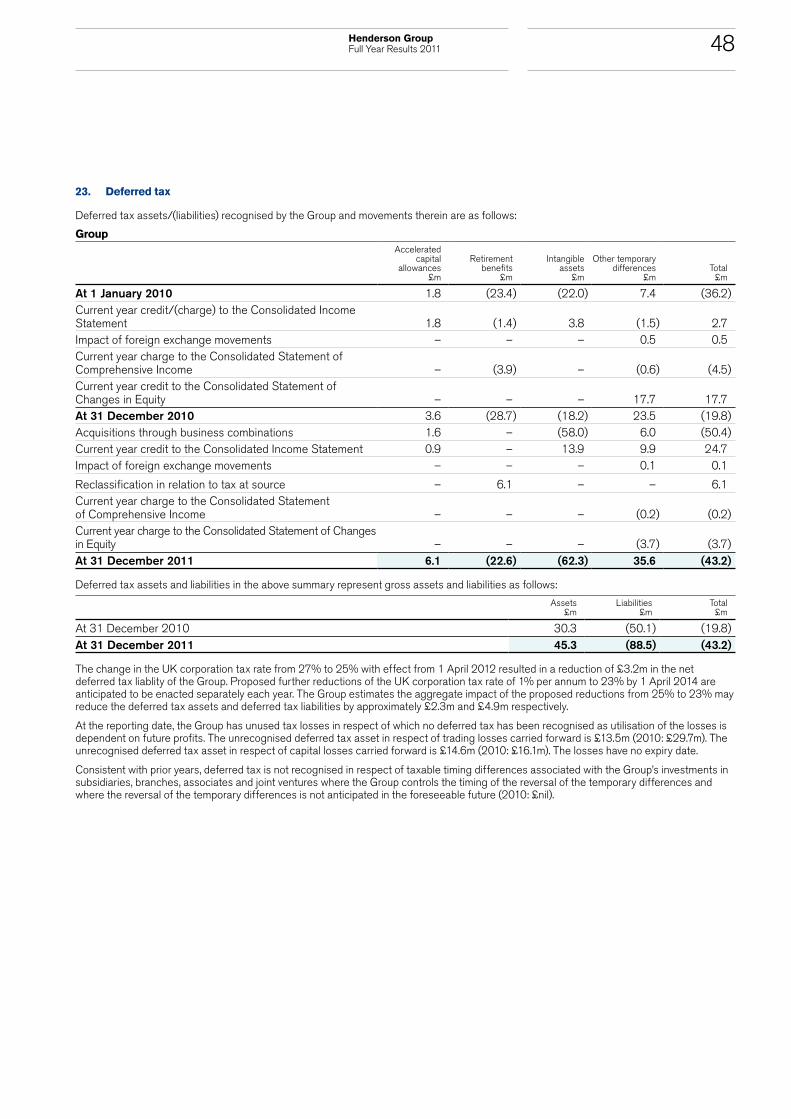
48Henderson Group Full Year Results 2011
23. Deferred tax
Deferred tax assets/(liabilities) recognised by the Group and movements therein are as follows:
Group
Accelerated capital
allowances £m
Retirement benefits
£m
Intangibleassets
£m
Other temporary differences
£mTotal
£m
At 1 January 2010 1.8 (23.4) (22.0) 7.4 (36.2)Current year credit/(charge) to the Consolidated Income Statement 1.8 (1.4) 3.8 (1.5) 2.7Impact of foreign exchange movements – – – 0.5 0.5Current year charge to the Consolidated Statement of Comprehensive Income – (3.9) – (0.6) (4.5)Current year credit to the Consolidated Statement of Changes in Equity – – – 17.7 17.7At 31 December 2010 3.6 (28.7) (18.2) 23.5 (19.8)Acquisitions through business combinations 1.6 – (58.0) 6.0 (50.4)Current year credit to the Consolidated Income Statement 0.9 – 13.9 9.9 24.7Impact of foreign exchange movements – – – 0.1 0.1
Reclassification in relation to tax at source – 6.1 – – 6.1Current year charge to the Consolidated Statement of Comprehensive Income – – – (0.2) (0.2)Current year charge to the Consolidated Statement of Changes in Equity – – – (3.7) (3.7)At 31 December 2011 6.1 (22.6) (62.3) 35.6 (43.2)
Deferred tax assets and liabilities in the above summary represent gross assets and liabilities as follows:
Assets
£mLiabilities
£mTotal
£m
At 31 December 2010 30.3 (50.1) (19.8)At 31 December 2011 45.3 (88.5) (43.2)
The change in the UK corporation tax rate from 27% to 25% with effect from 1 April 2012 resulted in a reduction of £3.2m in the net deferred tax liablity of the Group. Proposed further reductions of the UK corporation tax rate of 1% per annum to 23% by 1 April 2014 are anticipated to be enacted separately each year. The Group estimates the aggregate impact of the proposed reductions from 25% to 23% may reduce the deferred tax assets and deferred tax liabilities by approximately £2.3m and £4.9m respectively.
At the reporting date, the Group has unused tax losses in respect of which no deferred tax has been recognised as utilisation of the losses is dependent on future profits. The unrecognised deferred tax asset in respect of trading losses carried forward is £13.5m (2010: £29.7m). The unrecognised deferred tax asset in respect of capital losses carried forward is £14.6m (2010: £16.1m). The losses have no expiry date.
Consistent with prior years, deferred tax is not recognised in respect of taxable timing differences associated with the Group’s investments in subsidiaries, branches, associates and joint ventures where the Group controls the timing of the reversal of the temporary differences and where the reversal of the temporary differences is not anticipated in the foreseeable future (2010: £nil).
49 Henderson Group Full Year Results 2011
24. Trade and other payables
Group Company
2011 £m
2010 £m
2011 £m
2010 £m
OEIC and unit trust creditors 61.6 52.7 – –Derivative financial instruments – 0.1 – –Other creditors 24.9 18.9 – –Accruals 219.5 150.3 7.4 –Amounts owed to subsidiaries – – 83.8 3.3
At 31 December 2011 306.0 222.0 91.2 3.3
Non-current 2.7 – – –Current 303.3 222.0 91.2 3.3At 31 December 2011 306.0 222.0 91.2 3.3
25. Share capital 25.1 Authorised share capital
Group and Company
2011
£m2010
£m
2,194,910,776 ordinary shares of 12.5 pence each 274.4 243.7
On 22 March 2011, the authorised share capital of the Group increased from 1,949,910,776 to 2,194,910,776 by creating 245,000,000 shares. The purpose of this increase was to enable Group to allot shares in connection with the acquisition of Gartmore.
25.2 Allotted share capital
Allotted, called up and fully paid equity shares:
Shares in issue
Group and Company
no.
Group and Company
£m
At 1 January 2010 824,720,604 103.1Issue of shares for employee share schemes 9,097,897 1.1At 31 December 2010 833,818,501 104.2Issue of shares for Gartmore acquisition 242,639,403 30.3Issue of shares for employee share schemes 20,859,379 2.6Cash allotment 622,004 0.1At 31 December 2011 1,097,939,287 137.2
All of the ordinary shares in issue carry the same right to receive dividends and other distributions declared, made or paid by the Company.
The Directors consider shareholders’ equity to represent Group capital. The Directors manage the Group’s capital structure on an ongoing basis. Changes to the Group’s capital structure can be affected by adjusting the dividend policy, returning capital to shareholders or issuing new shares and other forms of capital.
Notes to the Financial Statements Group and Company continued

50Henderson Group Full Year Results 2011
26. Reserves
Nature and purpose of reservesThe Consolidated Statement of Changes in Equity and Company Statement of Changes in Equity on pages 14 and 17 respectively, provide details of movements in equity for the Group and Company.
Group and Company Share premiumShare premium records the difference between the nominal value of shares issued and the full value of the consideration received or the market price on the day of issue.
Group and Company Own shares heldTotal own shares held had a cost of £115.6m (2010: £52.4m) and a market value of £79.5m (2010: £59.4m) as at 31 December 2011 and constituted 7.1% (2010: 5.6%) of the Company’s issued share capital as at that date.
2011
no. of shares2010
no. of shares
Henderson Employee Trust 2000 4,663,385 19,433,557HHG plc Employee Trust 2004 1,635,000 373,079Henderson Employee Trust 2009 46,601,318 14,807,210Henderson Group plc Employee Trust 2009 21,312,091 12,129,575Gartmore Employee Trust 2,283,434 –ACS HR Solutions UK Limited (ACS) 1,123,966 119,978Henderson Employee Share Ownership Trust 942 –
77,620,136 46,863,399
The above trusts are used by the Group to operate the RSP, ESOP, LTIP, DEP, BAYE, ExSOP and CSOP share-based payment schemes.
Shares are distributed to employees as and when they vest, in line with the terms of each scheme, under the administration of the trustees.
ACS administers all of the above trusts.
Group Translation reserveThe translation reserve comprises differences on exchange arising from the translation of opening statements of financial position of subsidiaries, whose reporting currency is not GBP, and differences between the results of these subsidiaries translated at average rates for the reporting period and period end rates.
The translation reserve also includes unrealised foreign exchange gains and losses on available-for-sale financial assets which are not part of a designated hedge relationship. Upon disposal or impairment of these assets, amounts previously recognised in the translation reserve are reversed out and the cumulative amount of the gain or loss is recognised in the Consolidated Income Statement.
Group Revaluation reserveThe revaluation reserve comprises the amount of any unrealised gain or loss recognised in the Consolidated Statement of Comprehensive Income in relation to available-for-sale financial assets which are not part of a designated hedge relationship.
Upon disposal or impairment of these assets, amounts previously recognised in the revaluation reserve are reversed out and the cumulative amount of the gain or loss is recognised in the Consolidated Income Statement.
Group and Company Profit and loss reserveThe profit and loss reserve comprises:
• results recognised through the Consolidated Income Statement;
• dividend distributions;
• transactions relating to share-based payments; and
• actuarial gains and losses recognised through the Consolidated Statement of Comprehensive Income, net of tax.

51 Henderson Group Full Year Results 2011
27. Non-controlling interests
The Group has consolidated the following companies in which the following non-controlling interests are held by third parties:
2011 non-controlling
interest %
2010 non-controlling
interest%
2011 non-controlling
interest £m
2010 non-controlling
interest £m
HGI Immobilien Austria GmbH 35% 35% 0.4 0.4New Star Institutional Managers Limited – 75% – 1.5WorldInvest Management Ltd. – 75% – (1.4)At 31 December 0.4 0.5
On 1 July 2011, the Group disposed of its investment in WorldInvest Management Ltd. and NSIM.
28. Financial risk management
Financial risk management objectives and policiesFinancial assets principally comprise investments in equity securities, short-term investments, trade and other receivables, and cash and cash equivalents. Financial liabilities comprise borrowings for financing purposes, certain provisions and trade and other payables. The main risks arising from financial instruments are price risk, interest rate risk, liquidity risk, foreign currency risk and credit risk. Each of these risks is examined in detail below. The Group monitors financial risks on a consolidated basis and intra-Group balances are settled when it is deemed appropriate for both parties to the transaction. The Company is not exposed to material financial risk and separate disclosures for the Company have not been included.
The Group has designed a framework to manage the risks of its business and to ensure that the Directors have in place risk management practices appropriate for a listed company. The management of risk within the Group is governed by the Board and overseen by the Board Risk Committee.
28.1 Price risk
Price risk is the risk that a decline in the value of assets adversely impacts on the profitability of the Group.
The Group is exposed to price risk in respect of seed capital investments in Group funds (available-for-sale financial assets). Seed capital investments vary in duration, depending on the nature of the investment, with a typical range of less than one year for Investment Management products and between three and seven years for Private Equity and Property funds. The total market value of seed capital investments at 31 December 2011 was £54.3m (2010: £46.6m).
Management monitors exposures to price risk on an ongoing basis. Significant movements in investment values are monitored on a daily basis. Where appropriate, management will hedge price risk. At 31 December 2011, investments with a carrying value of £1.4m (2010: £2.9m) were hedged against price risk through the use of contracts for difference (CFDs).
A fall in the value of an investment which is prolonged or significant is considered to be objective evidence of impairment under IAS 39 Financial Instruments: Recognition and Measurement. In such an event, an investment is written down to its fair value and cumulative amounts previously recognised in equity, in respect of market value and unhedged foreign exchange movements on the investment, are recognised in the Consolidated Income Statement as an impairment charge.
Price risk sensitivity analysis on available-for-sale financial assets
2011 2010
Consolidated Income
Statement £m
Consolidated Statement of
Comprehensive Income
£m
Consolidated Income
Statement £m
Consolidated Statement of
Comprehensive Income
£m
Market value movement +/- 10% – 5.2 – 4.4
Notes to the Financial Statements Group and Company continued
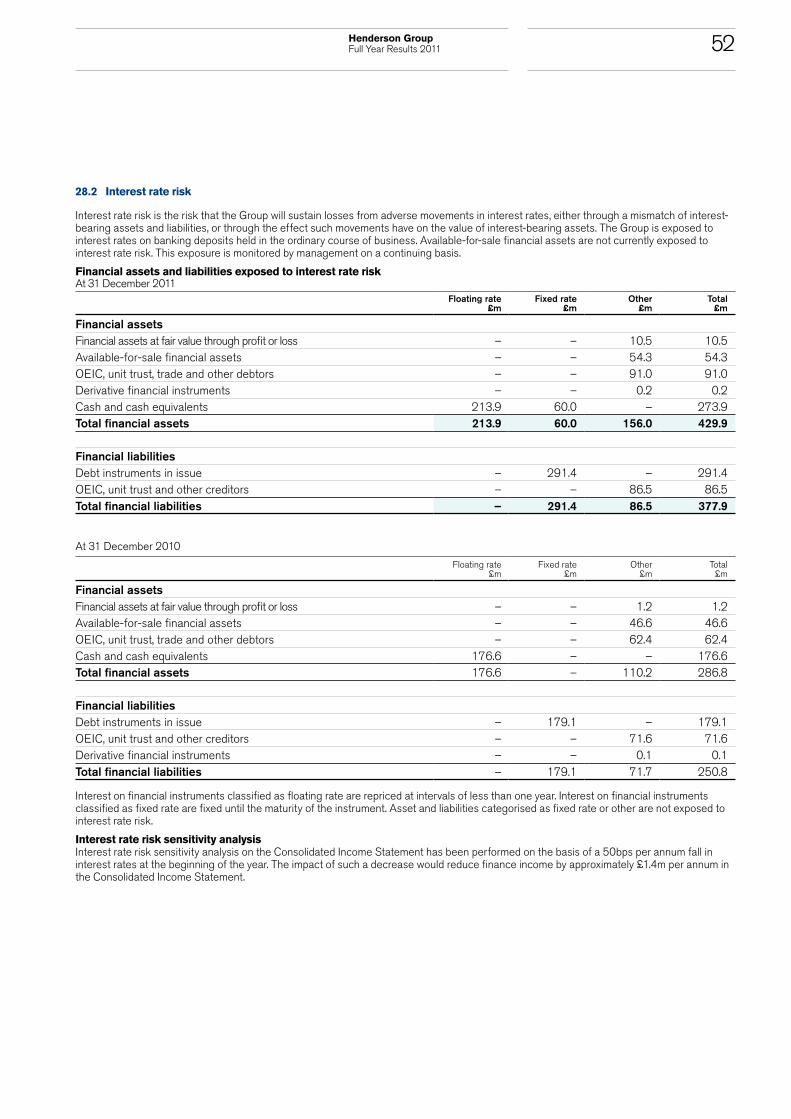
52Henderson Group Full Year Results 2011
28.2 Interest rate risk
Interest rate risk is the risk that the Group will sustain losses from adverse movements in interest rates, either through a mismatch of interest-bearing assets and liabilities, or through the effect such movements have on the value of interest-bearing assets. The Group is exposed to interest rates on banking deposits held in the ordinary course of business. Available-for-sale financial assets are not currently exposed to interest rate risk. This exposure is monitored by management on a continuing basis.
Financial assets and liabilities exposed to interest rate riskAt 31 December 2011
Floating rate £m
Fixed rate £m
Other £m
Total £m
Financial assetsFinancial assets at fair value through profit or loss – – 10.5 10.5Available-for-sale financial assets – – 54.3 54.3OEIC, unit trust, trade and other debtors – – 91.0 91.0Derivative financial instruments – – 0.2 0.2Cash and cash equivalents 213.9 60.0 – 273.9Total financial assets 213.9 60.0 156.0 429.9
Financial liabilitiesDebt instruments in issue – 291.4 – 291.4OEIC, unit trust and other creditors – – 86.5 86.5Total financial liabilities – 291.4 86.5 377.9
At 31 December 2010
Floating rate £m
Fixed rate £m
Other £m
Total £m
Financial assetsFinancial assets at fair value through profit or loss – – 1.2 1.2Available-for-sale financial assets – – 46.6 46.6OEIC, unit trust, trade and other debtors – – 62.4 62.4Cash and cash equivalents 176.6 – – 176.6Total financial assets 176.6 – 110.2 286.8
Financial liabilitiesDebt instruments in issue – 179.1 – 179.1OEIC, unit trust and other creditors – – 71.6 71.6Derivative financial instruments – – 0.1 0.1Total financial liabilities – 179.1 71.7 250.8
Interest on financial instruments classified as floating rate are repriced at intervals of less than one year. Interest on financial instruments classified as fixed rate are fixed until the maturity of the instrument. Asset and liabilities categorised as fixed rate or other are not exposed to interest rate risk.
Interest rate risk sensitivity analysisInterest rate risk sensitivity analysis on the Consolidated Income Statement has been performed on the basis of a 50bps per annum fall in interest rates at the beginning of the year. The impact of such a decrease would reduce finance income by approximately £1.4m per annum in the Consolidated Income Statement.

53 Henderson Group Full Year Results 2011
28. Financial risk management continued28.3 Liquidity risk
Liquidity risk is the risk that the Group may be unable to meet its payment obligations as they fall due.
Group liquidity is managed on a daily basis by Group Finance, to ensure that the Group always has sufficient cash or highly liquid assets available to meet its liabilities. Group Finance also controls and monitors the use of the Group’s non-operating capital resources. It is the Group’s policy to ensure that it has access to funds to cover all forecast commitments for at least the next 12 months.
The maturity dates of the Group’s financial liabilities and obligations are as follows:
At 31 December 2011
Within 1 year or repayable on demand
£m
Within 2-5 years
£mTotal
£m
Carrying value in the
Consolidated Statement of
Financial Position
£m
Debt instrument in issue (including interest) 158.1 188.1 346.2 291.4OEIC, unit trust and other creditors 83.8 2.7 86.5 86.5 241.9 190.8 432.7 377.9
At 31 December 2010
Within 1 year or repayable on demand
£m
Within 2-5 years
£mTotal
£m
Carrying value in the
Consolidated Statement of
Financial Position
£m
Debt instrument in issue (including interest) 11.4 180.6 192.0 179.1OEIC, unit trust and other creditors 71.6 – 71.6 71.6Derivative financial instruments 0.1 – 0.1 0.1 83.1 180.6 263.7 250.8
28.4 Foreign currency risk
Foreign currency risk is the risk that the Group will sustain losses through adverse movements in currency exchange rates.
The Group is exposed to foreign currency risk through its exposure to non-GBP income, expenses, assets and liabilities of its overseas subsidiaries as well as net assets and liabilities denominated in a currency other than GBP. The currency exposure is managed by closely monitoring foreign currency positions. The Group also uses foreign currency contracts to reduce or eliminate the currency exposure on certain individual transactions. The Group also seeks to use natural hedges to reduce exposure. Where there is a mismatch on material currency flows and the timing is reasonably certain, they are actively hedged. Where there is insufficient certainty, the currency is translated back into GBP on receipt. In addition, the Group carries a small foreign exchange position as principal, to facilitate the smooth conduct of its client business.
Foreign currency risk management is overseen by the Hedge Committee and hedge effectiveness is reported to the Board monthly.
A rolling programme of forward currency contracts has been implemented to hedge the currency exposures arising from certain available-for-sale financial assets, with a year end notional value of USD43.7m and EUR7.8m (2010: USD44.7m and EUR7.8m) (refer to note 28.6).
Foreign currency risk sensitivity analysisAvailable-for-sale financial assets are either denominated in GBP or hedged back to GBP using foreign currency forward contracts based on the Group’s hedging policy. However, there remain some available-for-sale financial assets which are not fully hedged as they fall below the policy level for implementing hedging arrangements. In addition, there are unhedged foreign currency cash balances and net trading receipts in subsidiaries of the Group.
Notes to the Financial Statements Group and Company continued

54Henderson Group Full Year Results 2011
The table below illustrates the impact of adjusting year end exchange rates on all unhedged financial assets and liabilities denominated in a currency other than GBP:
Foreign currency sensitivity analysis
2011 2010
Consolidated Income
Statement £m
Consolidated Statement of
ComprehensiveIncome
£m
Consolidated Income
Statement £m
Consolidated Statement of
Comprehensive Income
£m
US dollar +/- 10% 1.4 1.7 2.0 1.6Euro +/- 10% 0.4 2.4 3.4 3.3Australian dollar +/- 10% 0.4 0.1 0.4 0.3Chinese yuan +/- 10% 0.2 0.1 – –Japanese yen +/- 10% 0.3 0.7 – –Singaporean dollar +/- 10% 0.1 1.9 0.1 0.5Hong Kong dollar +/- 10% – – 0.2 –
28.5 Credit risk
Credit risk is the risk of a counterparty of the Group defaulting on funds deposited with it or the non-receipt of a trade debt.
The Group has an established credit policy to ensure that it only transacts with counterparties that are able to meet satisfactory rating requirements. Counterparty limits are reviewed and set centrally by the Credit Risk Committee. Management is responsible for ensuring that it remains within these limits and the risk management function monitors and reports any exceptions to policy. The Group has not suffered any losses as a result of trade debtor or counterparty defaults during the year.
The risk management function is also responsible for reporting credit exposures to the Board Risk Committee on a quarterly basis and for ensuring that any credit concerns are raised and actions taken to mitigate risks.
The table below contains an analysis of current and overdue financial assets:
At 31 December 2011
Not past due £m
0-3 months past due
£m
3-6 months past due
£m
6-12 months past due
£m
Greater than 12 months
past due £m
Total £m
Financial assetsFinancial assets at fair value through profit or loss 10.5 – – – – 10.5Available-for-sale financial assets 54.3 – – – – 54.3OEIC, unit trust, trade and other debtors 77.7 8.6 0.6 1.8 2.3 91.0Derivative financial instruments 0.2 – – – – 0.2Cash and cash equivalents 273.9 – – – – 273.9Total financial assets 416.6 8.6 0.6 1.8 2.3 429.9
At 31 December 2010
Not past due £m
0-3 months past due
£m
3-6 months past due
£m
6-12 months past due
£m
Greater than 12 months
past due £m
Total £m
Financial assetsFinancial assets at fair value through profit or loss 1.2 – – – – 1.2Available-for-sale financial assets 46.6 – – – – 46.6OEIC, unit trust, trade and other debtors 56.6 3.6 0.4 0.6 1.2 62.4Cash and cash equivalents 176.6 – – – – 176.6Total financial assets 281.0 3.6 0.4 0.6 1.2 286.8

55 Henderson Group Full Year Results 2011
28. Financial risk management continued28.5 Credit risk continued
The table below contains an analysis of financial assets as rated by Moody’s Investors Service:
At 31 December 2011
AAA £m
AA £m
A £m
Not rated £m
Total £m
Financial assetsFinancial assets at fair value through profit or loss – – – 10.5 10.5Available-for-sale financial assets – – – 54.3 54.3OEIC, unit trust, trade and other debtors – – – 91.0 91.0Derivative financial instruments – – – 0.2 0.2Cash and cash equivalents 97.8 71.0 105.0 0.1 273.9Total financial assets 97.8 71.0 105.0 156.1 429.9
At 31 December 2010
AAA £m
AA £m
A £m
Not rated £m
Total £m
Financial assetsFinancial assets at fair value through profit or loss – – – 1.2 1.2Available-for-sale financial assets – – – 46.6 46.6OEIC, unit trust, trade and other debtors – – – 62.4 62.4Cash and cash equivalents 107.7 58.6 10.3 – 176.6Total financial assets 107.7 58.6 10.3 110.2 286.8
28.6 Hedging activities
At 31 December 2011, the Group held CFDs to hedge the price risk arising from certain available-for-sale financial assets. These have been assessed as effective fair value hedges. The net realised and unrealised loss arising on these and other instruments entered into throughout the year amounted to £0.4m (2010: £0.4m) and has been offset in the Consolidated Income Statement by £0.4m (2010: £0.5m), being the net realised and unrealised gain on available-for-sale financial assets in designated hedging relationships during the year. At 31 December 2011, the fair value and notional amount of the CFDs was £nil (2010: £nil).
At 31 December 2011, the Group held forward exchange contracts to hedge the foreign currency risk arising from available-for-sale financial assets denominated in Euro and US dollars (refer to note 28.4).
These forward exchange contracts have been assessed as effective fair value hedges. The net realised and unrealised loss arising on these and other instruments entered into throughout the year amounted to £0.4m (2010: £0.7m) and has been offset in the Consolidated Income Statement by £0.4m (2010: £0.6m), being the net realised and unrealised foreign exchange gain on available-for-sale financial assets in designated hedging relationships during the year. The fair value of these hedges is set out in the table below:
2011 2010Notional amount
£mAssets
£mLiabilities
£m
Notional amount
£mAssets
£mLiabilities
£m
Fair value hedgesDerivative contracts at fair value 36.8 0.2 – 35.1 – 0.1
Notes to the Financial Statements Group and Company continued
56Henderson Group Full Year Results 2011
29. Leases
Operating leasesThe Group is party to four material property leases. A 20.5 year operating lease was entered into during 2008 on 201 Bishopsgate, London which provides for reviews to open market rent on every fifth anniversary of the lease and provided an initial rent-free period of 30 months. The rental expense on this lease is being recognised on a straight-line basis over the lease period.
On acquisition of New Star and Gartmore, the Group became party to three further material operating leases. These are in relation to 1 Knightsbridge Green, London, 8 Lancelot Place, London and Rex House, Queen Street, London. At the reporting date, the leases run for a period of five, 11 and 14 years respectively. A void properties provision has been recognised for these leases at the net present value of the net expected future cash outflows (refer to note 22).
The future minimum lease payments under the four non-cancellable operating leases fall due as follows:
2011
£m2010
£m
Within one year 14.8 12.0In two to five years inclusive 58.4 48.2After five years 115.9 98.8Total 189.1 159.0
The total future minimum sublease payments expected to be received under non-cancellable subleases within one year at the reporting date were £3.9m (2010: £2.7m).
30. Capital commitments
Group and CompanyThe amounts of capital expenditure contracted for but not provided for in the financial statements at 31 December 2011 amounted to £nil (2010: £nil).
31. Related party transactions
CompanyDetails of transactions between the Company and its controlled entities, which are related parties, together with amounts due from and to these related parties at the reporting date, are disclosed below:
2011
£m2010
£m
Transactions with related parties during the yearInvestment in subsidiary companies 420.0 –Capital contributions to indirect subsidiary companies 41.1 15.8Funding from subsidiary companies (80.5) (13.0)
Amounts owed by/(to) related parties at 31 December Amounts owed by subsidiary companies 1.6 0.1Amounts owed to subsidiary companies (83.8) (3.3)
GroupDisclosures relating to investments accounted for using the equity method and Group pension schemes are covered under note 14.2 and 21 respectively. Transactions between the Company and its controlled subsidiaries and between controlled subsidiaries, which are related parties, have been eliminated on consolidation and are not disclosed in this note.
Compensation of key management personnel (including Directors)The aggregate annual remuneration of Code Staff, representing key management personnel, is disclosed below:
2011
£m2010
£m
Short-term employee benefits 12.1 11.6Post-employment benefits 0.4 0.4Share-based payments 7.7 8.0 20.2 20.0
The expense of deferred short term incentive awards is recognised in the Consolidated Income Statement over the period of deferral. As at 31 December 2011, £3.0m (2010: £2.7m) of deferred awards are to be recognised in future periods in respect of key management personnel.
As part of standard employee benefits available to all staff, the Group makes available interest free loans to staff to cover annual season ticket loans and cycle schemes. Loans provided to key management personnel during the year amounted to £7,208 (2010: £3,708) with repayments during the year of £3,208 (2010: £3,708). Loans outstanding at 31 December 2011 were £4,000 (2010: £nil).

57 Henderson Group Full Year Results 2011
32. Contingent liabilities
The following contingent liabilities existed or may exist at 31 December 2011:
• In the normal course of business, the Group is exposed to certain legal issues, which can involve litigation and arbitration, and may result in contingent liabilities;
• In the normal course of business, the Group enters into foreign exchange contracts for Group hedging purposes and for facilitating foreign currency transactions of its clients. Such contracts can give rise to contingent liabilities;
• Under the Towry Law UK sale agreement, normal tax-related warranties and indemnities given by the Group expire up to six years from the disposal date of 3 May 2006;
• Under the Implementation Agreement dated 6 July 2010 relating to the transfer of management responsibilities to Aviva Investors for the Henderson International Property Fund (Fund), the Group has provided indemnities for certain losses arising from any breach of the Group’s responsibilities whilst performing its functions in respect of the Fund and employment warranties for a period of two years after the date of the agreement and tax-related warranties for a period of six years from the date of the agreement. These indemnities are subject to certain exclusions and limitations, including a financial cap;
• Under the Facilitation Agreement dated 8 December 2010 relating to the proposed merger of the assets of HLAF into the Deutsche Managed Sterling Fund, the Group gave: (a) certain warranties relating to itself and HLAF; and (b) indemnities against certain losses arising from liabilities of HLAF existing prior to the effective date of the merger, certain warranted statements being untrue and any miscalculation of the net asset value of HLAF in the period prior to the effective date of the merger. These warranties and indemnities are subject to certain exclusions and limitations, including a financial cap. The warranties relating to taxation will expire on 28 February 2018 and all other warranties will expire on 28 February 2015; the indemnities will expire on 28 February 2017;
• Under the Share Purchase Agreement dated 13 May 2011 relating to the sale of the entire issued share capital of WorldInvest Management Ltd. to Connor, Clark & Lunn UK Limited, the Group gave: (a) warranties relating to WorldInvest Management Ltd.; and (b) an indemnity against losses suffered by Connor, Clark & Lunn UK Limited arising from prior acts, omissions, liabilities or obligations of New Star Institutional Managers Limited that do not relate to its business, that will expire on 1 July 2012. The warranties are subject to certain exclusions and limitations, including a financial cap;
• Under the Share Sale Agreement dated 1 November 2011 relating to the sale of the entire issued share capital of Gartmore JV Limited to Hermes Fund Managers Limited, the Group gave: (a) an indemnity against any liabilities of Gartmore JV Limited existing prior to, or arising as a result of, completion of the sale, subject to certain exceptions; and (b) warranties relating to Gartmore JV Limited that will expire on 30 June 2013. The indemnity and warranties are subject to certain exclusions and limitations, including a financial cap; and
• In December 2011, two subsidiaries of Henderson Group plc, Henderson Equity Partners GP Limited and Henderson Equity Partners Limited were served with legal proceedings, which allege breach of mandate and misrepresentation, by a majority of the investors in Henderson PFI Secondary Fund II L.P. The proceedings do not quantify the sums claimed and will be defended vigorously.
As at the date of approval of the 2011 financial statements, the Group and Company neither foresee nor have they been notified of any claims under outstanding warranties and indemnities from the above mentioned agreements other than those disclosed above.
Notes to the Financial Statements Group and Company continued
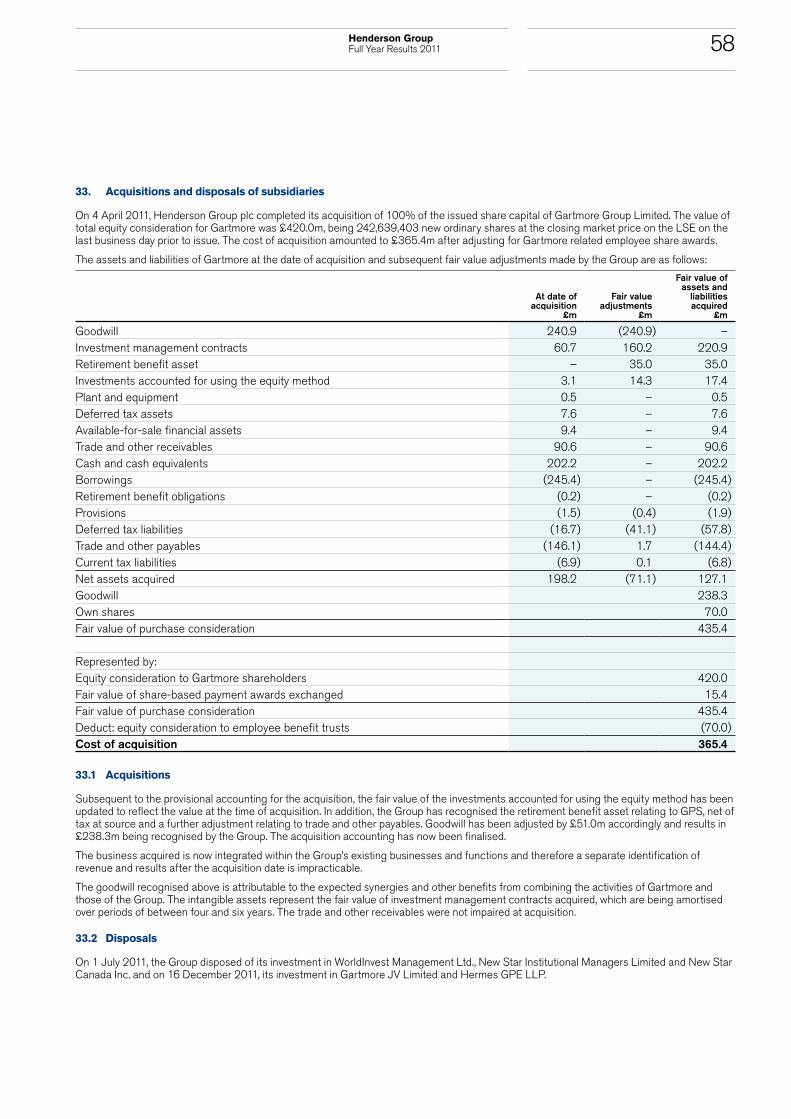
58Henderson Group Full Year Results 2011
33. Acquisitions and disposals of subsidiaries
On 4 April 2011, Henderson Group plc completed its acquisition of 100% of the issued share capital of Gartmore Group Limited. The value of total equity consideration for Gartmore was £420.0m, being 242,639,403 new ordinary shares at the closing market price on the LSE on the last business day prior to issue. The cost of acquisition amounted to £365.4m after adjusting for Gartmore related employee share awards.
The assets and liabilities of Gartmore at the date of acquisition and subsequent fair value adjustments made by the Group are as follows:
At date of acquisition
£m
Fair value adjustments
£m
Fair value of assets and
liabilities acquired
£m
Goodwill 240.9 (240.9) –Investment management contracts 60.7 160.2 220.9Retirement benefit asset – 35.0 35.0Investments accounted for using the equity method 3.1 14.3 17.4Plant and equipment 0.5 – 0.5Deferred tax assets 7.6 – 7.6Available-for-sale financial assets 9.4 – 9.4Trade and other receivables 90.6 – 90.6Cash and cash equivalents 202.2 – 202.2Borrowings (245.4) – (245.4)Retirement benefit obligations (0.2) – (0.2)Provisions (1.5) (0.4) (1.9)Deferred tax liabilities (16.7) (41.1) (57.8)Trade and other payables (146.1) 1.7 (144.4)Current tax liabilities (6.9) 0.1 (6.8)Net assets acquired 198.2 (71.1) 127.1Goodwill 238.3Own shares 70.0Fair value of purchase consideration 435.4
Represented by: Equity consideration to Gartmore shareholders 420.0Fair value of share-based payment awards exchanged 15.4Fair value of purchase consideration 435.4Deduct: equity consideration to employee benefit trusts (70.0)Cost of acquisition 365.4
33.1 Acquisitions
Subsequent to the provisional accounting for the acquisition, the fair value of the investments accounted for using the equity method has been updated to reflect the value at the time of acquisition. In addition, the Group has recognised the retirement benefit asset relating to GPS, net of tax at source and a further adjustment relating to trade and other payables. Goodwill has been adjusted by £51.0m accordingly and results in £238.3m being recognised by the Group. The acquisition accounting has now been finalised.
The business acquired is now integrated within the Group’s existing businesses and functions and therefore a separate identification of revenue and results after the acquisition date is impracticable.
The goodwill recognised above is attributable to the expected synergies and other benefits from combining the activities of Gartmore and those of the Group. The intangible assets represent the fair value of investment management contracts acquired, which are being amortised over periods of between four and six years. The trade and other receivables were not impaired at acquisition.
33.2 Disposals
On 1 July 2011, the Group disposed of its investment in WorldInvest Management Ltd., New Star Institutional Managers Limited and New Star Canada Inc. and on 16 December 2011, its investment in Gartmore JV Limited and Hermes GPE LLP.

59 Henderson Group Full Year Results 2011
34. Movements in controlled entities
As a result of the acquisition of Gartmore in April 2011, the Group gained control of the following entities during the period ended 31 December 2011:
Name of entity Date control gained over entity
Asset Management Holdings 4 April 2011Damian Securities Limited 4 April 2011G.I.L. Nominees Limited 4 April 2011Gartmore Capital Management Limited 4 April 2011Gartmore Cayman Islands Limited 4 April 2011Gartmore Delaware, Inc. 4 April 2011Gartmore Distribution Services, Inc. 4 April 2011Gartmore Fund Managers Limited 4 April 2011Gartmore General Partner LLC 4 April 2011Gartmore Global Partners 4 April 2011Gartmore Group Limited 4 April 2011Gartmore Investment Japan Limited 4 April 2011Gartmore Investment Limited 4 April 2011Gartmore Investment Management Limited 4 April 2011Gartmore Investment Services GmbH 4 April 2011Gartmore Investment Services Limited 4 April 2011Gartmore JV Limited 4 April 2011Gartmore Nominees Limited 4 April 2011Gartmore Pension Trustees Limited 4 April 2011Gartmore Securities Limited 4 April 2011Gartmore Services Limited 4 April 2011Gartmore US Holding Company, Inc. 4 April 2011Gartmore US Limited 4 April 2011Oxford Acquisition 0 Limited 4 April 2011Oxford Acquisition I Limited 4 April 2011Oxford Acquisition II Limited 4 April 2011Oxford Acquisition III Limited 4 April 2011Oxford Acquisition IV Limited 4 April 2011Oxford Acquisition V Limited 4 April 2011Oxford Acquisition VI 4 April 2011Oxford Acquisition VII Limited 4 April 2011Oxford Acquisition VIII 4 April 2011Oxford Acquisition IX Limited 4 April 2011Oxford Acquisition X Limited 4 April 2011Oxford US Acquisition, LLC 4 April 2011
The Group disposed of Gartmore JV Limited on 16 December 2011.
In addition, the Group acquired Attunga Capital (Singapore) Pte Ltd on 30 October 2011.
35. Events after the reporting date
The Board has not, as at 28 February 2012, being the date the financial statements were approved, received any information concerning significant conditions in existence at the reporting date, which have not been reflected in the financial statements as presented. The Board has, however, given due regard to the event described below which occurred after the reporting date.
On 3 February 2012, the Group cancelled the remaining £42.6m of its multicurrency term facility, refer to note 20.
Notes to the Financial Statements Group and Company continued

60Henderson Group Full Year Results 2011
The Directors are responsible for preparing the Annual Report and Accounts. The Directors are required to prepare financial statements in accordance with Jersey law which show a true and fair view in accordance with generally accepted accounting principles. The Directors have elected to prepare the Group and Company financial statements in accordance with IFRS.
IAS 1 Presentation of Financial Statements requires that financial statements present fairly for each financial year the Group’s and Company’s financial position, financial performance and cash flows. In preparing the Group and Company financial statements, the Directors are also required to:
• select suitable accounting policies in accordance with IAS 8 Accounting Policies, Changes in Accounting Estimates and Errors and then apply them consistently;
• present information, including accounting policies, in a manner that provides relevant, reliable, comparable and understandable information;
• provide additional disclosures when compliance with the specific requirements of IFRS is insufficient to enable users to understand the impact of particular transactions, other events and conditions on the Group’s and Company’s financial position and financial performance; and
• state that the Group and Company have complied with IFRS, subject to any material departures disclosed and explained in the financial statements.
The Directors are responsible for keeping proper accounting records which disclose with reasonable accuracy, at any time, the financial position of the Group, for safeguarding the assets, and for taking reasonable steps for the prevention and detection of fraud and other irregularities.
The Directors confirm that to the best of their knowledge:
• the financial statements have been prepared in accordance with IFRS and give a true and fair view of the assets, liabilities, financial position and profit or loss of the Group and Company for the year ended 31 December 2011;
• the Directors’ Report includes a fair review of the development and performance of the business and the position of the Group for the year ended 31 December 2011 and a description of the principal risks and uncertainties faced by the Group; and
• the accounting records have been properly maintained.
Signed in accordance with a resolution of the Directors:
Andrew Formica Shirley Garrood
Chief Executive Chief Financial Officer 28 February 2012 28 February 2012
Directors’ Responsibilities Statementin relation to the financial statements

61 Henderson Group Full Year Results 2011
Independent Auditors’ Report to the Members of Henderson Group plc
We have audited the Consolidated and Company financial statements of Henderson Group plc for the year ended 31 December 2011, which comprise the Consolidated Income Statement, the Consolidated Statement of Comprehensive Income, the Consolidated Statement of Financial Position, the Consolidated Statement of Changes in Equity, the Consolidated Statement of Cash Flows (the Group), the Company Income Statement, the Company Statement of Comprehensive Income, the Company Statement of Financial Position, the Company Statement of Changes in Equity, the Company Statement of Cash Flows and the related notes 1 to 35 (the financial statements). The financial reporting framework that has been applied in their preparation is applicable law and International Financial Reporting Standards (IFRS) as adopted by the European Union.
This report is made solely to the Company’s members, as a body, in accordance with Article 113A of the Companies (Jersey) Law 1991. Our audit work has been undertaken so that we might state to the Company’s members those matters we are required to state to them in an auditors’ report and for no other purpose. To the fullest extent permitted by law, we do not accept or assume responsibility to anyone other than the Company and the Company’s members as a body, for our audit work, for this report, or for the opinions we have formed.
Respective responsibilities of directors and auditors
As explained more fully in the Directors’ Responsibilities Statement set out on page 60, the Directors are responsible for the preparation of the financial statements and for being satisfied that they give a true and fair view. Our responsibility is to audit and express an opinion on the financial statements in accordance with applicable law and International Standards on Auditing (UK and Ireland). Those standards require us to comply with the Auditing Practices Board’s Ethical Standards for Auditors.
Scope of the audit of the financial statements
An audit involves obtaining evidence about the amounts and disclosures in the financial statements sufficient to give reasonable assurance that the financial statements are free from material misstatement, whether caused by fraud or error. This includes an assessment of: whether the accounting policies are appropriate to the Group and Company’s circumstances and have been consistently applied and adequately disclosed; the reasonableness of significant accounting estimates made by the Directors; and the overall presentation of the financial statements. In addition, we read all the financial and non-financial information in the annual report to identify material inconsistencies with the audited financial statements. If we become aware of any apparent material misstatements or inconsistencies we consider the implications for our report.
Opinion on financial statements
In our opinion the financial statements:
• give a true and fair view of the state of the Group’s and of the Company’s affairs as at 31 December 2011 and of the Group’s profit and the Company’s loss for the year then ended;
• have been properly prepared in accordance with International Financial Reporting Standards as adopted by the European Union; and
• have been prepared in accordance with the requirements of the Companies (Jersey) Law 1991.
Matters on which we are required to report by exception
We have nothing to report in respect of the following:
Under the Companies (Jersey) Law 1991 we are required to report to you if, in our opinion:
• proper accounting records have not been kept, or proper returns adequate for our audit have not been received from branches not visited by us; or
• the financial statements are not in agreement with the accounting records and returns; or
• we have not received all the information and explanations we require for our audit.
Under the Listing Rules we are required to review:
• the part of the Corporate Governance Statement relating to the Company’s compliance with the nine provisions of the UK Corporate Governance Code for our review.
Ratan Engineer for and on behalf of Ernst & Young LLP
London 28 February 2012

62Henderson Group Full Year Results 2011
2012 NotesSenior, unrated fixed rate notes due 2 May 2012
2016 NotesSenior, unrated fixed rate notes due 24 March 2016
AGMAnnual General Meeting
ASXAustralian Securities Exchange
AUMAssets under management
BAYEBuy As You Earn Share Plan
BoardThe board of directors of Henderson Group plc
bpsBasis points
Business ReviewThe business review is incorporated into and forms part of the Business Model, Directors’ Report, Chairman’s Statement, Chief Executive’s Review and Financial Review and Key Performance Indicators (including Risk Management)
CDIsCHESS Depositary Interests
CFDsContracts for difference
Code StaffEmployees who perform a significant influence function, senior management and risk takers whose professional activities could have a material impact on a firm’s risk profile
CompanyHenderson Group plc
compensation ratioEmployee compensation and benefits divided by total income
CROChief Risk Officer
CSOPCompany Share Option Plan
DEPDeferred Equity Plan
DirectorsThe directors of Henderson Group plc
EBTEmployee benefit trust
ESOPEmployee Share Ownership Plan
EUR/euroEuros
ExCoExecutive Committee
ExSOPExecutive Shared Ownership Plan
FRCFinancial Reporting Council
FSAThe UK Financial Services Authority
FSCSThe Financial Services Compensation Scheme
FXForeign exchange
GAAPGenerally Accepted Accounting Practice
GartmoreGartmore Group Limited and its controlled entities
Gartmore acquisitionThe acquisition of the entire share capital of Gartmore Group Limited
GBPPounds sterling
GPSGartmore Pension Scheme
GroupHenderson Group plc and its controlled entities
hedge fundsHedge funds including absolute return funds
Henderson Controlled entities of Henderson Group plc carrying out core investment management activities
HLAFHenderson Liquid Assets Fund
HMRCHM Revenue & Customs
HGPSHenderson Group Pension Scheme HRHuman Resources
IAS International Accounting Standard
IASBInternational Accounting Standard Board
IFRICInternational Financial Reporting Interpretations Committee
IFRSInternational Financial Reporting Standards as adopted by the European Union
IRRInternal rate of return
JPYJapanese yen
KPIKey Performance Indicator
LIBORLondon Inter-bank Offered Rate
LSELondon Stock Exchange
LTIPLong-Term Incentive Plan
New StarNew Star Asset Management Group PLC and its controlled entities
NSIMNew Star Institutional Managers Limited
OEICOpen-Ended Investment Company
operating marginTotal fee income less operating expenses divided by total fee income
PhoenixPhoenix Group Holdings previously known as Pearl Group Limited
RidgeWorthRidgeWorth Capital Management, Inc.
RSPRestricted Share Plan
SAYESharesave scheme
SGDSingaporean dollars
SICAVSociètè d’investissement á capital variable (collective investment scheme)
SRISustainable and Responsible Investment
TCFTreating Customers Fairly
Towry Law InternationalThe international division (now closed) of Towry Law plc
Towry Law UKTowry Law plc and its controlled entities, which were sold to JS&P Holdings Limited
TSRTotal shareholder return
UCITSUndertaking for Collective Investment in Transferable Securities
UK or United KingdomThe United Kingdom of Great Britain and Northern Ireland
UK Companies ActCompanies Act 2006
USUnited States of America
USD/dollarUnited States dollars
Glossary