Embed Size (px)
Citation preview

Full year resultsApril 2018

AgendaDebbie White
AgendaWhat has been accomplished
Mark Whiteling2017 income statementResults of the Contract review & Balance sheet review, Energy from WasteCashflow, net debt, bank facilities & pension
Debbie WhiteFirst impressionsBuilding a better Interserve – Four strategic prioritiesBusiness overviewsOutlook

What has been accomplished since October 2017
• Developed and commenced implementation • Defining each of the business’s strategies• Phase 1 completed, £15m impact in 2018• Phase 2 designed, delivery in 2018/19, total phase 1 & 2 £40m-£50m pa by
2020
• Developed comprehensive three year business plan• Conducted review of major contracts• Secured bridge financing in December 2017• Refinancing of the Group now complete
Secured financing
Initiated “Fit for Growth” programme
Stabilised the business
• 2017 performance inline with expectations• Established new management controls• Energy from waste progress• Interserve is fundamentally a sound business with significant potential for
improvement• Begun to strengthen the team
3

Mark Whiteling

Income statement£ million YE 2017 YE 2016* %
Consolidated revenue 3,250.8 3,244.6 0.2
Total operating profit 74.9 155.0 -51.7
Interest (22.5) (17.7)
Headline profit 52.4 137.3 -61.8
Exited business and non-underlying items (215.2) (201.5)
Amortisation & impairment of acquired goodwill and intangible assets
(81.6) (29.9)
Profit / (loss) before tax (244.4) (94.1) -159.7
Taxation (10.0) (7.5)
Profit / (loss) after tax (254.4) (101.6)
Minority interest (2.0) (2.1)*As adjusted
5

£ million 2017 2016*
Revenue TOP Margin Revenue TOP Margin
Support Services
-UK 1,715.2 38.9 2.4% 1,749.7 83.0 4.7%
-International 142.2 2.8 1.7% 211.9 9.4 3.6%
Construction
-International - 19.2 7.0% - 16.9 5.5%
-UK 1,048.2 (19.4) -1.9% 870.8 25.2 2.9%
Equipment Services 229.0 54.4 23.8% 224.1 48.6 21.7%
Group Services 10.7 (28.5) (40.6) (28.1)
PFI Disposal 12.3 7.5 7.5 2.9
3,157.6 74.9 2.4% 3,023.4 157.9 5.2%
£ million 2017 2016*
Revenue TOP Margin Revenue TOP Margin
Support Services
-UK 1,670.7 38.9 2.3% 1,694.7 80.1 4.7%
-International 142.2 2.8 1.7% 211.9 9.4 3.6%
Construction
-International - 19.2 7.0% - 16.9 5.5%
-UK 1,048.2 (19.4) -1.9% 870.8 25.2 2.9%
Equipment Services 229.0 54.4 23.8% 224.1 48.6 21.7%
Group Services 10.7 (28.5) (40.6) (28.1)
PFI Disposal 12.3 7.5 7.5 2.9
3,113.1 74.9 2.4% 2,968.4 155.00 5.2%
Non-underlying items 137.7 (299.7) 276.1 (231.4)
3,250.8 3,244.6*As adjustedAll results pre non-underlying items
Segmental analysis
6

Non-underlying items£m* 2017 2016
Contract review and balance sheet review 86.1 33.7
Energy from Waste 35.1 160.0
Goodwill impairment 60.0 -
Amortisation of acquired intangibles 21.6 29.9
Restructuring costs and adviser fees 47.1 -
Property development exit 26.0 -
Equipment Services strategic review 7.1 10.7
IT development cost impairment 16.7 -
Aggregate 299.7 234.3
£60m goodwill write-down taken in relation to Initial acquisition
Restructuring costs for Fit for Growth. Adviser fees for bank refinancing
Property development activities exited, impairment booked against asset carrying value
Final costs of the Equipment Services strategic review, aggregate cost as guided
IT development cost impairments relate to the write off of previously capitalised costs for projects now cancelled
7

Estimated future cash impact*of Non-Underlying items
£ million 2017 to date Future cash outflows
No material future cash
impacts
2018(<1 year)
2019-2022(2-5 years)
2022+(> 5years) Aggregate
Contract review and balance sheet review 52.7 10.7 19.1 3.6 86.1
Amortisation and goodwill impairment 81.6 81.6
Restructuring costs and adviser fees 34.7 4.7 7.7 47.1
Property development exit 26.0 26.0
Other 23.8 23.8
Aggregate 218.8 15.4 26.8 3.6 264.6
Majority of items non-cash or cash impact already felt by 31 December 2017
*Excludes EfWNumbers represent current best estimates
8

Contract review and balance sheet review
9
Judgements taken at the 2016 balance sheet date have been reassessed – balance sheet derisked
Contract review and balance sheet review undertaken using both PWC and internal resources. 125 contracts in total from across the business. Results examined by EY as part of their Independent Business review
Provisions and write-downs relate to 18 contract issues. As at 31 December 2017• 7 are operationally complete*• 9 are financially complete**• 2 are on-going
Aggregate charges of £86.1m in year
• £43.7m of provisions on loss making or onerous contracts – entirely relating to UK Support Services• £42.4m of WIP and receivables write downs - c80% relating to UK Construction
*Interserve has ceased to provide significant services to the client but final account negotiations have not concluded**Interserve has ceased to provide significant services to the client and final account negotiations have concluded

Energy from Waste – operations and cashflow
Anticipated completion
date*
Percentage completion**
Derby H1 2018 >90%
Dunbar H2 2018 >90%
Margam H1 2018 >95%
Rotherham H1 2018 >95%
Peterborough Completed 2015 Complete
Glasgow n/a n/a
*Defined as completion of construction activity by Interserve Construction Limited** Defined as %age of anticipated final costs incurred, as at Feb 2018
£35.1m in year charge, as highlighted in Oct 2017 trading update
Completion continues to progress to expected timelines
Derby – ROCs accreditation received from OFGEM
£95.9m net cash outflow in 2017
Significant, in excess of £20m, insurance receipts constituting partial payment on a number of claim items, received in Dec 2017
c£215m cumulative cash outflow contracts to end of 2017
2018 expected to be broadly cash neutral over the full year • H1 gross cash outflow offset
by H2 inflows from insurance and other recoveries
10

Gross operating cashflow2017 2016
EBITDA 116.0 194.0
Net capex (25.3) (39.0)
Gain on disposal of PPE (22.4) (16.0)
Dividends in excess / (deficit) of JV profits (8.3) 11.5
Working capital movement (46.8) 96.1
Other 6.9 7.3
Gross operating cashflow 20.1 253.9
Gain on disposal of PPE – a standard route to market for Equipment Services
Dividends below profits in the ME after strong 2016
• 100% EBIT: dividend conversion over 2016/17• Underlying performance good, aggregate ME debt & WIP days
broadly flat on 2016
Working capital reversal – year end working capital stretch not repeated.
• Significant EfW insurance receipt in Dec 2017• Further £33.3m of VAT and payroll creditors settled in Jan /
Feb 2018 • c£20m of early customer receipts (Jan 2018 monies received
Dec 2017)
11

Cashflow and change in Net Debt2017 2016
Gross operating cashflow 20.1 253.9
Energy from Waste (95.9) (116.9)
Non-underlying items (64.7) (17.8)
Pension, interest & tax (45.9) (48.5)
Investments in JVA (32.0) (9.8)
Dividends paid - (37.1)
FX & other (9.8) 10.6
Change in net debt (228.2) 34.4
Closing net debt (502.6) (274.4)
Non-underlying items
• £29.8m of restructuring and professional adviser costs
• £34.9m of costs related to issues identified in the Accounting review
Investments comprise equity injections into Derby Waste and Haymarket
FX and other
• Net of the disposal of our hedging instruments and the associated revaluation of our US private placement debt.
12

2017 net debt£m
2017 closing net debt (503)
Adjusted for
Time to pay (11)
Q4 VAT payment (23)
Advance customer receipts unwind (circa)
(20)
‘Rebased’ closing net debt
557
H2 2017 average* net debt
545
*Based on 6 month end balances
2017 closing net debt flattered by some significant items
• Settlement of £11m of Time to pay liability with HMRC in Jan / Feb 2018
• Timing of Q4 VAT payment settled 5 Jan 2018
• c£20m unwind of advance customer receipts (Jan 2018 payments received Dec 2017)
Rebased closing net debt broadly comparable to H2 2017 average net debt
Year end net debt £502.6m
Full year average net debt* £501.1m• H1 £457.3m, H2 £545.0m
Business running far too close to limits of aggregate available facilities
Significant creditor stretch at YE16 & HY17. Not repeated at YE17
Significant EfW insurance receipts, received in Dec 2017
No factoring or reverse factoring used
13
Refinancing
14
Summary of facilities• £834m of committed facilities• £249m of US PPN - $350m free floating• £585m of GBP facilities• All facilities expire Sep 2021• 10p / share warrants provided to debt
holders which if exercised, would provide the warrant holders with an interest of up to 20% of the post-issue share capital.
• Agreement with pension fund on 2018/2019 contributions
Financial Covenants• Absolute EBITDA• Absolute cashflow• Net debt to EBIDA• Interest cover• Minimum Net worth
Other covenants• Term loan step down £70m (2019), £60m (2020)• Gross debt < £450m by June 2020• Targets non-core disposals
Pricing• Old money LIBOR + 6.43% (3.43% PIK)• Old money US $ LIBOR + 7.61% (2.0% PIK)• New money – LIBOR +8.75% (5.5% PIK)
2018 Cashflow & Net debt
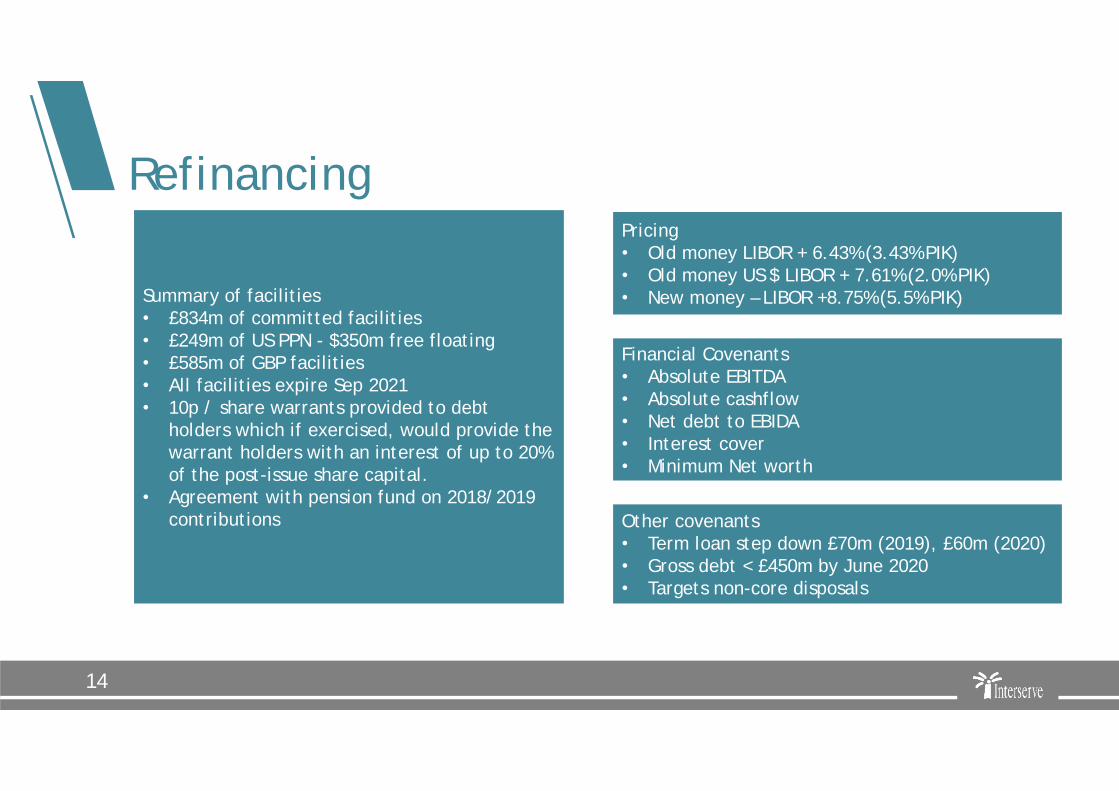
• Major outflows in H1• EFW £60m• Advisors £25m• Loss provisions £20m• Mobilisations £10m
• Inflows• Haymarket disposal (subject to timing) c£40m
• First Half net debt expected to be in the range of £650 -£680m
15

Debbie White

First Impressions
• Coherence of approach• Decision making dispersed • Lack of “train tracks”• Energy from Waste
• Disjointed systems and management processes• Limited visibility at Group level of operating performance• Inadequate review process
Visibility and transparency
Plan and Priorities
Organisation
• Federated, enormously inefficient• Committed people, strong values but no “one Interserve” mentality• Strong client relationships• Clarity on role of Group and business segments
17
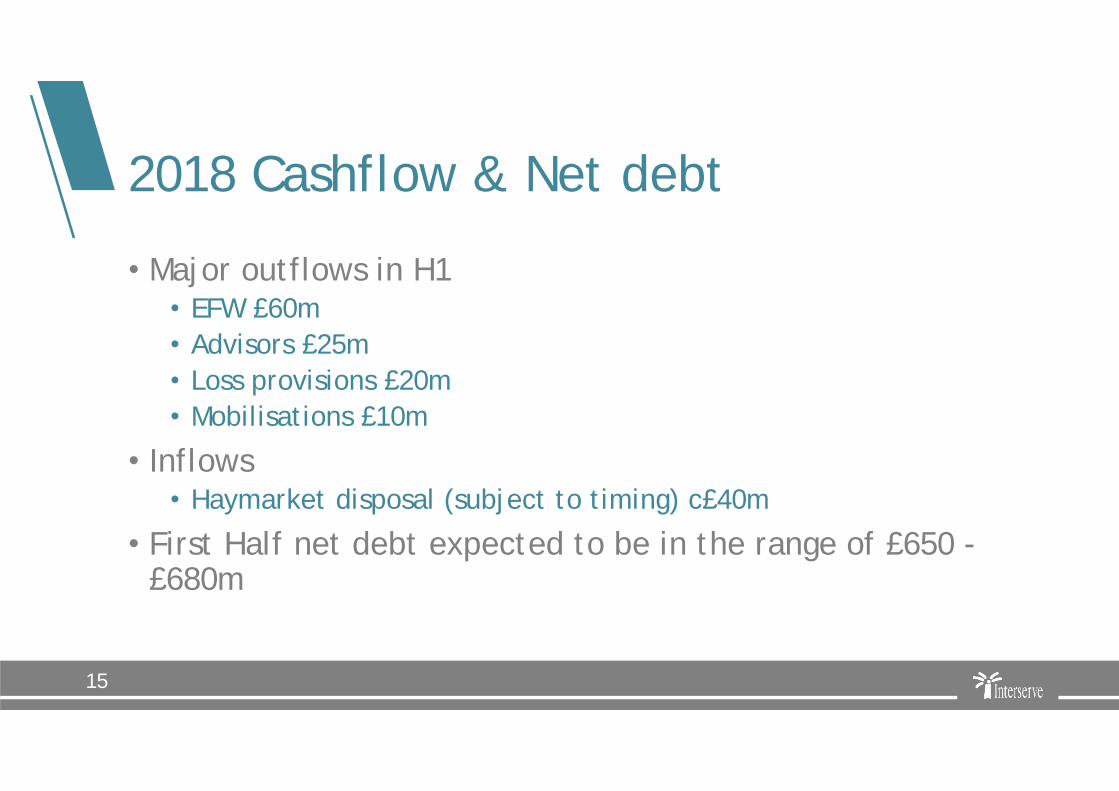
Building a better Interserve Four Strategic Priorities
• Simplified organisation• Leverage our scaleFit for Growth
• Reduced costs• A nimbler business• Improved purchasing
18
• Greater selectivity• Deploy depth and breadth of capability• Deeper client relationships
Competitive value propositions
• More effective in the market place• Disposals/managed exit of minor
non-core activities• Rigorous pipeline management
• Standard suite of products and services• Internal and customer-facing technology• Efficient and effective mobilisation and
project delivery
Operational delivery• Predictable results• Focused and selective IT
investments• Standard KPI’s
Deepening our core values and behaviours
• Standard approach to leadership, performance management, reward and recognition
• Deepening our core values and behaviours
“One Interserve” • Safe workplace• Motivated and engaged employees

Fit for Growth
• Stop all non-critical discretionary spend• Defer internal projects• First phase role eliminations• Strengthen management processes and
controls
Phase 1 2018 £15m pa benefit
19
• Implement programme governance • Fundamental organisation re-design• Centralise and leverage group purchasing
activities• Consolidate property portfolio• Design and implement Group shared
services
Phase 2 2020 £40-£50m pa benefit

Support Services
Background
Number of people48,500
Number of Clients2000
2017 RevenueUK: £1,715mInternational: £142m
Challenges
Market pressures Growth in indirect
cost leading to margin deterioration
Payment by results risk (CRC’s)
Way Forward
Standardised efficient services
Optimised organisation and clear governance
Rigorous process to improve selling
Operational discipline
Improve management data and systems
Positives
Strong client base Acceptable
operational delivery
Potential for work winning in key markets
20

Equipment Services
Background Challenges
Headwinds in some markets
Ensuring critical mass across individual countries
Way Forward
Maximise current business opportunities in existing markets
Improve cost efficiency through better process
Introduce new services (e.g. ground-shoring) in selected markets
Positives
Significant profit growth in recent years
Strong customer relationships and brand
Growing services portfolio
Top 3 market position in most markets
Number of people1,800
Number of Clients5,400
2017 Revenue£229m
21
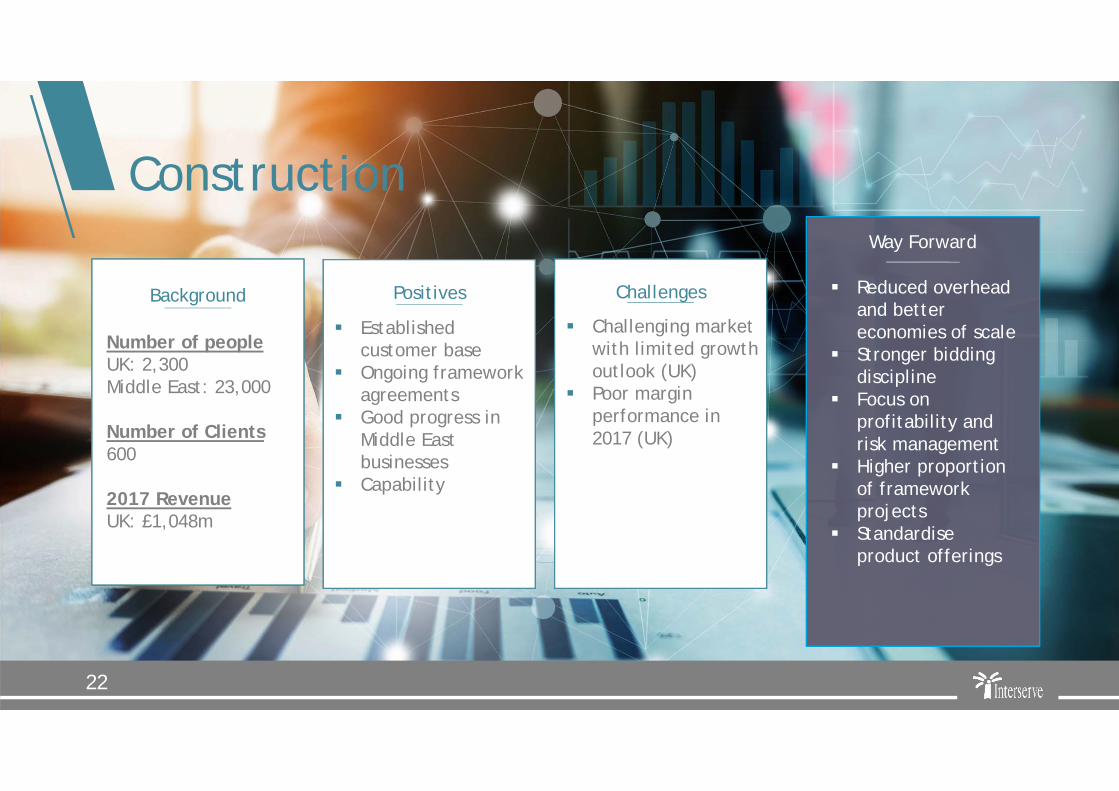
Construction
Background Challenges
Challenging market with limited growth outlook (UK)
Poor margin performance in 2017 (UK)
Way Forward
Reduced overhead and better economies of scale
Stronger bidding discipline
Focus on profitability and risk management
Higher proportion of framework projects
Standardise product offerings
Positives
Established customer base
Ongoing framework agreements
Good progress in Middle East businesses
Capability
Number of peopleUK: 2,300Middle East: 23,000
Number of Clients600
2017 RevenueUK: £1,048m
22

Current trading and outlook
First quarter trading in line with board’s expectations
Peak net debt in H1
Future workload stable at £7.8bn
Fit for Growth on track to deliver £15m benefit in 2018
23

Questions