Embed Size (px)
Citation preview
H & M Hennes & Mauritz AB
Full-year report
Full-year (1 December 2019 – 30 November 2020)
• The H&M group’s net sales amounted to SEK 187,031 m (232,755) in the 2020 financial year. In local currencies, net sales decreased by 18 percent. Sales development was significantly negatively affected by the pandemic, particularly in the second quarter when stores were temporarily closed in most markets; at the most, approximately 80 percent of the group’s stores were closed.
• A series of strong measures was rapidly implemented during the year. This crisis work covered all parts of the business, including product purchasing, investments, rents, staffing and financing. Greater emphasis was placed on the well-developed digital channels, which partly compensated for the drop in in-store sales.
• Gross profit amounted to SEK 93,544 m (122,453). This corresponds to a gross margin of 50.0 percent (52.6).
• Profit after financial items amounted to SEK 2,052 m (17,391). Excluding IFRS 16, profit after financial items amounted to SEK 1,691 m (17,391).
• The group’s profit after tax amounted to SEK 1,243 m (13,443), corresponding to SEK 0:75 (8:12) per share.
Fourth quarter (1 September 2020 – 30 November 2020)
• The H&M group’s net sales amounted to SEK 52,549 m (61,694) in the fourth quarter. In local currencies, net sales decreased by 10 percent. A strong recovery at the start of the quarter was significantly slowed when the second wave of the pandemic again led to extensive new restrictions and lockdowns. At the most, just over 20 percent of the group’s stores were closed.
• Gross profit amounted to SEK 27,375 m (33,287) which corresponds to a gross margin of 52.1 percent (54.0).
• Profit after financial items amounted to SEK 3,665 m (5,403). Excluding IFRS 16, profit after financial items amounted to SEK 3,538 m (5,403).
• The group’s profit after tax amounted to SEK 2,485 m (4,212), corresponding to SEK 1:50 (2:54) per share. Excluding IFRS 16, profit after tax amounted to SEK 2,387 m (4,212).
• The H&M group’s liquidity is very good. As at 30 November 2020, cash and cash equivalents amounted to SEK 16,540 m (12,312). The group’s long-term financing and liquidity buffer have been strengthened. Cash and cash equivalents plus undrawn credit facilities increased to SEK 46,595 m (24,169). Net debt/EBITDA was 0.0 (0.2).
• The board aims for the H&M group to have sustainable and profitable growth, thereby allowing a good
return to the shareholders. The company’s financial position remains strong and at present the board’s assessment is that there are good prospects of a cash dividend in autumn 2021. However, since it is not currently possible to get a full overview of the consequences of the ongoing pandemic, during the year the board will come back with a proposed date and level for resuming the dividend.
• As a result of the second wave of the pandemic and the associated restrictions and temporary closure of, at the most, more than 1,800 stores, i.e. 36 percent of the group’s total of around 5,000 stores, net sales decreased by 23 percent in local currencies in the period 1 December 2020 – 27 January 2021 compared with the same period the previous year.
• Streamlining the invoice and payment process will have material effects on the H&M group’s working capital. Based on 2020 purchasing volumes, this could free up around SEK 10 billion in 2021.
• A framework has been produced to allow the issue of sustainability-linked bonds with the aim of financing, among other things, an accelerated transition to recycled materials. The H&M group’s goal is for 100 percent of the materials used in the products to be recycled or come from other more sustainable sources by 2030. By 2025 at least 30 percent are to be recycled materials.
• Online and physical stores are being increasingly integrated, with continued optimisation of the store portfolio. Around 100 new stores are planned to open in 2021, while 350 stores are planned to close in the same period - mainly in established markets.
“The H&M group stands strong after all the challenges brought by the pandemic. Thanks to much-appreciated collections, rapid and profitable online growth and strict cost control, the company succeeded in ending the year in profit and in a strong financial position,” says Helena Helmersson, CEO.
Q4
Full-year report 2020 (1 Dec 2019 – 30 Nov 2020)
2
Comments by Helena Helmersson, CEO “With strong, profitable online growth and good cost control we succeeded in ending the year in profit and with a strong financial position. Taking decisive measures quickly, combined with an attractive customer offering, led to a better recovery than expected up until the second wave of the pandemic struck. Our measures to mitigate the negative effects of ongoing restrictions and closures are continuing. Although the situation at the time of writing is highly challenging, the H&M group stands strong.
The recent years’ transformation initiatives and investments, focusing on the digital, have been especially important for managing the crisis and this work is continuing at full speed. Customers want to meet us where, when and how they choose – in the stores, on our websites, on digital marketplaces and on social media. They are showing us clearly that they appreciate a convenient and inspiring experience in which the channels interact and strengthen each other. We are continuing our initiatives for digital growth, integration of the channels and optimisation of the store portfolio. Speed and flexibility will be even more important going forward, particularly in the supply chain, to ensure the best customer offering and increase availability in all channels.
Our key focus remains on developing strong, unique brands in order to always offer the best combination of fashion, quality, price and sustainability. The percentage of recycled and sustainable materials in the collections is consistently increasing and our brands are offering an ever-growing range of services for a more sustainable lifestyle. Together with our transformation initiatives this will help increase our resilience and adaptability and will contribute to sustainable and profitable growth for the H&M group.”
Read more about the initiatives taken as part of our sustainability work on page 14.
Full-year report 2020 (1 Dec 2019 – 30 Nov 2020)
3
Sales
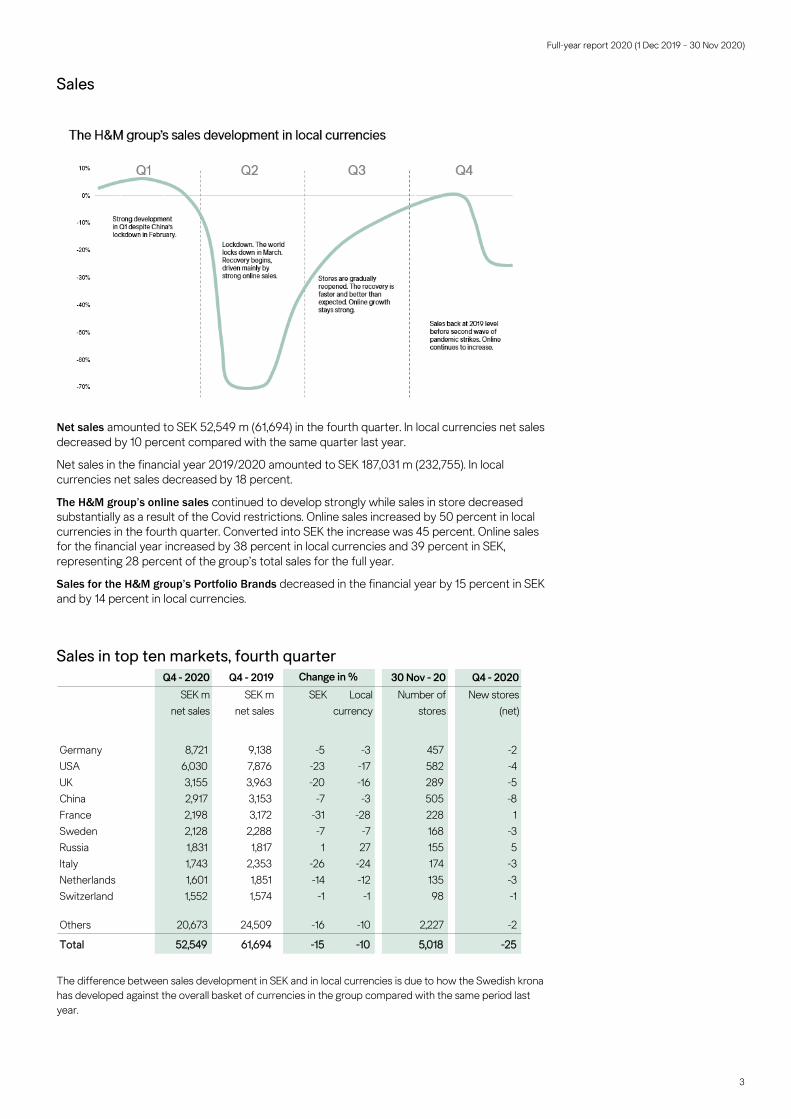
Net sales amounted to SEK 52,549 m (61,694) in the fourth quarter. In local currencies net sales decreased by 10 percent compared with the same quarter last year.
Net sales in the financial year 2019/2020 amounted to SEK 187,031 m (232,755). In local currencies net sales decreased by 18 percent.
The H&M group’s online sales continued to develop strongly while sales in store decreased substantially as a result of the Covid restrictions. Online sales increased by 50 percent in local currencies in the fourth quarter. Converted into SEK the increase was 45 percent. Online sales for the financial year increased by 38 percent in local currencies and 39 percent in SEK, representing 28 percent of the group’s total sales for the full year.
Sales for the H&M group’s Portfolio Brands decreased in the financial year by 15 percent in SEK and by 14 percent in local currencies.
Sales in top ten markets, fourth quarter
The difference between sales development in SEK and in local currencies is due to how the Swedish krona has developed against the overall basket of currencies in the group compared with the same period last year.
Q4 - 2020 Q4 - 2019 30 Nov - 20 Q4 - 2020SEK m
net sales SEK m
net sales SEK Local
currency Number of
stores New stores
(net)
Germany 8,721 9,138 -5 -3 457 -2USA 6,030 7,876 -23 -17 582 -4UK 3,155 3,963 -20 -16 289 -5China 2,917 3,153 -7 -3 505 -8France 2,198 3,172 -31 -28 228 1Sweden 2,128 2,288 -7 -7 168 -3Russia 1,831 1,817 1 27 155 5Italy 1,743 2,353 -26 -24 174 -3Netherlands 1,601 1,851 -14 -12 135 -3Switzerland 1,552 1,574 -1 -1 98 -1
Others 20,673 24,509 -16 -10 2,227 -2
Total 52,549 61,694 -15 -10 5,018 -25
Change in %
Full-year report 2020 (1 Dec 2019 – 30 Nov 2020)
4
Gross profit and gross margin
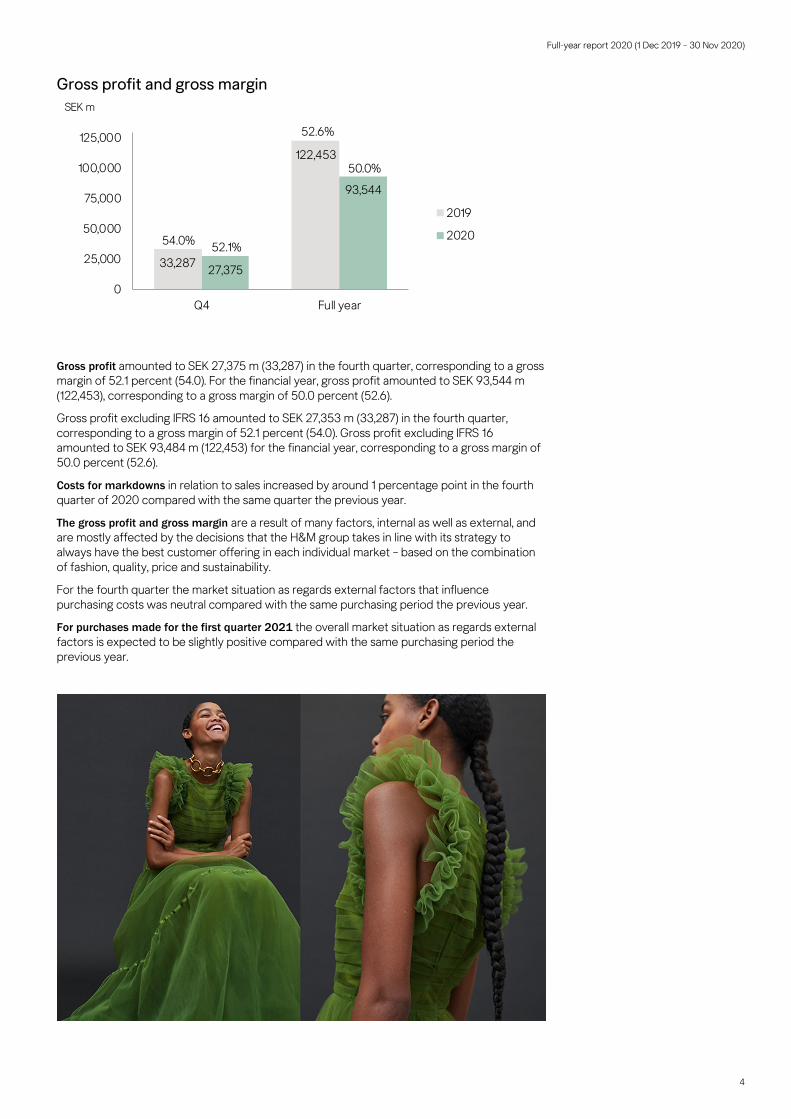
Gross profit amounted to SEK 27,375 m (33,287) in the fourth quarter, corresponding to a gross margin of 52.1 percent (54.0). For the financial year, gross profit amounted to SEK 93,544 m (122,453), corresponding to a gross margin of 50.0 percent (52.6).
Gross profit excluding IFRS 16 amounted to SEK 27,353 m (33,287) in the fourth quarter, corresponding to a gross margin of 52.1 percent (54.0). Gross profit excluding IFRS 16 amounted to SEK 93,484 m (122,453) for the financial year, corresponding to a gross margin of 50.0 percent (52.6).
Costs for markdowns in relation to sales increased by around 1 percentage point in the fourth quarter of 2020 compared with the same quarter the previous year.
The gross profit and gross margin are a result of many factors, internal as well as external, and are mostly affected by the decisions that the H&M group takes in line with its strategy to always have the best customer offering in each individual market – based on the combination of fashion, quality, price and sustainability.
For the fourth quarter the market situation as regards external factors that influence purchasing costs was neutral compared with the same purchasing period the previous year.
For purchases made for the first quarter 2021 the overall market situation as regards external factors is expected to be slightly positive compared with the same purchasing period the previous year.
33,287
122,453
27,375
93,544
0
25,000
50,000
75,000
100,000
125,000
Q4 Full year
SEK m
2019
202054.0% 52.1%
50.0%
52.6%
Full-year report 2020 (1 Dec 2019 – 30 Nov 2020)
5
Selling and administrative expenses
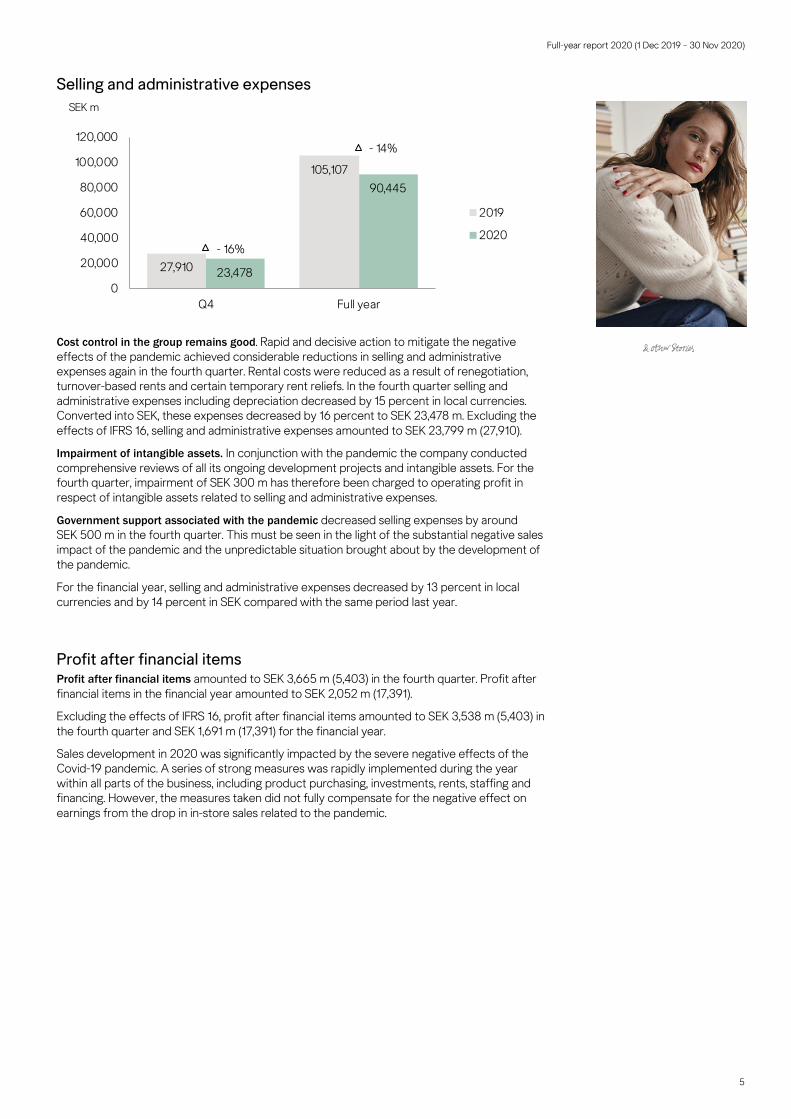
Cost control in the group remains good. Rapid and decisive action to mitigate the negative effects of the pandemic achieved considerable reductions in selling and administrative expenses again in the fourth quarter. Rental costs were reduced as a result of renegotiation, turnover-based rents and certain temporary rent reliefs. In the fourth quarter selling and administrative expenses including depreciation decreased by 15 percent in local currencies. Converted into SEK, these expenses decreased by 16 percent to SEK 23,478 m. Excluding the effects of IFRS 16, selling and administrative expenses amounted to SEK 23,799 m (27,910).
Impairment of intangible assets. In conjunction with the pandemic the company conducted comprehensive reviews of all its ongoing development projects and intangible assets. For the fourth quarter, impairment of SEK 300 m has therefore been charged to operating profit in respect of intangible assets related to selling and administrative expenses.
Government support associated with the pandemic decreased selling expenses by around SEK 500 m in the fourth quarter. This must be seen in the light of the substantial negative sales impact of the pandemic and the unpredictable situation brought about by the development of the pandemic.
For the financial year, selling and administrative expenses decreased by 13 percent in local currencies and by 14 percent in SEK compared with the same period last year.
Profit after financial items Profit after financial items amounted to SEK 3,665 m (5,403) in the fourth quarter. Profit after financial items in the financial year amounted to SEK 2,052 m (17,391).
Excluding the effects of IFRS 16, profit after financial items amounted to SEK 3,538 m (5,403) in the fourth quarter and SEK 1,691 m (17,391) for the financial year.
Sales development in 2020 was significantly impacted by the severe negative effects of the Covid-19 pandemic. A series of strong measures was rapidly implemented during the year within all parts of the business, including product purchasing, investments, rents, staffing and financing. However, the measures taken did not fully compensate for the negative effect on earnings from the drop in in-store sales related to the pandemic.
27,910
105,107
23,478
90,445
- 16%
- 14%
0
20,000
40,000
60,000
80,000
100,000
120,000
Q4 Full year
SEK m
2019
2020
Full-year report 2020 (1 Dec 2019 – 30 Nov 2020)
6
Stock-in-trade Despite the Covid-19 situation with its lockdowns and severe restrictions, the stock-in-trade increased by only 1 percent in SEK compared with the same time last year and amounted to SEK 38,209 m (37,823). Currency adjusted the stock-in-trade increased by 6 percent.
The book value of stock-in-trade in SEK represented 20.4 percent (16.3) of sales.
The continued transformation, including a more efficient supply chain and further integration of the channels, combined with a gradual improvement in the Covid-19 situation, provides a good basis for lower stock levels going forward.
Growth and expansion through integrated channels Expansion is taking place with a focus on omnichannel sales. The pandemic has accelerated the ongoing transformation of the industry where customers want to be able to shop and be inspired when and how they choose – in the stores, on the brands’ own websites, on digital marketplaces and in social media. Customers are showing that they appreciate a convenient and inspiring experience in which the channels interact and strengthen each other. The H&M group is therefore continuing its ongoing transformation work, which includes increased digital investments, further integration of online and physical stores as well as a faster pace of store consolidation.
In 2020 H&M opened online in Australia, and as a result now trades online in 52 markets. In addition, H&M was launched on the e-commerce platform SSG.COM in South Korea.
The current situation has changed the preconditions for, among other things, rental negotiations for stores. A large number of store leases were renegotiated in 2020 as part of the company’s intensified store optimisation, which also involves rebuilds and adjustment of the number of stores and of store space to ensure the best store portfolio in each market. The H&M group’s contracts allow around a quarter of leases to be renegotiated or exited each year, providing further opportunities and flexibility to adapt the number of stores and store area and to improve rent terms.
In 2020 the group closed 187 stores and opened 129, resulting in a net decrease for the year of 58 stores. For 2021 the plan is that 350 stores will close and just over 100 new stores will open, resulting in a net decrease of around 250 stores. As in 2020, the majority of the closures will be in established markets, while most of the openings will be in growth markets. The first H&M store in Panama is scheduled to open in the second half of 2021 via franchise.
The H&M group’s growth target to increase sales in local currencies by 10–15 percent per year with continued high profitability remains a long-term target.
For more information see the heading Initiatives for an improved customer experience on page 13.
Full-year report 2020 (1 Dec 2019 – 30 Nov 2020)
7
Store count by brand In the financial year 2019/2020, the H&M group opened 129 (281) stores including franchise and closed 187 (173) stores, making a net decrease of 58 (net increase of 108) stores. The group had a total of 5,018 (5,076) stores as at 30 November 2020, of which 269 (272) were operated by franchise partners.
Expansion2020
Expansion2021
Brand Store Online New markets New markets
H&M 74 52 Online: Australia Store: Panama (franchise)
COS 44 34 Store: New ZealandOnline: Bulgaria, Cyprus, Estonia, Greece, Croatia, Latvia, Lithuania, Luxembourg, Romania, Japan, Russia, Switzerland
Store: Greece, Estonia, Philippines
Monki 20 31 Store: PhilippinesOnline: Bulgaria, Cyprus, Estonia, Greece, Croatia, Latvia, Lithuania, Luxembourg, Romania, Russia, Switzerland
-
Weekday 16 30 Store: Russia, SpainOnline: Bulgaria, Cyprus, Estonia, Greece, Croatia, Latvia, Lithuania, Luxembourg, Romania, Russia, Switzerland
-
& Other Stories 22 33 Store: Norway, RussiaOnline: Bulgaria, Cyprus, Estonia, Greece, Croatia, Latvia, Lithuania, Luxembourg, Romania, Russia, Switzerland
Store: China
ARKET 7 31 Online: Bulgaria, Cyprus, Estonia, Greece, Croatia, Latvia, Lithuania, Luxembourg, Romania, Russia, Switzerland, T-mall (China)
Store: South Korea, China
Afound 2 4 Store: NetherlandsOnline: Germany, Austria
-
H&M HOME 53 42 Store: Kuwait (franchise), Russia, Italy, France, Thailand (franchise)
COS, Weekday, Monki, Weekday, & Other Stories and ARKET offer Global selling which enables customers in around 70 additional markets to shop online. The exact number of markets per brand that have this service varies.
No. of markets30 Nov - 2020
Brand Q4 Full year 30 Nov - 2020 30 Nov - 2019
H&M -26 -63 4,429 4,492
COS -3 0 291 291
Monki -1 -7 123 130
Weekday 2 3 57 54
& Other Stories 2 3 74 71
ARKET 0 1 21 20
Afound 0 -1 6 7
H&M HOME* 1 6 17 11
Total -25 -58 5,018 5,076
Total No of stores
* Concept stores. H&M HOME is also included with shop-in-shop in 402 H&M stores.
New Stores 2020 (net)
Full-year report 2020 (1 Dec 2019 – 30 Nov 2020)
8
Store count by region
Tax The H&M group’s tax rate for the 2019/2020 financial year was 39.4 (22.7) percent. The final tax rate for the year depends on the results of the group’s various companies and the corporate tax rates in each country.
The year’s historically high tax rate is Covid 19-related since the proportion of non-deductible expenses has a greater percentage impact on the tax rate when earnings before tax decrease so substantially compared with a normal year.
Employees To meet the increased digitalisation in society, with new customer behaviours and a changed competitive situation, transformation work is under way within the H&M group which encompasses all parts of the company. The ongoing pandemic has further accelerated the shift in the industry and thus the H&M group’s transformation work. In general, the need for people to work in online-related parts of the business such as tech and logistics has increased, while the reverse applies to those associated with operations in the physical stores.
The greatest reduction in employee numbers is due to the expiry of temporary contracts, probationary employment that has ended and natural attrition. The average number of employees in the group as at 30 November 2020, converted into full-time positions, was 110,325 (126,291), of which 10,214 (11,221) are employed in Sweden.
Current quarter The second wave of the pandemic has resulted in extensive restrictions and temporary store closures. At the most, 1,800 stores were closed in the current quarter. Net sales in the period 1 December 2020 to 27 January 2021 decreased by 23 percent in local currencies compared with the same period last year. Currently 1,800 stores, representing 36 percent of the total amount of stores, are still temporarily closed. A total of 51 of the group’s 52 online markets are open.
The cost of markdowns in relation to sales is expected to increase by approximately 1 to 1.5 percentage points in the first quarter compared with the same quarter last year.
The ongoing restrictions, along with the many temporary store closures, will have a substantial negative impact on the first quarter. However, it is clear that when customers have opportunity to shop – online and in certain markets with lesser restrictions – they are showing that the collections are appreciated. A gradual improvement in the Covid-19 situation combined with continued transformation work means the H&M group is well positioned for a strong recovery during the year.
Region Q4 Full year 30 Nov - 2020 30 Nov - 2019
Europe & Africa -13 -59 3,028 3,087
Asia & Oceania -12 2 1,211 1,209
North & South America 0 -1 779 780
Total -25 -58 5,018 5,076
New Stores 2020 (net) Total No of stores
Full-year report 2020 (1 Dec 2019 – 30 Nov 2020)
9
Financing As at 30 November 2020, the group had interest-bearing liabilities of SEK 16,332 m (17,317) in the form of loans from credit institutions and commercial papers. In addition, the group has undrawn credit facilities of SEK 30,055 m (11,857). The average maturity of interest-bearing liabilities and undrawn credit facilities was 2.1 (2.6) years. A maturity analysis of outstanding interest-bearing liabilities and undrawn credit facilities is given in the table below.
The H&M group’s liquidity remains good. As at 30 November 2020, cash and cash equivalents amounted to SEK 16,540 m (12,312). Cash and cash equivalents plus undrawn credit facilities totalled SEK 46,595 m (24,169). The improvement in liquidity is partly driven by greater focus on the H&M group’s working capital, including the streamlining during the year of invoice management and the payment process for suppliers of products to the group. Among other things, payment terms have begun being adapted to the industry standard. This will have material effects on the H&M group’s working capital and strengthen cash flow as it is implemented further in 2021. Based on 2020 purchasing volumes, around SEK 10 billion could be freed up in 2021.
The H&M group has also implemented an arrangement with banks in which the banks offer suppliers of products to the H&M group the option of being paid earlier than the invoice due date. This arrangement is being offered to all H&M group product suppliers and has been well received in the markets where it has been implemented to date. Most suppliers have chosen to take part. This could improve the working capital of both the H&M group and the product suppliers.
The group aims to secure financial flexibility and freedom of action on the best possible terms. The following significant financing activities were begun in the fourth quarter of 2020 for completion in the first quarter of 2021:
• With the aim of accelerating the group’s sustainability work, a framework has been produced that allows sustainability-linked bonds to be issued under the group’s EMTN programme. The framework conforms to the Sustainability-Linked Bond Principles (SLBP).
• To secure access to the bond market on the best possible terms, a credit rating from Standard & Poor’s has been obtained. The rating is BBB with a stable outlook.
The group is continuing to monitor the bond market; if the need and the right market conditions arise, the group intends to issue a first bond.
Capital structure The H&M group advocates a conservative leverage ratio, aiming for a strong capital structure with strong liquidity and financial flexibility. It is essential that, as in the past, expansion and investments can proceed with continued freedom of action. The capital structure is defined as net debt in relation to EBITDA. Over time, this should not exceed 1.0 x EBITDA. Net debt/EBITDA excluding IFRS effects was 0.0 (0.2) as at 30 November 2020.
IFRS 16 Leases, which is being applied from 1 December 2019, has substantial effects on the reporting of liabilities, assets and EBITDA. However, the H&M group will continue to define the capital structure exclusive of IFRS 16 effects. The company considers this to provide a clearer picture at the present time of the actual debt/equity ratio, and it is also the measure used in internal monitoring.
YearLoan from
credit institutionsCommercial
papersUnused credit
facilities
2020 226 - -
2021 6,376 1,300 14,949
2022 400 - -
2023 4,030 - 4,000
2024 - - 7,106
2025 2,000 - 4,000
2026 2,000 - -
Total SEK m 15,032 1,300 30,055
Full-year report 2020 (1 Dec 2019 – 30 Nov 2020)
10
Dividend policy The board of directors’ intention is for the H&M group to continue to provide shareholders with a good return while ensuring that, growth and investments in the business can proceed with a continued strong financial profile and freedom of action. Based on this, the board of directors has proposed a dividend policy stating that the ordinary dividend over time should exceed 50 percent of profit after tax and additionally that identified surplus liquidity – taking into consideration the capital structure target and investment requirements – can be distributed to shareholders through an extra dividend or a buyback programme.
Dividend comment The board aims for the H&M group to have sustainable and profitable growth, thereby allowing a good return to the shareholders. The company’s financial position remains strong and at present the board’s assessment is that there are good prospects of a cash dividend in autumn 2021. However, since it is not currently possible to get a full overview of the consequences of the ongoing pandemic, during the year the board will come back with a proposed date and level for resuming the dividend.
Annual general meeting 2021 The 2021 annual general meeting will be held at 15:00 CEST on Thursday 6 May 2021.
Annual report 2020 The annual report and the corporate governance report are expected to be published on 6 April 2021 on hmgroup.com and will be sent out by post to shareholders that have so requested. The documents will also be available at the company’s head office.
Accounting principles The group applies International Financial Reporting Standards (IFRS) as adopted by the EU. This report has been prepared according to IAS 34 Interim Financial Reporting as well as the Swedish Annual Accounts Act.
The accounting principles and calculation methods applied in this report are unchanged from those used in the preparation of the annual report and consolidated financial statements for 2019 and which are described in Note 1 – Accounting principles, other than in respect of IFRS 16 Leases and IAS 20 Accounting for Government Grants and Disclosure of Government Assistance; see below.
The parent company applies the Swedish Annual Accounts Act and the Swedish Financial Reporting Board’s recommendation RFR 2 Accounting for Legal Entities, which essentially involves applying IFRS. In accordance with RFR 2, the parent company does not apply IFRS 9 when measuring financial instruments, nor does it capitalise development costs. IFRS 16 is also not applied in the parent company.
For definitions see the annual report and consolidated financial statements for 2019.
New accounting principles IFRS 16 Leases – this standard applies to H&M with effect from the financial year beginning on 1 December 2019 and supersedes IAS 17 Leases and its associated interpretations. The standard requires lessees to report assets and liabilities for all leases, unless the lease term is less than 12 months and/or the asset has a low value. Assets are depreciated over their useful life and liabilities constitute the present value of lease payments discounted by an interest rate for borrowing. The H&M group applies the recognition exemption for leases of low value as well as leases with a term of less than 12 months. These will therefore not be included in the lease liability but will instead continue to be reported as previously.
In 2019 preparations were made by the H&M group for the introduction of IFRS 16. This involved assessing the group’s leases to determine whether they constitute a service or a lease. Under IFRS 16, a lease is an agreement that controls the right to use an identifiable asset during a given period against payment. The majority of the contracts that the H&M group classifies as leases in accordance with IFRS 16 are leases for store premises where H&M runs its own operations. Offices and warehouses used by the group are also classified as leases. Variable lease payments, such as sales-based rent, are not included in the lease liability.
Full-year report 2020 (1 Dec 2019 – 30 Nov 2020)
11
The H&M group has around 5,000 stores as well as multiple offices and warehouses all around the world. Applying the standard has required estimates and assumptions, such as establishing the term of the lease and an interest rate for borrowing. The assumption that has the greatest effect on the size of the lease liability is the assessment of the lease term. On the expiry of the lease term the lease may be terminated entirely, renegotiated or extended depending on the provisions in the contract. In certain circumstances, a right to terminate the contract during the lease term may reduce the lease term used for the calculation. The option to extend is taken into account if it is reasonably certain that the lessee will exercise this option. To facilitate assessment of the lease term used to calculate the lease obligation according to IFRS 16, the assumptions are based on the type of contract. The assumptions used to establish the lease term for each type of contract are based on the best possible assessment and on historical data, as well as the current market situation. The group’s assumptions will be evaluated on an ongoing basis taking into account changes in the industry.
The H&M group has chosen to apply the simplified transition approach, whereby calculation of the liability at the time of transition to IFRS 16 is based on the remaining lease payments for the leased asset and is reported as an adjustment of the opening balance. As of 1 December 2019 the H&M group’s remaining payments for all leases were therefore included as a lease liability. The discount rate used for the calculation corresponds to the H&M group’s incremental borrowing rate at the time of transition, taking into account aspects such as country and length of the respective leases. As of the transition date right-of-use assets are recognised at the same value as the present value of the lease liability less contributions from lessors, i.e. lease incentives and advance payments. The H&M group’s calculation as of 1 December 2019 meant an opening balance of SEK 73 billion in right-of-use assets and SEK 77 billion in lease liabilities according to IFRS 16. The transition approach chosen involves prospective application of IFRS 16.
Government assistance in connection with the Covid-19 situation IAS 20 Accounting for Government Grants and Disclosure of Government Assistance – due to the extraordinary situation brought about by the pandemic the H&M group received government assistance in various markets, mainly in respect of rents and staffing.
The H&M group has chosen to report these grants as a reduction in the cost of the items to which the grants relate. The grants are reported in the income statement and balance sheet when it is reasonably certain that the grants will be received and any conditions for receiving the grants are fulfilled.
Financial instruments The H&M group’s financial instruments consist mainly of accounts receivable, other receivables, cash and cash equivalents, accounts payable, accrued trade payables, interest-bearing securities and liabilities, and currency derivatives.
Currency derivatives are measured at fair value based on Level 2 inputs in the IFRS 13 hierarchy. As of 30 November 2020, forward contracts with a positive market value amount to SEK 992 m (771), which is reported under other current receivables. Forward contracts with a negative market value amount to SEK 590 m (568), which is reported under other current liabilities. Other financial assets and liabilities are measured at amortised cost. Liabilities to credit institutions accrue interest at rates which essentially correspond to current market rates, and therefore the fair values of these and other financial instruments are assessed to be approximately equal to their book values.
Risks and uncertainties Risks may be due to events in the outside world and affect a certain sector or market, or they may be associated with the group’s own business. The H&M group carries out regular risk analysis for both operational and financial risks. Operational risks are mainly associated with the business and the external risks that affect the group. Business decisions determine whether action is to be taken to reduce the likelihood of the risk in question occurring and if so, to what extent. Business decisions also determine the extent to which the consequences of a risk that has occurred may be mitigated.
There are external risks and uncertainties affecting the H&M group that are related to the shift in the industry, fashion, competitors, information security and cybersecurity, sustainability issues, weather, macroeconomics and geopolitical events, pandemics, foreign currencies, taxes, and various regulations and ordinances, but also in connection with expansion into new
Full-year report 2020 (1 Dec 2019 – 30 Nov 2020)
12
markets, the launch of new concepts and how the brands are managed. A description of the H&M group’s operational and financial risks is given in the annual report and consolidated accounts for 2019 in the section on Operational risk, with more detailed information concerning financial risks given in Note 2.
Full-year report 2020 (1 Dec 2019 – 30 Nov 2020)
13
Initiatives for an improved customer experience The H&M group continues its work to meet customer expectations and delight customers by giving them the best experience possible. The pandemic has continued to accelerate the already rapid changes in customer behaviour towards being more digital-first. Efforts to increase engagement with customers and to provide new and enhanced offerings have been intensified. As part of our transformation to become even more customer-centric, here are some examples of new and ongoing initiatives:
• H&M’s customer loyalty programme now has around 107 million members in 26 markets. H&M Member was launched in India, South Korea and Australia in the fourth quarter. Members are rewarded not only for transactions, but also for engagement – earning points for rating and reviewing products, for example.
• More payment options. Members of H&M can pay now or later through the H&M Member app, whether shopping in store or online.
• Digital receipts. Customers can receive digital receipts in the H&M app in most markets. • Visual Search. Image recognition helps customers by making recommendations and suggesting
potential buys based on pictures that the customer has taken or been inspired by. • Next day delivery and express delivery continue to be rolled out in more markets. • Climate-smart delivery options. H&M customers in the Netherlands can opt to receive and return
items using a bicycle delivery service, a solution that is much appreciated by customers. Combined with using biogas vehicles from the logistics centre, this reduces CO2 emissions. Various kinds of climate-smart deliveries are offered in different markets.
• Find in Store. On seeing an item online, customers can use their mobile to find it quickly and easily in the size they want in a physical store as well as online.
• Scan & Buy. Customers can scan the QR code on a product in store to find and buy the item online in the size and colour they want.
• In-Store Mode allows customers to see on their mobiles which items are in the store they are currently in, as well as online.
• Click & Collect allows customers to pick up online purchases in store. • Online returns in store continues to be rolled out during 2021. • #HMxME enables customers to share their own fashion stories from Instagram while also providing an
easy way to buy the items in the images. • Recommended Size helps customers find the right size online based on past purchases. • Rate & Review lets customers rate and review H&M products. • RFID (Radio Frequency Identification) means items with a digital price tag can be located quickly, to
get precise information on an item’s availability. • Instagram – in the US, H&M customers can shop directly from inspirational images and videos on
Instagram and get notifications on Instagram when H&M releases new collections. • H&M Home X Augmented Reality pilot. H&M is continuously seeking new ways to engage its
customers and reduce its carbon footprint. One example of this is the group’s augmented reality pilot, where customers can preview selected H&M Home products by virtually “placing” them in their own environment simply using the camera on their mobile.
• Singular Society is the latest brand within the H&M group. Singular Society is subscription-based and offers products as a service. For a monthly fee, members are given access to life essentials at the price of what they cost to make. To start with, a selection of premium products within apparel and homeware is being offered.
• Product Transparency – the H&M group is continuing to work with the Sustainable Apparel Coalition (SAC) on the development of the Higg Index – a suite of tools that assess and measure sustainability performance at product, brand and factory level. The aim is to start sharing environmental performance scores with customers on selected H&M products this spring. Average scores for the industry will be given to enable comparability.
Product flow The pandemic has accelerated the need to further increase flexibility between channels, and so the H&M group is continuing to integrate the channels into a fully omni model. This encompasses the entire flow of goods and how to ensure that the right product is in the right place at the right time, at the right cost. Important elements include the group’s tech investments in AI and logistics systems, but also work on logistics centres and an increased focus on innovation.
On the US West Coast a newly developed and highly automated logistics centre was launched in the second half of 2020. Preparations are also being made for the opening of another highly automated logistics centre on the East Coast during the first half of 2021.
Full-year report 2020 (1 Dec 2019 – 30 Nov 2020)
14
Sustainability The H&M group’s sustainability vision is to lead the transition to circular, climate positive fashion as a fair and equal company across the entire value chain.
Circular materials goal. The H&M group’s aim is to shift from virgin to recycled materials, with the goal of using 100 percent recycled or other sustainably sourced materials by 2030. Recycled materials are a limited resource and the group will use its size to increase the speed of the transition away from virgin materials, without causing harm in doing so. New technologies must be enhanced and scaled, and new materials must replace the old ones. To accelerate the use of recycled materials the H&M group has set a new target to reach 30 percent recycled materials by 2025.
The H&M group and Renewcell, the innovative textile recycling company, have signed a multi-year agreement for the supply of thousands of tonnes of its pioneering virgin-quality Circulose® fibre, made from unusable textile waste. This is part of becoming fully circular whilst helping drive the sustainability agenda across the entire industry. One of the biggest barriers to replacing virgin fibres and using more sustainable materials is the availability of these materials at scale. Monki is first in the world to recycle blended textiles at scale using the so-called Green Machine, – the first to fully separate and recycle cotton and polyester blended fibres at scale. Monki has created the brand’s first collection using the Green Machine system, the result of a research collaboration between the non-profit H&M Foundation, HKRITA (Hong Kong Research Institute of Textiles and Apparel) and one of Monki’s key suppliers. The brand aims to roll out the process on a larger scale by autumn 2021. Reusable and recyclable online packaging test. As part of becoming fully circular, the H&M group has developed a multi-brand packaging system for online orders where plastic bags are replaced by reusable and recyclable bags made of certified paper. The H&M group is committed to reducing plastic throughout the value chain, and the sustainable packages will support the company in reaching the goals of its circular strategy for packaging. This includes reducing packaging by 25 percent and designing reusable, recyclable or compostable packaging by 2025. USD 100 million invested in partnership for a planet positive fashion industry. With the ambition of finding a truly sustainable solution for the fashion industry, the H&M Foundation and the Hong Kong Research Institute of Textiles and Apparel (HKRITA) are extending their collaboration for five more years in a new initiative called the Planet First programme. Groundbreaking technologies are already being tested. The Planet First programme aims to find planet positive technologies that will not only look at the circular economy and climate change, but also consider all aspects of Earth’s natural support systems: land, water, oceans, climate and biodiversity. The H&M group has been recognised in CDP’s A-list 2020 for its leadership in corporate sustainability. Global environmental non-profit organisation CDP has once again awarded the H&M group a place on its prestigious ‘A List’ for tackling climate change, recognising the H&M group’s actions to cut emissions, mitigate climate risks and develop the low-carbon economy. The H&M group’s Circular Innovation Lab has piloted new materials in collaboration with the company Made of Air. Greenhouse gases are converted into a usable material when waste residues from the wood industry are transformed into a carbon-negative compound that can replace plastic in a variety of applications. The new material has been used in the H&M Conscious Exclusive autumn/winter 2020 collection and the successful test means that the group is now looking into how this can be scaled up further. ARKET starts renting out childrenswear to encourage reuse and re-wear. ARKET will begin offering products from its children’s collection for rent through a new partnership with online shop and clothing subscription Circos. As from 28 January 2021 a broad selection of ARKET designs can be rented either individually or as part of an edited bundle of clothes on circos.co, delivered directly to the door of European customers. ILO call to action. The H&M group has joined an ILO global call to action to support garment workers and suppliers. The H&M group will work together with the ILO, employers’ organisations, trade unions and brands to tackle the immediate effects of Covid-19 and continue working towards a resilient garment industry. One aim behind this partnership is to work together to establish sustainable systems of social protection.
Read more about many of the initiatives taken and our sustainability work at hmgroup.com.
Full-year report 2020 (1 Dec 2019 – 30 Nov 2020)
15
Calendar 15 March 2021 Sales development in the first quarter, 1 Dec 2020 – 28 Feb 2021
31 March 2021 Three-month report, 1 Dec 2020 – 28 Feb 2021
6 May 2021 Annual general meeting
15 June 2021 Sales development in the second quarter, 1 March 2021 – 31 May 2021
1 July 2021 Six-month report, 1 Dec 2020 – 31 May 2021
15 September 2021 Sales development in the third quarter, 1 Jun 2021 – 31 Aug 2021
30 September 2021 Nine-month report, 1 Dec 2020 – 31 Aug 2021
15 December 2021 Sales development in the fourth quarter, 1 Sep 2021 – 30 Nov 2021
28 January 2022 Full-year report, 1 Dec 2020 – 30 Nov 2021
This year-end report has not been reviewed by the company’s auditors.
Stockholm, 28 January 2021 Board of Directors
Communication in conjunction with the full-year report The full-year report for the 2020 financial year, i.e. 1 December 2019 – 30 November 2020, will be published at 08:00 CET on 29 January 2021 and will be followed by a telephone conference at 09:00 CET for the financial market and media hosted by CEO Helena Helmersson, CFO Adam Karlsson and Head of IR Nils Vinge. The press conference will be held in English. Presentation material will be available at hmgroup.com.
To book interviews in conjunction with the full-year report on 29 January 2021 please contact Kristina Stenvinkel, Communications Director, telephone +46 8 796 39 08, e-mail: [email protected]
Contact Nils Vinge, Head of IR +46 8 796 52 50 Helena Helmersson, CEO +46 8 796 55 00 (switchboard) Adam Karlsson, CFO +46 8 796 55 00 (switchboard)
H & M Hennes & Mauritz AB (publ) SE-106 38 Stockholm Phone: +46-8-796 55 00, fax: +46-8-20 99 19, e-mail: [email protected] Registered office: Stockholm, Reg. No. 556042-7220
For more information about the H&M group visit hmgroup.com.
Information in this interim report is that which H & M Hennes & Mauritz AB (publ) is required to disclose under the EU Market Abuse Regulation (596/2014/EU). The information was submitted for publication by the abovementioned persons at 08:00 (CEST) on 29 January 2021. This interim report and other information about the H&M group, is available at hmgroup.com.
H & M Hennes & Mauritz AB (publ) was founded in Sweden in 1947 and is quoted on Nasdaq Stockholm. H&M’s business idea is to offer fashion and quality at the best price in a sustainable way. In addition to H&M, the group includes the brands COS, Monki, Weekday, & Other Stories, H&M HOME and ARKET as well as Afound. The H&M group has 52 online markets and approximately 5,000 stores in 74 markets including franchise markets. In 2020, net sales were SEK 187 billion. The number of employees amounts to approximately 153,000. For further information, visit hmgroup.com.
Full-year report 2020 (1 Dec 2019 – 30 Nov 2020)
16
Q4 2020 Q4 2019* Full year
2020 Full year
2019* Q4 2020
Full year 2020
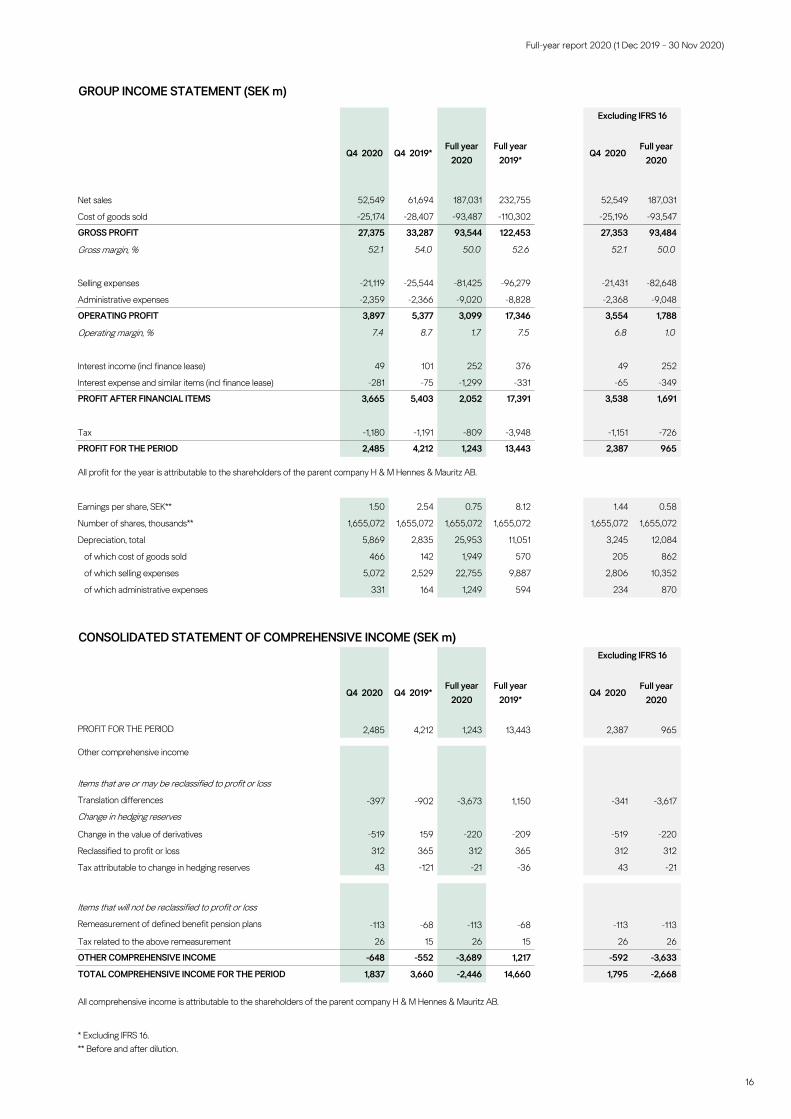
Net sales 52,549 61,694 187,031 232,755 52,549 187,031
Cost of goods sold -25,174 -28,407 -93,487 -110,302 -25,196 -93,547
GROSS PROFIT 27,375 33,287 93,544 122,453 27,353 93,484
Gross margin, % 52.1 54.0 50.0 52.6 52.1 50.0
Selling expenses -21,119 -25,544 -81,425 -96,279 -21,431 -82,648
Administrative expenses -2,359 -2,366 -9,020 -8,828 -2,368 -9,048
OPERATING PROFIT 3,897 5,377 3,099 17,346 3,554 1,788
Operating margin, % 7.4 8.7 1.7 7.5 6.8 1.0
Interest income (incl finance lease) 49 101 252 376 49 252
Interest expense and similar items (incl finance lease) -281 -75 -1,299 -331 -65 -349
PROFIT AFTER FINANCIAL ITEMS 3,665 5,403 2,052 17,391 3,538 1,691
Tax -1,180 -1,191 -809 -3,948 -1,151 -726
PROFIT FOR THE PERIOD 2,485 4,212 1,243 13,443 2,387 965
All profit for the year is attributable to the shareholders of the parent company H & M Hennes & Mauritz AB.
Earnings per share, SEK** 1.50 2.54 0.75 8.12 1.44 0.58
Number of shares, thousands** 1,655,072 1,655,072 1,655,072 1,655,072 1,655,072 1,655,072
Depreciation, total 5,869 2,835 25,953 11,051 3,245 12,084
of which cost of goods sold 466 142 1,949 570 205 862
of which selling expenses 5,072 2,529 22,755 9,887 2,806 10,352
of which administrative expenses 331 164 1,249 594 234 870
CONSOLIDATED STATEMENT OF COMPREHENSIVE INCOME (SEK m)
Q4 2020 Q4 2019* Full year
2020 Full year
2019* Q4 2020
Full year 2020
PROFIT FOR THE PERIOD 2,485 4,212 1,243 13,443 2,387 965
Other comprehensive income
Items that are or may be reclassified to profit or loss
Translation differences -397 -902 -3,673 1,150 -341 -3,617
Change in hedging reserves
Change in the value of derivatives -519 159 -220 -209 -519 -220
Reclassified to profit or loss 312 365 312 365 312 312
Tax attributable to change in hedging reserves 43 -121 -21 -36 43 -21
Items that will not be reclassified to profit or loss
Remeasurement of defined benefit pension plans -113 -68 -113 -68 -113 -113
Tax related to the above remeasurement 26 15 26 15 26 26
OTHER COMPREHENSIVE INCOME -648 -552 -3,689 1,217 -592 -3,633
TOTAL COMPREHENSIVE INCOME FOR THE PERIOD 1,837 3,660 -2,446 14,660 1,795 -2,668
* Excluding IFRS 16.** Before and after dilution.
GROUP INCOME STATEMENT (SEK m)
Excluding IFRS 16
Excluding IFRS 16
All comprehensive income is attributable to the shareholders of the parent company H & M Hennes & Mauritz AB.
Full-year report 2020 (1 Dec 2019 – 30 Nov 2020)
17
GROUP BALANCE SHEET (SEK m)
Excluding IFRS 16
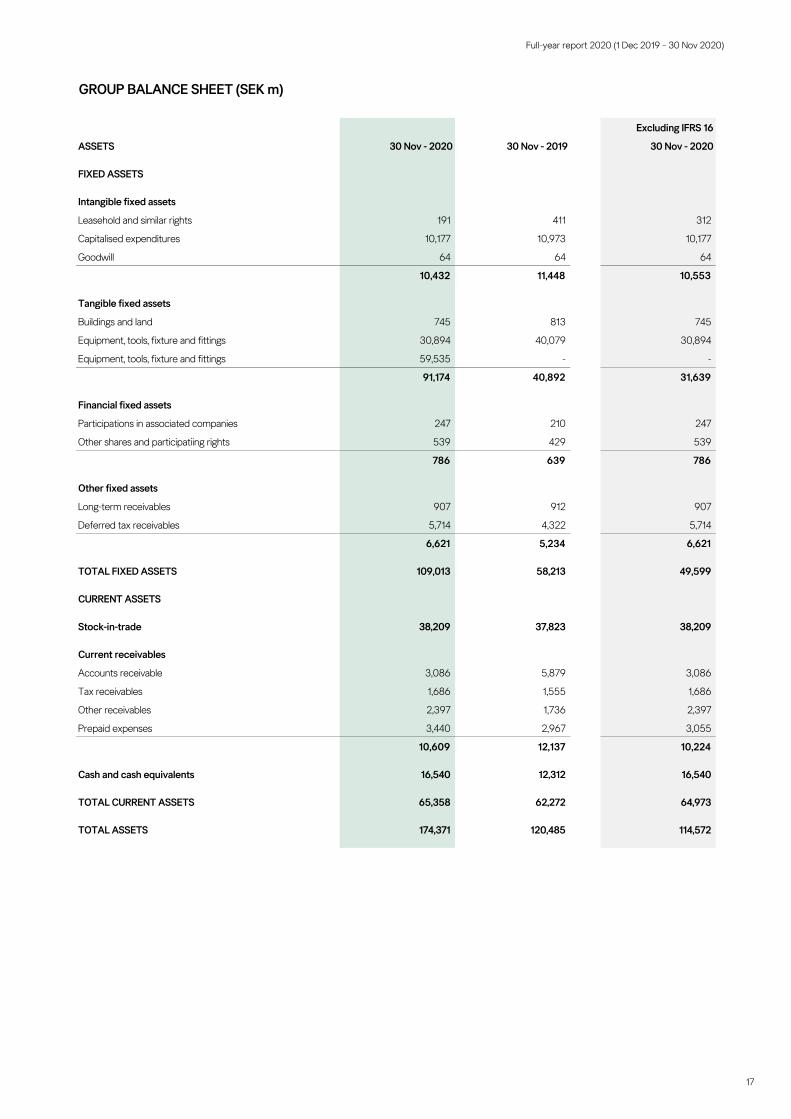
ASSETS 30 Nov - 2020 30 Nov - 2019 30 Nov - 2020
FIXED ASSETS
Intangible fixed assets
Leasehold and similar rights 191 411 312
Capitalised expenditures 10,177 10,973 10,177
Goodwill 64 64 64
10,432 11,448 10,553
Tangible fixed assets
Buildings and land 745 813 745
Equipment, tools, fixture and fittings 30,894 40,079 30,894
Equipment, tools, fixture and fittings 59,535 - -
91,174 40,892 31,639
Financial fixed assets
Participations in associated companies 247 210 247
Other shares and participatiing rights 539 429 539
786 639 786
Other fixed assets
Long-term receivables 907 912 907
Deferred tax receivables 5,714 4,322 5,714
6,621 5,234 6,621
TOTAL FIXED ASSETS 109,013 58,213 49,599
CURRENT ASSETS
Stock-in-trade 38,209 37,823 38,209
Current receivables
Accounts receivable 3,086 5,879 3,086
Tax receivables 1,686 1,555 1,686
Other receivables 2,397 1,736 2,397
Prepaid expenses 3,440 2,967 3,055
10,609 12,137 10,224
Cash and cash equivalents 16,540 12,312 16,540
TOTAL CURRENT ASSETS 65,358 62,272 64,973
TOTAL ASSETS 174,371 120,485 114,572
Full-year report 2020 (1 Dec 2019 – 30 Nov 2020)
18
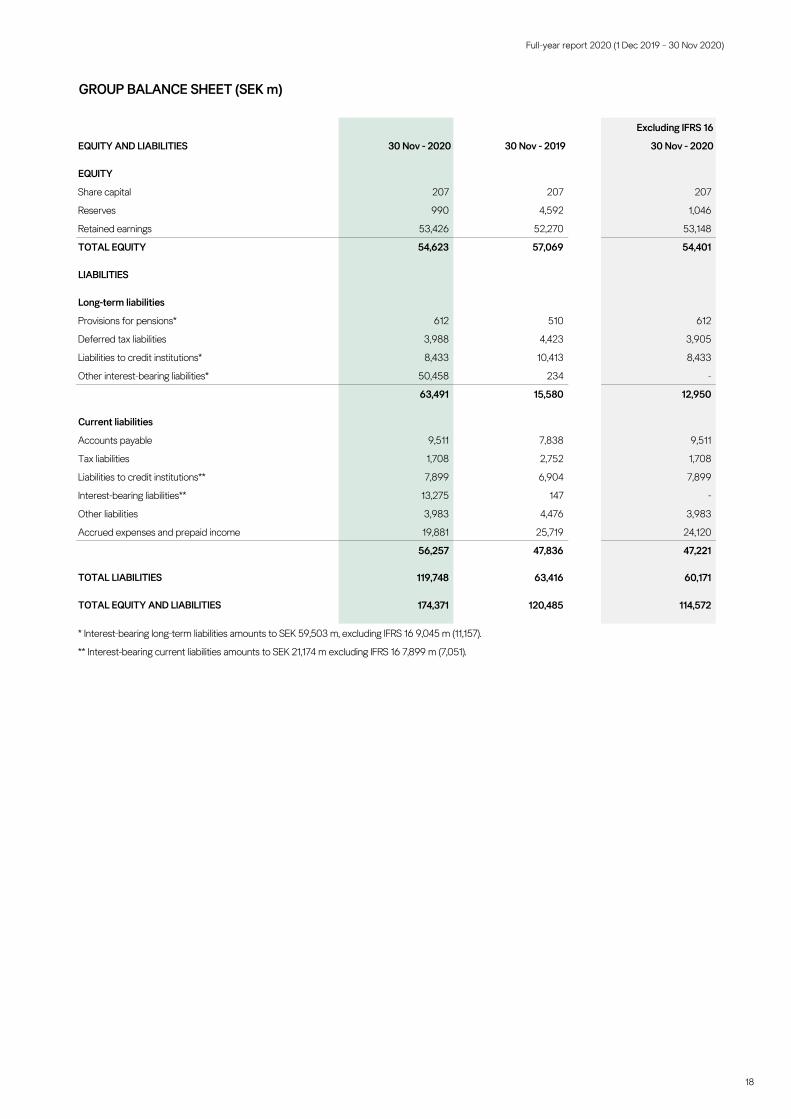
GROUP BALANCE SHEET (SEK m)
Excluding IFRS 16
EQUITY AND LIABILITIES 30 Nov - 2020 30 Nov - 2019 30 Nov - 2020
EQUITY
Share capital 207 207 207
Reserves 990 4,592 1,046
Retained earnings 53,426 52,270 53,148
TOTAL EQUITY 54,623 57,069 54,401
LIABILITIES
Long-term liabilities
Provisions for pensions* 612 510 612
Deferred tax liabilities 3,988 4,423 3,905
Liabilities to credit institutions* 8,433 10,413 8,433
Other interest-bearing liabilities* 50,458 234 -
63,491 15,580 12,950
Current liabilities
Accounts payable 9,511 7,838 9,511
Tax liabilities 1,708 2,752 1,708
Liabilities to credit institutions** 7,899 6,904 7,899
Interest-bearing liabilities** 13,275 147 -
Other liabilities 3,983 4,476 3,983
Accrued expenses and prepaid income 19,881 25,719 24,120
56,257 47,836 47,221
TOTAL LIABILITIES 119,748 63,416 60,171
TOTAL EQUITY AND LIABILITIES 174,371 120,485 114,572
* Interest-bearing long-term liabilities amounts to SEK 59,503 m, excluding IFRS 16 9,045 m (11,157).
** Interest-bearing current liabilities amounts to SEK 21,174 m excluding IFRS 16 7,899 m (7,051).
Full-year report 2020 (1 Dec 2019 – 30 Nov 2020)
19
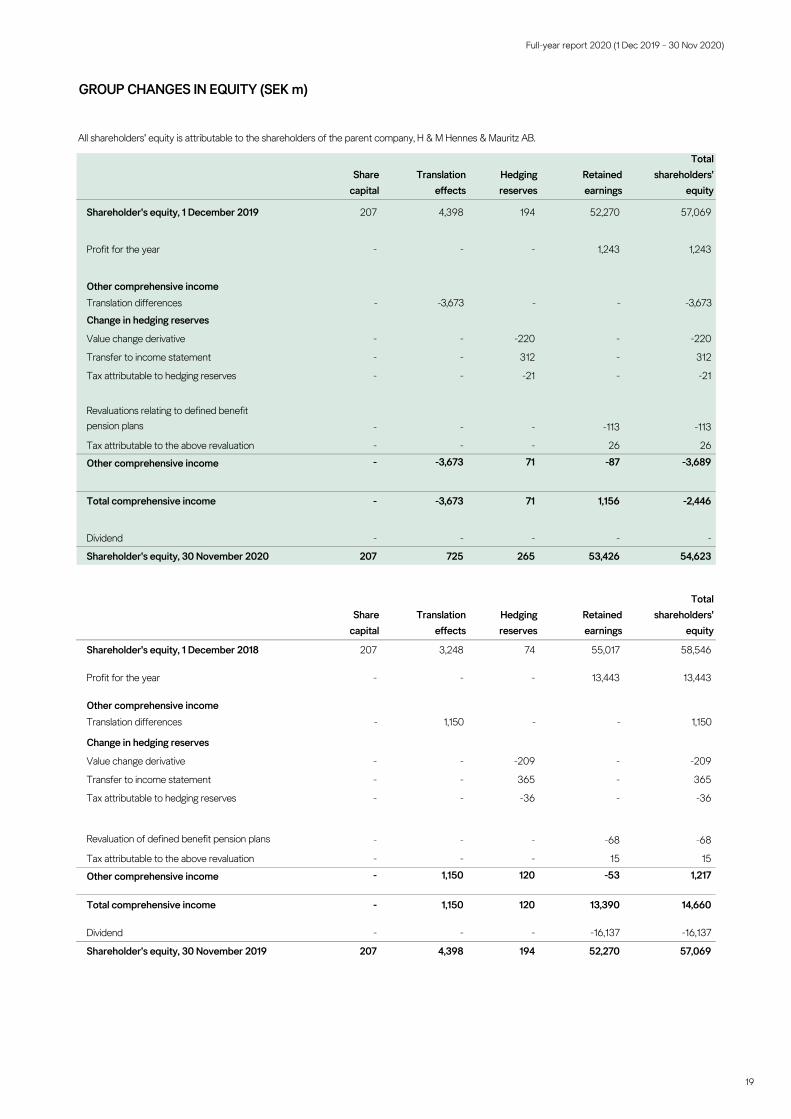
GROUP CHANGES IN EQUITY (SEK m)
Sharecapital
Translationeffects
Hedging reserves
Retainedearnings
Totalshareholders'
equity
Shareholder's equity, 1 December 2019 207 4,398 194 52,270 57,069
Profit for the year - - - 1,243 1,243
Other comprehensive incomeTranslation differences - -3,673 - - -3,673
Change in hedging reserves
Value change derivative - - -220 - -220
Transfer to income statement - - 312 - 312
Tax attributable to hedging reserves - - -21 - -21
Revaluations relating to defined benefit pension plans - - - -113 -113
Tax attributable to the above revaluation - - - 26 26
Other comprehensive income - -3,673 71 -87 -3,689
Total comprehensive income - -3,673 71 1,156 -2,446
Dividend - - - - -
Shareholder's equity, 30 November 2020 207 725 265 53,426 54,623
Sharecapital
Translationeffects
Hedging reserves
Retainedearnings
Totalshareholders'
equity
Shareholder's equity, 1 December 2018 207 3,248 74 55,017 58,546
Profit for the year - - - 13,443 13,443
Other comprehensive incomeTranslation differences - 1,150 - - 1,150
Change in hedging reserves
Value change derivative - - -209 - -209
Transfer to income statement - - 365 - 365
Tax attributable to hedging reserves - - -36 - -36
Revaluation of defined benefit pension plans - - - -68 -68
Tax attributable to the above revaluation - - - 15 15
Other comprehensive income - 1,150 120 -53 1,217
Total comprehensive income - 1,150 120 13,390 14,660
Dividend - - - -16,137 -16,137
Shareholder's equity, 30 November 2019 207 4,398 194 52,270 57,069
All shareholders' equity is attributable to the shareholders of the parent company, H & M Hennes & Mauritz AB.
Full-year report 2020 (1 Dec 2019 – 30 Nov 2020)
20
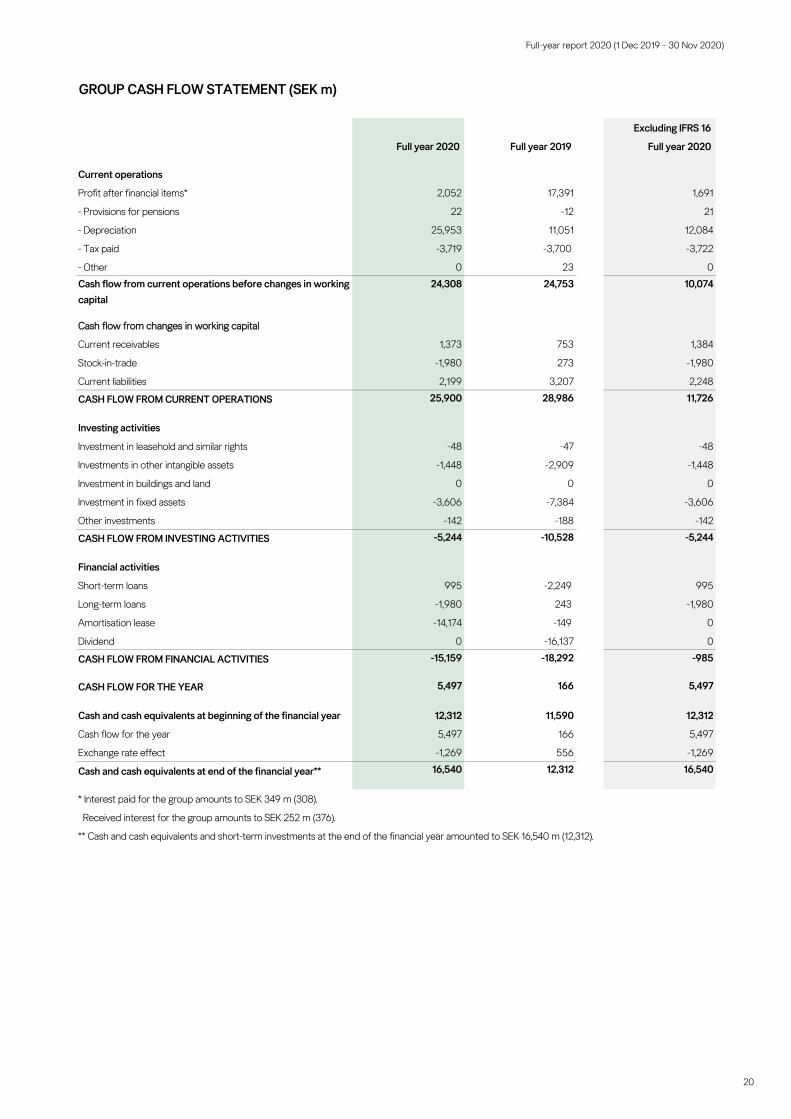
GROUP CASH FLOW STATEMENT (SEK m)
Excluding IFRS 16
Full year 2020 Full year 2019 Full year 2020
Current operations
Profit after financial items* 2,052 17,391 1,691
- Provisions for pensions 22 -12 21
- Depreciation 25,953 11,051 12,084
- Tax paid -3,719 -3,700 -3,722
- Other 0 23 0Cash flow from current operations before changes in working capital
24,308 24,753 10,074
Cash flow from changes in working capital
Current receivables 1,373 753 1,384
Stock-in-trade -1,980 273 -1,980
Current liabilities 2,199 3,207 2,248
CASH FLOW FROM CURRENT OPERATIONS 25,900 28,986 11,726
Investing activities
Investment in leasehold and similar rights -48 -47 -48
Investments in other intangible assets -1,448 -2,909 -1,448
Investment in buildings and land 0 0 0
Investment in fixed assets -3,606 -7,384 -3,606
Other investments -142 -188 -142
CASH FLOW FROM INVESTING ACTIVITIES -5,244 -10,528 -5,244
Financial activities
Short-term loans 995 -2,249 995
Long-term loans -1,980 243 -1,980
Amortisation lease -14,174 -149 0
Dividend 0 -16,137 0
CASH FLOW FROM FINANCIAL ACTIVITIES -15,159 -18,292 -985
CASH FLOW FOR THE YEAR 5,497 166 5,497
Cash and cash equivalents at beginning of the financial year 12,312 11,590 12,312
Cash flow for the year 5,497 166 5,497
Exchange rate effect -1,269 556 -1,269
Cash and cash equivalents at end of the financial year** 16,540 12,312 16,540
* Interest paid for the group amounts to SEK 349 m (308).
Received interest for the group amounts to SEK 252 m (376).
** Cash and cash equivalents and short-term investments at the end of the financial year amounted to SEK 16,540 m (12,312).
Full-year report 2020 (1 Dec 2019 – 30 Nov 2020)
21
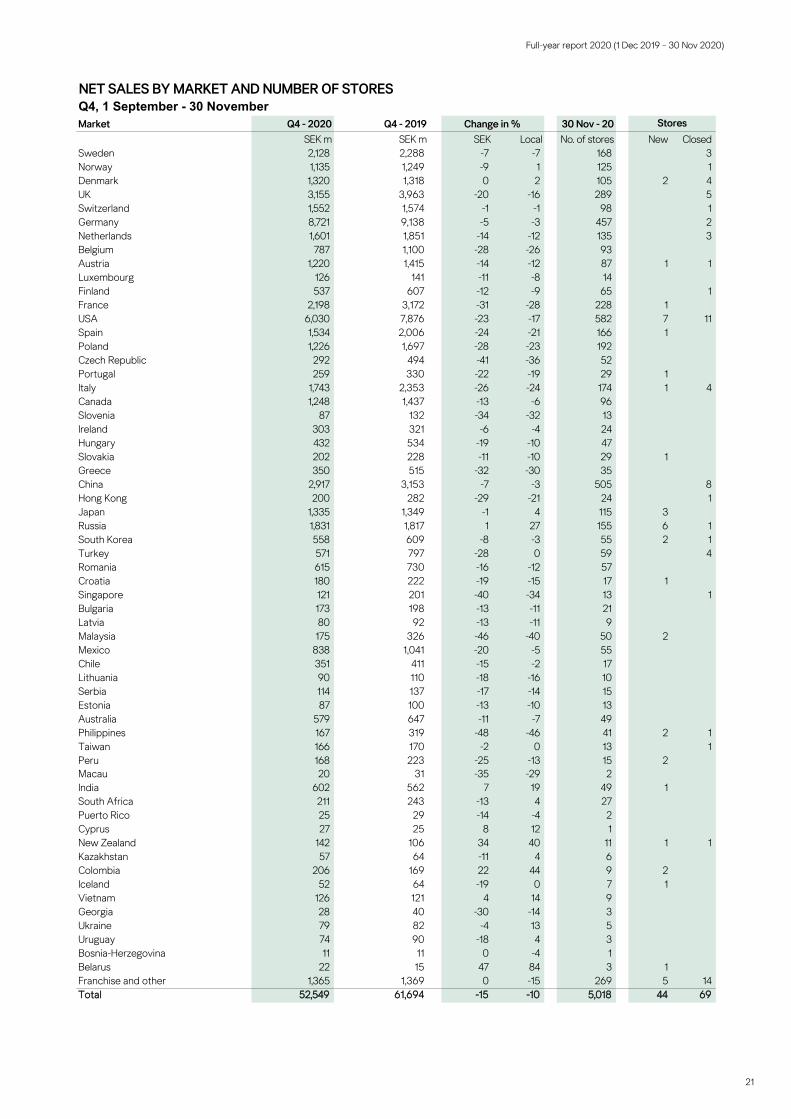
NET SALES BY MARKET AND NUMBER OF STORES Q4, 1 September - 30 NovemberMarket Q4 - 2020 Q4 - 2019 30 Nov - 20
SEK m SEK m SEK Local No. of stores New Closed
Sweden 2,128 2,288 -7 -7 168 3Norway 1,135 1,249 -9 1 125 1Denmark 1,320 1,318 0 2 105 2 4UK 3,155 3,963 -20 -16 289 5Switzerland 1,552 1,574 -1 -1 98 1Germany 8,721 9,138 -5 -3 457 2Netherlands 1,601 1,851 -14 -12 135 3Belgium 787 1,100 -28 -26 93Austria 1,220 1,415 -14 -12 87 1 1Luxembourg 126 141 -11 -8 14Finland 537 607 -12 -9 65 1France 2,198 3,172 -31 -28 228 1USA 6,030 7,876 -23 -17 582 7 11Spain 1,534 2,006 -24 -21 166 1Poland 1,226 1,697 -28 -23 192Czech Republic 292 494 -41 -36 52Portugal 259 330 -22 -19 29 1Italy 1,743 2,353 -26 -24 174 1 4Canada 1,248 1,437 -13 -6 96Slovenia 87 132 -34 -32 13Ireland 303 321 -6 -4 24Hungary 432 534 -19 -10 47Slovakia 202 228 -11 -10 29 1Greece 350 515 -32 -30 35China 2,917 3,153 -7 -3 505 8Hong Kong 200 282 -29 -21 24 1Japan 1,335 1,349 -1 4 115 3Russia 1,831 1,817 1 27 155 6 1South Korea 558 609 -8 -3 55 2 1Turkey 571 797 -28 0 59 4Romania 615 730 -16 -12 57Croatia 180 222 -19 -15 17 1Singapore 121 201 -40 -34 13 1Bulgaria 173 198 -13 -11 21Latvia 80 92 -13 -11 9Malaysia 175 326 -46 -40 50 2Mexico 838 1,041 -20 -5 55Chile 351 411 -15 -2 17Lithuania 90 110 -18 -16 10Serbia 114 137 -17 -14 15Estonia 87 100 -13 -10 13Australia 579 647 -11 -7 49Philippines 167 319 -48 -46 41 2 1Taiwan 166 170 -2 0 13 1Peru 168 223 -25 -13 15 2Macau 20 31 -35 -29 2India 602 562 7 19 49 1South Africa 211 243 -13 4 27Puerto Rico 25 29 -14 -4 2Cyprus 27 25 8 12 1New Zealand 142 106 34 40 11 1 1Kazakhstan 57 64 -11 4 6Colombia 206 169 22 44 9 2Iceland 52 64 -19 0 7 1Vietnam 126 121 4 14 9Georgia 28 40 -30 -14 3Ukraine 79 82 -4 13 5Uruguay 74 90 -18 4 3Bosnia-Herzegovina 11 11 0 -4 1Belarus 22 15 47 84 3 1Franchise and other 1,365 1,369 0 -15 269 5 14Total 52,549 61,694 -15 -10 5,018 44 69
Change in % Stores
Full-year report 2020 (1 Dec 2019 – 30 Nov 2020)
22
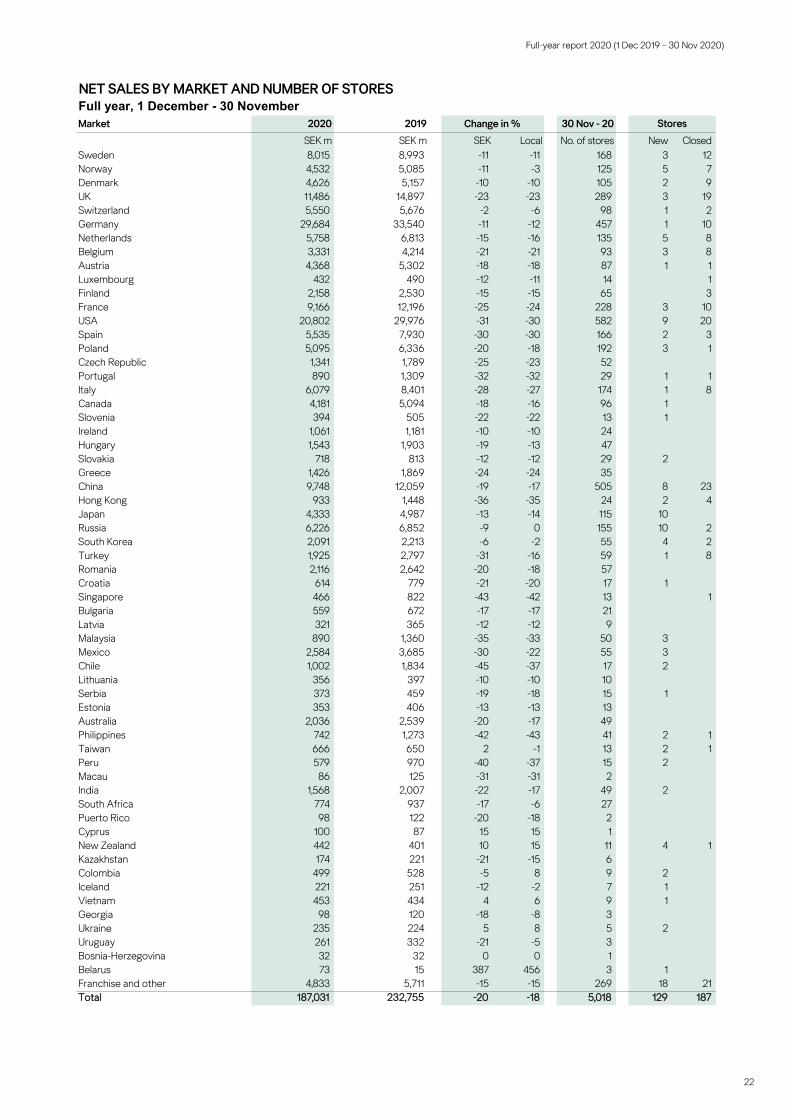
NET SALES BY MARKET AND NUMBER OF STORES Full year, 1 December - 30 NovemberMarket 2020 2019 30 Nov - 20
SEK m SEK m SEK Local No. of stores New Closed
Sweden 8,015 8,993 -11 -11 168 3 12Norway 4,532 5,085 -11 -3 125 5 7Denmark 4,626 5,157 -10 -10 105 2 9UK 11,486 14,897 -23 -23 289 3 19Switzerland 5,550 5,676 -2 -6 98 1 2Germany 29,684 33,540 -11 -12 457 1 10Netherlands 5,758 6,813 -15 -16 135 5 8Belgium 3,331 4,214 -21 -21 93 3 8Austria 4,368 5,302 -18 -18 87 1 1Luxembourg 432 490 -12 -11 14 1Finland 2,158 2,530 -15 -15 65 3France 9,166 12,196 -25 -24 228 3 10USA 20,802 29,976 -31 -30 582 9 20Spain 5,535 7,930 -30 -30 166 2 3Poland 5,095 6,336 -20 -18 192 3 1Czech Republic 1,341 1,789 -25 -23 52Portugal 890 1,309 -32 -32 29 1 1Italy 6,079 8,401 -28 -27 174 1 8Canada 4,181 5,094 -18 -16 96 1Slovenia 394 505 -22 -22 13 1Ireland 1,061 1,181 -10 -10 24Hungary 1,543 1,903 -19 -13 47Slovakia 718 813 -12 -12 29 2Greece 1,426 1,869 -24 -24 35China 9,748 12,059 -19 -17 505 8 23Hong Kong 933 1,448 -36 -35 24 2 4Japan 4,333 4,987 -13 -14 115 10Russia 6,226 6,852 -9 0 155 10 2South Korea 2,091 2,213 -6 -2 55 4 2Turkey 1,925 2,797 -31 -16 59 1 8Romania 2,116 2,642 -20 -18 57Croatia 614 779 -21 -20 17 1Singapore 466 822 -43 -42 13 1Bulgaria 559 672 -17 -17 21Latvia 321 365 -12 -12 9Malaysia 890 1,360 -35 -33 50 3Mexico 2,584 3,685 -30 -22 55 3Chile 1,002 1,834 -45 -37 17 2Lithuania 356 397 -10 -10 10Serbia 373 459 -19 -18 15 1Estonia 353 406 -13 -13 13Australia 2,036 2,539 -20 -17 49Philippines 742 1,273 -42 -43 41 2 1Taiwan 666 650 2 -1 13 2 1Peru 579 970 -40 -37 15 2Macau 86 125 -31 -31 2India 1,568 2,007 -22 -17 49 2South Africa 774 937 -17 -6 27Puerto Rico 98 122 -20 -18 2Cyprus 100 87 15 15 1New Zealand 442 401 10 15 11 4 1Kazakhstan 174 221 -21 -15 6Colombia 499 528 -5 8 9 2Iceland 221 251 -12 -2 7 1Vietnam 453 434 4 6 9 1Georgia 98 120 -18 -8 3Ukraine 235 224 5 8 5 2Uruguay 261 332 -21 -5 3Bosnia-Herzegovina 32 32 0 0 1Belarus 73 15 387 456 3 1Franchise and other 4,833 5,711 -15 -15 269 18 21Total 187,031 232,755 -20 -18 5,018 129 187
Change in % Stores
Full-year report 2020 (1 Dec 2019 – 30 Nov 2020)
23
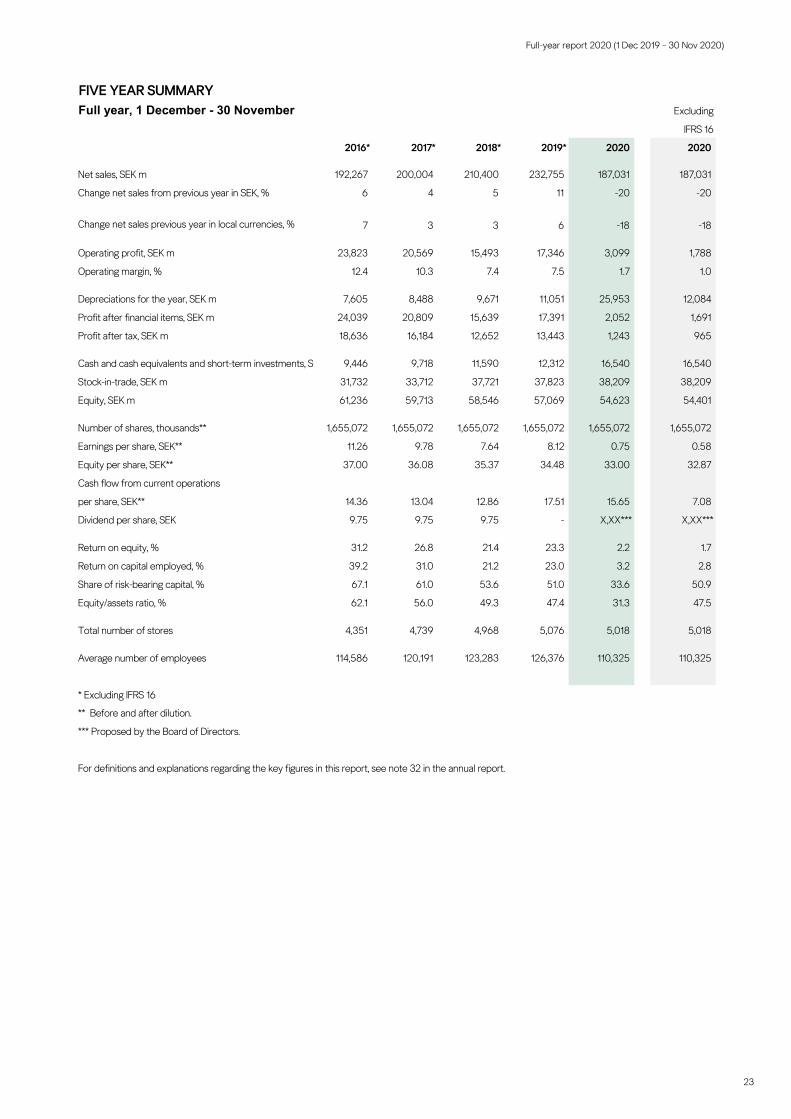
FIVE YEAR SUMMARYFull year, 1 December - 30 November Excluding
IFRS 16
2016* 2017* 2018* 2019* 2020 2020
Net sales, SEK m 192,267 200,004 210,400 232,755 187,031 187,031
Change net sales from previous year in SEK, % 6 4 5 11 -20 -20
Change net sales previous year in local currencies, % 7 3 3 6 -18 -18
Operating profit, SEK m 23,823 20,569 15,493 17,346 3,099 1,788
Operating margin, % 12.4 10.3 7.4 7.5 1.7 1.0
Depreciations for the year, SEK m 7,605 8,488 9,671 11,051 25,953 12,084
Profit after financial items, SEK m 24,039 20,809 15,639 17,391 2,052 1,691
Profit after tax, SEK m 18,636 16,184 12,652 13,443 1,243 965
Cash and cash equivalents and short-term investments, SE 9,446 9,718 11,590 12,312 16,540 16,540
Stock-in-trade, SEK m 31,732 33,712 37,721 37,823 38,209 38,209
Equity, SEK m 61,236 59,713 58,546 57,069 54,623 54,401
Number of shares, thousands** 1,655,072 1,655,072 1,655,072 1,655,072 1,655,072 1,655,072
Earnings per share, SEK** 11.26 9.78 7.64 8.12 0.75 0.58
Equity per share, SEK** 37.00 36.08 35.37 34.48 33.00 32.87
Cash flow from current operations
per share, SEK** 14.36 13.04 12.86 17.51 15.65 7.08
Dividend per share, SEK 9.75 9.75 9.75 - X,XX*** X,XX***
Return on equity, % 31.2 26.8 21.4 23.3 2.2 1.7
Return on capital employed, % 39.2 31.0 21.2 23.0 3.2 2.8
Share of risk-bearing capital, % 67.1 61.0 53.6 51.0 33.6 50.9
Equity/assets ratio, % 62.1 56.0 49.3 47.4 31.3 47.5
Total number of stores 4,351 4,739 4,968 5,076 5,018 5,018
Average number of employees 114,586 120,191 123,283 126,376 110,325 110,325
* Excluding IFRS 16
** Before and after dilution.
*** Proposed by the Board of Directors.
For definitions and explanations regarding the key figures in this report, see note 32 in the annual report.
Full-year report 2020 (1 Dec 2019 – 30 Nov 2020)
24
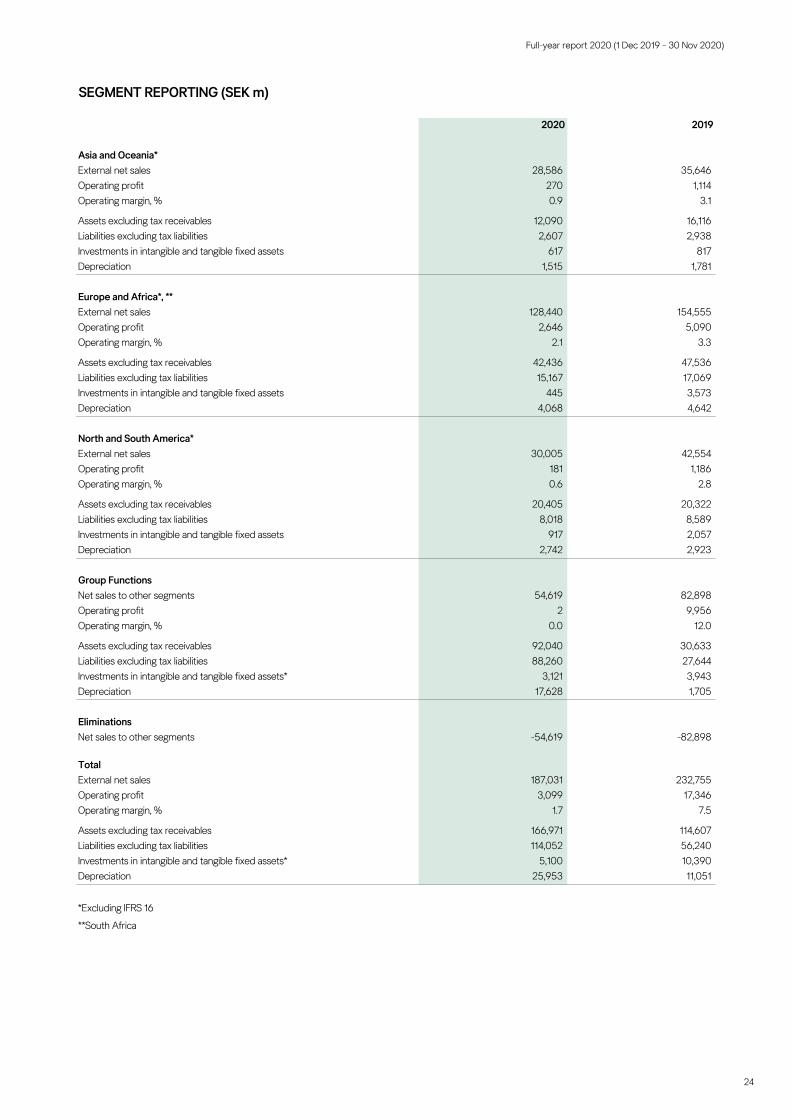
SEGMENT REPORTING (SEK m)
2020 2019
Asia and Oceania*External net sales 28,586 35,646Operating profit 270 1,114Operating margin, % 0.9 3.1
Assets excluding tax receivables 12,090 16,116Liabilities excluding tax liabilities 2,607 2,938Investments in intangible and tangible fixed assets 617 817Depreciation 1,515 1,781
Europe and Africa*, **External net sales 128,440 154,555Operating profit 2,646 5,090Operating margin, % 2.1 3.3
Assets excluding tax receivables 42,436 47,536Liabilities excluding tax liabilities 15,167 17,069Investments in intangible and tangible fixed assets 445 3,573Depreciation 4,068 4,642
North and South America*External net sales 30,005 42,554Operating profit 181 1,186Operating margin, % 0.6 2.8
Assets excluding tax receivables 20,405 20,322Liabilities excluding tax liabilities 8,018 8,589Investments in intangible and tangible fixed assets 917 2,057Depreciation 2,742 2,923
Group FunctionsNet sales to other segments 54,619 82,898Operating profit 2 9,956Operating margin, % 0.0 12.0
Assets excluding tax receivables 92,040 30,633Liabilities excluding tax liabilities 88,260 27,644Investments in intangible and tangible fixed assets* 3,121 3,943Depreciation 17,628 1,705
EliminationsNet sales to other segments -54,619 -82,898
TotalExternal net sales 187,031 232,755Operating profit 3,099 17,346Operating margin, % 1.7 7.5
Assets excluding tax receivables 166,971 114,607Liabilities excluding tax liabilities 114,052 56,240Investments in intangible and tangible fixed assets* 5,100 10,390Depreciation 25,953 11,051
*Excluding IFRS 16
**South Africa
Full-year report 2020 (1 Dec 2019 – 30 Nov 2020)
25
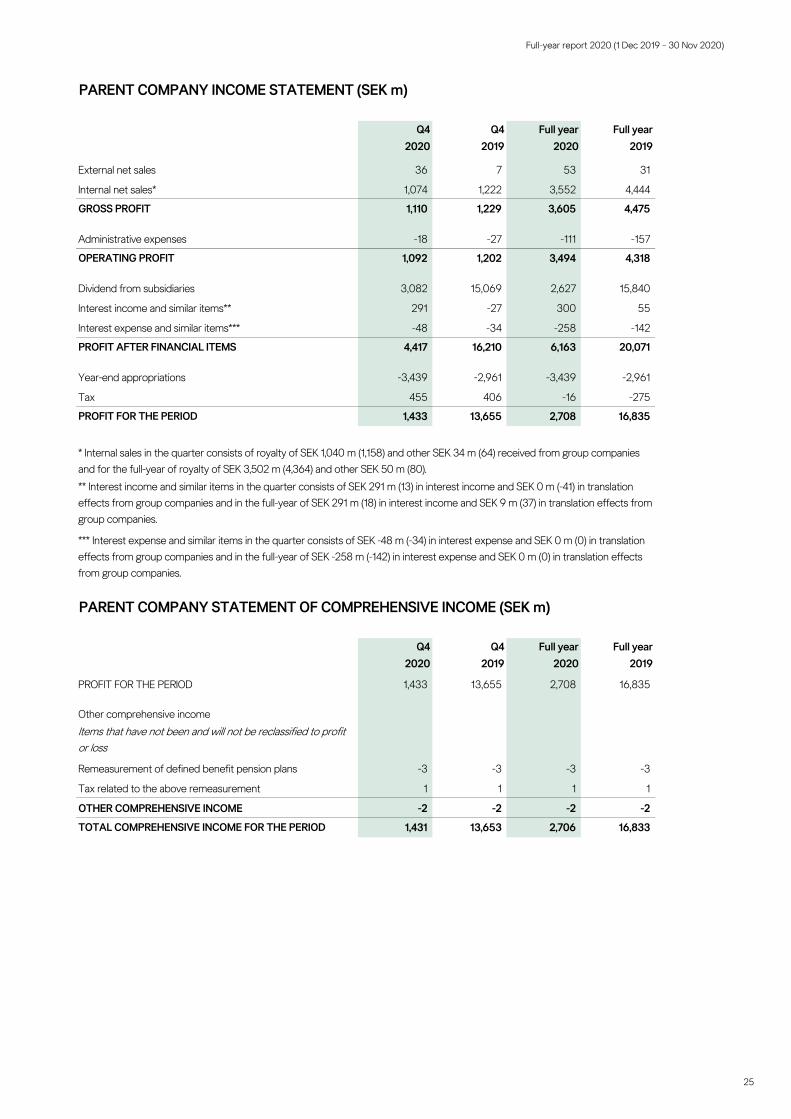
PARENT COMPANY INCOME STATEMENT (SEK m)
Q42020
Q42019
Full year2020
Full year2019
External net sales 36 7 53 31
Internal net sales* 1,074 1,222 3,552 4,444
GROSS PROFIT 1,110 1,229 3,605 4,475
Administrative expenses -18 -27 -111 -157
OPERATING PROFIT 1,092 1,202 3,494 4,318
Dividend from subsidiaries 3,082 15,069 2,627 15,840
Interest income and similar items** 291 -27 300 55
Interest expense and similar items*** -48 -34 -258 -142
PROFIT AFTER FINANCIAL ITEMS 4,417 16,210 6,163 20,071
Year-end appropriations -3,439 -2,961 -3,439 -2,961
Tax 455 406 -16 -275
PROFIT FOR THE PERIOD 1,433 13,655 2,708 16,835
Q42020
Q42019
Full year2020
Full year2019
PROFIT FOR THE PERIOD 1,433 13,655 2,708 16,835
Other comprehensive incomeItems that have not been and will not be reclassified to profit or loss
Remeasurement of defined benefit pension plans -3 -3 -3 -3
Tax related to the above remeasurement 1 1 1 1
OTHER COMPREHENSIVE INCOME -2 -2 -2 -2
TOTAL COMPREHENSIVE INCOME FOR THE PERIOD 1,431 13,653 2,706 16,833
* Internal sales in the quarter consists of royalty of SEK 1,040 m (1,158) and other SEK 34 m (64) received from group companies and for the full-year of royalty of SEK 3,502 m (4,364) and other SEK 50 m (80).** Interest income and similar items in the quarter consists of SEK 291 m (13) in interest income and SEK 0 m (-41) in translation effects from group companies and in the full-year of SEK 291 m (18) in interest income and SEK 9 m (37) in translation effects from group companies.
*** Interest expense and similar items in the quarter consists of SEK -48 m (-34) in interest expense and SEK 0 m (0) in translation effects from group companies and in the full-year of SEK -258 m (-142) in interest expense and SEK 0 m (0) in translation effects from group companies.
PARENT COMPANY STATEMENT OF COMPREHENSIVE INCOME (SEK m)
Full-year report 2020 (1 Dec 2019 – 30 Nov 2020)
26
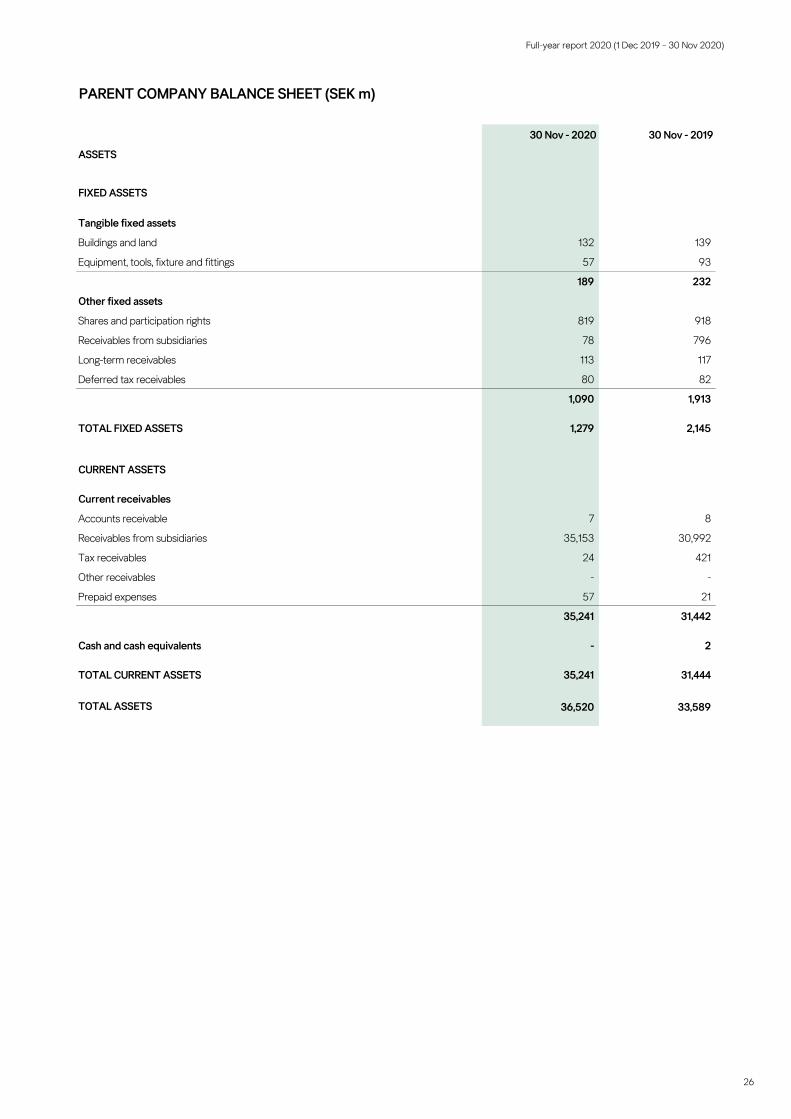
PARENT COMPANY BALANCE SHEET (SEK m)
30 Nov - 2020 30 Nov - 2019
ASSETS
FIXED ASSETS
Tangible fixed assets
Buildings and land 132 139
Equipment, tools, fixture and fittings 57 93
189 232
Other fixed assets
Shares and participation rights 819 918
Receivables from subsidiaries 78 796
Long-term receivables 113 117
Deferred tax receivables 80 82
1,090 1,913
TOTAL FIXED ASSETS 1,279 2,145
CURRENT ASSETS
Current receivables
Accounts receivable 7 8
Receivables from subsidiaries 35,153 30,992
Tax receivables 24 421
Other receivables - -
Prepaid expenses 57 21
35,241 31,442
Cash and cash equivalents - 2
TOTAL CURRENT ASSETS 35,241 31,444
TOTAL ASSETS 36,520 33,589
Full-year report 2020 (1 Dec 2019 – 30 Nov 2020)
27
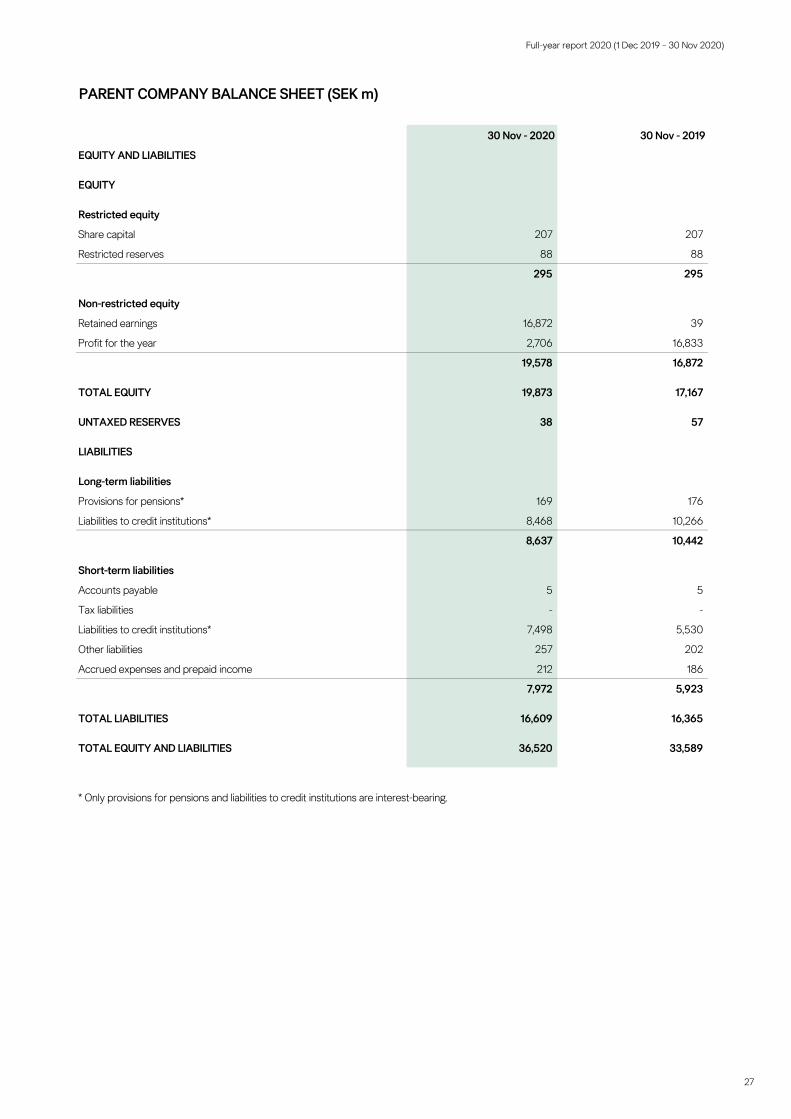
PARENT COMPANY BALANCE SHEET (SEK m)
30 Nov - 2020 30 Nov - 2019
EQUITY AND LIABILITIES
EQUITY
Restricted equity
Share capital 207 207
Restricted reserves 88 88
295 295
Non-restricted equity
Retained earnings 16,872 39
Profit for the year 2,706 16,833
19,578 16,872
TOTAL EQUITY 19,873 17,167
UNTAXED RESERVES 38 57
LIABILITIES
Long-term liabilities
Provisions for pensions* 169 176
Liabilities to credit institutions* 8,468 10,266
8,637 10,442
Short-term liabilities
Accounts payable 5 5
Tax liabilities - -
Liabilities to credit institutions* 7,498 5,530
Other liabilities 257 202
Accrued expenses and prepaid income 212 186
7,972 5,923
TOTAL LIABILITIES 16,609 16,365
TOTAL EQUITY AND LIABILITIES 36,520 33,589
* Only provisions for pensions and liabilities to credit institutions are interest-bearing.