Embed Size (px)
Citation preview
Press Release - Media Contact: Kosuke Yamauchi TEL: +81-3-3798-6511 ***** For immediate use May 10, 2011
Full Year Consolidated Financial Results for the Fiscal Year Ended
March 31, 2011 Consolidated Financial Results
Fiscal Year Ended March
31, 2011
Fiscal Year Ended March
31, 2010
Change
In billions of yen In billions of yen %
Net sales 3,115.4 3,583.1 -13.1 Operating income 57.8 50.9 13.6 Ordinary income 0.0 49.4 -99.9 Net income (loss) -12.5 11.4 - yen yen yen
Net income per share:
Basic -4.82 5.04 -9.86 Diluted - 4.91 -
In billions of yen In billions of yen %
Total assets 2,628.9 2,937.6 -10.5
Number of employees 115,840 142,358 -
(Note) Number of consolidated subsidiaries and affiliated companies accounted for by the equity method
is as follows:
As of March 31,
2011
As of March 31,
2010
Consolidated subsidiaries 283 310
Affiliated companies accounted for by the equity method 55 60
11

1. Consolidated Business Results
As stated in the July 6, 2010 announcement, “NEC to Revise its Business Segments,” NEC
has revised its business segments from the first quarter of the fiscal year ended March 31,
2011. Figures for the corresponding period of the previous fiscal year have been adjusted in
accordance with the new segments.
(1) Overview of the fiscal year ended March 31, 2011 and outlook for the fiscal year ending March
31, 2012
The worldwide economy during the fiscal year ended March 31, 2011 showed signs of a self
sustaining economic recovery as a result of continued expansion in emerging countries such
as China and India and the effects of economic measures taken by governments in developed
countries, including the United States and Europe, despite continued high unemployment
throughout such developed countries, and the emergence of the financial crisis in Europe.
The Japanese economy exhibited positive signs through slow manufacturing improvement
from the recovery of export and steady improvement of consumer spending being influenced
by economic stimulus packages. However, severe consumer income conditions and
employment continued and corporate capital investment have yet to make a full-scale
recovery. Furthermore, economic activity was significantly impacted by the damages and
accompanying production and distribution disruption, as well as power shortages and other
results from the Great East Japan Earthquake of March 2011.
Under this business environment, the NEC Group took measures to implement the company’s
three key strategic policies - “Promotion of C&C Cloud Strategy,” “Global Business
Expansion,” and “New Business Creation” and strived to strengthen profitability for this first
year of its mid-term growth plan, “V2012 -Beyond boundaries, Toward our Vision-.”
Firstly, in terms of promoting the company’s C&C Cloud strategy, the NEC Group promoted
the delivery of cloud services throughout a wide variety of domains, including mission
critical services for municipalities, together with the management of resident information and
information sharing services between hospitals through the use of the NEC Group’s
accomplishments in the IT and Network fields as well as its technologies and know-how.
Moreover, the NEC Group thoroughly revised its business processes across the entire group
as part of improving business efficiency and reducing costs, in addition to advancing
22

activities that concentrate key IT systems for accounting, sales and procurement within a
cloud environment. The technology and know-how acquired from the construction and
operation of these new systems, which began full operation during this period, will be used
for the construction of mission critical systems for customers. Additionally, the NEC Group
actively promoted the creation of new business models in cooperation with customers,
including the broad expansion of cloud services that combine the NEC Group’s cloud
technologies with customer business know-how. The NEC Group also took measures to
expand data centers as part of strengthening business foundations for the provision of cloud
services, in addition to maintaining and optimizing shared IT foundations for service
provision. In support of telecommunications carriers, NEC provided the communications
infrastructure for NTT DOCOMO, INC.’s launch of “Xi” in December 2010, a high-speed,
high-capacity LTE mobile communications service.
Regarding the expansion of global business, the NEC Group promoted business expansion
through regional headquarters in North America, Greater China, APAC (Asia Pacific) and
EMEA (Europe, Middle East and Africa) that each utilize local leadership and cater to
regional characteristics. A regional headquarters was established in Latin America in April
2011 as well, resulting in the establishment of a five pole global business structure.
Furthermore, the NEC Group established bases for pooling the necessary technologies and
know-how for promoting global business, including the carrier cloud business in support of
expanding cloud services for telecommunication carrier subscribers, public safety business,
including fingerprint identification, biometrics identification, and entry/exit management, as
well as the indoor compact wireless base station (femtocell) business. Collectively, these
technologies and know-how will be used to create optimized solutions that meet customer
needs and to horizontally develop business throughout the entire NEC Group.
In terms of new business creation, the NEC Group’s developments in the environment and
energy fields include its promotion of lithium-ion rechargeable batteries for automobiles
through a joint venture with Nissan Motor Co., Ltd., and its verification trials for high-speed
recharging systems that are needed for the spread of electric automobiles. Moreover, the NEC
Group began activities in support of the future smart grid markets, including the active
promotion of verification trials with business partners for large-scale storage systems for
electricity distribution, as well as energy management systems that optimize the use of
energy for both homes and businesses. In the multifunction terminal domain, NEC began
providing AndroidTM equipped smartphones to the domestic market in Japan and expanded its
lineup of tablet devices.
33

Regarding the strengthening of profitability, in addition to reducing costs, the management
system for assessing profitability risks was also reinforced.
On top of these activities, NEC also improved its competitive strength by integrating its
mobile phone business with Casio Hitachi Mobile Communications, Co., Ltd. and by
reaching a strategic partnership agreement with Lenovo Group Limited in order to unify the
two companies’ personal computer business.
NEC recorded consolidated sales of 3,115.4 billion yen for the fiscal year ended March 31,
2011, a decrease of 467.7 billion yen (13.1%) year-on-year. This was mainly due to NEC
Electronics Corporation (currently Renesas Electronics Corporation), which had been
engaged in the semiconductors business within the NEC Group, no longer being a
consolidated subsidiary of NEC, the delayed recovery of domestic IT investment and the
Great East Japan Earthquake.
Regarding profitability, consolidated operating income (loss) improved by 6.9 billion yen
year-on-year, for an operating profit of 57.8 billion yen, mainly due to NEC Electronics
Corporation, which recorded an operating loss during the previous fiscal year, no longer
being a consolidated subsidiary, and improving operating income (loss) from the Platform
business, despite worsening operating income (loss) from the IT Services business and
Personal Solutions business.
In terms of ordinary income (loss), NEC recorded a profit of 0.04 billion yen, worsening by
49.4 billion yen year-on-year, despite improving operating income (loss), mainly due to equity in
losses of affiliates.
Income (loss) before income taxes and minority interests was a loss of 15.7 billion yen, a
year-on-year worsening of 71.3 billion yen. This was mainly due to worsening ordinary income
(loss) and worsening extraordinary income (loss) from reduced gain on sales of subsidiaries and
affiliates’ stocks.
Consolidated net income (loss) worsened by 23.9 billion yen year-on-year, to a loss of 12.5 billion
yen, due mainly to a worsening of income (loss) before income taxes and minority interests, despite
an improvement from reduced income taxes-deferred.
Consolidated sales of 3,300.0 billion yen are projected for the fiscal year ending March 31, 2012,
44

a year-on-year increase of 5.9%. This is due to a forecast of steady sales increases through NEC’s
concentration on cloud related business, global business and new business domains, despite a
reduced sales forecast as a result of the Great East Japan Earthquake. NEC anticipates operating
income of 90.0 billion yen, a year-on-year increase of 32.2 billion yen, due to increased
profits from expanding sales and the promotion of earnings restructuring. NEC also expects
15.0 billion yen of consolidated net income for the same period.
Regarding consolidated financial forecasts for the first half of the fiscal year ending March
31, 2012, due to the difficulty of gauging the effects from the Great East Japan Earthquake,
NEC will postpone the announcement of first half forecasts. Further detail will be announced
as soon as it becomes available.
Consolidated Forecast for fiscal year
ending March 31, 2012
Comparison with fiscal year
ended March 31, 2011
In billions of yen
Sales 3,300.0 +5.9%
Operating income 90.0 +32.2 billion yen
Ordinary income 55.0 +55.0 billion yen
Net income 15.0 +27.5 billion yen
55
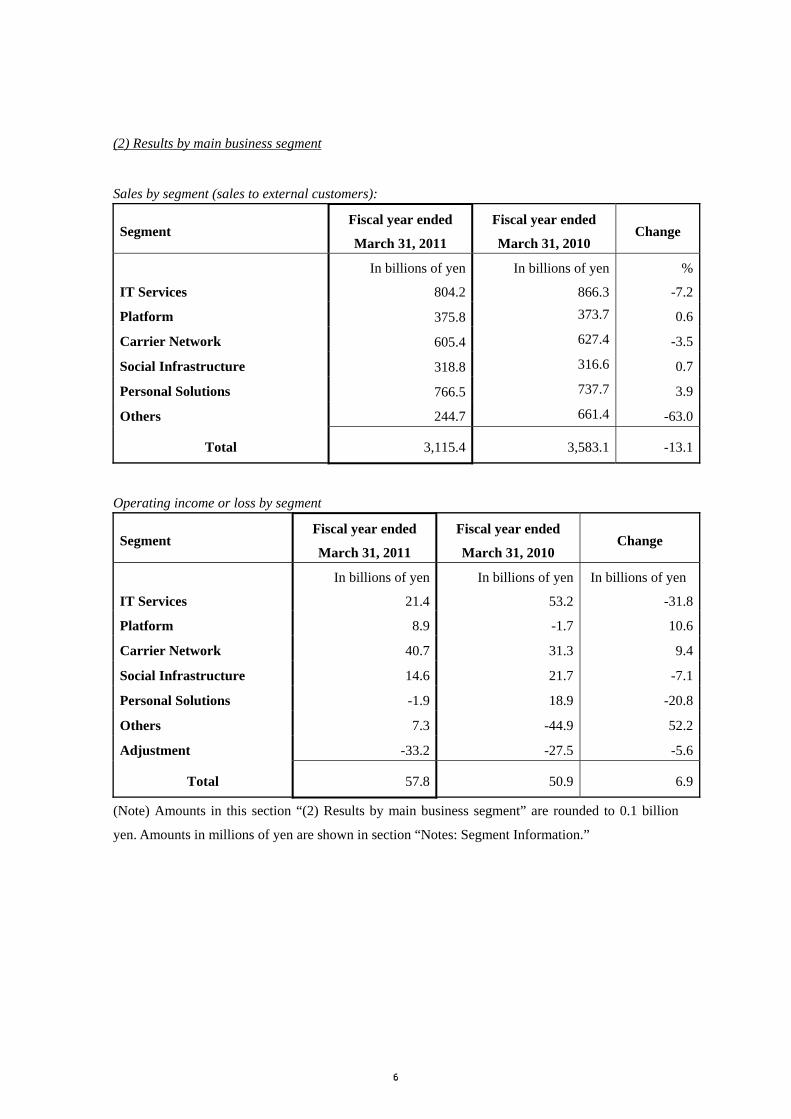
(2) Results by main business segment
Sales by segment (sales to external customers):
Segment Fiscal year ended
March 31, 2011
Fiscal year ended
March 31, 2010 Change
IT Services
In billions of yen
804.2
In billions of yen
866.3
%
-7.2
Platform 375.8 373.7 0.6
Carrier Network 605.4 627.4 -3.5
Social Infrastructure 318.8 316.6 0.7
Personal Solutions 766.5 737.7 3.9
Others 244.7 661.4 -63.0
Total 3,115.4 3,583.1 -13.1
Operating income or loss by segment
Segment Fiscal year ended
March 31, 2011
Fiscal year ended
March 31, 2010 Change
IT Services
In billions of yen
21.4
In billions of yen
53.2
In billions of yen
-31.8
Platform 8.9 -1.7 10.6
Carrier Network 40.7 31.3 9.4
Social Infrastructure 14.6 21.7 -7.1
Personal Solutions -1.9 18.9 -20.8
Others 7.3 -44.9 52.2
Adjustment -33.2 -27.5 -5.6
Total 57.8 50.9 6.9
(Note) Amounts in this section “(2) Results by main business segment” are rounded to 0.1 billion
yen. Amounts in millions of yen are shown in section “Notes: Segment Information.”
66

(Business segment figures in brackets below denote increases or decreases as compared with the
previous fiscal year.)
IT Services Business
Sales: 804.2 billion yen (-7.2%)
Operating Income (Loss): 21.4 billion yen (-31.8 billion yen)
In the IT Services business, sales were 804.2 billion yen, a decrease of 62.1 billion yen (-7.2%)
year-on-year, mainly impacted by the delayed recovery of IT investment in Japan and a decline in
large-scale projects, despite the steady growth of sales in cloud services and outsourcing.
Operating income (loss) worsened by 31.8 billion yen year-on-year, to an operating income of 21.4
billion yen, mainly owing to reduced sales, worsening profitability from heavy price competition and
an increase in non-profitable projects.
Platform Business
Sales: 375.8 billion yen (+0.6%)
Operating Income (Loss): 8.9 billion yen (+10.6 billion yen)
In the Platform business, sales were 375.8 billion yen, an increase of 2.1 billion yen (+0.6%)
year-on-year, mainly due to the steady growth of software sales, despite a decrease in hardware sales,
including servers.
Operating income (loss) improved by 10.6 billion yen year-on-year, to an operating income of 8.9
billion yen, mainly owing to an increase in sales and continued cost reductions.
77
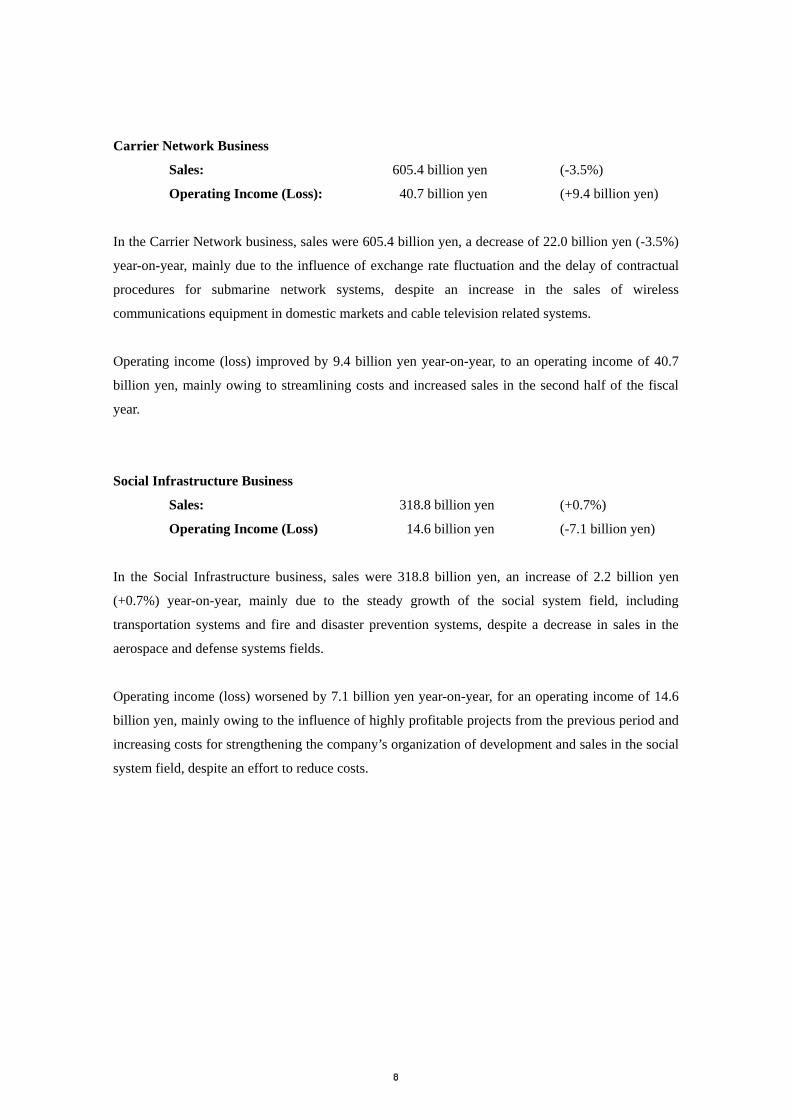
Carrier Network Business
Sales: 605.4 billion yen (-3.5%)
Operating Income (Loss): 40.7 billion yen (+9.4 billion yen)
In the Carrier Network business, sales were 605.4 billion yen, a decrease of 22.0 billion yen (-3.5%)
year-on-year, mainly due to the influence of exchange rate fluctuation and the delay of contractual
procedures for submarine network systems, despite an increase in the sales of wireless
communications equipment in domestic markets and cable television related systems.
Operating income (loss) improved by 9.4 billion yen year-on-year, to an operating income of 40.7
billion yen, mainly owing to streamlining costs and increased sales in the second half of the fiscal
year.
Social Infrastructure Business
Sales: 318.8 billion yen (+0.7%)
Operating Income (Loss) 14.6 billion yen (-7.1 billion yen)
In the Social Infrastructure business, sales were 318.8 billion yen, an increase of 2.2 billion yen
(+0.7%) year-on-year, mainly due to the steady growth of the social system field, including
transportation systems and fire and disaster prevention systems, despite a decrease in sales in the
aerospace and defense systems fields.
Operating income (loss) worsened by 7.1 billion yen year-on-year, for an operating income of 14.6
billion yen, mainly owing to the influence of highly profitable projects from the previous period and
increasing costs for strengthening the company’s organization of development and sales in the social
system field, despite an effort to reduce costs.
88
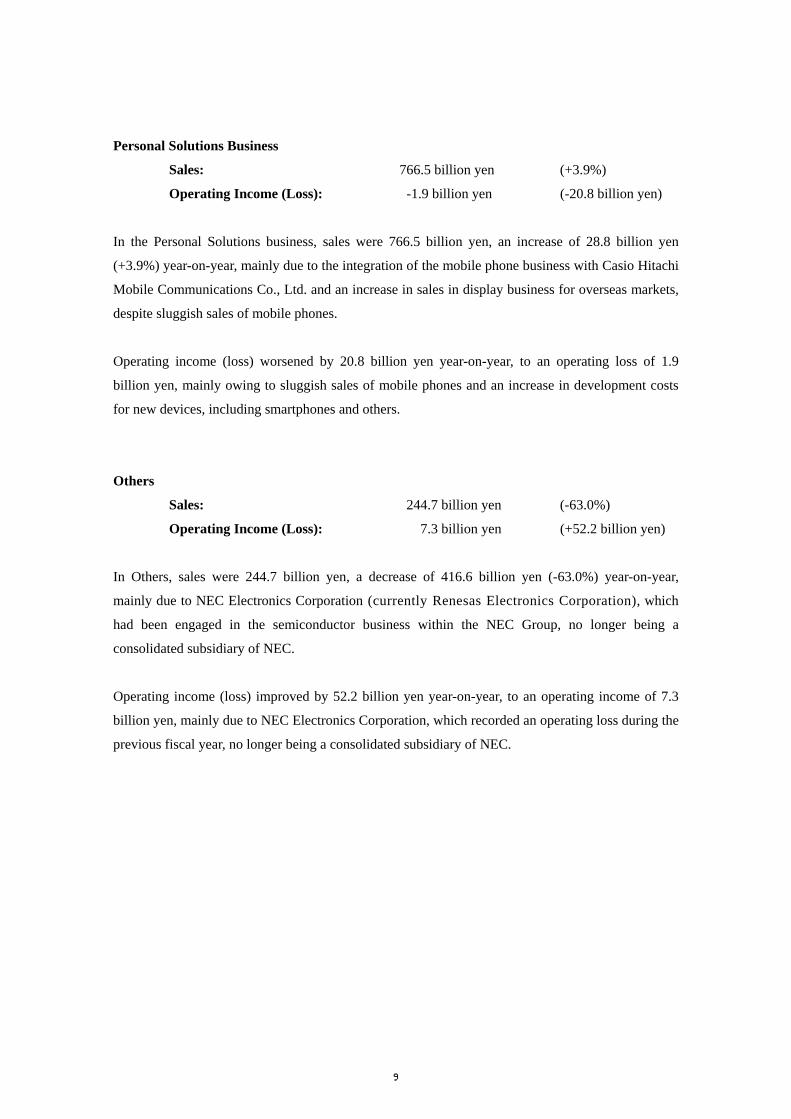
Personal Solutions Business
Sales: 766.5 billion yen (+3.9%)
Operating Income (Loss): -1.9 billion yen (-20.8 billion yen)
In the Personal Solutions business, sales were 766.5 billion yen, an increase of 28.8 billion yen
(+3.9%) year-on-year, mainly due to the integration of the mobile phone business with Casio Hitachi
Mobile Communications Co., Ltd. and an increase in sales in display business for overseas markets,
despite sluggish sales of mobile phones.
Operating income (loss) worsened by 20.8 billion yen year-on-year, to an operating loss of 1.9
billion yen, mainly owing to sluggish sales of mobile phones and an increase in development costs
for new devices, including smartphones and others.
Others
Sales: 244.7 billion yen (-63.0%)
Operating Income (Loss): 7.3 billion yen (+52.2 billion yen)
In Others, sales were 244.7 billion yen, a decrease of 416.6 billion yen (-63.0%) year-on-year,
mainly due to NEC Electronics Corporation (currently Renesas Electronics Corporation), which
had been engaged in the semiconductor business within the NEC Group, no longer being a
consolidated subsidiary of NEC.
Operating income (loss) improved by 52.2 billion yen year-on-year, to an operating income of 7.3
billion yen, mainly due to NEC Electronics Corporation, which recorded an operating loss during the
previous fiscal year, no longer being a consolidated subsidiary of NEC.
99
2. Consolidated Financial Condition
① Analysis of condition of assets, liabilities, net assets, and cash flow
Total assets were 2,628.9 billion yen as of March 31, 2011, a decrease of 308.7 billion yen as
compared with the end of the previous fiscal year. Current assets as of March 31, 2011 decreased by
200.4 billion yen compared with the end of the previous fiscal year to 1,442.6 billion yen and
noncurrent assets decreased by 108.3 billion yen compared with the end of the previous fiscal year to
1,186.4 billion yen, mainly due to a decrease in accounts receivable, inventory and property, plant
and equipment as a result of NEC Electronics Corporation no longer being a consolidated subsidiary,
despite investment in Renesas Electronics Corporation, which became an affiliate company
accounted for by the equity method, being recorded in “stocks of subsidiaries and affiliates.”
Total liabilities as of March 31, 2011 decreased by 252.2 billion yen as compared with the end of the
previous fiscal year, to 1,753.5 billion yen. This was mainly due to a decrease in accounts
payable-trade liabilities and accrued expenses as a result of NEC Electronics Corporation no longer
being a consolidated subsidiary, despite the issuance of commercial papers and bonds. The balance
of interest-bearing debt decreased by 53.8 billion yen as compared with the end of the previous fiscal
year, to 675.8 billion yen and the debt-equity ratio as of March 31, 2011 was 0.89 (an improvement
of 0.03 points as compared with the end of the previous fiscal year). The balance of net
interest-bearing debt as of March 31, 2011, obtained by offsetting the balance of interest-bearing
debt with the balance of cash and cash equivalents, amounted to 471.9 billion yen, an increase of
72.9 billion yen as compared with the end of the previous fiscal year. The net debt-equity ratio as of
March 31, 2011 was 0.62 (a worsening of 0.12 points as compared with the end of the previous
fiscal year).
Total net assets were 875.4 billion yen as of March 31, 2011, a decrease of 56.5 billion yen as
compared with the end of the previous fiscal year, mainly due to a decrease in minority interests.
As a result, the owner’s equity as of March 31, 2011 was 757.1 billion yen and owner’s equity ratio
was 28.8% (an improvement of 1.9 points as compared with the end of the previous fiscal year).
Net cash flows from operating activities for the fiscal year ended March 31, 2011 was a cash inflow
of 33.7 billion yen, a cash inflow worsening of 101.2 billion yen year-on-year mainly due to
worsening income before income taxes and minority interests.
1010
Net cash flows from investing activities for the fiscal year ended March 31, 2011 was a cash outflow
of 146.2 billion yen, an outflow increase of 105.0 billion yen year-on-year mainly due to decreased
inflows from the sales of stocks of subsidiaries and affiliates.
As a result, free cash flows (the sum of cash flows from operating activities and investing activities)
for the fiscal year ended March 31, 2011 totaled a cash outflow of 112.6 billion yen, a worsening of
206.2 billion yen year-on-year.
Net cash flows from financing activities for the fiscal year ended March 31, 2011 totaled a cash
inflow of 73.1 billion yen, mainly due to financing from the issuance of commercial papers and
bonds, despite the payment of long-term loans payable.
As a result, cash and cash equivalents decreased by 43.6 billion yen as compared with the end of the
previous fiscal year. Cash and cash equivalents amounted to 203.9 billion yen due to an additional
decrease of 83.1 billion yen resulting from change of the scope of consolidation and others.
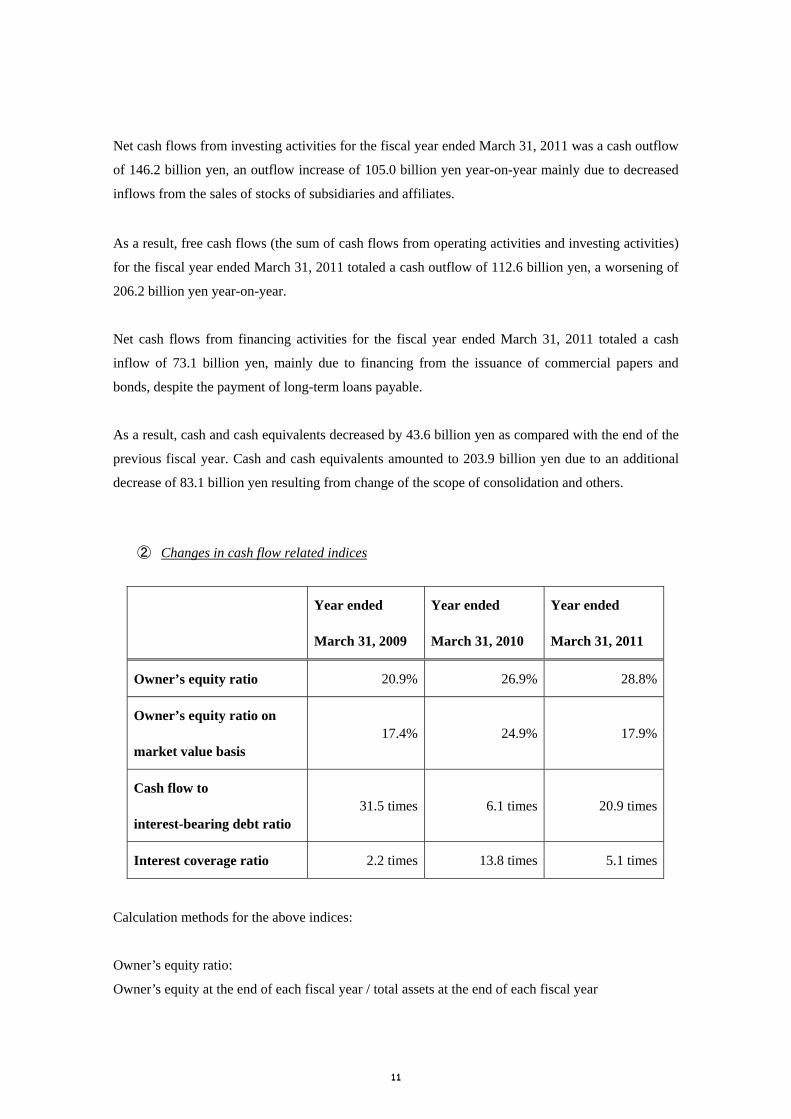
② Changes in cash flow related indices
Year ended
March 31, 2009
Year ended
March 31, 2010
Year ended
March 31, 2011
Owner’s equity ratio 20.9% 26.9% 28.8%
Owner’s equity ratio on
market value basis 17.4% 24.9% 17.9%
Cash flow to
interest-bearing debt ratio 31.5 times 6.1 times 20.9 times
Interest coverage ratio 2.2 times 13.8 times 5.1 times
Calculation methods for the above indices:
Owner’s equity ratio:
Owner’s equity at the end of each fiscal year / total assets at the end of each fiscal year
1111
Owner’s equity ratio on market value basis:
Aggregated market value of owner's equity at the end of each fiscal year / total assets at the end of
each fiscal year
Cash flow to interest-baring debt ratio:
Average balance of interest-bearing debt / cash flows from operating activities
* Average balance of interest-bearing debt = (balance of interest-bearing debt at the beginning of the
fiscal year + balance of interest-bearing debt at the end of the fiscal year) /2
Interest coverage ratio:
Cash flows from operating activities / interest expenses
(Notes)
1. The above indices are calculated using consolidated financial figures.
2. Aggregated market value of owner's equity is calculated using the outstanding number of shares
excluding treasury stock.
3. Fundamental Policy on Distribution of Earnings and Dividends for the Fiscal Year Ended March 31, 2011 and the Fiscal Year Ending March 31, 2012
As NEC needs to adopt a flexible policy in order to better respond to the rapidly changing business
environment, NEC considers, among other factors, the following factors in determining its cash
dividends: the profits earned in the relevant fiscal period; the financial outlook for the following
fiscal periods, the dividend payout ratio, and the internal demand for funds such as capital
expenditures.
Regrettably, NEC will not pay an annual dividend for the fiscal year ended March 31, 2011 in
consideration of the profits earned in the fiscal year ended March 31, 2011, the uncertain future
business environment and others.
For the fiscal year ending March 31, 2012, NEC has not yet determined its interim dividend or its
year-end dividend.
1212

In addition, NEC stipulates in its Articles of Incorporation that it may determine distribution of
surplus dividends flexibly through resolutions of the Board of Directors, and that record dates of
distribution of surplus dividends shall be March 31 and September 30.
1313
4. Risk Factors The NEC Group’s business is subject to many kinds of risks. The principal risks affecting the NEC
Group’s business are described briefly below.
① Risks related to economic conditions and financial markets
<1> Influence of economic conditions
The NEC Group’s business is dependent, to a significant extent, on the Japanese market. The NEC
Group’s sales to customers in Japan accounted for 84.6% of its total net sales in the fiscal year ended
March 31, 2011. The Japanese economy will decline significantly on a temporary basis due to the
Great East Japan Earthquake. A delayed economic recovery caused by continued supply chain
disruption and power shortages could have a material adverse effect not only on the NEC Group’s
business operations directly but also on the NEC Group’s operations’ results and financial conditions
due to an adverse effect on the NEC Group’s affiliated companies. The NEC Group’s business is also
influenced by the economic conditions of countries and regions including Asia, Europe and the United
States in which the NEC Group operates its business.
Uncertainties in the economy make it difficult to forecast future levels of economic activity. Because
the components of the NEC Group’s planning and forecasting depend upon estimates of economic
activity in the markets that the NEC Group serves, the prevailing economic uncertainty makes it more
difficult than usual to estimate its future income and required expenditures. If the NEC Group is
mistaken in its planning and forecasting, it will be more difficult for the NEC Group to respond
appropriately to changing market conditions.
<2> Volatile nature of the markets
The markets for some of the NEC Group’s products, including mobile handsets, personal computers,
and electronic devices, are highly volatile. Downturns have been characterized by diminished
demand, obsolete products excess inventories, accelerated erosion of prices, and periodic production
overcapacity. The volatile nature of the relevant markets may lead to future recurrences of downturns
with similar or more adverse effects on the NEC Group’s results of operations.
<3> Fluctuations in foreign currency exchange and interest rate
The NEC Group is exposed to risks of foreign currency exchange rate fluctuations. The NEC Group’s
consolidated financial statements, which are presented in Japanese yen, are affected by fluctuations in
foreign exchange rates. Changes in exchange rates affect the yen value of the NEC Group’s equity
investments and monetary assets and liabilities arising from business transactions in foreign
currencies. They also affect the costs and sales proceeds of products or services that are denominated
1414

in foreign currencies. Despite measures undertaken by the NEC Group to reduce, or hedge against,
foreign currency exchange risks, foreign exchange rate fluctuations may hurt the NEC Group’s
business, results of operations and financial condition. Depending on the movements of particular
foreign exchange rates, the NEC Group may be adversely affected at a time when the same currency
movements are benefiting some of its competitors.
The NEC Group is also exposed to risks of interest rate fluctuations, which may affect its overall
operational costs and the value of its financial assets and liabilities, in particular, long-term debt.
Despite measures undertaken by the NEC Group to hedge a portion of its exposure against interest rate
fluctuations, such fluctuations may increase the NEC Group’s operational costs, reduce the value of its
financial assets, or increase the value of its liabilities.
② Risks related to the NEC Group’s Management Policy
<1> Mid-term growth plan
While the NEC Group is implementing measures for expanding its business and improving its
profitability based on the mid-term growth plan, "V2012-Beyond boundaries, Toward our Vision-"
which was announced in February 2010, the NEC Group may not be able to successfully implement
strategies or measures based on this mid-term growth plan or realize all or part of the benefits that it
expects from them.
Any failure or unanticipated difficulties in implementing its strategies or measures based on the
mid-term growth plan could significantly disrupt the NEC Group’s operations and adversely affect its
results of operations, financial condition and reputation.
<2> Finance and profit fluctuations
The NEC Group’s results of operations for any quarter or year are not necessarily indicative of results
to be expected in future periods. The NEC Group’s results of operations have historically been, and
will continue to be, subject to quarterly and yearly fluctuations as a result of a number of factors,
including:
• the introduction and market acceptance of new technologies, products, and services;
• variations in product costs, and the mix of products sold;
• the size and timing of customer orders, which in turn will often depend upon the success of
customers’ businesses or specific products or services;
• the impact of acquired businesses and technologies;
• manufacturing capacity and lead times; and
• fixed costs.
1515
There are other trends and factors beyond the NEC Group’s control which may affect its results of
operations, and make it difficult to predict results of operations for a particular period. These include:
• adverse changes in the market conditions for the products and services that the NEC Group
offers;
• governmental decisions regarding the development and deployment of IT and communications
infrastructure, including the size and timing of governmental expenditures in these areas;
• the size and timing of capital expenditures by its customers;
• inventory practices of its customers;
• general conditions for IT and communication markets, and for the domestic and global
economies;
• changes in governmental regulations or policies affecting the IT and communications industries;
• adverse changes in the public and private equity and debt markets, and the ability of its customers
and suppliers to obtain financing or to fund capital expenditures; and
• adverse changes in the credit conditions of its customers and suppliers.
These trends and factors could have a material adverse effect on the NEC Group’s business, results of
operations and financial condition.
<3> Acquisitions and other business combinations and reorganizations
The NEC Group has completed and continues to seek appropriate opportunities for acquisitions and
other business combinations and reorganizations in order to expand its business and strengthen its
competitiveness. The NEC Group faces risks arising from acquisitions, business combinations and
reorganizations, which could adversely affect its ability to achieve its strategic goals. For example,
• The NEC Group may be unable to realize the growth opportunities, improvement of its financial
position, investment effect and other expected benefits by these acquisitions, business
combinations and reorganizations in the expected time period or at all;
• The planned transactions may not be completed as scheduled or at all due to legal or regulatory
requirements or contractual and other conditions to which such transactions are subject;
• Unanticipated problems could also arise in the integration process, including unanticipated
restructuring or integration expenses and liabilities, as well as delays or other difficulties in
coordinating, consolidating and integrating personnel, information and management systems,
and customer products and services;
• The combined or reorganized entities may not be able to retain existing customers and strategic
partners to the extent that they wish to diversify their suppliers for cost and risk management and
other purposes;
1616
• The combined or reorganized entities may require additional financial support from the NEC
Group;
• The diversion of management and key employees’ attention may detract from the NEC Group’s
ability to increase revenues and minimize costs;
• The goodwill and other intangible assets arising from the acquisitions and business
reorganizations are subject to amortization and impairment charges;
• NEC Group’s investments in the combined or reorganized entities are subject to valuation and
other losses; and
• The transactions may result in other unanticipated adverse consequences.
Any of the foregoing and other risks may adversely affect the NEC Group’s business, results of
operations, financial condition and stock price.
<4> Alliance with strategic partners
The NEC Group has entered into a number of long-term strategic alliances with leading industry
participants, both to develop new technologies and products and to manufacture existing and new
products. If the NEC Group’s strategic partners encounter financial or other business difficulties, if
their strategic objectives change or if they no longer perceive the NEC Group to be an attractive
alliance partner, they may no longer desire or be able to participate in the NEC Group’s alliances. The
NEC Group’s business could be hurt if the NEC Group is unable to continue one or more of its
alliances. The NEC Group participates in large projects where the NEC Group and various other
companies provide services and products that are integrated into systems to meet customer
requirements. If any of the services or products that any other company provides have any defects or
problems causing the integrated systems to malfunction or otherwise fail to meet customer
requirements, the NEC Group’s reputation and business could be harmed.
<5> Expansion of global business
The NEC Group’s strategies include expanding its business in markets outside Japan. In many of these
markets, the NEC Group faces entry barriers such as the existence of long-standing relationships
between its potential customers and their local suppliers, and protective regulations. In addition,
pursuing international growth opportunities may require the NEC Group to make significant
investments long before it realizes returns on the investments, if any. Increased investments may result
in expenses growing at a faster rate than revenues.
The NEC Group’s overseas projects and investments, particularly in China, could be adversely
affected by:
• exchange controls;
1717

• restrictions on foreign investment or the repatriation of income or invested capital;
• nationalization of local industries;
• changes in export or import restrictions;
• changes in the tax system or rate of taxation in the countries; and
• economic, social, and political risks.
In addition, difficulties in foreign financial markets and economies, particularly in emerging markets,
could adversely affect demand from customers in the affected countries. Because of these factors, the
NEC Group may not succeed in expanding its business in international markets. This could hurt its
business growth prospects and results of operations.
③ Risks related to the NEC Group’s business and operations
<1> Technological advances and response to customer needs
The markets for the products and services that the NEC Group offers are characterized by rapidly
changing technology, evolving technical standards, changes in customer preferences, and the frequent
introduction of new products and services. The development and commercialization of new
technologies and the introduction of new products and services will often make existing products and
services obsolete or unmarketable. The NEC Group’s competitiveness in the future will depend at
least in part on its ability to:
• keep pace with rapid technological developments and maintain technological leadership;
• enhance existing products and services;
• develop and manufacture innovative products in a timely and cost-effective manner;
• utilize or adjust to new products, services, and technologies;
• attract and retain highly capable technical and engineering personnel;
• accurately assess the demand for, and perceived market acceptance of, new products and services
that the NEC Group develops;
• avoid delays in developing or shipping new products;
• address increasingly sophisticated customer requirements; and
• have the NEC Group’s products integrated into its customers’ products and systems.
The NEC Group may not be successful in identifying and marketing product and service
enhancements, or offering and supporting new products and services, in response to rapid changes in
technologies and customer preferences. If the NEC Group fails to keep up with these changes, its
business, results of operations and financial condition will be significantly harmed. In addition, the
NEC Group may encounter difficulties in incorporating its technologies into its products in
1818
accordance with its customers’ expectations, which may adversely affect its relationships with its
customers, its reputation and revenues.
The NEC Group seeks to form and enhance alliances and partnerships with other companies to
develop and commercialize technologies that will become industry standards for the products that it
currently sells and plans to sell in the future. The NEC Group spends significant financial, human and
other resources on developing and commercializing such technologies. The NEC Group may not,
however, succeed in developing or commercializing such standard-setting technologies if its
competitors’ technologies are accepted as industry standards. In such case, the NEC Group’s
competitive position, reputation and results of operations could be adversely affected.
The process of developing new products entails many risks. The development process can be lengthy
and costly, and requires the NEC Group to commit a significant amount of resources well in advance
of sales. Technology and standards may change while the NEC Group is in the development stage,
rendering its products obsolete or uncompetitive before their introduction. The NEC Group’s newly
developed products may contain undetected errors that may be discovered after their introduction and
shipment. Those undetected errors could make the NEC Group liable for damages incurred by its
customers.
<2> Production process
The markets in which the NEC Group operates are characterized by the introduction of products with
short life cycles in a rapidly changing technological environment. Production processes of electronics
products are highly complex, require advanced and costly manufacturing facilities, and must
continuously be modified to improve efficiency and performance. Production difficulties or
inefficiencies might affect profitability or interrupt production, and the NEC Group may not be able to
deliver products on time in a cost-effective and competitive manner. If production is interrupted, the
NEC Group may not be able to shift production to other facilities quickly, and customers may
purchase products from other suppliers. The resulting shortage of manufacturing capacity for some
products could adversely affect the NEC Group’s ability to compete. The resulting reductions in
revenues could be significant.
Legal and practical restrictions on the termination of employees, union agreements, and other factors
limit the NEC Group’s ability during industry downturns to reduce its production capacity and costs in
order to adjust to reduced levels of demand. Conversely, during periods of increasing demand, the
NEC Group may not have sufficient capacity to meet customer orders. As a result, the NEC Group
may lose sales as customers turn to competitors who may be able to satisfy their increased demand.
1919
<3> Defects in products and services
The NEC Group faces risks arising from defects in its products and services. Many of its products and
services are used in “mission critical” situations where the adverse consequences of failure may be
severe, exposing it to even greater risk. Product and service defects could make the NEC Group liable
for damages incurred by its customers. Negative publicity concerning these problems could also make
it more difficult to convince customers to buy the NEC Group’s products and services.
In order to prevent the defects of products and services or the unprofitable projects, the NEC Group
takes thorough measures to control risks in projects such as system development projects from the
beginning of business negotiation, through understanding on customer’s confirmed system
requirements or technical difficulties, and quality control measures on hardware and software of
which systems consist. However, it is difficult to prevent them completely. The defects of its products
or services or the unprofitable projects could hurt the NEC Group’s business, results of operations and
financial condition.
<4> Material procurement
The NEC Group’s manufacturing operations depend on obtaining deliveries of raw materials,
components, equipment, and other supplies in a timely manner. In some cases, the NEC Group
purchases on a just-in-time basis. Because the products that the NEC Group purchases are often
complex or specialized, it may be difficult for the NEC Group to substitute one supplier for another or
one product for another. Some products are available only from a limited number of suppliers or a
single supplier. Although the NEC Group believes that supplies of the raw materials, components,
equipment, and other supplies that the NEC Group uses are currently adequate, shortages in critical
materials could occur due to an interruption in supply or an increase in industry demand. In addition,
a financial market disruption could pose liquidity or solvency risks for the NEC Group’s suppliers,
which could reduce its sources of supply or disrupt its supply chain. The NEC Group’s results of
operations would be hurt if it could not obtain adequate delivery of these supplies in a timely manner,
or if it had to pay significantly more for them. Reliance on suppliers and industry supply conditions
generally involve several risks, including:
• insolvency of, or other liquidity constraints affecting, key suppliers;
• the possibility of defective raw materials, components, equipment or other supplies, which can
adversely affect the reliability and reputation of the NEC Group’s products;
• a shortage of raw materials, components, equipment or other supplies, and reduced control over
delivery schedules, which can adversely affect the NEC Group’s manufacturing capacity and
efficiencies; and
2020
• an increase in the cost of raw materials, components, equipment and other supplies, which can
adversely affect the NEC Group’s profitability.
<5> Intellectual property rights
The NEC Group depends on its proprietary technology, and its ability to obtain patents and other
intellectual property rights covering its products, services, business models, and design and
manufacturing processes. The applications for patents and the maintenance of registered patents can
be a time and cost consuming process. The NEC Group’s patents could be challenged, invalidated, or
circumvented. The fact that the NEC Group holds many patents or other intellectual property rights
does not ensure that the rights granted under them will provide competitive advantages to the NEC
Group. For example, the protection afforded by the NEC Group’s intellectual property rights may be
undermined by rapid changes in technologies in the industries in which the NEC Group operates.
Similarly, there can be no assurance that claims allowed on any future patents will be broad enough to
protect the NEC Group’s technology. Effective patent, copyright, and trade secret protection may be
unavailable or limited in some countries, and the NEC Group’s trade secrets may be vulnerable to
disclosure or misappropriation by employees, contractors, and other persons. Further, pirated products
of inferior quality infringing the NEC Group’s intellectual property rights may damage its brand and
adversely affect sales of its products. Litigation, which could consume financial and management
resources, may be necessary to enforce the NEC Group’s patents or other intellectual property rights.
<6> Intellectual property licenses owned by third parties
Many of the NEC Group’s products are designed to include software or other intellectual property
licenses from third parties. While it may be necessary in the future to seek or renew licenses relating to
various aspects of the NEC Group’s products, the NEC Group believes that, based upon experience
and industry’s standard practices, these licenses can be obtained on commercially reasonable terms in
principle. There can be no assurance that the NEC Group will be able to obtain, on commercially
reasonable terms or at all, from third parties the licenses that the NEC Group will need.
<7> Intense competition
Competition creates an unfavorable pricing environment for the NEC Group in many of the markets in
which it operates. Competition places significant pressure on the NEC Group’s ability to maintain
gross margins and is particularly acute during market slowdowns. The entry of additional competitors
into the markets in which the NEC Group operates increases the risk that its products and services will
become subject to intense price competition. Some of the NEC Group’s competitors mainly in Asian
countries may have an advantage of lower production cost than the NEC Group does and may be able
to compete for customers more effectively than it can in terms of price. In recent years, the time
2121

between the introduction of a new product developed by the NEC Group and the production of the
same or a comparable product by its competitors has become shorter. This has increased the risk that
the products the NEC Group offers will become subject to intense price competition sooner than in the
past.
The NEC Group has many competitors in Japan and other countries, ranging from large multinational
corporations to a number of relatively small, rapidly growing, and highly specialized companies.
Unlike many of the NEC Group’s competitors, however, it operates in many businesses and competes
with companies that specialize in one or more of its product or service lines. As a result, the NEC
Group may not be able to fund or invest in some of its businesses as much as its competitors can, and
it may not be able to change or take advantage of market opportunities as quickly or as well as they
can.
The NEC Group sells products and services to some of its current and potential competitors. For
example, the NEC Group receives orders from, and provides solutions to, competitors that further
integrate or otherwise use its solutions for large projects for which such competitors are engaged as the
primary solutions provider. If these competitors cease to use the NEC Group’s solutions for such large
projects for competitive or other reasons, the NEC Group’s business could be harmed.
<8> Dependence on the NTT Group
The NEC Group derived approximately 14.6% of its net sales in the fiscal year ended March 31, 2011
from the NTT group (Nippon Telegraph and Telephone Corporation and its affiliates including NTT
DOCOMO, INC.). If the NTT group reduces its level of capital expenditures or current procurement
or shifts its investment focus as a result of significant business or financial problems or otherwise, the
NEC Group’s business, results of operations and financial condition may be adversely affected. In
addition, the NEC Group’s business may be adversely affected if the NTT group begins to
manufacture products that the NEC Group supplies or acquires its competitors.
<9> Risks related to customers’ financial difficulties
The NEC Group sometimes provide vendor financing to its customers or offer customers extended
payment terms or other forms of financing to assist their purchase of the NEC Group’s products and
services. If the NEC Group is unable to provide or facilitate such payment arrangements or other
forms of financing to its customers on terms acceptable to them or at all, due to financial difficulties or
otherwise, the NEC Group’s results of operations could be adversely affected. In addition, many of the
NEC Group’s customers purchase products and services from the NEC Group on payment terms that
provide for deferred payment. If the NEC Group’s customers for whom it has extended payment terms
2222

or provided other financing terms, or from whom it has substantial accounts receivable, encounter
financial difficulties or inability to access credit from others, and are unable to make payments on time,
the NEC Group’s business, results of operations and financial condition could be adversely affected.
<10> Retention of personnel
Like all technology companies, the NEC Group must compete for talented employees to develop its
products, services and solutions. As a result, the NEC Group’s human resources organization focuses
significant efforts on attracting and retaining individuals in key technology positions. If the NEC
Group experiences a substantial loss of, or an inability to attract, talented personnel, it may experience
difficulty in meeting its business objectives.
<11> Financing
The NEC Group’s primary sources of funds are cash flows from operations, borrowings from banks
and other institutional lenders, and funding from the capital markets, such as offerings of commercial
paper and other debt securities. A downgrade in the NEC Group’s credit ratings could result in
increases in its interest expenses and could have an adverse impact on its ability to access the
commercial paper market or other debt markets, which could have an adverse effect on the NEC
Group’s financial position and liquidity.
A failure of one or more of the NEC Group’s major lenders, a decision by one or more of them to stop
lending to the NEC Group or instability in the capital markets could have an adverse impact on the
NEC Group’s access to funding. If the NEC Group fails to obtain external financing on terms
acceptable to it, or at all, or to generate sufficient cash flows from its operations or sales of its assets,
when necessary, the NEC Group will be unable to fulfill its obligations, and its business will be
materially adversely affected. In addition, to the extent the NEC Group finances its activities with
additional debt, the NEC Group may become subject to financial and other covenants that may restrict
its ability to pursue its growth strategy.
④ Risks related to internal control, legal proceedings, laws and governmental policies
<1> Internal control
The NEC Group is taking action to guarantee the accuracy of its financial reporting by strengthening
its internal controls with expanding documentation of the business process and implementing stronger
internal auditing. However, even effective internal control systems can provide only reasonable
assurance with respect to the preparation and fair presentation of financial statements. For example,
the inherent limitations of internal control systems include fraud, human error, or circumvention of
controls, such as through collusion among multiple employees. In addition, the systems may not be
2323
able to effectively deal with changes in the business environment unforeseen at the time that the
systems were implemented or with non-routine transactions. The NEC Group’s established business
processes may not function effectively, and fraudulent acts, such as false financial reporting or
embezzlement, or inadvertent mistakes may occur. Such events may require restatement of financial
information and could adversely affect the NEC Group’s financial condition or results of operations.
The NEC Group’s reputation in the financial markets may also be damaged as a result of these events.
In addition, if any administrative or judicial sanction is issued against the NEC Group as a result of
these events, it may lose business opportunities.
If the NEC Group identifies a material weakness in its internal control systems, the NEC Group may
incur significant additional costs for remedying such weakness. Despite its efforts by the NEC Group
to continually improve and standardize its business processes from the perspective of ensuring
effective operations and enhancing efficiency, it is difficult to design and establish common business
processes since the NEC Group operates in a diverse range of countries and regions, using varying
business processes. Consequently, its efforts by the NEC Group to further improve and standardize its
business processes may continue to occupy significant management and human resources and the
NEC Group may incur considerable financial costs.
<2> Legal proceedings
From time to time, the NEC Group companies are involved in various lawsuits and legal proceedings,
including intellectual property infringement claims. Due to the existence of a large number of
intellectual property rights in the fields in which the NEC Group operates and the rapid rate of
issuance of new intellectual property rights, it is difficult to completely judge in advance whether a
product or any of its components may infringe upon the intellectual property rights of others.
Whether or not intellectual property infringement claims against the NEC Group companies have
merit, significant financial and management resources may be required to defend the NEC Group from
such claims. If an intellectual property infringement claim by a third party is successful and the NEC
Group could not obtain a license of technology which is subject of the infringement claim or any
substitution thereof, it could have a material adverse effect on the NEC Group’s business, results of
operations and financial condition.
The NEC Group may also from time to time be involved in various lawsuits and legal proceedings
other than intellectual property infringement claims.
NEC has been subject to the investigation by the Brazilian competition authority in connection with
the potential violation of the Brazilian competition law in the DRAM industry. In Canada, some of
2424

the NEC group companies have been named as one of the defendants in a class action civil antitrust
lawsuit seeking damages for alleged violation of antitrust laws in the DRAM industry.
The NEC Group companies have been subject to the investigation in connection with potential
violation of the antimonopoly laws (antitrust laws, competition laws) in the TFT LCD module industry
conducted by the U.S. Department of Justice (“DOJ”), the European Commission, the Korea Fair
Trade Commission and the Competition Bureau of Canada. In December 2010, the European
Commission announced that it imposed fines on Korean and Taiwanese companies, but the NEC
Group has not been subject to such fines.
Furthermore, in the United States, NEC has been named as one of the defendants in a class action
lawsuit for alleged violation of antitrust laws in the optical disk drive industry. Some defendants of
the lawsuit have been ordered to provide information to DOJ, but NEC has not received such an
order.
It is difficult to foresee the results of legal actions and proceedings currently involving the NEC Group
or of those which may arise in the future, and an adverse result in these matters could have a significant
negative effect on the NEC Group’s business, results of operations and financial condition. In addition,
any legal or administrative proceedings which the NEC Group is subject to could require the
significant involvement of senior management of the NEC Group, and may divert management
attention from the NEC Group’s business and operations.
<3> Laws and governmental policies
In many of the countries in which the NEC Group operates, its business is subject to various risks
associated with unexpected regulatory changes, uncertainty in the application of laws and
governmental policies and uncertainty relating to legal liabilities. Substantial changes in the regulatory
or legal environments, including the economic, tax, defense, labor, spending and other policies of the
governments of Japan and other jurisdictions in which the NEC Group operates could adversely affect
its business, results of operations and financial condition.
Changes in Japanese and international telecommunications regulations and tariffs, including those
pertaining to Internet-related businesses and technologies, could affect the sales of the NEC Group’s
products or services, and this could adversely affect its business, results of operations and financial
condition.
2525
<4> Environmental laws and regulations
The NEC Group’s operations are subject to many environmental laws and regulations governing,
among other things, air emissions, wastewater discharges, the use and handling of hazardous
substances, waste disposal, chemical substances in products, product recycling, soil and ground water
contamination and global warming. The NEC Group faces risks of environmental liability arising
from its current, historical, and future manufacturing activities. The NEC Group endeavors to comply
with laws and government policies, establishing self-management norms and conducting daily
inspections and environmental auditing in accordance with its internal environmental policies.
However, costs associated with future additional and stricter environmental compliance or
remediation obligations could adversely affect the NEC Group’s business, results of operations and
financial condition.
<5> Tax practice
The NEC Group’s effective tax rate could be adversely affected by: earnings being lower than
anticipated in countries that have lower tax rates and higher than anticipated in countries that have
higher tax rates; changes in the valuation of the NEC Group’s deferred tax assets and liabilities;
transfer pricing adjustments; tax effects of nondeductible compensation; or changes in tax laws,
regulations, accounting principles or interpretation thereof in the various jurisdictions in which the
NEC Group operates. Any significant increase in the NEC Group’s future effective tax rates could
reduce net income for future periods.
The NEC Group currently carries deferred tax assets resulting from tax loss carryforwards and
deductible temporary differences, both of which will reduce its taxable income in the future.
However, the deferred tax assets may only be realized against taxable income. The amount of the NEC
Group’s deferred tax assets that is considered realizable could be reduced from time to time if
estimates of future taxable income from its operations and tax planning strategies during the
carryforward period are lower than forecasted, due to further deterioration in market conditions or
other circumstances. In addition, the amount of the NEC Group’s deferred tax assets could be
reduced due to changes in tax laws, regulations or accounting principles related to future deductions
of income tax rates. Any such reduction will adversely affect the NEC Group’s income for the period
of the adjustment.
Furthermore, the NEC Group is subject to continuous audits and examination of its income tax returns
by tax authorities of various jurisdictions. The NEC Group regularly assesses the likelihood of adverse
outcomes resulting from these audits and examinations to determine the adequacy of its provisions for
2626

income taxes. There can be no assurance that the outcomes of these audits and examinations will not
have an adverse effect on the NEC Group’s results of operations and financial condition.
<6> Information management
The NEC Group stores a voluminous amount of personal information and confidential information in
the regular course of its business. There have been many cases where such information and records in
the possession of corporations and institutions were leaked or improperly accessed. If personal or
confidential information in the NEC Group’s possession about its customers or employees is leaked or
improperly accessed and subsequently misused, it may be subject to liability and regulatory action,
and its reputation and brand value may be damaged.
The NEC Group is required to handle personal information in compliance with the Personal
Information Protection Law of Japan. The NEC Group may have to provide compensation for
economic loss and emotional distress arising out of a failure to protect such information. The cost and
operational consequences of implementing further data protection measures could be significant. In
addition, incidents of unauthorized disclosure could create a negative public perception of the NEC
Group’s operations, systems or brand, which may in turn decrease customer and market confidence in
the NEC Group and materially and adversely affect its business, results of operations and financial
condition.
⑤ Other Risks
<1> Natural and fire disasters
Natural disasters, fires, public health issues, armed hostilities, terrorism and other incidents, whether
in Japan or any other country in which the NEC Group operate, could cause damage or disruption to
the NEC Group, its suppliers or customers, or could create political or economic instability, any of
which could harm its business. For example, several of the NEC Group’s facilities in Japan could be
subject to catastrophic loss caused by earthquakes. The spread of unknown infectious diseases, such as
a new type of influenza virus or a worsening of the H1N1 pandemic, could affect adversely the NEC
Group’s operations by rendering its employees unable to work, reducing customer demand or by
disrupting its suppliers’ operations. In addition, under the circumstance where network and
information systems become more important to operating activities of the NEC Group, such systems
are vulnerable to shutdowns caused by unforeseen events such as power outages or natural disasters or
terrorism, hardware or software defects, or computer viruses and computer hacking. Although the
NEC Group has various measures in place, including the earthquake-resistant reinforcement of its
principal facilities in Japan, periodic training drills for employees and redundant back-up information
systems, and have adopted and implemented a group-wide business continuity plan outlining
2727
countermeasures to be taken in response to these events, any of these events, over which the NEC
Group has little or no control, could cause a decrease in demand for its products or services, make it
difficult or impossible for the NEC Group to deliver products or for its suppliers to deliver components,
require large expenditures to repair or replace its facilities or create delays and inefficiencies in its
supply chain.
<2> Accounting policies
The methods, estimates and judgments that the NEC Group uses in applying in its accounting policies
could have a significant impact on its results of operations. Such methods, estimates and judgments
are, by their nature, subject to substantial risks, uncertainties and assumptions, and factors may arise
over time that lead the NEC Group to change its methods, estimates and judgments. Changes in those
methods, estimates and judgments could significantly affect the NEC Group’s results of operations.
Due to the volatility in the financial markets and overall economic uncertainty, the actual amounts
realized in the future on the NEC Group’s debt and equity investments may differ significantly from
the fair values currently assigned to them.
<3> Retirement benefit obligations
Changes in discount rates and actuarial assumptions on which the calculation of projected benefit
obligations are based may have an adverse effect on the NEC Group’s financial condition and its
results of operations. For example, any future reduction of discount rates may cause unrecognized
actuarial losses, or the NEC Group may experience unrecognized prior service costs in the future
resulting from amendments to the plans. Changes in the interest rate environment and other factors
may also adversely affect the amount of the NEC Group’s unfunded retirement benefit obligations and
the resulting annual amortization expense.
<4> Sale of NEC’s common stock in the United States of America
As a result of the failure to file annual reports on Form 20-F with the Securities and Exchange
Commission in the United States of America (the “SEC”) for the fiscal year ended March 31, 2006
and thereafter, American depositary shares of NEC were delisted from the NASDAQ Stock Market in
October 2007. In addition, NEC was subject to an informal inquiry by the SEC concerning matters
including its failure to file annual reports on Form 20-F for the fiscal year ended March 31, 2006 and
thereafter. In June 2008, NEC entered into a settlement agreement with the SEC, and as part of the
settlement, the SEC issued an order under Section 12(j) of the U.S. Securities and Exchange Act of
1934 (the “Exchange Act”). The SEC ordered that (a) NEC ceases and desists from the violations of
certain provisions of the Exchange Act because the SEC found that certain of its actions violated
certain provisions of the Exchange Act, and (b) the registration under the Exchange Act of its common
2828
stock and American depositary shares be revoked. NEC did not admit or deny the findings by the SEC
set forth in the order. No fine or other monetary payment was required under the order. As a result of
the revocation, no broker or dealer worldwide and no member of a U.S. securities exchange may make
use of the mails or any means or instrumentality of interstate commerce in the United States to effect
any transaction in, or to induce the purchase or sale of, shares of common stock or American
depositary shares of NEC. Accordingly, it may be difficult for shareholders of NEC to sell or purchase
the shares of NEC’s common stock in the United States of America, and this situation may continue in
the future.
2929
Management Policy
1. Fundamental Management Policy
Based on the NEC Group Corporate Philosophy, “NEC strives through “C&C” to help advance
societies worldwide towards deeper mutual understanding and the fulfillment of human potential,” the
NEC Group aims to become a global company by contributing to the development of an information
society through “C&C,” the integration of Computers (Information Technology) and Communications
(Telecommunication Technology).
To pursue this philosophy, the NEC Group jointly adopted the “NEC Group Vision 2017,”
which represents the NEC Group’s desired image of society and group business in 2017, as
well as the “NEC Group Values” of shared behavioral principles and values that are necessary
to realize the NEC Group’s vision.
:NEC Group Vision 2017
“To be a leading global company leveraging the power of innovation to realize an information society
friendly to humans and the earth”
The NEC Group aims to lead the world in realizing an information society that is friendly to people
and the earth, where information and communication technology help people as an integral part of
their lives, and act in harmony with the global environment through innovation that unites the powers
of intelligence, expertise and technology inside and outside the NEC Group.
NEC Group Co :re Values
“Passion for Innovation,” “Self-help,” “Collaboration,” “Better Products, Better Services”
The NEC Group will strive to provide satisfaction and inspiration for our customers through the
efforts of self-reliant individuals, motivated by a “passion for innovation,” that work as part of a team
to continuously pursue the provision of better products and services. This mentality of “Better
Products, Better Services”- not settling for less than the best - has been shared among employees since
the establishment of the NEC Group. The NEC Group aims to pursue its Corporate Philosophy and
realize the Group Vision through actions based on the Values that have been passed down and fostered
over the 100-year history of the NEC Group.
3030

Finally, the NEC Group aims for sustained growth for society and business through efforts to increase
its corporate value by practicing the “NEC Way” which systemizes the structure of the NEC Group’s
management activities such as Corporate Philosophy, Vision, Core Values, Charter of Corporate
Behavior, Code of Conduct and its drive to bring satisfaction to all of its stakeholders, including
shareholders, customers, and employees alike.
2. Management Indicator Goals
The NEC Group aims to realize certain operating results as a leading global corporate group, and
attaches paramount importance to ROE as a management indicator for improving profitability.
Although the NEC Group posted a net loss in the fiscal year ended March 31, 2011, the NEC Group
will aim for net income improvements in the next fiscal year.
NEC is also seeking to achieve an ROE of 10% in the fiscal year ending March 31, 2013 through its
mid-term growth plan, “V2012 - Beyond boundaries, Toward our Vision -,” as announced in
February 2010.
3. Middle and Long Term Management Strategy
The NEC Group outlined that it aims to achieve the “NEC Group Vision 2017” through
customer-driven solutions leveraging our competitive strength in the integration of IT and networks
in its mid-term growth plan, “V2012 - Beyond boundaries, Toward our Vision -.” Basing the
mid-term growth plan “V2012” as a milestone for achieving the “NEC Group Vision 2017,” the
NEC Group strives to accelerate its business activities focused on expanding its business and
improving its profitability while moving into the “cloud era.”
4. Challenges to be Addressed by the NEC Group
During this first year of the mid-term growth plan “V2012,” although the NEC Group took
measures to implement its key strategic policies in support of “V2012,” “Promotion of C&C
Cloud Strategy,” “Global Business Expansion,” and “New Business Creation,” the NEC
Group was unable to achieve its original targets due to an inability to quickly implement
strategies for the construction of a global business structure or the development of new
products and services for business expansion.
3131

In the fiscal year ending March 31, 2012, the NEC Group will concentrate on business expansion
while also accelerating its efforts to strengthen profitability as part of its mid-term growth plan
“V2012” and the succeeding “NEC Group Vision 2017.”
In terms of business expansion, the NEC Group will first dedicate itself to three key strategic
policies in support of “V2012.”
The NEC Group is capitalizing on its strengths in both the IT and Network fields to provide
total solutions that include the provision of cloud services for enterprises and local
governments, IT platforms for the provision of cloud services, sensors that handle a wide
variety of electric information as electronic data, and multifunction terminals. Furthermore,
the NEC Group is providing communications infrastructure, including high speed, high
capacity mobile communications systems, in anticipation of increased communications demand from
the spread of multifunction terminals, such as smartphones and tablet devices. This
communications infrastructure will be the platform for the provision of various cloud
services.
Looking forward, the NEC Group seeks to leverage its achievements and know-how to enhance its
lineup of the most suitable cloud services for a full range of industries, including government offices,
manufacturers and distributors, and to drive the expansion of sales. Furthermore, the NEC Group
will utilize the technologies and know-how cultivated through the group’s internal implementation
of cloud services for core IT systems in order to win orders from customers for additional mission
critical cloud service development. Moreover, the NEC Group will strengthen its international
business coordination in order to expand cloud service sales on a global scale. The NEC Group will
drive the promotion of its “C&C Cloud Strategy,” including its provision of cloud services for
mobile environments, by capitalizing on the NEC Group’s wireless technology strengths.
Regarding global business, the NEC Group aims to expand business by executing decisions quickly
and effectively, and by promoting operations through the unified regional leadership of five regional
headquarters covering North America, Latin America, Greater China, APAC (Asia Pacific) and
EMEA (Europe, Middle East, Africa), accelerating the transfer of responsibility to local subsidiaries,
localizing the management layer and advancing personnel policies. The NEC Group will devote
particular attention to the educational, environmental, energy, medical and public safety fields which
are forecast to experience particularly high growth in emerging markets, including Asia.
3232
In terms of new business, the NEC Group aims to increase sales for the business of lithium-ion
rechargeable batteries for automobiles together with Nissan Motor Co., Ltd. by strengthening
competitive power through expanded production capacity, improved quality, advanced price
competitiveness and reduced lead time. Furthermore, the NEC Group is also leveraging these
technologies for automobile oriented lithium-ion rechargeable batteries to expand sales outside of
the automotive field. Moreover, in the smart grid field, business ties are steadily being formed from
the results of verification trials conducted in the fiscal year ended March 31, 2011 for energy
management systems for homes and businesses as well as trials for large-scale energy storage
systems for energy distribution.
In the area of multifunction terminals, including smartphones and tablet devices, the NEC Group
seeks to provide the products utilizing its technologies and know-how to support a wide range of
needs while the NEC Group forms additional partnerships in order to further drive the full
development of new business.
Additionally, the NEC Group focuses on effectively combining its wide range of assets, including
products, services and technologies, in order to create new business opportunities as “One NEC.”
In terms of reinforcing profitability, the NEC Group seeks to reduce non-profitable projects by
strengthening the risk management regarding its project profitability as well as its contract
conditions. Moreover, the company aims to fully engage in quality control. In order to maximize its
profits, the NEC Group will continue to promote cost reductions and to drive the operational
efficiency of indirect departments.
To all of those impacted by the Great East Japan Earthquake, the NEC Group is contributing towards
ongoing recovery efforts by concentrating its technologies and assets as “One NEC.” Specifically,
the NEC Group is utilizing its IT and Network strength to reestablish communications infrastructure,
including wireless communications, in preparation for future disasters. The NEC Group is also
providing cloud services for local governments that enable the use of information systems through
networks, as well as providing cloud services that enable information sharing between hospitals. All
of these are part of the NEC Group’s efforts towards the realization of a safe and secure society that
uses information and communications technology (ICT) to create an environment where services can
be utilized at any time, from any location. The NEC Group leverages its technologies and know-how
to contribute to energy policies through lithium-ion rechargeable batteries for automobiles, energy
management systems that optimize the energy of homes and businesses and energy conserving
products such as an energy conserving server.
33
Additionally, focusing on comprehensive compliance, the NEC Group will continue its ongoing
maintenance of internal control systems as well as concentrating on the reinforcement of
consolidated operational management as “One NEC.”
The NEC Group will devote its full attention to implementing these measures, which target
expanded business and reinforced earnings, while on the path to realizing an “information society
friendly to humans and the earth.”
3434
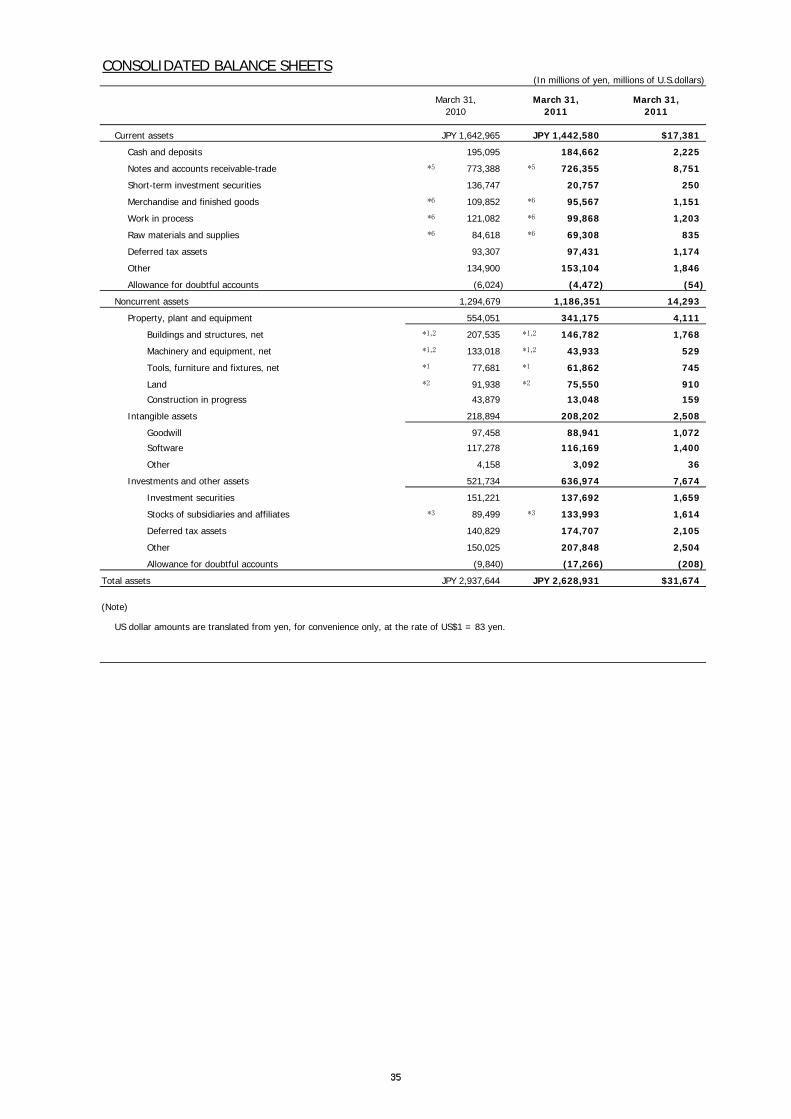
CONSOLIDATED BALANCE SHEETS(In millions of yen, millions of U.S.dollars)
March 31,2010
March 31,2011
March 31,2011
Current assets JPY 1,642,965 JPY 1,442,580 $17,381
Cash and deposits 195,095 184,662 2,225
Notes and accounts receivable-trade 773,388 726,355 8,751
Short-term investment securities 136,747 20,757 250
Merchandise and finished goods 109,852 95,567 1,151
Work in process 121,082 99,868 1,203
Raw materials and supplies 84,618 69,308 835
Deferred tax assets 93,307 97,431 1,174
Other 134,900 153,104 1,846
Allowance for doubtful accounts (6,024) (4,472) (54)
Noncurrent assets 1,294,679 1,186,351 14,293
Property, plant and equipment 554,051 341,175 4,111
Buildings and structures, net 207,535 146,782 1,768
Machinery and equipment, net 133,018 43,933 529
Tools, furniture and fixtures, net 77,681 61,862 745
Land 91,938 75,550 910
Construction in progress 43,879 13,048 159
Intangible assets 218,894 208,202 2,508
Goodwill 97,458 88,941 1,072
Software 117,278 116,169 1,400
Other 4,158 3,092 36
Investments and other assets 521,734 636,974 7,674
Investment securities 151,221 137,692 1,659
Stocks of subsidiaries and affiliates 89,499 133,993 1,614
Deferred tax assets 140,829 174,707 2,105
Other 150,025 207,848 2,504
Allowance for doubtful accounts (9,840) (17,266) (208)
Total assets JPY 2,937,644 JPY 2,628,931 $31,674
(Note)
US dollar amounts are translated from yen, for convenience only, at the rate of US$1 = 83 yen.
*5
*1,2
*1,2
*1
*3
*5,6
*1,2
*1,2
*1
*3
*2*2
*5
*1,2
*1,2
*1
*3
*2
*6
*6
*6
*6
*6
*6
3535

CONSOLIDATED BALANCE SHEETS (CONTINUED)(In millions of yen, millions of U.S.dollars)
March 31,2010
March 31,2011
March 31,2011
Current liabilities JPY 1,278,147 JPY 1,180,528 $14,223
Notes and accounts payable-trade 522,533 464,529 5,597
Short-term loans payable 69,163 48,780 588
Commercial papers 21,998 163,978 1,976
Current portion of long-term loans payable 169,507 13,245 160
Current portion of bonds 19,830 - -
Current portion of convertible bonds - 97,669 1,177
Accrued expenses 175,660 160,559 1,934
Advances received 65,550 58,437 704
Provision for product warranties 27,887 24,827 299
Provision for directors' bonuses 262 266 3
Provision for loss on construction contracts and others 14,088 9,763 118
Provision for loss on guarantees 10,985 - -
Provision for business structure improvement 11,602 7,138 86
Provision for contingent loss 10,886 3,989 48
Other 158,196 127,348 1,533
Noncurrent liabilities 727,585 572,962 6,903
Bonds payable 50,005 200,000 2,410
Convertible bonds 97,669 - -
Bonds with subscription rights to shares 110,000 - -
Long-term loans payable 158,876 137,846 1,661
Deferred tax liabilities 8,913 1,125 14
Provision for retirement benefits 237,645 182,022 2,193
Provision for product warranties 1,566 2,062 25
Provision for loss on repurchase of computers 9,355 7,620 92
Provision for recycling expenses of personal computers 6,537 6,004 72
Provision for business structure improvement 1,139 1,326 16
Provision for contingent loss 11,163 8,810 106
Other 34,717 26,147 314
Total liabilities 2,005,732 1,753,490 21,126
Shareholders' equity 803,552 780,045 9,399
Capital stock 397,199 397,199 4,785
Capital surplus 192,843 192,837 2,324
Retained earnings 216,439 192,943 2,325
Treasury stock (2,929) (2,934) (35)
Accumulated other comprehensive income (12,648) (22,991) (277)
Valuation difference on available-for-sale securities 10,218 4,167 50
Deferred gains or losses on hedges 61 132 2
Foreign currency translation adjustment (22,927) (27,290) (329)
Subscription rights to shares 93 33 0
Minority interests 140,915 118,354 1,426
Total net assets 931,912 875,441 10,548
Total liabilities and net assets JPY 2,937,644 JPY 2,628,931 $31,674
*2
*2
*2
*2
*2
*2
3636

CONSOLIDATED STATEMENTS OF INCOME
Net sales JPY 3,583,148 JPY 3,115,424 $37,535
Cost of sales 2,492,403 2,199,973 26,505
Gross profit 1,090,745 915,451 11,030
Selling, general and administrative expenses 1,039,840 857,631 10,333
Operating income (loss) 50,905 57,820 697
Non-operating income 56,547 16,953 204
Interest income 1,337 1,327 16
Dividends income 4,152 4,118 50
Reversal of provision for contingent loss 30,853 - -
Equity in earnings of affiliates 7,336 - -
Other 12,869 11,508 138
Non-operating expenses 58,023 74,732 901
Interest expenses 9,736 6,614 80
Equity in losses of affiliates - 38,533 464
Retirement benefit expenses 14,441 12,057 145
Foreign exchange losses 1,953 1,488 18
Loss on abandonment of noncurrent assets 8,249 - -
Provision for contingent loss 6,496 - -
Other 17,148 16,040 194
Ordinary income 49,429 41 0
Extraordinary income 31,511 28,270 341
Gain on contribution of securities to retirement benefit trust - 19,206 232
Gain on sales of investment securities 537 2,492 30
Gain on sales of subsidiaries and affiliates' stocks 22,383 2,299 28
Reversal of provision for loss on guarantees 3,312 1,557 19
Gain on sales of noncurrent assets 4,225 1,266 15
Reversal of provision for recycling expenses of personal computers
1,024 1,193 14
Gain on transfer of business - 249 3
Gain on reversal of subscription rights to shares 30 8 0
Extraordinary loss 25,286 43,998 530
Business structure improvement expenses 10,245 15,477 187
Loss on change in equity - 5,996 72
Loss on disaster - 5,972 72
Impairment loss 6,973 5,873 71
Loss on valuation of investment securities 891 4,319 52
Cost of corrective measures for products 2,487 3,697 45
Loss on adjustment for changes of accounting standard for asset retirement obligations
- 1,434 17
Loss on sales of stocks of subsidiaries and affiliates 3,112 1,002 12
Provision for loss on guarantees - 201 2
Loss on sales of noncurrent assets 12 19 0
Loss on sales of investment securities 39 8 0
Loss on retirement of noncurrent assets 1,527 - -
Income (loss) before income taxes and minority interests 55,654 (15,687) (189)
Income taxes 41,238 (8,796) (106)
Income taxes - current 28,577 27,788 335
Income taxes - deferred 12,661 (36,584) (441)
Loss before minority interests - (6,891) (83)
Minority interests in income 2,988 5,627 68
Net income (loss) JPY 11,428 JPY (12,518) $(151)
Fiscal year ended March 31 2011
CONSOLIDATED STATEMENTS OF INCOME AND CONSOLIDATED STATEMENTS OFCOMPREHENSIVE INCOME
(In millions of yen, millions of U.S. dollars)
2010 2011
*3
*9
*3
*11
*12
*1
*5
*9
*2
*11
*10
*6
*2
*5
*10
*3
*4
*7
*8 *8
3737
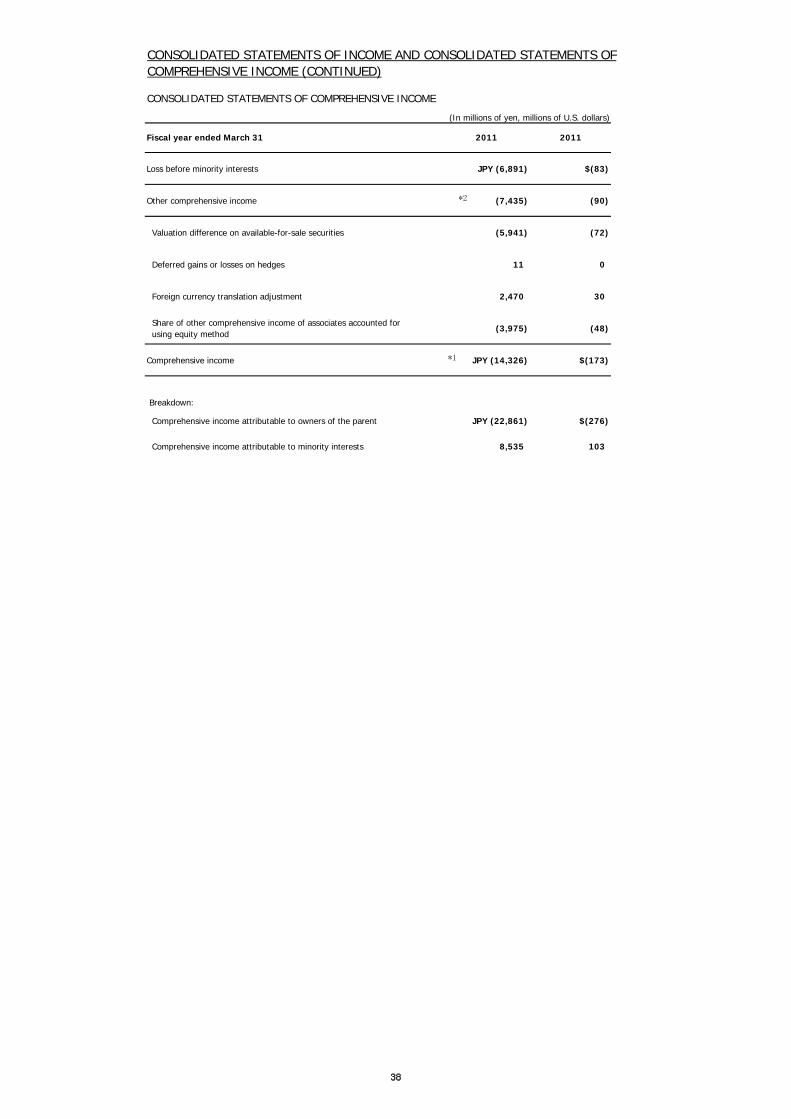
CONSOLIDATED STATEMENTS OF COMPREHENSIVE INCOME
Loss before minority interests JPY (6,891) $(83)
Other comprehensive income (7,435) (90)
Valuation difference on available-for-sale securities (5,941) (72)
Deferred gains or losses on hedges 11 0
Foreign currency translation adjustment 2,470 30
Share of other comprehensive income of associates accounted for using equity method
(3,975) (48)
Comprehensive income JPY (14,326) $(173)
Breakdown:
Comprehensive income attributable to owners of the parent JPY (22,861) $(276)
Comprehensive income attributable to minority interests 8,535 103
Fiscal year ended March 31 2011 2011
CONSOLIDATED STATEMENTS OF INCOME AND CONSOLIDATED STATEMENTS OFCOMPREHENSIVE INCOME (CONTINUED)
(In millions of yen, millions of U.S. dollars)
*1
*2
3838
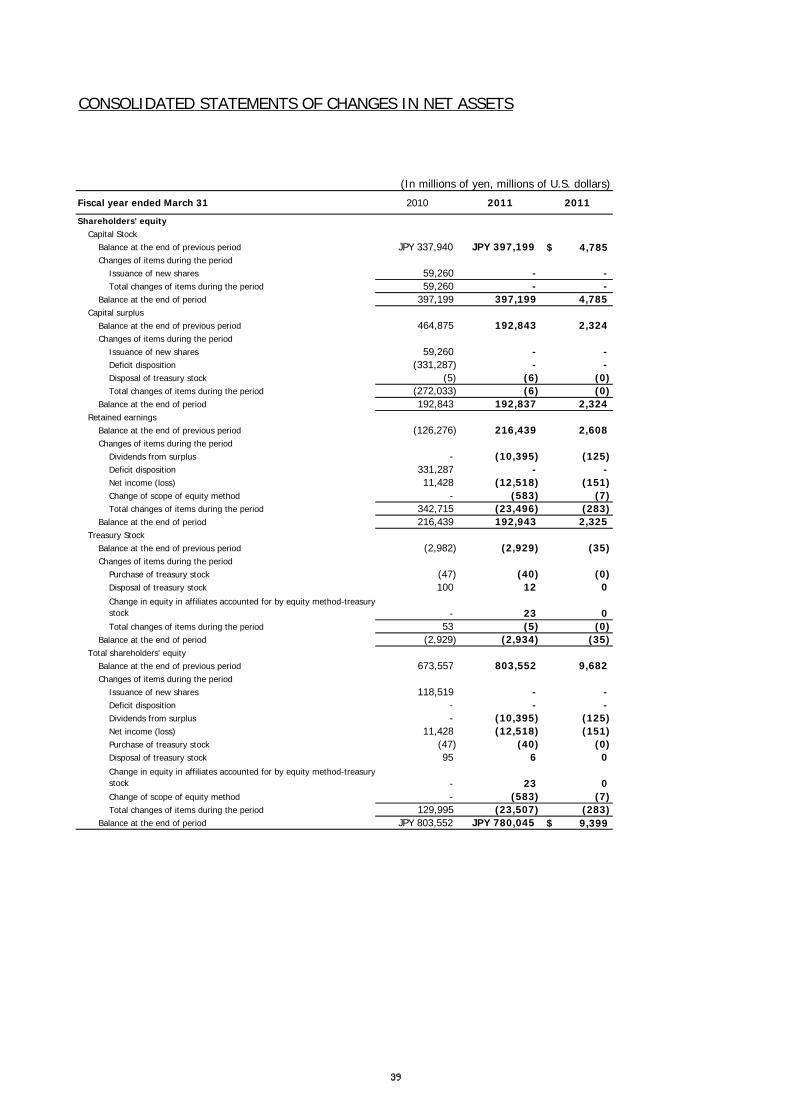
CONSOLIDATED STATEMENTS OF CHANGES IN NET ASSETS
(In millions of yen, millions of U.S. dollars)
Fiscal year ended March 31 2010 2011 2011
Shareholders' equityCapital Stock
Balance at the end of previous period JPY 337,940 JPY 397,199 $ 4,785Changes of items during the period
Issuance of new shares 59,260 - - Total changes of items during the period 59,260 - -
Balance at the end of period 397,199 397,199 4,785 Capital surplus
Balance at the end of previous period 464,875 192,843 2,324 Changes of items during the period
Issuance of new shares 59,260 - - Deficit disposition (331,287) - - Disposal of treasury stock (5) (6) (0)Total changes of items during the period (272,033) (6) (0)
Balance at the end of period 192,843 192,837 2,324 Retained earnings
Balance at the end of previous period (126,276) 216,439 2,608 Changes of items during the period
Dividends from surplus - (10,395) (125)Deficit disposition 331,287 - - Net income (loss) 11,428 (12,518) (151)Change of scope of equity method - (583) (7)Total changes of items during the period 342,715 (23,496) (283)
Balance at the end of period 216,439 192,943 2,325 Treasury Stock
Balance at the end of previous period (2,982) (2,929) (35)Changes of items during the period
Purchase of treasury stock (47) (40) (0)Disposal of treasury stock 100 12 0 Change in equity in affiliates accounted for by equity method-treasurystock - 23 0 Total changes of items during the period 53 (5) (0)
Balance at the end of period (2,929) (2,934) (35)Total shareholders' equity
Balance at the end of previous period 673,557 803,552 9,682 Changes of items during the period
Issuance of new shares 118,519 - - Deficit disposition - - - Dividends from surplus - (10,395) (125)Net income (loss) 11,428 (12,518) (151)Purchase of treasury stock (47) (40) (0)Disposal of treasury stock 95 6 0 Change in equity in affiliates accounted for by equity method-treasurystock - 23 0 Change of scope of equity method - (583) (7)Total changes of items during the period 129,995 (23,507) (283)
Balance at the end of period JPY 803,552 JPY 780,045 $ 9,399
3939

CONSOLIDATED STATEMENTS OF CHANGES IN NET ASSETS(CONTINUED)
(In millions of yen, millions of U.S. dollars)
Fiscal year ended March 31 2010 2011 2011
Accumulated other comprehensive incomeValuation difference on available-for-sale securities
Balance at the end of previous period JPY (6,228) JPY 10,218 $123Changes of items during the period
Net changes of items other than shareholders' equity 16,446 (6,051) (73)Total changes of items during the period 16,446 (6,051) (73)
Balance at the end of period 10,218 4,167 50Deferred gains or losses on hedges
Balance at the end of previous period (120) 61 1Changes of items during the period
Net changes of items other than shareholders' equity 181 71 1Total changes of items during the period 181 71 1
Balance at the end of period 61 132 2Foreign currency translation adjustment
Balance at the end of previous period (25,555) (22,927) (276)Changes of items during the period
Net changes of items other than shareholders' equity 2,628 (4,363) (53)Total changes of items during the period 2,628 (4,363) (53)
Balance at the end of period (22,927) (27,290) (329)Total accumulated other comprehensive Income
Balance at the end of previous period (31,903) (12,648) (152)Changes of items during the period
Net changes of items other than shareholders' equity 19,255 (10,343) (125)Total changes of items during the period 19,255 (10,343) (125)
Balance at the end of period (12,648) (22,991) (277)Subscription rights to shares
Balance at the end of previous period 123 93 1Changes of items during the period
Net changes of items other than shareholders' equity (30) (60) (1)Total changes of items during the period (30) (60) (1)
Balance at the end of period 93 33 0 Minority interests
Balance at the end of previous period 143,788 140,915 1,697Changes of items during the period
Net changes of items other than shareholders' equity (2,873) (22,561) (271)Total changes of items during the period (2,873) (22,561) (271)
Balance at the end of period 140,915 118,354 1,426Total net assets
Balance at the end of previous period 785,565 931,912 11,228 Changes of items during the period
Issuance of new shares 118,519 - - Deficit disposition - - - Dividends from surplus - (10,395) (125)Net income (loss) 11,428 (12,518) (151)Purchase of treasury stock (47) (40) (0)Disposal of treasury stock 95 6 0 Change in equity in affiliates accounted for by equity method-treasurystock - 23 0 Change of scope of equity method - (583) (7)Net changes of items other than shareholders' equity 16,352 (32,964) (397)Total changes of items during the period 146,347 (56,471) (680)
Balance at the end of period JPY 931,912 JPY 875,441 $ 10,548
4040
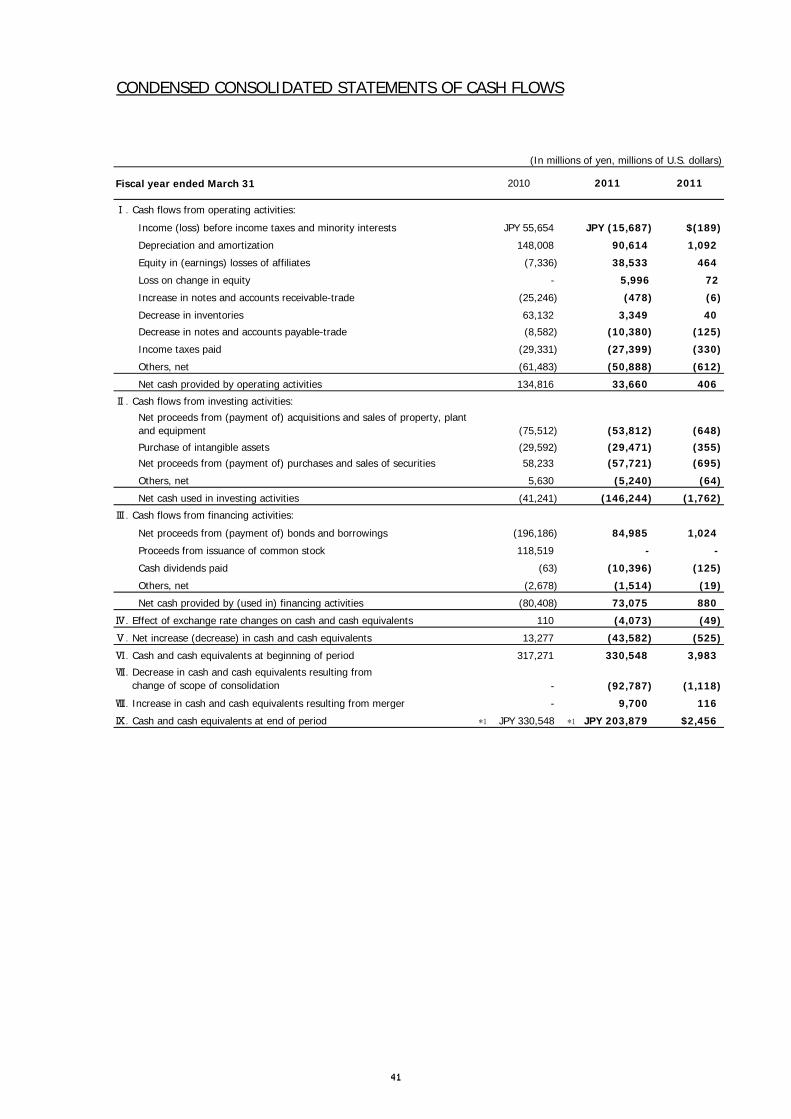
Fiscal year ended March 31
Income (loss) before income taxes and minority interests JPY 55,654 JPY (15,687) $(189)
Depreciation and amortization 148,008 90,614 1,092
Equity in (earnings) losses of affiliates (7,336) 38,533 464
Loss on change in equity - 5,996 72
Increase in notes and accounts receivable-trade (25,246) (478) (6)
Decrease in inventories 63,132 3,349 40
Decrease in notes and accounts payable-trade (8,582) (10,380) (125)
Income taxes paid (29,331) (27,399) (330)
Others, net (61,483) (50,888) (612)
Net cash provided by operating activities 134,816 33,660 406
Net proceeds from (payment of) acquisitions and sales of property, plantand equipment (75,512) (53,812) (648)
Purchase of intangible assets (29,592) (29,471) (355)Net proceeds from (payment of) purchases and sales of securities 58,233 (57,721) (695)
Others, net 5,630 (5,240) (64)
Net cash used in investing activities (41,241) (146,244) (1,762)
Net proceeds from (payment of) bonds and borrowings (196,186) 84,985 1,024
Proceeds from issuance of common stock 118,519 - -
Cash dividends paid (63) (10,396) (125)
Others, net (2,678) (1,514) (19)
Net cash provided by (used in) financing activities (80,408) 73,075 880
Ⅳ.Effect of exchange rate changes on cash and cash equivalents 110 (4,073) (49)
Ⅴ.Net increase (decrease) in cash and cash equivalents 13,277 (43,582) (525)
Ⅵ.Cash and cash equivalents at beginning of period 317,271 330,548 3,983
- (92,787) (1,118)
Ⅷ.Increase in cash and cash equivalents resulting from merger - 9,700 116
Ⅸ.Cash and cash equivalents at end of period JPY 330,548 JPY 203,879 $2,456
CONDENSED CONSOLIDATED STATEMENTS OF CASH FLOWS
2010 2011
(In millions of yen, millions of U.S. dollars)
2011
Ⅶ.Decrease in cash and cash equivalents resulting from change of scope of consolidation
Ⅰ.Cash flows from operating activities:
Ⅱ.Cash flows from investing activities:
Ⅲ.Cash flows from financing activities:
*1*1
4141

Changes in Significant Items for Presenting Consolidated Financial Statements
Fiscal year ended March 31, 2010 (From April 1, 2009
to March 31, 2010)
Fiscal year ended March 31, 2011 (From April 1, 2010
to March 31, 2011)
____________
(Application of "Accounting Standard for Asset Retirement Obligations") From this fiscal year, NEC Corporation and its consolidated subsidiaries ("the Group") applies the "Accounting Standard for Asset Retirement Obligations" (Accounting Standards Board of Japan ("ASBJ") Statement No. 18 of March 31, 2008) and the "Guidance on Accounting Standard for Asset Retirement Obligations" (ASBJ Guidance No. 21 of March 31, 2008). Although the impact of this change on operating income (loss), ordinary income (loss) and segment information is immaterial, 1,434 million yen is recorded loss on adjustment for changes of accounting standard for asset retirement obligations as extraordinary loss.
____________
(Application of “Accounting Standard for Equity Method of Accounting for Investments” and “Practical Solution on Unification of Accounting Policies Applied to Associates Accounted for Using the Equity Method”) From this fiscal year, the Group applies the “Accounting Standard for Equity Method of Accounting for Investments” (ASBJ Statement No. 16 of March 10, 2008) and the “Practical Solution on Unification of Accounting Policies Applied to Associates Accounted for Using the Equity Method” (ASBJ PITF No. 24 of March 10, 2008). This change has no impact on income (loss) and segment information.
4242
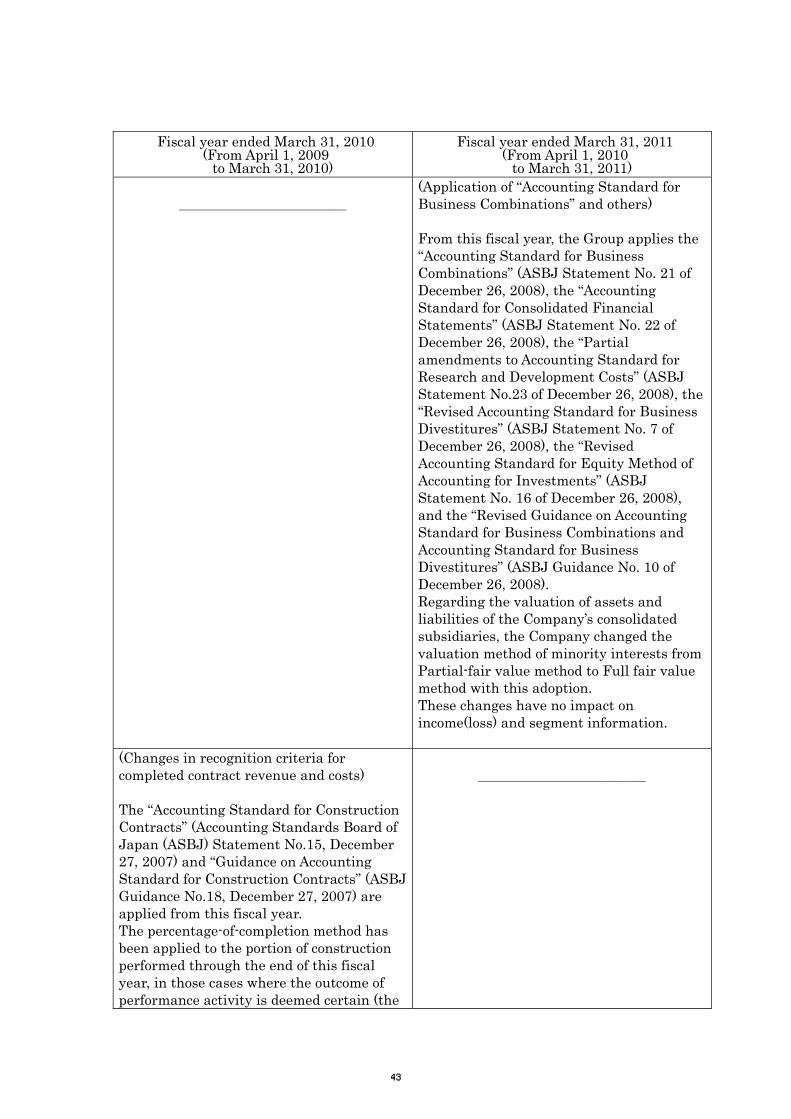
Fiscal year ended March 31, 2010 (From April 1, 2009
to March 31, 2010)
Fiscal year ended March 31, 2011 (From April 1, 2010
to March 31, 2011)
____________
(Application of “Accounting Standard for Business Combinations” and others) From this fiscal year, the Group applies the “Accounting Standard for Business Combinations” (ASBJ Statement No. 21 of December 26, 2008), the “Accounting Standard for Consolidated Financial Statements” (ASBJ Statement No. 22 of December 26, 2008), the “Partial amendments to Accounting Standard for Research and Development Costs” (ASBJ Statement No.23 of December 26, 2008), the “Revised Accounting Standard for Business Divestitures” (ASBJ Statement No. 7 of December 26, 2008), the “Revised Accounting Standard for Equity Method of Accounting for Investments” (ASBJ Statement No. 16 of December 26, 2008), and the “Revised Guidance on Accounting Standard for Business Combinations and Accounting Standard for Business Divestitures” (ASBJ Guidance No. 10 of December 26, 2008). Regarding the valuation of assets and liabilities of the Company’s consolidated subsidiaries, the Company changed the valuation method of minority interests from Partial-fair value method to Full fair value method with this adoption. These changes have no impact on income(loss) and segment information.
(Changes in recognition criteria for completed contract revenue and costs) The “Accounting Standard for Construction Contracts” (Accounting Standards Board of Japan (ASBJ) Statement No.15, December 27, 2007) and “Guidance on Accounting Standard for Construction Contracts” (ASBJ Guidance No.18, December 27, 2007) are applied from this fiscal year. The percentage-of-completion method has been applied to the portion of construction performed through the end of this fiscal year, in those cases where the outcome of performance activity is deemed certain (the
____________
4343
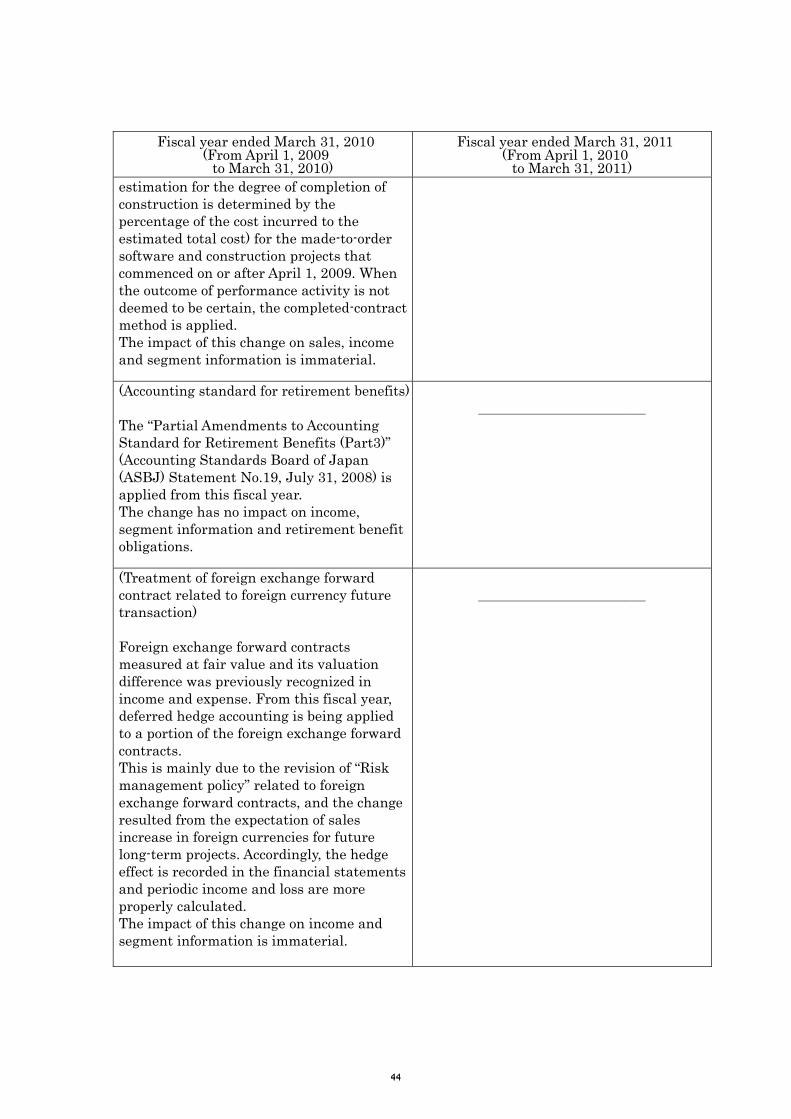
Fiscal year ended March 31, 2010 (From April 1, 2009
to March 31, 2010)
Fiscal year ended March 31, 2011 (From April 1, 2010
to March 31, 2011) estimation for the degree of completion of construction is determined by the percentage of the cost incurred to the estimated total cost) for the made-to-order software and construction projects that commenced on or after April 1, 2009. When the outcome of performance activity is not deemed to be certain, the completed-contract method is applied. The impact of this change on sales, income and segment information is immaterial. (Accounting standard for retirement benefits) The “Partial Amendments to Accounting Standard for Retirement Benefits (Part3)” (Accounting Standards Board of Japan (ASBJ) Statement No.19, July 31, 2008) is applied from this fiscal year. The change has no impact on income, segment information and retirement benefit obligations.
____________
(Treatment of foreign exchange forward contract related to foreign currency future transaction) Foreign exchange forward contracts measured at fair value and its valuation difference was previously recognized in income and expense. From this fiscal year, deferred hedge accounting is being applied to a portion of the foreign exchange forward contracts. This is mainly due to the revision of “Risk management policy” related to foreign exchange forward contracts, and the change resulted from the expectation of sales increase in foreign currencies for future long-term projects. Accordingly, the hedge effect is recorded in the financial statements and periodic income and loss are more properly calculated. The impact of this change on income and segment information is immaterial.
____________
4444
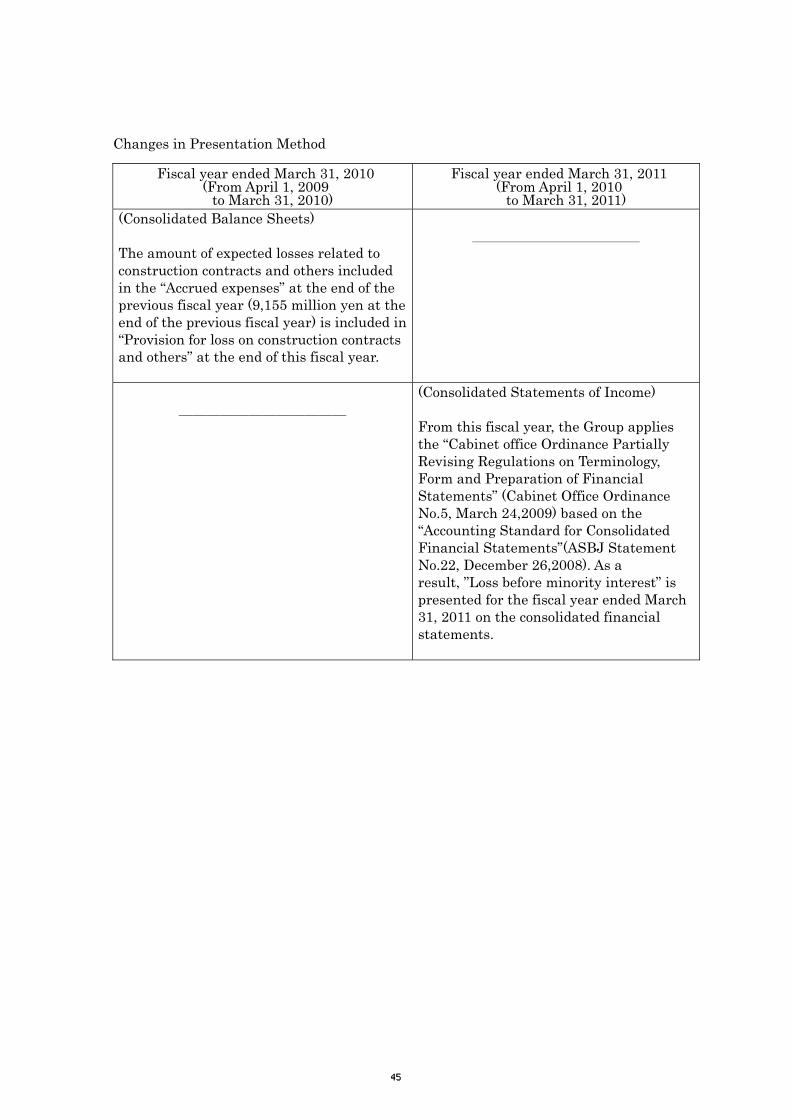
Changes in Presentation Method
Fiscal year ended March 31, 2010 (From April 1, 2009
to March 31, 2010)
Fiscal year ended March 31, 2011 (From April 1, 2010
to March 31, 2011) (Consolidated Balance Sheets) The amount of expected losses related to construction contracts and others included in the “Accrued expenses” at the end of the previous fiscal year (9,155 million yen at the end of the previous fiscal year) is included in “Provision for loss on construction contracts and others” at the end of this fiscal year.
____________
____________
(Consolidated Statements of Income) From this fiscal year, the Group applies the “Cabinet office Ordinance Partially Revising Regulations on Terminology, Form and Preparation of Financial Statements” (Cabinet Office Ordinance No.5, March 24,2009) based on the “Accounting Standard for Consolidated Financial Statements”(ASBJ Statement No.22, December 26,2008). As a result, ”Loss before minority interest” is presented for the fiscal year ended March 31, 2011 on the consolidated financial statements.
4545
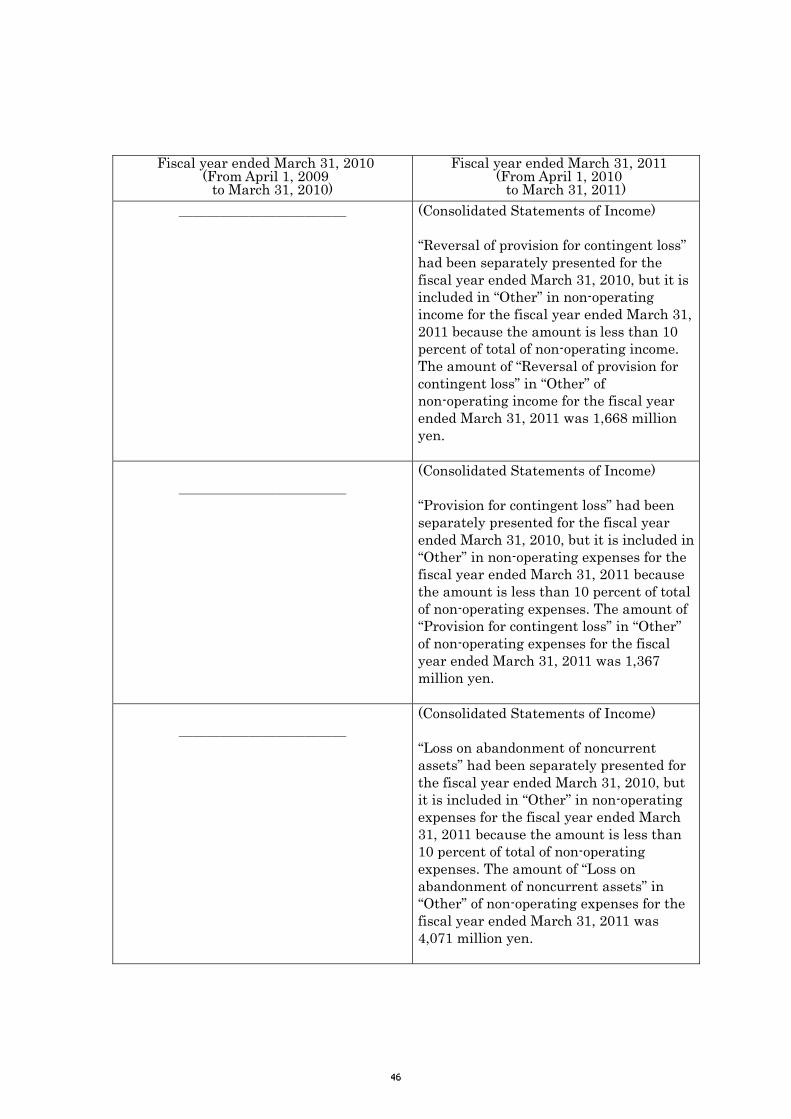
Fiscal year ended March 31, 2010
(From April 1, 2009 to March 31, 2010)
Fiscal year ended March 31, 2011 (From April 1, 2010
to March 31, 2011) ____________ (Consolidated Statements of Income)
“Reversal of provision for contingent loss” had been separately presented for the fiscal year ended March 31, 2010, but it is included in “Other” in non-operating income for the fiscal year ended March 31, 2011 because the amount is less than 10 percent of total of non-operating income. The amount of “Reversal of provision for contingent loss” in “Other” of non-operating income for the fiscal year ended March 31, 2011 was 1,668 million yen.
____________
(Consolidated Statements of Income) “Provision for contingent loss” had been separately presented for the fiscal year ended March 31, 2010, but it is included in “Other” in non-operating expenses for the fiscal year ended March 31, 2011 because the amount is less than 10 percent of total of non-operating expenses. The amount of “Provision for contingent loss” in “Other” of non-operating expenses for the fiscal year ended March 31, 2011 was 1,367 million yen.
____________
(Consolidated Statements of Income) “Loss on abandonment of noncurrent assets” had been separately presented for the fiscal year ended March 31, 2010, but it is included in “Other” in non-operating expenses for the fiscal year ended March 31, 2011 because the amount is less than 10 percent of total of non-operating expenses. The amount of “Loss on abandonment of noncurrent assets” in “Other” of non-operating expenses for the fiscal year ended March 31, 2011 was 4,071 million yen.
4646
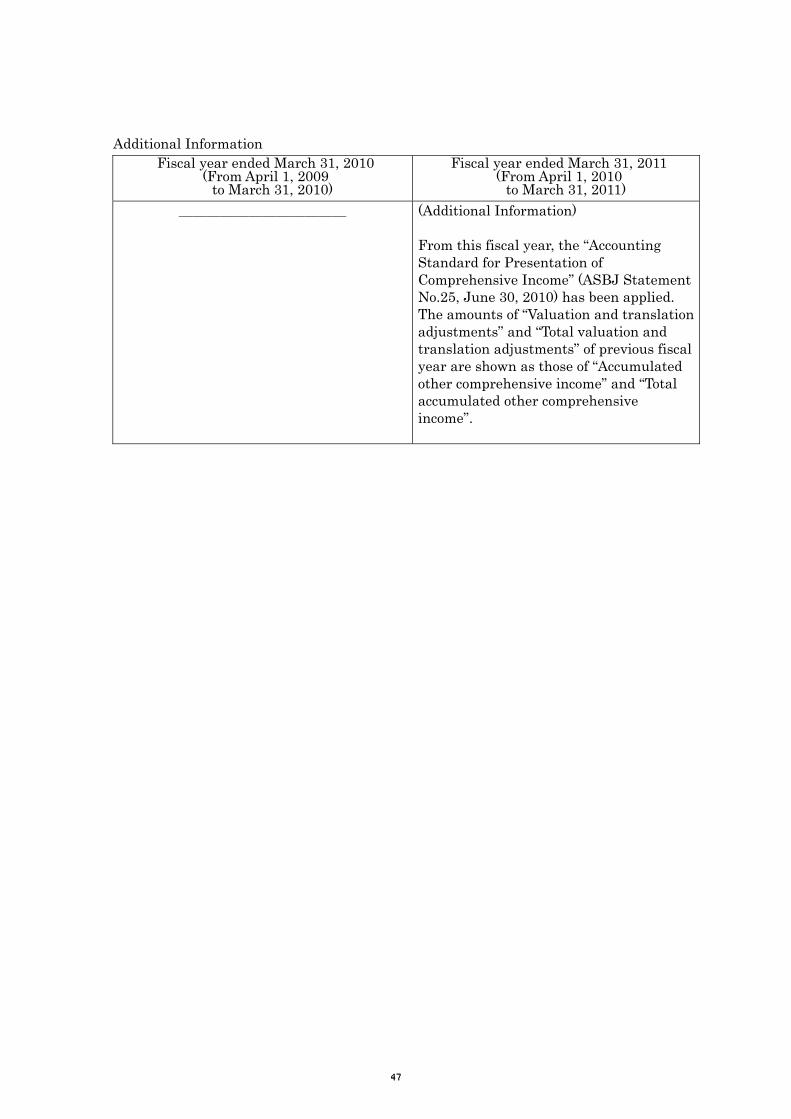
Additional Information Fiscal year ended March 31, 2010
(From April 1, 2009 to March 31, 2010)
Fiscal year ended March 31, 2011 (From April 1, 2010
to March 31, 2011) ____________ (Additional Information)
From this fiscal year, the “Accounting Standard for Presentation of Comprehensive Income” (ASBJ Statement No.25, June 30, 2010) has been applied. The amounts of “Valuation and translation adjustments” and “Total valuation and translation adjustments” of previous fiscal year are shown as those of “Accumulated other comprehensive income” and “Total accumulated other comprehensive income”.
4747

Notes to Consolidated Financial Statements
Notes to Consolidated Balance Sheets
(In millions of yen) Items Fiscal year ended March 31, 2010 Fiscal year ended March 31, 2011
*1. Accumulated depreciation of property, plant and equipment
1,732,061
838,310
*2.
Assets pledged as and debt secured by collateral
Balances - assets pledged as collateral
Buildings and structures 1,227 Machinery and equipment 57 Land 4,674 Others 15 Total 5,973
Buildings and structures 1,172 Machinery and equipment 32 Land 4,796 Others 10 Total 6,010
Balances - debt secured by collateral
Short-term loans payable 1,883 Long-term loans payable 350 Others 36 Total 2,269
Short-term loans payable 2,051 Long-term loans payable 350 Others 83 Total 2,484
*3. Notes with relate to non-consolidated subsidiaries and affiliates
The investment amount for the jointly-controlled company included in investments in affiliated companies 6,972
The investment amount for the jointly-controlled company included in investments in affiliated companies 5,808
4.
Contingent liabilities Guarantees for bank loans and others
Employees 7,118NT Sales Co., Ltd. 1,230Others 820Total 9,168
Renesas Electronics Corporation 10,210Automotive Energy Supply Corporation 7,047Employees 5,074Others 929Total 23,260
Guarantees for residual value of operating leases
BOT LEASE CO., LTD. 3,375Sumitomo Mitsui Finance and Leasing Company, Limited
2,766
IBJ Leasing Company, Limited 2,419Others 386Total 8,946
____________
4848
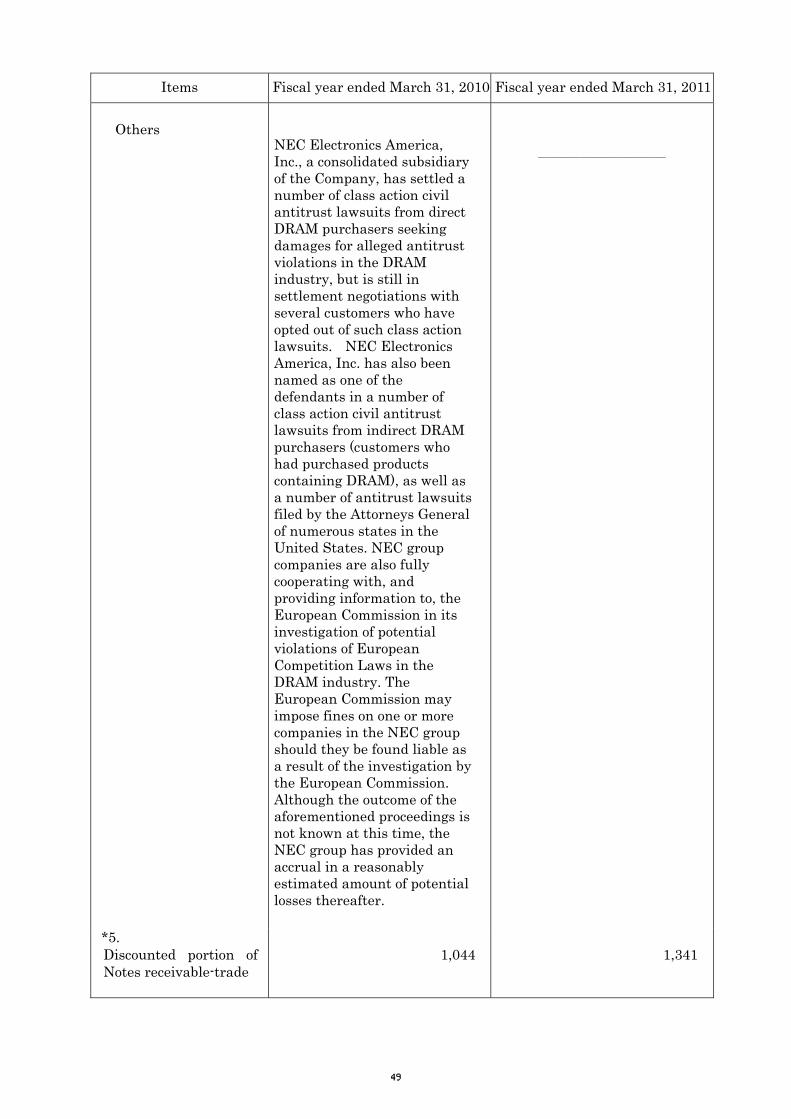
Items Fiscal year ended March 31, 2010 Fiscal year ended March 31, 2011
Others
NEC Electronics America, Inc., a consolidated subsidiary of the Company, has settled a number of class action civil antitrust lawsuits from direct DRAM purchasers seeking damages for alleged antitrust violations in the DRAM industry, but is still in settlement negotiations with several customers who have opted out of such class action lawsuits. NEC Electronics America, Inc. has also been named as one of the defendants in a number of class action civil antitrust lawsuits from indirect DRAM purchasers (customers who had purchased products containing DRAM), as well as a number of antitrust lawsuits filed by the Attorneys General of numerous states in the United States. NEC group companies are also fully cooperating with, and providing information to, the European Commission in its investigation of potential violations of European Competition Laws in the DRAM industry. The European Commission may impose fines on one or more companies in the NEC group should they be found liable as a result of the investigation by the European Commission. Although the outcome of the aforementioned proceedings is not known at this time, the NEC group has provided an accrual in a reasonably estimated amount of potential losses thereafter.
____________
*5. Discounted portion of Notes receivable-trade
1,044
1,341
4949

Items Fiscal year ended March 31, 2010 Fiscal year ended March 31, 2011*6. Net presentation of inventories and provision for loss on construction contracts and others
Inventories related to construction contracts and others which is expected to be resulted in a loss are presented at net of provision for loss on construction contracts and others of 11,218 million yen (the sum of following provision for loss on construction contracts and others; 2,709 million yen for merchandise and finished goods, 8,492 million yen for work in process, and 17 million yen for raw materials and supplies).
Inventories related to construction contracts and others which is expected to be resulted in a loss are presented at net of provision for loss on construction contracts and others of 7,048 million yen (the sum of following provision for loss on construction contracts and others; 2,448 million yen for merchandise and finished goods, 4,558 million yen for work in process, and 42 million yen for raw materials and supplies).
5050
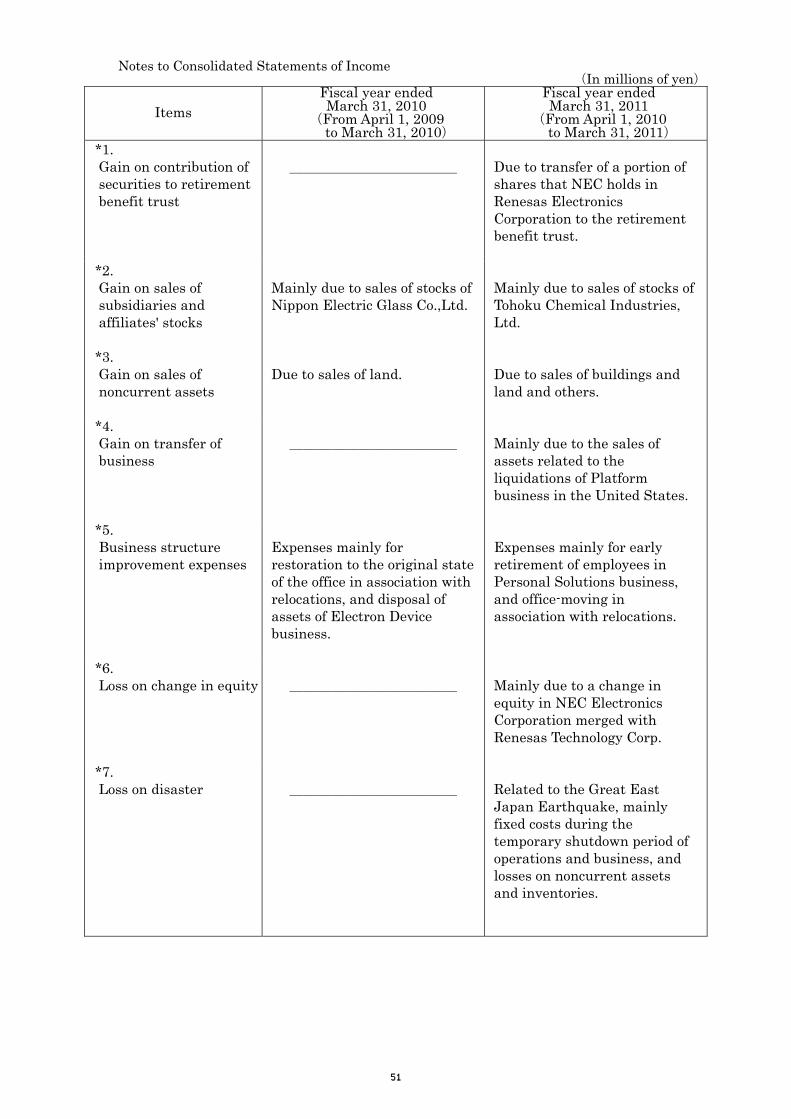
Notes to Consolidated Statements of Income
(In millions of yen)
Items Fiscal year ended March 31, 2010
(From April 1, 2009 to March 31, 2010)
Fiscal year ended March 31, 2011
(From April 1, 2010 to March 31, 2011)
*1. Gain on contribution of securities to retirement benefit trust
____________
Due to transfer of a portion of shares that NEC holds in Renesas Electronics Corporation to the retirement benefit trust.
*2. Gain on sales of subsidiaries and affiliates' stocks
Mainly due to sales of stocks of Nippon Electric Glass Co.,Ltd.
Mainly due to sales of stocks of Tohoku Chemical Industries, Ltd.
*3. Gain on sales of noncurrent assets
Due to sales of land.
Due to sales of buildings and land and others.
*4. Gain on transfer of business
____________
Mainly due to the sales of assets related to the liquidations of Platform business in the United States.
*5. Business structure improvement expenses
Expenses mainly for restoration to the original state of the office in association with relocations, and disposal of assets of Electron Device business.
Expenses mainly for early retirement of employees in Personal Solutions business, and office-moving in association with relocations.
*6. Loss on change in equity
____________
Mainly due to a change in equity in NEC Electronics Corporation merged with Renesas Technology Corp.
*7. Loss on disaster
____________
Related to the Great East Japan Earthquake, mainly fixed costs during the temporary shutdown period of operations and business, and losses on noncurrent assets and inventories.
5151

Items Fiscal year ended March 31, 2010
(From April 1, 2009 to March 31, 2010)
Fiscal year ended March 31, 2011
(From April 1, 2010 to March 31, 2011)
*8. Impairment loss
(1) Summary of assets or asset groups for which impairment losses were recognized.
(1) Summary of assets or asset groups for which impairment losses were recognized.
Use Type Location
Assets for business use
・ Buildings and structures,
・ Machinery and equipment,
・ Tools and fixtures etc.
・ Intangible assets, and others
Koka City, Shiga Prefecture, and Ina City,Nagano Prefecture
Assets for business use
・ Buildings and structures,
・ Tools and fixtures etc.
・ Intangible assets, and others
Minato-ku, Tokyo, Shinagawa-ku, Tokyo, and others
Assets for business use
・ Buildings and structures,
・ Machinery and equipment,
・ Tools and fixtures etc.
・ Intangible assets, and others
United States of America
Idle assets
Buildings and structures
Kusatsu City, Shiga Prefecture
Others Goodwill ―
Use Type Location
Assets for business use
・ Buildings and structures,
・ Machinery and equipment
・ Tools and fixtures etc.
・ Construction in progress
China
Assets for businessuse
・
・ Tools and fixtures etc.
Kawasaki City, Kanagawa Prefecture
Construction in progress, and others and
others
Idle assets
・ Land, ・ Construction
in progress, ・ Software,
and others
Minato-ku, Tokyo, Utsunomiya City, Tochigi Prefecture, and others
Idle assets
・ Machinery and equipment,
・ Tools and fixtures etc.
Shiroishi City,
・ Construction in progress
Shimoniikawa County, Toyama Prefecture,
Miyagi Prefecture, and others
(2) Background to the recognition of impairment loss. Investments in certain fixed assets for business use and goodwill were not expected to be recoverable due to lower profitability of assets for business use and market value declines of idle assets. Therefore the Company groups recognized impairment loss as extraordinary loss.
(2) Background to the recognition of impairment loss. Investments in certain fixed assets for business use were not expected to be recoverable due to lower profitability of assets for business use and market value declines of idle assets. Therefore the Company groups recognized impairment loss as extraordinary loss.
5252
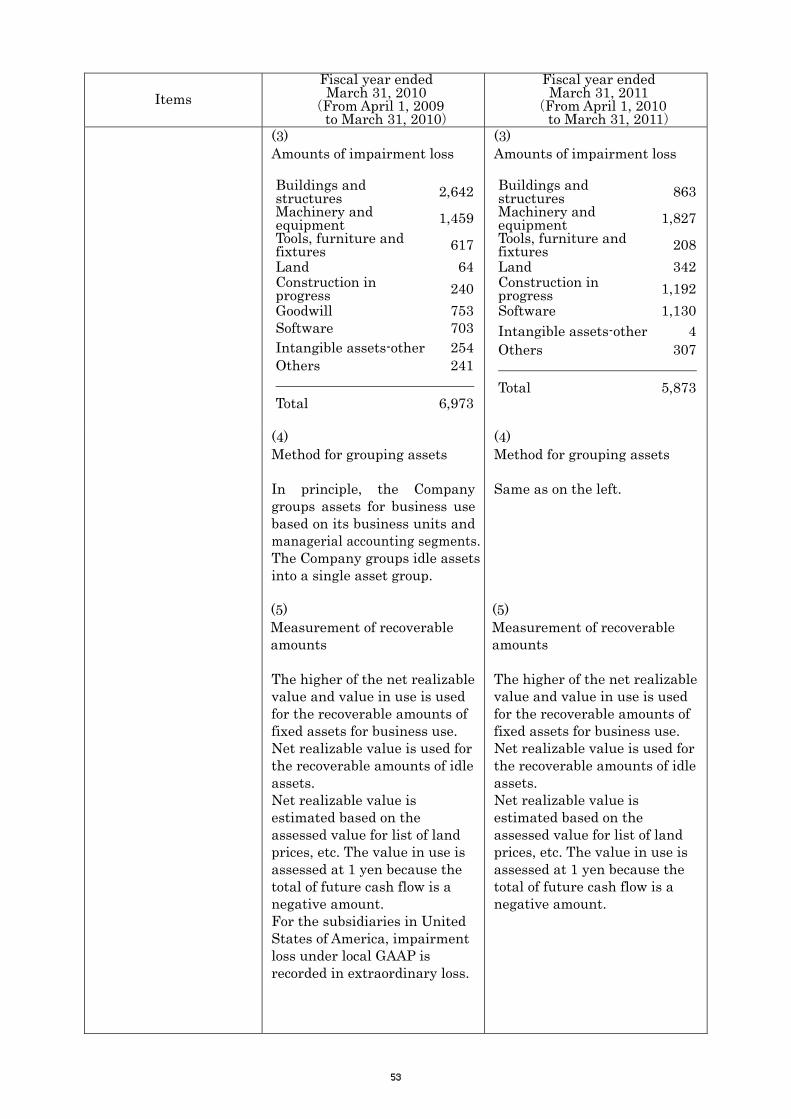
Items Fiscal year ended March 31, 2010
(From April 1, 2009 to March 31, 2010)
Fiscal year ended March 31, 2011
(From April 1, 2010 to March 31, 2011)
(3) Amounts of impairment loss
Buildings and structures 2,642Machinery and equipment 1,459Tools, furniture and fixtures 617Land 64Construction in progress 240Goodwill 753Software 703Intangible assets-other 254Others
241
Total 6,973
(3) Amounts of impairment loss
Buildings and structures 863Machinery and equipment 1,827Tools, furniture and fixtures 208Land 342Construction in progress 1,192Software 1,130Intangible assets-other 4Others
307
Total 5,873
(4) Method for grouping assets In principle, the Company groups assets for business use based on its business units and managerial accounting segments.The Company groups idle assetsinto a single asset group.
(4) Method for grouping assets Same as on the left.
(5) Measurement of recoverable amounts The higher of the net realizable value and value in use is used for the recoverable amounts of fixed assets for business use. Net realizable value is used for the recoverable amounts of idle assets. Net realizable value is estimated based on the assessed value for list of land prices, etc. The value in use is assessed at 1 yen because the total of future cash flow is a negative amount. For the subsidiaries in United States of America, impairment loss under local GAAP is recorded in extraordinary loss.
(5) Measurement of recoverable amounts The higher of the net realizable value and value in use is used for the recoverable amounts of fixed assets for business use. Net realizable value is used for the recoverable amounts of idle assets. Net realizable value is estimated based on the assessed value for list of land prices, etc. The value in use is assessed at 1 yen because the total of future cash flow is a negative amount.
5353
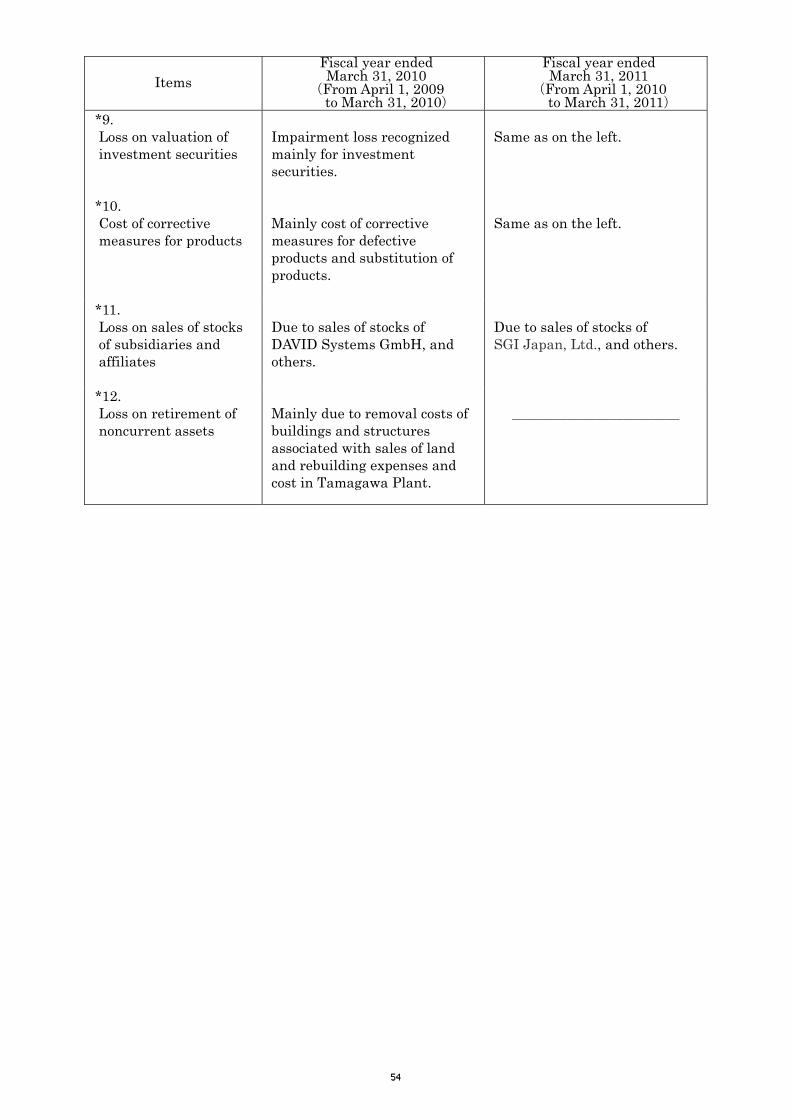
Items Fiscal year ended March 31, 2010
(From April 1, 2009 to March 31, 2010)
Fiscal year ended March 31, 2011
(From April 1, 2010 to March 31, 2011)
*9. Loss on valuation of investment securities
Impairment loss recognized mainly for investment securities.
Same as on the left.
*10. Cost of corrective measures for products
Mainly cost of corrective measures for defective products and substitution of products.
Same as on the left.
*11. Loss on sales of stocks of subsidiaries and affiliates
Due to sales of stocks of DAVID Systems GmbH, and others.
Due to sales of stocks of SGI Japan, Ltd., and others.
*12. Loss on retirement of noncurrent assets
Mainly due to removal costs of buildings and structures associated with sales of land and rebuilding expenses and cost in Tamagawa Plant.
____________
5454

Notes to Consolidated Statements of Comprehensive Income Fiscal year ended March 31, 2011 (From April 1, 2010 to March 31, 2011)
*1 Comprehensive income of previous fiscal year
(In millions of yen) Comprehensive income attributable to owners of the parent 30,683
Comprehensive income attributable to minority interests 2,775
Total comprehensive income 33,458
*2 Other comprehensive income of previous fiscal year (In millions of yen)
Valuation difference on available-for-sale securities 15,307
Deferred gains or losses on hedges 122
Foreign currency translation adjustment 1,238
Share of other comprehensive income of associates accounted for using equity method 2,375
Total other comprehensive income 19,042
5555
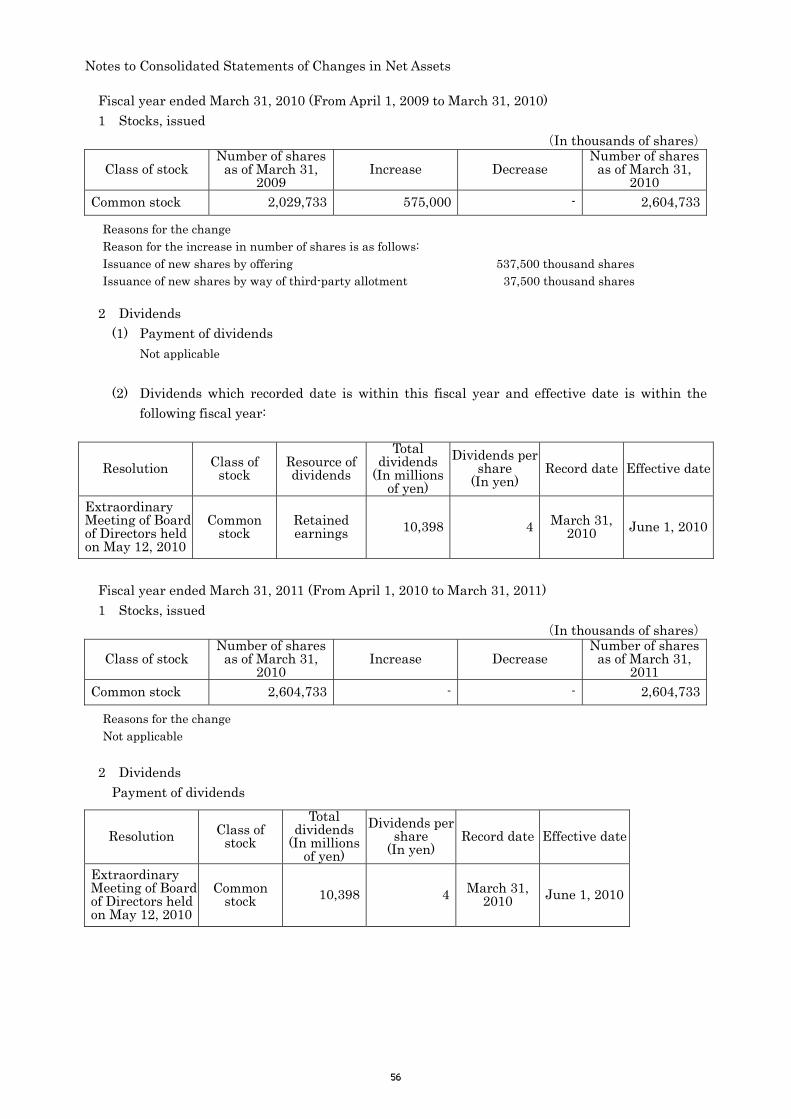
Notes to Consolidated Statements of Changes in Net Assets
Fiscal year ended March 31, 2010 (From April 1, 2009 to March 31, 2010) 1 Stocks, issued
(In thousands of shares)
Class of stock Number of shares
as of March 31, 2009
Increase Decrease Number of shares
as of March 31, 2010
Common stock 2,029,733 575,000 - 2,604,733
Reasons for the change Reason for the increase in number of shares is as follows: Issuance of new shares by offering 537,500 thousand shares Issuance of new shares by way of third-party allotment 37,500 thousand shares
2 Dividends
(1) Payment of dividends Not applicable
(2) Dividends which recorded date is within this fiscal year and effective date is within the following fiscal year:
Resolution Class of stock
Resource of dividends
Total dividends
(In millions of yen)
Dividends per share
(In yen) Record date Effective date
Extraordinary Meeting of Board of Directors held on May 12, 2010
Common stock
Retained earnings 10,398 4 March 31,
2010 June 1, 2010
Fiscal year ended March 31, 2011 (From April 1, 2010 to March 31, 2011) 1 Stocks, issued
(In thousands of shares)
Class of stock Number of shares
as of March 31, 2010
Increase Decrease Number of shares
as of March 31, 2011
Common stock 2,604,733 - - 2,604,733
Reasons for the change Not applicable
2 Dividends Payment of dividends
Resolution Class of
stock
Total dividends
(In millions of yen)
Dividends per share
(In yen) Record date Effective date
Extraordinary Meeting of Board of Directors held on May 12, 2010
Common stock 10,398 4 March 31,
2010 June 1, 2010
5656

Notes to Consolidated Statements of Cash Flows
(In millions of yen) Items Fiscal year ended March 31, 2010 Fiscal year ended March 31, 2011
*1. Reconciliation of cash and cash equivalents from the accounts recorded in consolidated balance sheets
Cash and deposits 195,095 Short-term investmentsecurities 136,747 Time deposits and Short-term investmentsecurities with maturities of more than three months
(1,294)
Cash and cash equivalents 330,548
Cash and deposits 184,662 Short-term investment securities 20,757 Time deposits and Short-term investment securities with maturities of more than three months
(1,540)
Cash and cash equivalents 203,879
5757
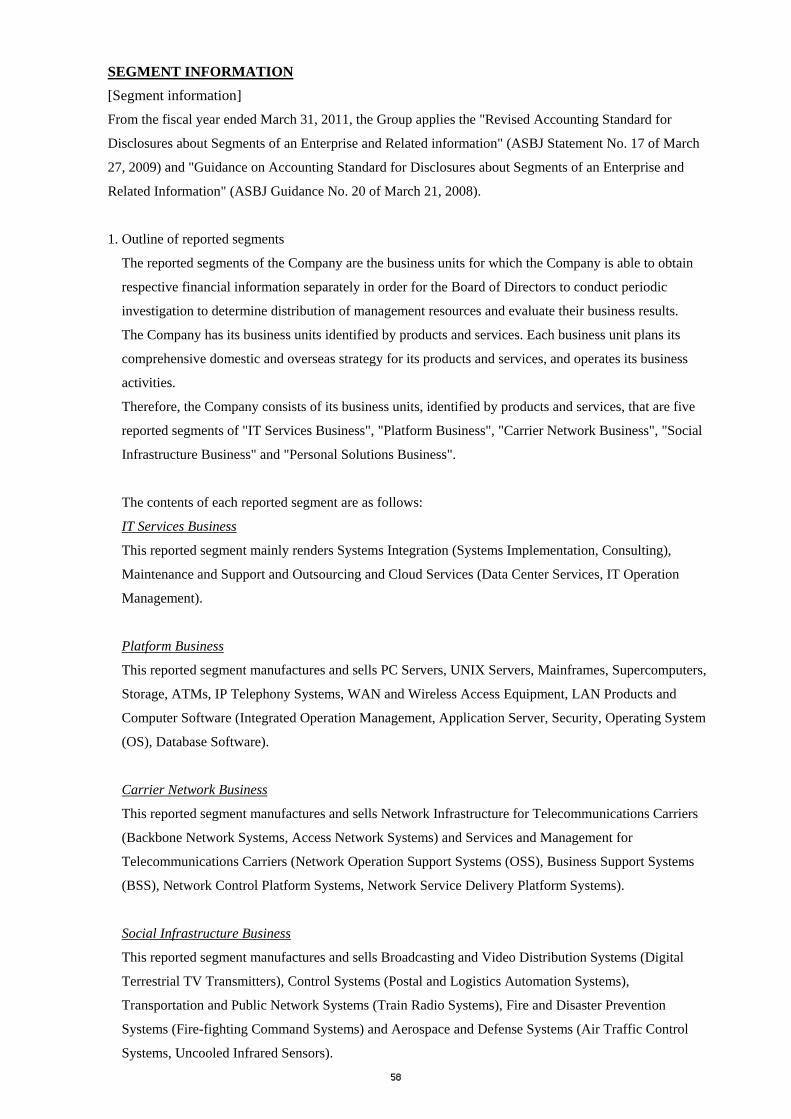
SEGMENT INFORMATION [Segment information] From the fiscal year ended March 31, 2011, the Group applies the "Revised Accounting Standard for
Disclosures about Segments of an Enterprise and Related information" (ASBJ Statement No. 17 of March
27, 2009) and "Guidance on Accounting Standard for Disclosures about Segments of an Enterprise and
Related Information" (ASBJ Guidance No. 20 of March 21, 2008).
1. Outline of reported segments
The reported segments of the Company are the business units for which the Company is able to obtain
respective financial information separately in order for the Board of Directors to conduct periodic
investigation to determine distribution of management resources and evaluate their business results.
The Company has its business units identified by products and services. Each business unit plans its
comprehensive domestic and overseas strategy for its products and services, and operates its business
activities.
Therefore, the Company consists of its business units, identified by products and services, that are five
reported segments of "IT Services Business", "Platform Business", "Carrier Network Business", "Social
Infrastructure Business" and "Personal Solutions Business".
The contents of each reported segment are as follows:
IT Services Business
This reported segment mainly renders Systems Integration (Systems Implementation, Consulting),
Maintenance and Support and Outsourcing and Cloud Services (Data Center Services, IT Operation
Management).
Platform Business
This reported segment manufactures and sells PC Servers, UNIX Servers, Mainframes, Supercomputers,
Storage, ATMs, IP Telephony Systems, WAN and Wireless Access Equipment, LAN Products and
Computer Software (Integrated Operation Management, Application Server, Security, Operating System
(OS), Database Software).
Carrier Network Business
This reported segment manufactures and sells Network Infrastructure for Telecommunications Carriers
(Backbone Network Systems, Access Network Systems) and Services and Management for
Telecommunications Carriers (Network Operation Support Systems (OSS), Business Support Systems
(BSS), Network Control Platform Systems, Network Service Delivery Platform Systems).
Social Infrastructure Business
This reported segment manufactures and sells Broadcasting and Video Distribution Systems (Digital
Terrestrial TV Transmitters), Control Systems (Postal and Logistics Automation Systems),
Transportation and Public Network Systems (Train Radio Systems), Fire and Disaster Prevention
Systems (Fire-fighting Command Systems) and Aerospace and Defense Systems (Air Traffic Control
Systems, Uncooled Infrared Sensors).
5858
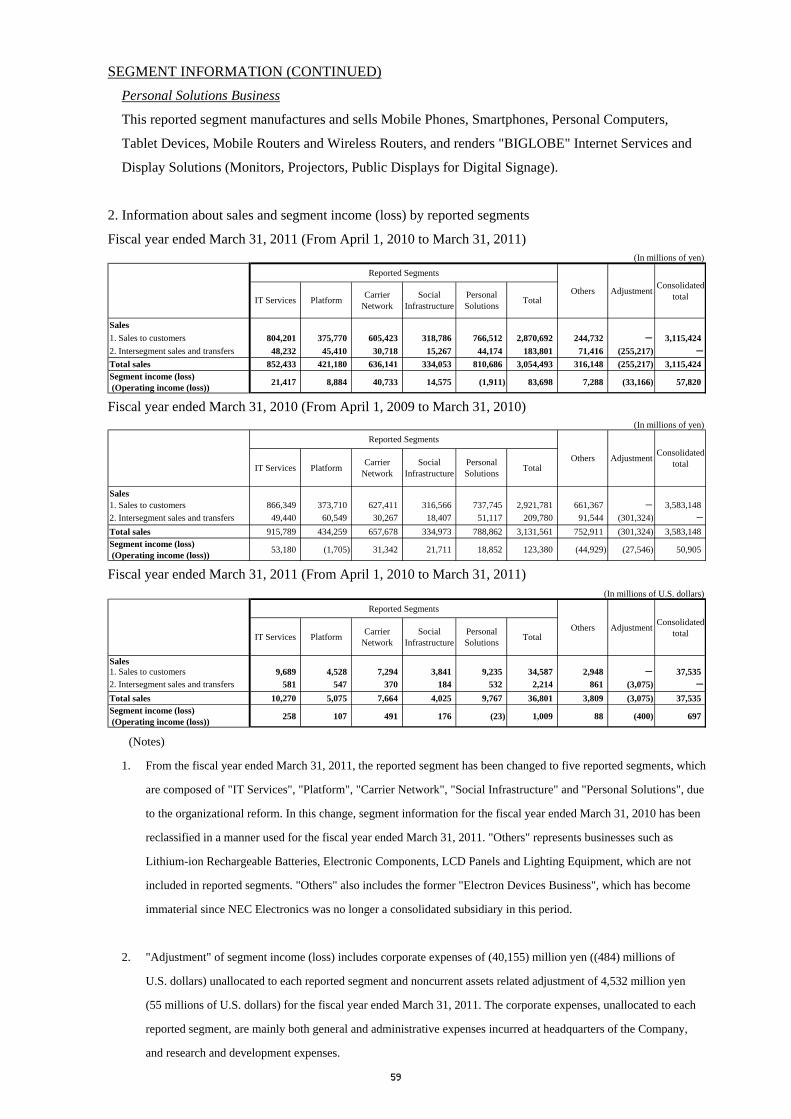
SEGMENT INFORMATION (CONTINUED) Personal Solutions Business
This reported segment manufactures and sells Mobile Phones, Smartphones, Personal Computers,
Tablet Devices, Mobile Routers and Wireless Routers, and renders "BIGLOBE" Internet Services and
Display Solutions (Monitors, Projectors, Public Displays for Digital Signage).
2. Information about sales and segment income (loss) by reported segments
Fiscal year ended March 31, 2011 (From April 1, 2010 to March 31, 2011) (In millions of yen)
IT Services Platform CarrierNetwork
SocialInfrastructure
PersonalSolutions Total
Sales1. Sales to customers 804,201 375,770 605,423 318,786 766,512 2,870,692 244,732 - 3,115,4242. Intersegment sales and transfers 48,232 45,410 30,718 15,267 44,174 183,801 71,416 (255,217) -
Total sales 852,433 421,180 636,141 334,053 810,686 3,054,493 316,148 (255,217) 3,115,424Segment income (loss) (Operating income (loss)) 21,417 8,884 40,733 14,575 (1,911) 83,698 7,288 (33,166) 57,820
Consolidatedtotal
Reported Segments
Others Adjustment
Fiscal year ended March 31, 2010 (From April 1, 2009 to March 31, 2010)
(In millions of yen)
IT Services Platform CarrierNetwork
SocialInfrastructure
PersonalSolutions Total
Sales1. Sales to customers 866,349 373,710 627,411 316,566 737,745 2,921,781 661,367 - 3,583,1482. Intersegment sales and transfers 49,440 60,549 30,267 18,407 51,117 209,780 91,544 (301,324) -
Total sales 915,789 434,259 657,678 334,973 788,862 3,131,561 752,911 (301,324) 3,583,148Segment income (loss) (Operating income (loss)) 53,180 (1,705) 31,342 21,711 18,852 123,380 (44,929) (27,546) 50,905
Reported Segments
Others Adjustment Consolidatedtotal
Fiscal year ended March 31, 2011 (From April 1, 2010 to March 31, 2011)
(In millions of U.S. dollars)
IT Services Platform CarrierNetwork
SocialInfrastructure
PersonalSolutions Total
Sales1. Sales to customers 9,689 4,528 7,294 3,841 9,235 34,587 2,948 - 37,5352. Intersegment sales and transfers 581 547 370 184 532 2,214 861 (3,075) -
Total sales 10,270 5,075 7,664 4,025 9,767 36,801 3,809 (3,075) 37,535Segment income (loss) (Operating income (loss)) 258 107 491 176 (23) 1,009 88 (400) 697
Adjustment
Reported Segments
Others Consolidatedtotal
(Notes)
1. From the fiscal year ended March 31, 2011, the reported segment has been changed to five reported segments, which
are composed of "IT Services", "Platform", "Carrier Network", "Social Infrastructure" and "Personal Solutions", due
to the organizational reform. In this change, segment information for the fiscal year ended March 31, 2010 has been
reclassified in a manner used for the fiscal year ended March 31, 2011. "Others" represents businesses such as
Lithium-ion Rechargeable Batteries, Electronic Components, LCD Panels and Lighting Equipment, which are not
included in reported segments. "Others" also includes the former "Electron Devices Business", which has become
immaterial since NEC Electronics was no longer a consolidated subsidiary in this period.
2. "Adjustment" of segment income (loss) includes corporate expenses of (40,155) million yen ((484) millions of
U.S. dollars) unallocated to each reported segment and noncurrent assets related adjustment of 4,532 million yen
(55 millions of U.S. dollars) for the fiscal year ended March 31, 2011. The corporate expenses, unallocated to each
reported segment, are mainly both general and administrative expenses incurred at headquarters of the Company,
and research and development expenses. 5959

SEGMENT INFORMATION (CONTINUED) [Related information] Information about geographic areas Sales Fiscal year ended March 31, 2011 (From April 1, 2010 to March 31, 2011)
(In millions of yen)
(In millions of U.S. dollars)
2,543 37,5351,32331,760 1,909Japan Asia Europe Others Total
211,096 3,115,424Others Total
2,636,075 158,470Japan Asia Europe
109,783
(Note) Sales, based on the locations of customers, are classified by country or region.
6060
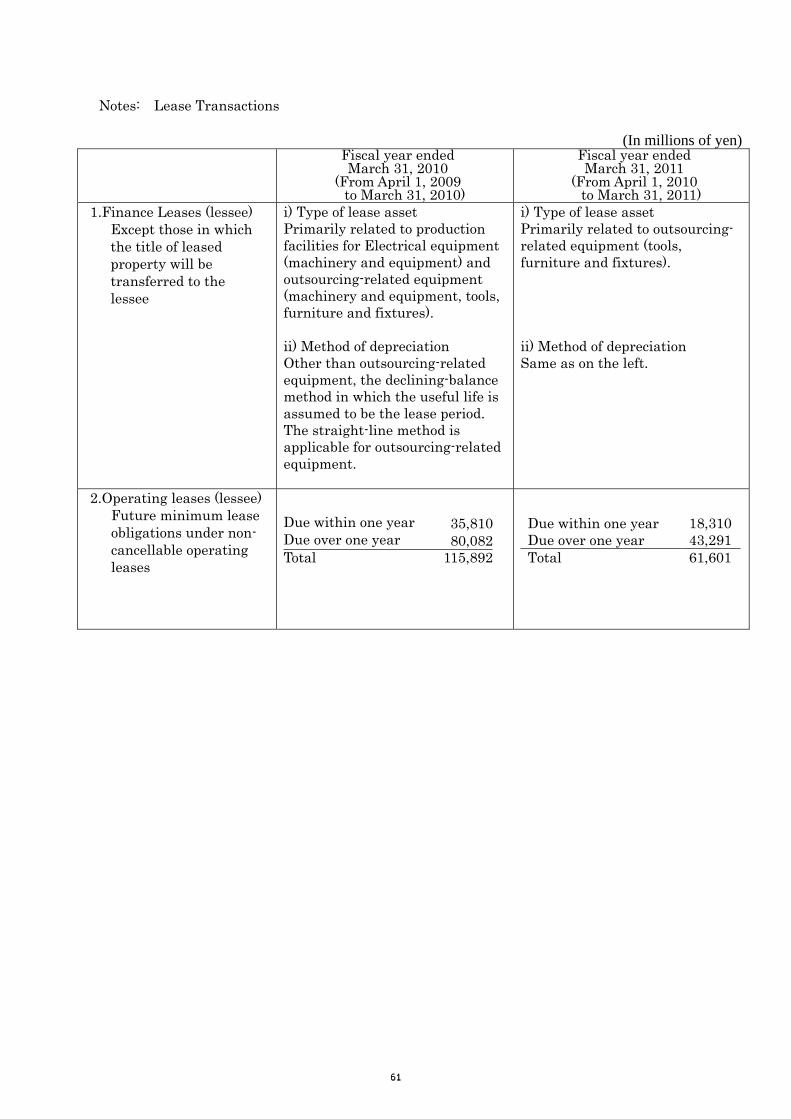
Notes: Lease Transactions
(In millions of yen)
Fiscal year ended March 31, 2010
(From April 1, 2009 to March 31, 2010)
Fiscal year ended March 31, 2011
(From April 1, 2010 to March 31, 2011)
1.Finance Leases (lessee) Except those in which the title of leased property will be transferred to the lessee
i) Type of lease asset Primarily related to production facilities for Electrical equipment (machinery and equipment) and outsourcing-related equipment (machinery and equipment, tools, furniture and fixtures). ii) Method of depreciation Other than outsourcing-related equipment, the declining-balance method in which the useful life is assumed to be the lease period. The straight-line method is applicable for outsourcing-related equipment.
i) Type of lease asset Primarily related to outsourcing-related equipment (tools, furniture and fixtures). ii) Method of depreciation Same as on the left.
2.Operating leases (lessee) Future minimum lease obligations under non-cancellable operating leases
Due within one year 35,810Due over one year 80,082 Total 115,892
Due within one year 18,310Due over one year 43,291Total 61,601
6161
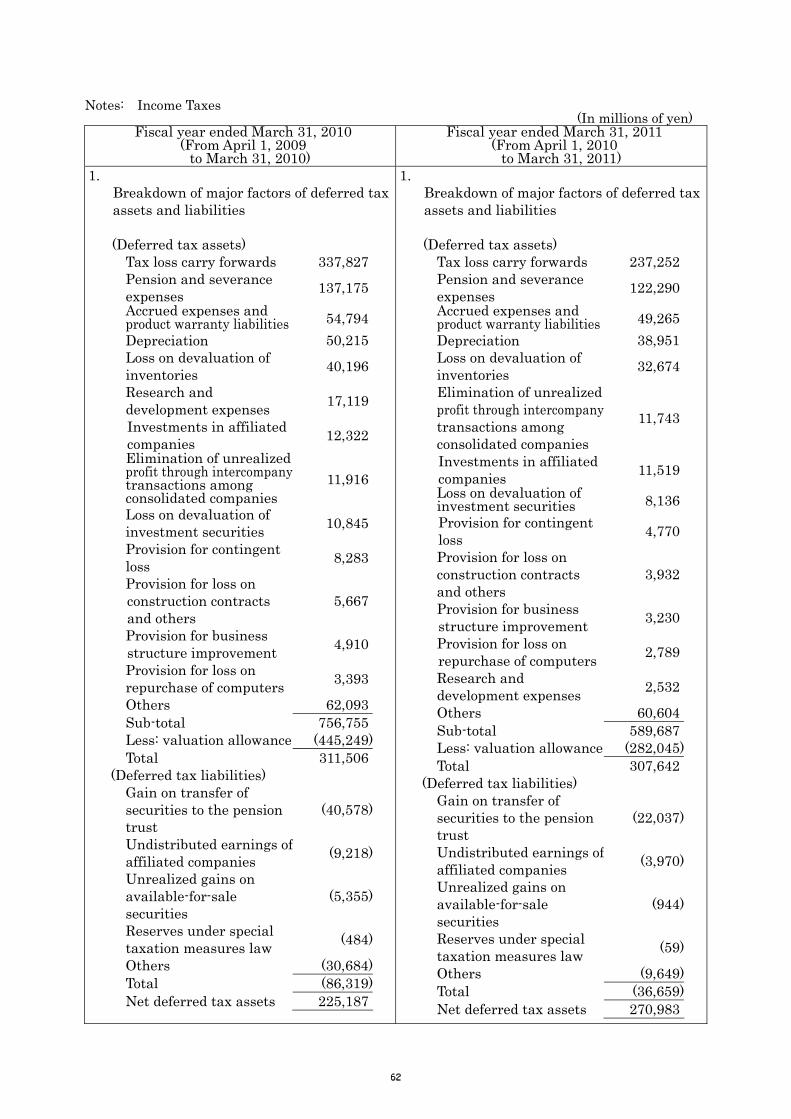
Notes: Income Taxes (In millions of yen)
Fiscal year ended March 31, 2010 (From April 1, 2009
to March 31, 2010)
Fiscal year ended March 31, 2011 (From April 1, 2010
to March 31, 2011) 1.
Breakdown of major factors of deferred tax assets and liabilities
(Deferred tax assets)
Tax loss carry forwards 337,827 Pension and severance expenses 137,175 Accrued expenses and product warranty liabilities 54,794 Depreciation 50,215 Loss on devaluation of inventories 40,196
Research and development expenses 17,119
Investments in affiliated companies 12,322Elimination of unrealized profit through intercompanytransactions among consolidated companies
11,916
Loss on devaluation of investment securities 10,845
Provision for contingent loss 8,283
Provision for loss on construction contracts and others
5,667
Provision for business structure improvement 4,910
Provision for loss on repurchase of computers 3,393
Others 62,093 Sub-total 756,755 Less: valuation allowance (445,249) Total 311,506
(Deferred tax liabilities) Gain on transfer of securities to the pension trust
(40,578)
Undistributed earnings of affiliated companies (9,218)
Unrealized gains on available-for-sale securities
(5,355)
Reserves under special taxation measures law (484)
Others (30,684) Total (86,319) Net deferred tax assets 225,187
1. Breakdown of major factors of deferred tax assets and liabilities
(Deferred tax assets)
Tax loss carry forwards 237,252 Pension and severance expenses 122,290 Accrued expenses and product warranty liabilities 49,265 Depreciation 38,951 Loss on devaluation of inventories 32,674
Elimination of unrealized profit through intercompanytransactions among consolidated companies
11,743
Investments in affiliated companies 11,519 Loss on devaluation of investment securities 8,136 Provision for contingent loss 4,770
Provision for loss on construction contracts and others
3,932
Provision for business structure improvement 3,230
Provision for loss on repurchase of computers 2,789
Research and development expenses 2,532
Others 60,604 Sub-total 589,687 Less: valuation allowance (282,045) Total 307,642
(Deferred tax liabilities) Gain on transfer of securities to the pension trust
(22,037)
Undistributed earnings of affiliated companies (3,970)
Unrealized gains on available-for-sale securities
(944)
Reserves under special taxation measures law (59)
Others (9,649) Total (36,659) Net deferred tax assets 270,983
6262

Fiscal year ended March 31, 2010 (From April 1, 2009
to March 31, 2010)
Fiscal year ended March 31, 2011 (From April 1, 2010
to March 31, 2011) Note: Net deferred tax assets are included
in the consolidated balance sheets as follows.
Current assets -deferred tax assets 93,307 -deferred tax assets Noncurrent assets -deferred tax assets 140,829 -deferred tax assets Current liabilities -others (36) Current liabilities
Noncurrent liabilities -deferred tax liabilities (8,913) -deferred tax liabilities
Note: Net deferred tax assets are included in the consolidated balance sheets as follows.
Current assets 97,431
Noncurrent assets 174,707
-others (30)
Noncurrent liabilities (1,125)
2.
The reconciliation between the effective tax rate reflected in the consolidated financial statements and the statutory tax rate is summarized as follows:
Statutory tax rate
40.5 %
(Reconciliation) Changes in valuation allowance 19.2
Undistributed earnings of affiliated companies 11.3
Amortization of goodwill 7.9 Non-deductible expenses for tax purposes 1.1
Equity in earnings(losses) of affiliated companies (0.3)
Elimination of unrealized profit through intercompany transactions among consolidated companies
(0.4)
Tax rates difference relating to overseas subsidiaries
(5.5)
Others 0.3 Effective tax rate 74.1 %
2.
The reconciliation between the effective tax rate reflected in the consolidated financial statements and the statutory tax rate is summarized as follows:
Statutory tax rate
(40.5)%
(Reconciliation) Equity in earnings(losses) of affiliated companies 98.6
Changes in valuation allowance 58.3
Amortization of goodwill 33.5 Tax rates difference relating to overseas subsidiaries
5.2
Non-deductible expenses for tax purposes 5.0
Undistributed earnings of affiliated companies (17.4)
Retirement benefit trust (105.9) Gain(loss) on change in equity (118.7)
Others 25.8 Effective tax rate (56.1)%
6363

Notes: Marketable and Investment Securities Fiscal year ended March 31, 2010
1. Available-for-sale securities (As of March 31, 2010)
(In millions of yen)
Description Balance sheet value Acquisition cost Unrealized gains
(losses) (1) Stocks 64,145 37,731 26,414(2) Bonds
(a) Governmental and municipal bonds
- - -
(b) Corporate bonds
- - -
(3) Others 60 22 38
Securities with balance sheet value exceeding acquisition cost
Sub-total 64,205 37,753 26,452(1) Stocks 19,100 24,794 (5,694)(2) Bonds
(a) Governmental and municipal bonds
- - -
(b) Corporate bonds
1,721 1,899 (178)
(3) Others 138,126 138,928 (802)
Securities with balance sheet value not exceeding acquisition cost
Sub-total 158,947 165,621 (6,674)Total 223,152 203,374 19,778
Notes:
The followings are not included in “1. Available-for-sale securities” table above - because of lack of their available market price and not being able to estimate reasonably for their future cash flows: Unlisted stocks (balance sheet value of 59,837 million yen), Investments in limited partnerships and similar partnerships under foreign laws (balance sheet value of 4,600 million yen), and Others (balance sheet value of 379 million yen).
6464
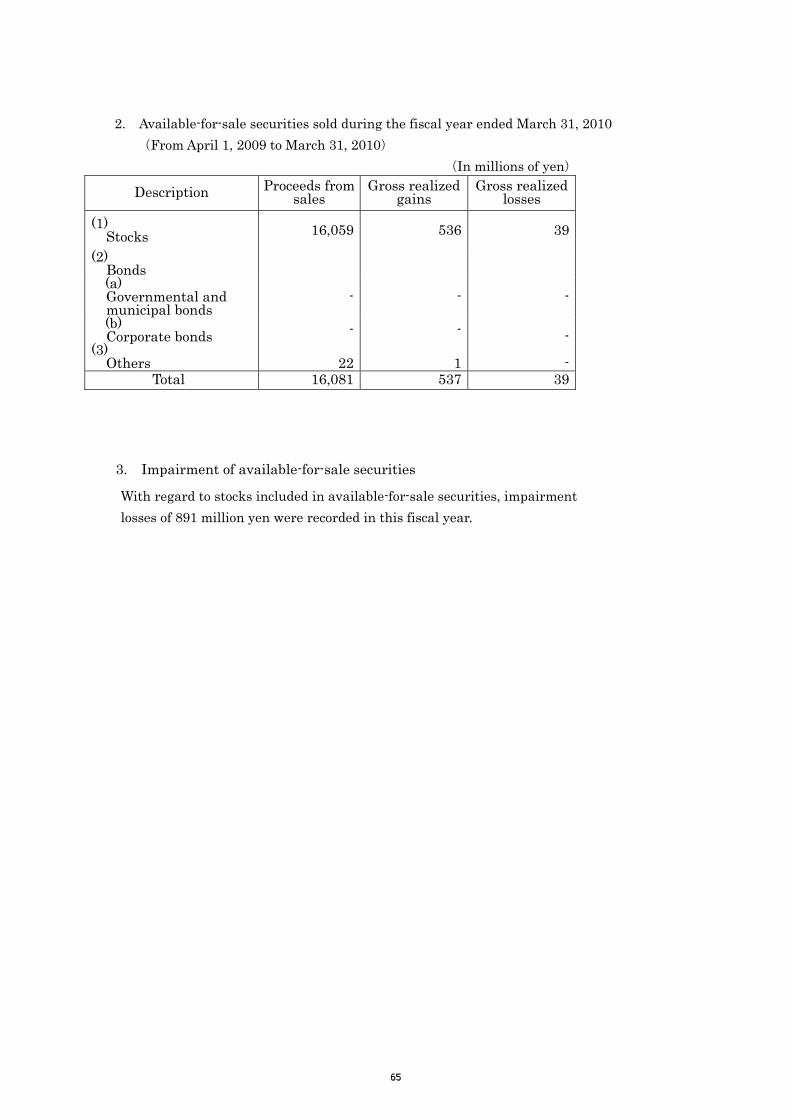
2. Available-for-sale securities sold during the fiscal year ended March 31, 2010
(From April 1, 2009 to March 31, 2010) (In millions of yen)
Description Proceeds from sales
Gross realized gains
Gross realized losses
(1) Stocks 16,059 536
39
(2)
Bonds
(a) Governmental and
municipal bonds - -
-
(b) Corporate bonds - -
- (3)
Others 22 1
- Total 16,081 537 39
3. Impairment of available-for-sale securities
With regard to stocks included in available-for-sale securities, impairment losses of 891 million yen were recorded in this fiscal year.
6565

Fiscal year ended March 31, 2011
1. Available-for-sale securities (As of March 31, 2011) (In millions of yen)
Description Balance sheet value Acquisition cost Unrealized gains
(losses) (1) Stocks 49,253 29,160 20,093(2) Bonds
(a) Governmental and municipal bonds
- - -
(b) Corporate bonds
- - -
(3) Others 55 19 36
Securities with balance sheet value exceeding acquisition cost
Sub-total 49,308 29,179 20,129(1) Stocks 27,047 35,462 (8,415)(2) Bonds
(a) Governmental and municipal bonds
- - -
(b) Corporate bonds
812 1,000 (188)
(3) Others 22,810 23,832 (1,022)
Securities with balance sheet value not exceeding acquisition cost
Sub-total 50,669 60,294 (9,625)Total 99,977 89,473 10,504
Notes:
The followings are not included in “1. Available-for-sale securities” table above - because of lack of their available market price and not being able to estimate reasonably for their future cash flows: Unlisted stocks (balance sheet value of 53,565 million yen), Investments in limited partnerships and similar partnerships under foreign laws (balance sheet value of 4,577 million yen), and Others (balance sheet value of 330 million yen).
6666
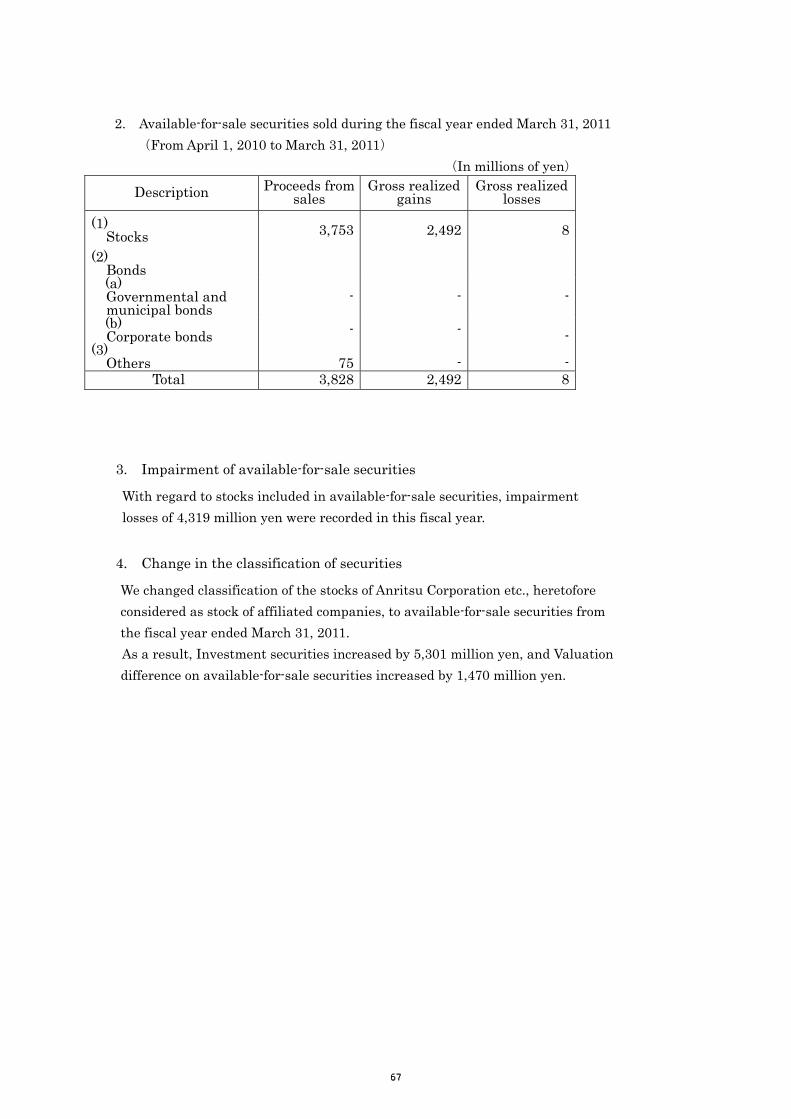
2. Available-for-sale securities sold during the fiscal year ended March 31, 2011
(From April 1, 2010 to March 31, 2011) (In millions of yen)
Description Proceeds from sales
Gross realized gains
Gross realized losses
(1) Stocks 3,753 2,492
8
(2) Bonds
(a) Governmental and
municipal bonds - -
-
(b) Corporate bonds - -
- (3)
Others 75 -
- Total 3,828 2,492 8
3. Impairment of available-for-sale securities
With regard to stocks included in available-for-sale securities, impairment losses of 4,319 million yen were recorded in this fiscal year.
4. Change in the classification of securities
We changed classification of the stocks of Anritsu Corporation etc., heretofore considered as stock of affiliated companies, to available-for-sale securities from the fiscal year ended March 31, 2011. As a result, Investment securities increased by 5,301 million yen, and Valuation difference on available-for-sale securities increased by 1,470 million yen.
6767
Notes: Accounting for Retirement Benefits
1. Overview of the retirement benefit plans
The Company and its domestic consolidated subsidiaries have defined benefit plans, which include the defined benefit pension plans, the tax-qualified pension plans and the lump-sum severance payment plans. Additional retirement benefits are paid in certain circumstances. Most of overseas consolidated subsidiaries have various types of pension benefit plans which cover substantially all employees. Those plans are mainly defined contribution plans and defined benefit plans. The NEC Welfare Pension Fund, established by the Company and certain domestic consolidated subsidiaries, received approval from the Minister of Health, Labor and Welfare with respect to its application for exemption from the benefit obligation related to future employee services under the substitutional portion of the pension fund in September 2002 and the portion related to past services in December 2003. Following the approval, the Company and certain domestic consolidated subsidiaries implemented the defined benefit pension plan and terminated the welfare pension fund plans. After the fiscal year ended March 31, 2004, the Company and certain domestic consolidated subsidiaries implemented point-based plans, under which benefits are calculated based on accumulated points allocated to employees according to their class of positions and evaluations. The Company and certain domestic consolidated subsidiaries terminated their welfare pension fund plans and tax-qualified pension plans and implemented cash-balance plans. Under these plans, benefits are calculated based on both accumulated points allocated to employees according to their class of positions and accumulated interest points recalculated based on the market interest rates.
6868
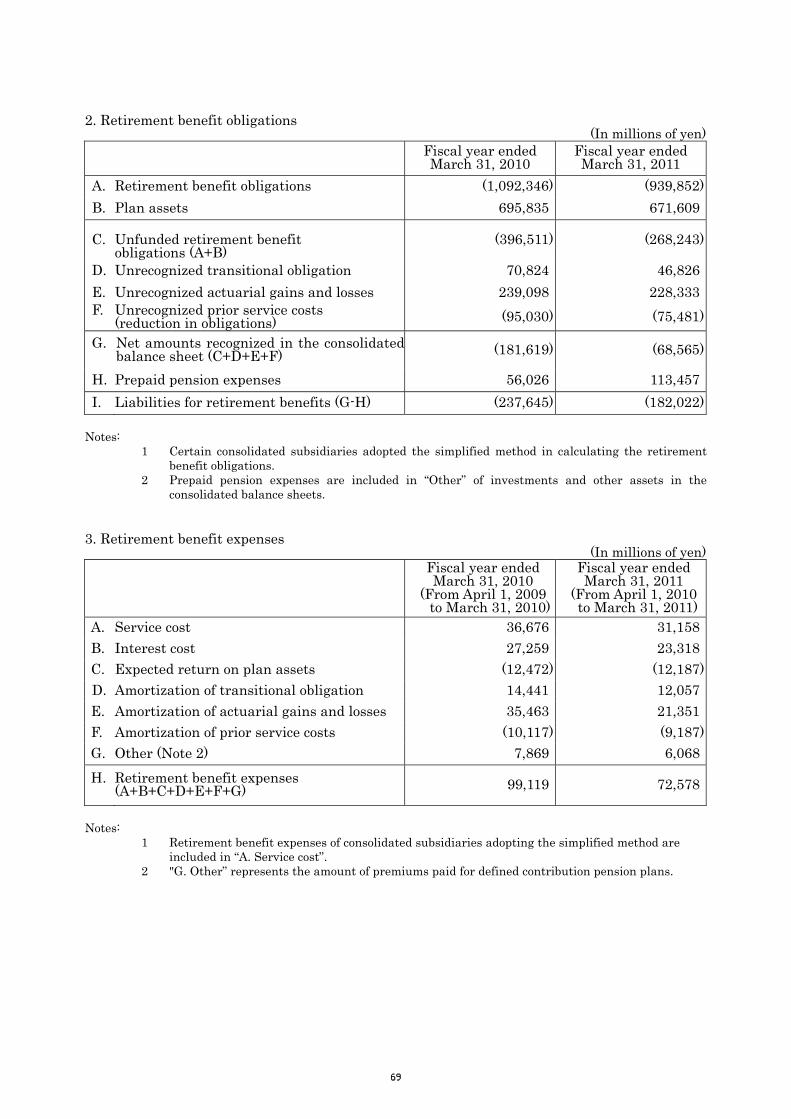
2. Retirement benefit obligations
(In millions of yen) Fiscal year ended
March 31, 2010 Fiscal year ended March 31, 2011
A. Retirement benefit obligations (1,092,346) (939,852)B. Plan assets 695,835 671,609
C.
Unfunded retirement benefit obligations (A+B)
(396,511) (268,243)
D. Unrecognized transitional obligation 70,824 46,826E. Unrecognized actuarial gains and losses 239,098 228,333F.
Unrecognized prior service costs (reduction in obligations) (95,030) (75,481)
G.
Net amounts recognized in the consolidatedbalance sheet (C+D+E+F) (181,619) (68,565)
H. Prepaid pension expenses 56,026 113,457I. Liabilities for retirement benefits (G-H) (237,645) (182,022)
Notes:
1 Certain consolidated subsidiaries adopted the simplified method in calculating the retirement benefit obligations.
2 Prepaid pension expenses are included in “Other” of investments and other assets in the consolidated balance sheets.
3. Retirement benefit expenses
(In millions of yen)
Fiscal year ended March 31, 2010
(From April 1, 2009 to March 31, 2010)
Fiscal year ended March 31, 2011
(From April 1, 2010 to March 31, 2011)
A. Service cost 36,676 31,158B. Interest cost 27,259 23,318C. Expected return on plan assets (12,472) (12,187)D. Amortization of transitional obligation 14,441 12,057E. Amortization of actuarial gains and losses 35,463 21,351F. Amortization of prior service costs (10,117) (9,187)G. Other (Note 2) 7,869 6,068H.
Retirement benefit expenses (A+B+C+D+E+F+G) 99,119 72,578
Notes:
1 Retirement benefit expenses of consolidated subsidiaries adopting the simplified method are included in “A. Service cost”.
2 "G. Other” represents the amount of premiums paid for defined contribution pension plans.
6969

4. Basis for calculation of retirement benefit obligations
Fiscal year ended March 31, 2010
(From April 1, 2009 to March 31, 2010)
Fiscal year ended March 31, 2011
(From April 1, 2010 to March 31, 2011)
A. Allocation method for projected retirement benefit cost
Mainly, point basis
Same as on the left.
B. Discount rate Mainly, 2.5% Same as on the left.
C. Expected rate of return on plan assets Mainly, 2.5% Same as on the left. D. Period for amortization of prior service costs
Mainly, 13 years (Prior service costs are amortized on a straight-line basis over certain years within employees’ average remaining service periods as ncurred.) i
Same as on the left.
E. Period for amortization of actuarial gains
and losses
Mainly, 13 years (Actuarial gains and losses are amortized on a straight-line basis over certain years within employees’ average remaining service periods, starting from the following year after incurred.)
Same as on the left.
F. Period for amortization of transitional
obligation
Mainly, 15 years Same as on the left.
7070
Notes: Business Combinations Fiscal year ended March 31, 2010 (From April 1, 2009 to March 31, 2010) Not Applicable
Fiscal year ended March 31, 2011 (From April 1, 2010 to March 31, 2011) On April 1, 2010, the Company’s consolidated subsidiary, NEC Electronics Corporation merged with Renesas Technology Corp., and changed its name to Renesas Electronics Corporation (Renesas EL). As a result of this merger, Renesas EL has become an affiliate applying for the equity method of accounting. Outline of the merger is as follows. Outline of the business combination Company profiles Surviving company: NEC Electronics Corporation Major operation: R&D, manufacture, sale and servicing of semiconductor devices mainly on system LSIs Merged company: Renesas Technology Corp. Major operation: Development, design, manufacture, sale and servicing of SoC products such as MCUs, logic devices and analog devices; discrete semiconductor products; and memory products such as SRAM Reason for the business combination In order to strengthen their business foundations and technological assets, while increasing corporate value through enhanced customer satisfaction Date of the business combination April 1, 2010 Legal form of the business combination Merger by absorption with NEC Electronics Corporation as surviving company (Name of the new company: Renesas Electronics Corporation)
7171

Outline of accounting method The company applies the purchase method to the business combination with NEC Electronics Corporation as acquiring company and the accounting procedures stipulated by Articles 48, of the “Accounting Standard for Business Divestitures” (ASBJ Statement No. 7 of December 26, 2008). Name of the reported segment in which the subsidiary was included In the business segment information for fiscal year ended March 31, 2010, the subsidiary is included in “Electron Devices”. If this information is represented in a manner used for the fiscal year ended March 31, 2011, this is included in the “Others”.
7272
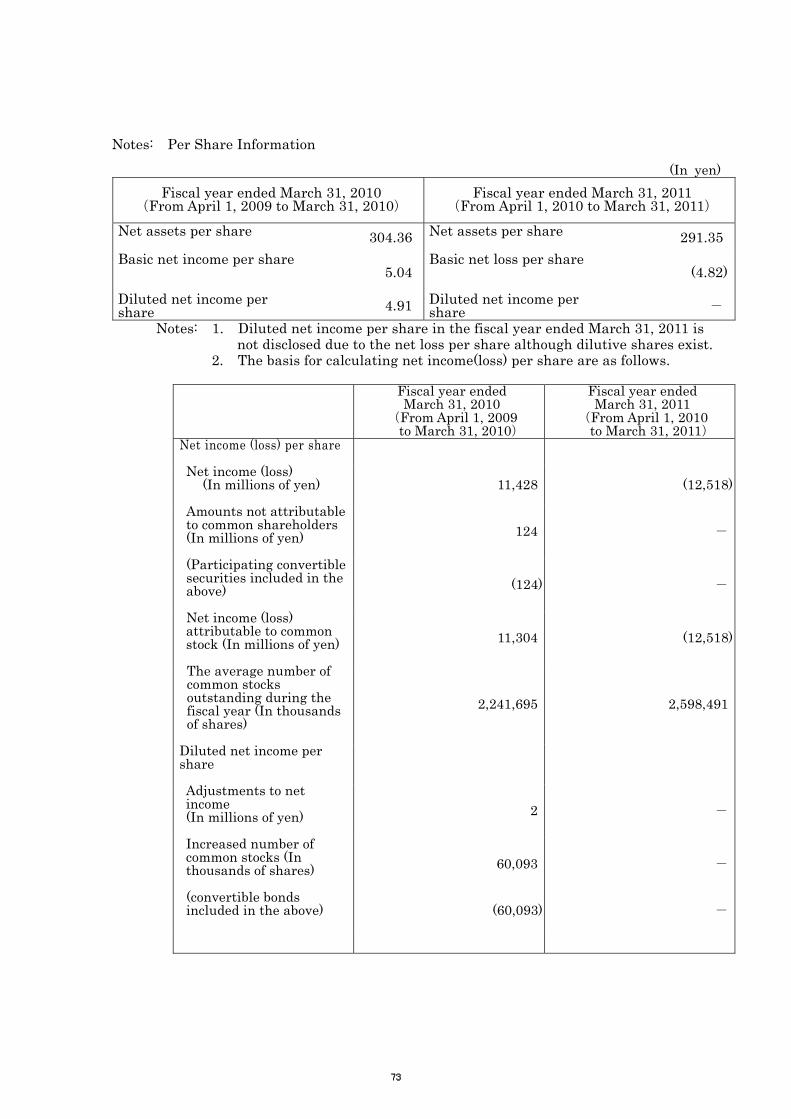
Notes: Per Share Information
(In yen) Fiscal year ended March 31, 2010
(From April 1, 2009 to March 31, 2010) Fiscal year ended March 31, 2011
(From April 1, 2010 to March 31, 2011) Net assets per share 304.36
Net assets per share 291.35
Basic net income per share
5.04
Diluted net income per share 4.91
Basic net loss per share
(4.82)
Diluted net income per share -
Notes: 1. Diluted net income per share in the fiscal year ended March 31, 2011 is not disclosed due to the net loss per share although dilutive shares exist.
2. The basis for calculating net income(loss) per share are as follows.
Fiscal year ended March 31, 2010
(From April 1, 2009 to March 31, 2010)
Fiscal year ended March 31, 2011
(From April 1, 2010 to March 31, 2011)
Net income (loss) per share
Net income (loss) (In millions of yen)
11,428 (12,518)
Amounts not attributableto common shareholders (In millions of yen)
124 -
(Participating convertiblesecurities included in theabove)
(124) -
Net income (loss) attributable to common stock (In millions of yen)
11,304 (12,518)
The average number of common stocks outstanding during the fiscal year (In thousands of shares)
2,241,695 2,598,491
Diluted net income per share Adjustments to net income (In millions of yen)
2 -
Increased number of common stocks (In thousands of shares)
60,093 -
(convertible bonds included in the above) (60,093) -
7373
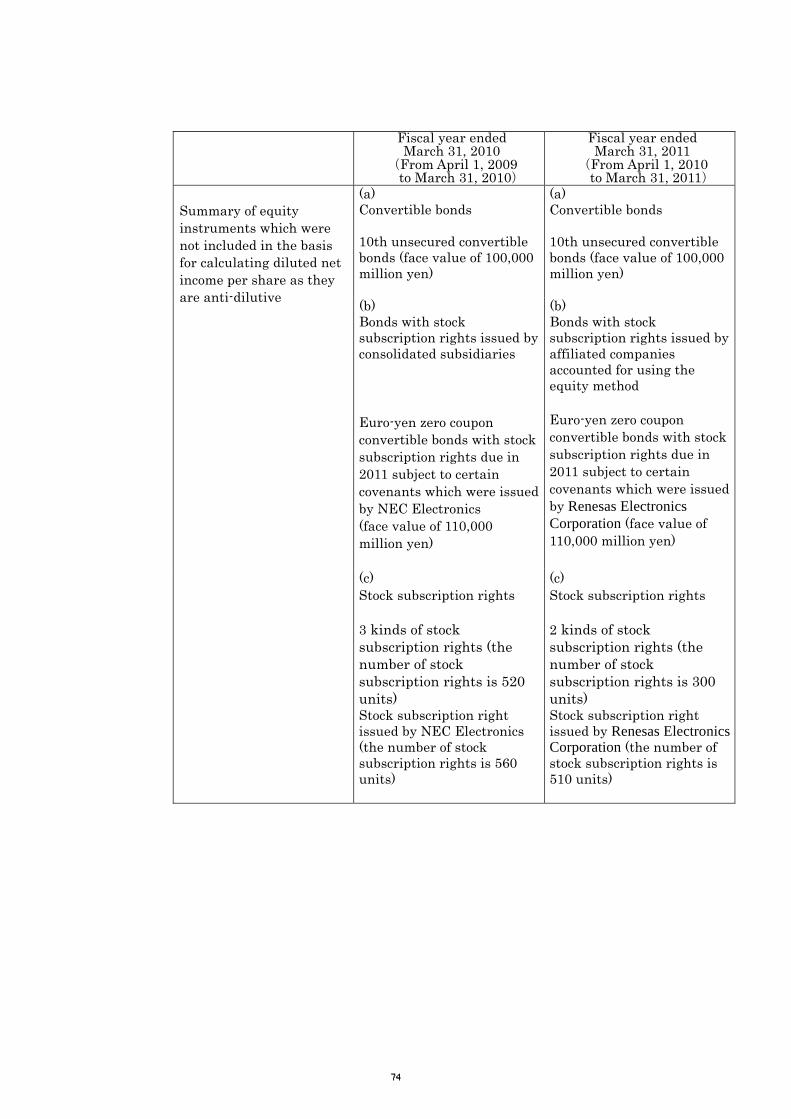
Fiscal year ended March 31, 2010
(From April 1, 2009 to March 31, 2010)
Fiscal year ended March 31, 2011
(From April 1, 2010 to March 31, 2011)
(a) Convertible bonds 10th unsecured convertible bonds (face value of 100,000 million yen)
(a) Convertible bonds 10th unsecured convertible bonds (face value of 100,000 million yen)
(b) Bonds with stock subscription rights issued by consolidated subsidiaries Euro-yen zero coupon convertible bonds with stock subscription rights due in 2011 subject to certain covenants which were issued by NEC Electronics (face value of 110,000 million yen)
(b) Bonds with stock subscription rights issued by affiliated companies accounted for using the equity method Euro-yen zero coupon convertible bonds with stock subscription rights due in 2011 subject to certain covenants which were issued by Renesas Electronics Corporation (face value of 110,000 million yen)
Summary of equity instruments which were not included in the basis for calculating diluted net income per share as they are anti-dilutive
(c) Stock subscription rights 3 kinds of stock subscription rights (the number of stock subscription rights is 520 units) Stock subscription right issued by NEC Electronics (the number of stock subscription rights is 560 units)
(c) Stock subscription rights 2 kinds of stock subscription rights (the number of stock subscription rights is 300 units) Stock subscription right issued by Renesas Electronics Corporation (the number of stock subscription rights is 510 units)
7474
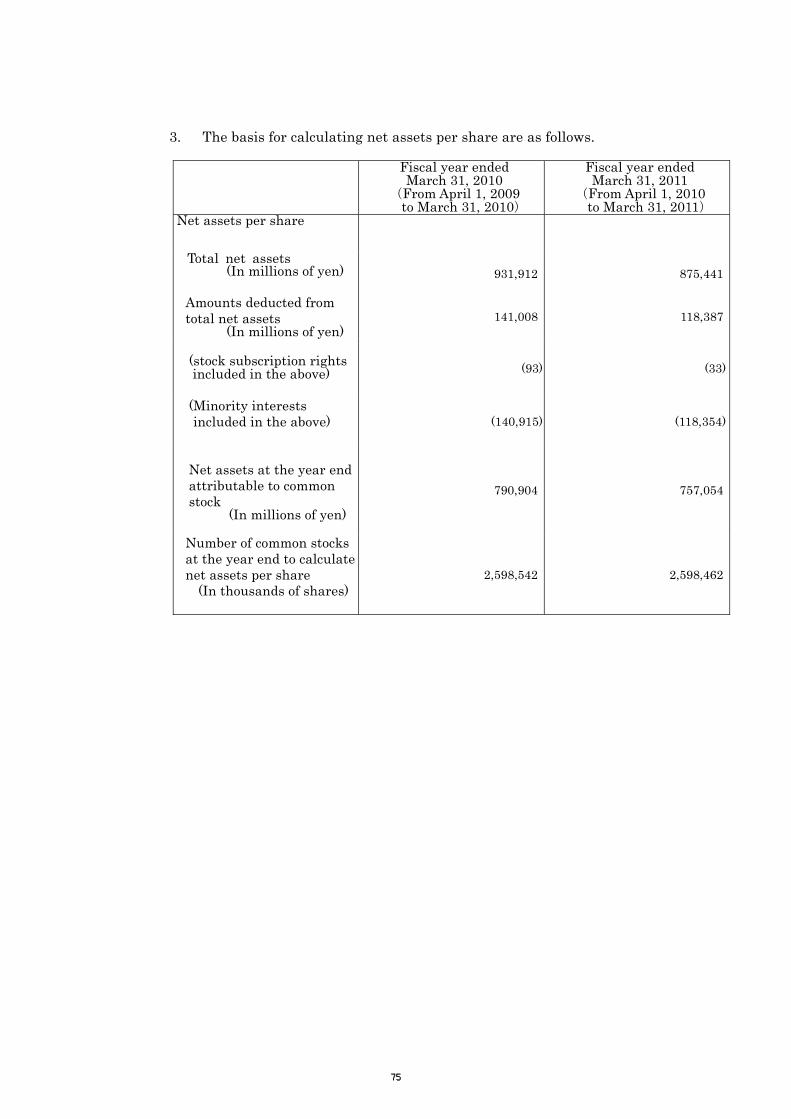
3. The basis for calculating net assets per share are as follows.
Fiscal year ended March 31, 2010
(From April 1, 2009 to March 31, 2010)
Fiscal year ended March 31, 2011
(From April 1, 2010 to March 31, 2011)
Net assets per share
Total net assets (In millions of yen)
931,912 875,441
Amounts deducted from total net assets
(In millions of yen) 141,008 118,387
(stock subscription rights included in the above)
(93) (33)
(Minority interests included in the above)
(140,915) (118,354)
Net assets at the year end attributable to common stock
(In millions of yen)
790,904 757,054
Number of common stocks at the year end to calculate net assets per share
(In thousands of shares)
2,598,542 2,598,462
7575

Notes: Subsequent Events
Fiscal year ended March 31, 2010 (From April 1, 2009
to March 31, 2010)
Fiscal year ended March 31, 2011 (From April 1, 2010
to March 31, 2011) As part of business structure reform aimed at strengthening business foundations and technological assets, and increasing corporate value through enhanced customer satisfaction, on April 1, 2010, based on the merger agreement reached on December 15, 2009, the Company's consolidating subsidiary (included in electron devices segment and operating mainly semiconductor business), NEC Electronics Corporation merged with Renesas Technology Corp., an entity operating in the semiconductor business, and changed its name to Renesas Electronics Corporation (Renesas EL). As a result of this merger, Renesas EL has become an affiliate applying for the equity method of accounting. The Company will apply the business combination accounting for shareholders stipulated in the Paragraph 48 of “Accounting Standard for Business Divestitures (Accounting Standards Board of Japan – ASBJ Statement No.7)” after the application of the purchase method of accounting by NEC Electronics Corporation being as an acquirer on this merger transaction. On April 1, 2010, the Company also subscribed the third-party allotment, new shares issued by Renesas EL, as follows: Number of new shares subscribed:
61,395,857 shares of common stock Issue price: 917 yen per share Aggregated subscription price:
56,300 million yen Ownership ratio of the Company
after the third-party allotment: 34.0 % (see note)
Note: excludes shares whose voting rights is to be exercised at the instruction of the Company based on the employee pension and retirement trust agreement with the Sumitomo Trust and Banking Co. (representing 1.5% of ownership ratio)
____________
7676
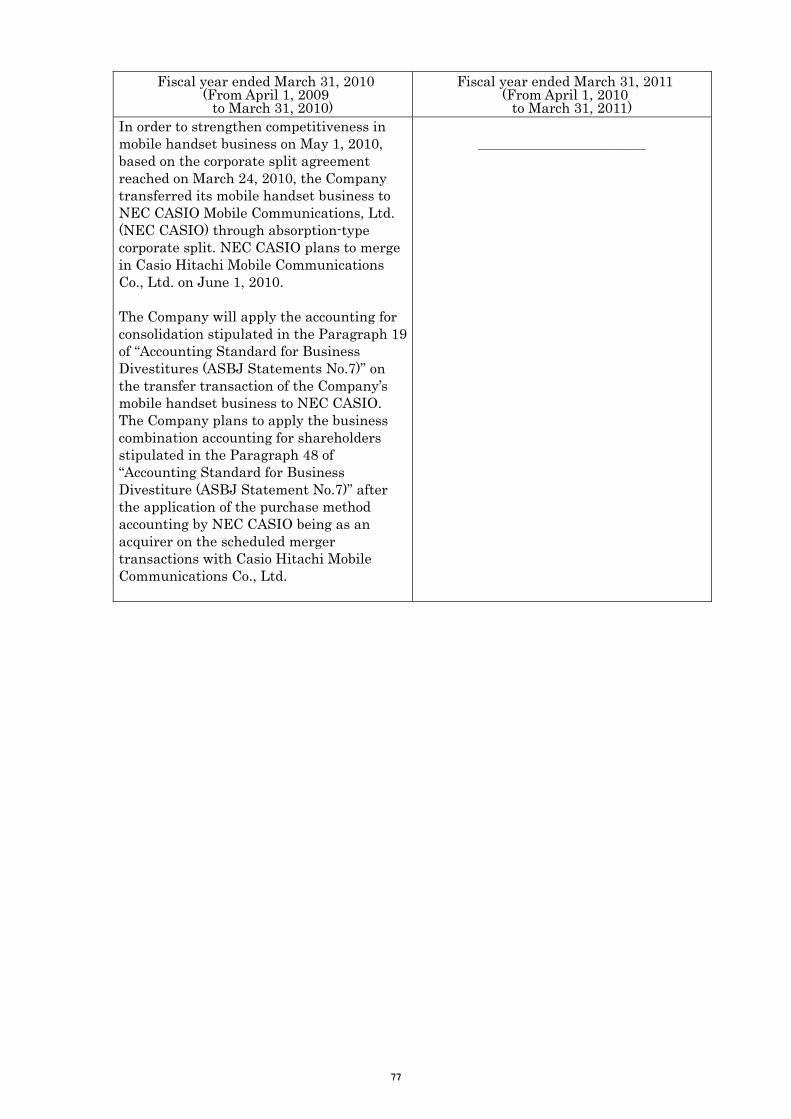
Fiscal year ended March 31, 2010 (From April 1, 2009
to March 31, 2010)
Fiscal year ended March 31, 2011 (From April 1, 2010
to March 31, 2011) In order to strengthen competitiveness in mobile handset business on May 1, 2010, based on the corporate split agreement reached on March 24, 2010, the Company transferred its mobile handset business to NEC CASIO Mobile Communications, Ltd. (NEC CASIO) through absorption-type corporate split. NEC CASIO plans to merge in Casio Hitachi Mobile Communications Co., Ltd. on June 1, 2010. The Company will apply the accounting for consolidation stipulated in the Paragraph 19 of “Accounting Standard for Business Divestitures (ASBJ Statements No.7)” on the transfer transaction of the Company’s mobile handset business to NEC CASIO. The Company plans to apply the business combination accounting for shareholders stipulated in the Paragraph 48 of “Accounting Standard for Business Divestiture (ASBJ Statement No.7)” after the application of the purchase method accounting by NEC CASIO being as an acquirer on the scheduled merger transactions with Casio Hitachi Mobile Communications Co., Ltd.
____________
7777
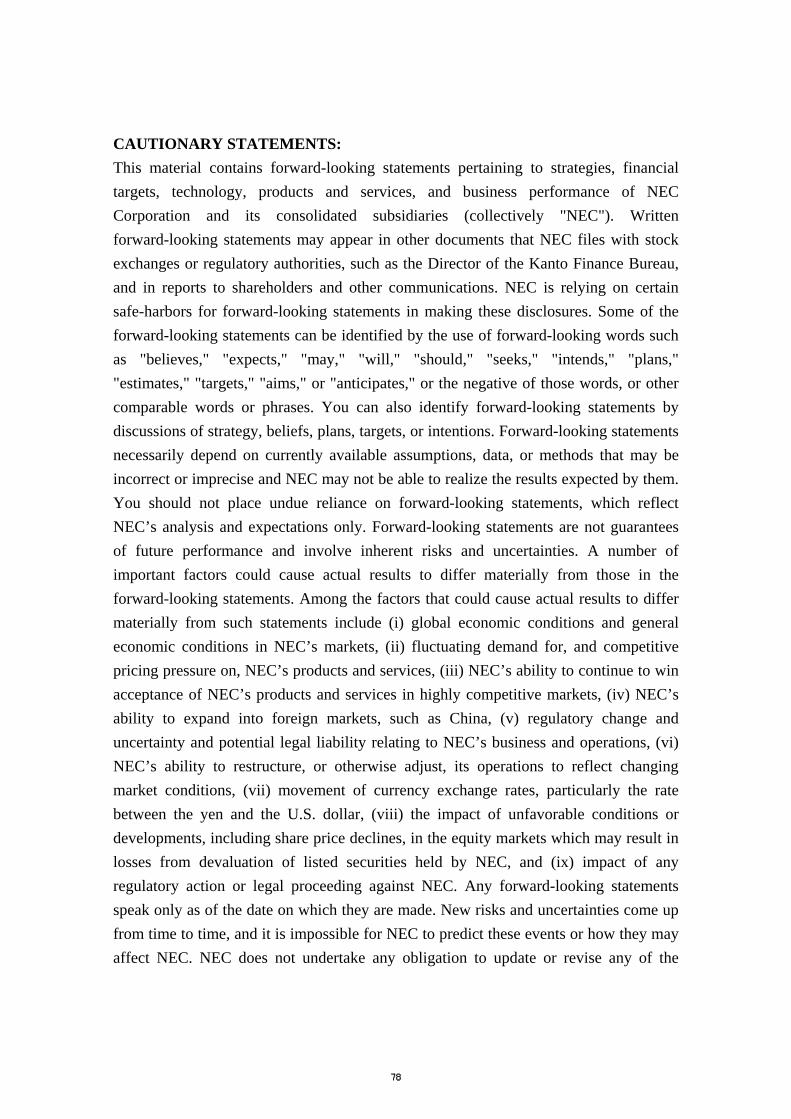
CAUTIONARY STATEMENTS: This material contains forward-looking statements pertaining to strategies, financial targets, technology, products and services, and business performance of NEC Corporation and its consolidated subsidiaries (collectively "NEC"). Written forward-looking statements may appear in other documents that NEC files with stock exchanges or regulatory authorities, such as the Director of the Kanto Finance Bureau, and in reports to shareholders and other communications. NEC is relying on certain safe-harbors for forward-looking statements in making these disclosures. Some of the forward-looking statements can be identified by the use of forward-looking words such as "believes," "expects," "may," "will," "should," "seeks," "intends," "plans," "estimates," "targets," "aims," or "anticipates," or the negative of those words, or other comparable words or phrases. You can also identify forward-looking statements by discussions of strategy, beliefs, plans, targets, or intentions. Forward-looking statements necessarily depend on currently available assumptions, data, or methods that may be incorrect or imprecise and NEC may not be able to realize the results expected by them. You should not place undue reliance on forward-looking statements, which reflect NEC’s analysis and expectations only. Forward-looking statements are not guarantees of future performance and involve inherent risks and uncertainties. A number of important factors could cause actual results to differ materially from those in the forward-looking statements. Among the factors that could cause actual results to differ materially from such statements include (i) global economic conditions and general economic conditions in NEC’s markets, (ii) fluctuating demand for, and competitive pricing pressure on, NEC’s products and services, (iii) NEC’s ability to continue to win acceptance of NEC’s products and services in highly competitive markets, (iv) NEC’s ability to expand into foreign markets, such as China, (v) regulatory change and uncertainty and potential legal liability relating to NEC’s business and operations, (vi) NEC’s ability to restructure, or otherwise adjust, its operations to reflect changing market conditions, (vii) movement of currency exchange rates, particularly the rate between the yen and the U.S. dollar, (viii) the impact of unfavorable conditions or developments, including share price declines, in the equity markets which may result in losses from devaluation of listed securities held by NEC, and (ix) impact of any regulatory action or legal proceeding against NEC. Any forward-looking statements speak only as of the date on which they are made. New risks and uncertainties come up from time to time, and it is impossible for NEC to predict these events or how they may affect NEC. NEC does not undertake any obligation to update or revise any of the
7878

forward-looking statements, whether as a result of new information, future events, or otherwise. The management targets included in this material are not projections, and do not represent management’s current estimates of future performance. Rather, they represent targets that management will strive to achieve through the successful implementation of NEC’s business strategies. Finally, NEC cautions you that the statements made in this material are not an offer of securities for sale. Securities may not be offered or sold in any jurisdiction in which required registration is absent or an exemption from registration under the applicable securities laws is not granted.
***
7979