Embed Size (px)
Citation preview
18 / 02 / 2009
FULL-YEAR AND FOURTH QUARTER 2008 RESULTS
SUPPLEMENTARY DATA
218 / 02 / 2009FULL-YEAR AND FOURTH QUARTER RESULTS 2008
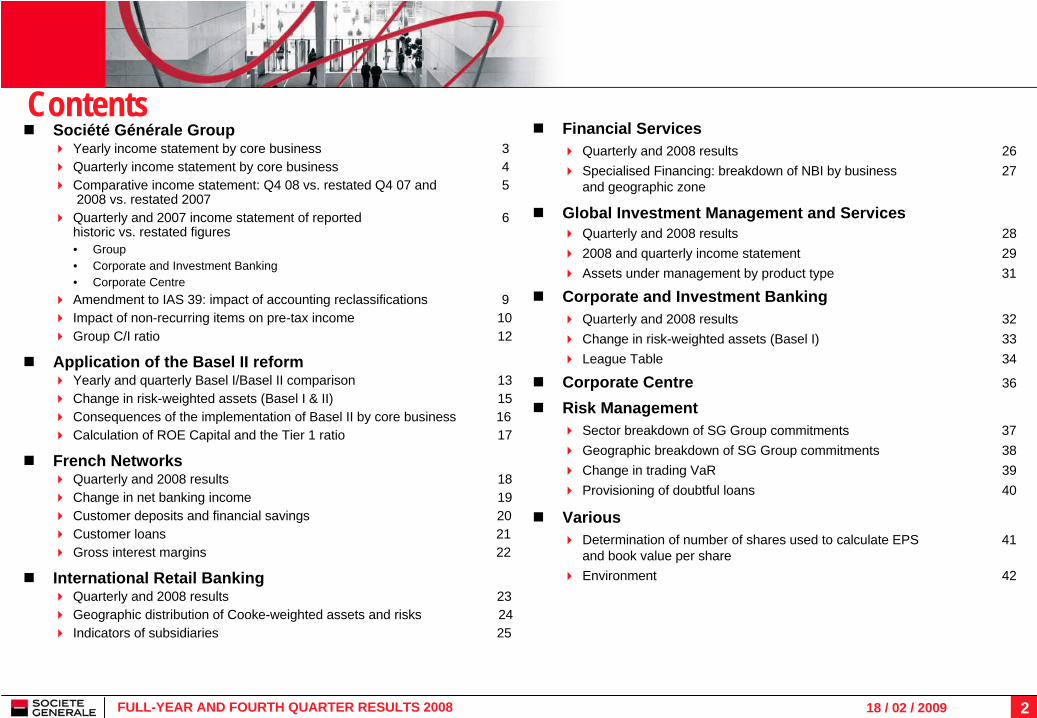
ContentsSociété Générale Group
Yearly income statement by core business 3Quarterly income statement by core business 4Comparative income statement: Q4 08 vs. restated Q4 07 and 5 2008 vs. restated 2007Quarterly and 2007 income statement of reported 6historic vs. restated figures• Group• Corporate and Investment Banking• Corporate CentreAmendment to IAS 39: impact of accounting reclassifications 9Impact of non-recurring items on pre-tax income 10Group C/I ratio 12
Application of the Basel II reformYearly and quarterly Basel I/Basel II comparison 13Change in risk-weighted assets (Basel I & II) 15Consequences of the implementation of Basel II by core business 16Calculation of ROE Capital and the Tier 1 ratio 17
French NetworksQuarterly and 2008 results 18Change in net banking income 19Customer deposits and financial savings 20Customer loans 21Gross interest margins 22
International Retail BankingQuarterly and 2008 results 23Geographic distribution of Cooke-weighted assets and risks 24Indicators of subsidiaries 25
Financial ServicesQuarterly and 2008 results 26Specialised Financing: breakdown of NBI by business 27 and geographic zone
Global Investment Management and ServicesQuarterly and 2008 results 282008 and quarterly income statement 29Assets under management by product type 31
Corporate and Investment BankingQuarterly and 2008 results 32Change in risk-weighted assets (Basel I) 33League Table 34
Corporate Centre 36
Risk ManagementSector breakdown of SG Group commitments 37Geographic breakdown of SG Group commitments 38Change in trading VaR 39Provisioning of doubtful loans 40
VariousDetermination of number of shares used to calculate EPS 41 and book value per shareEnvironment 42
318 / 02 / 2009FULL-YEAR AND FOURTH QUARTER RESULTS 2008
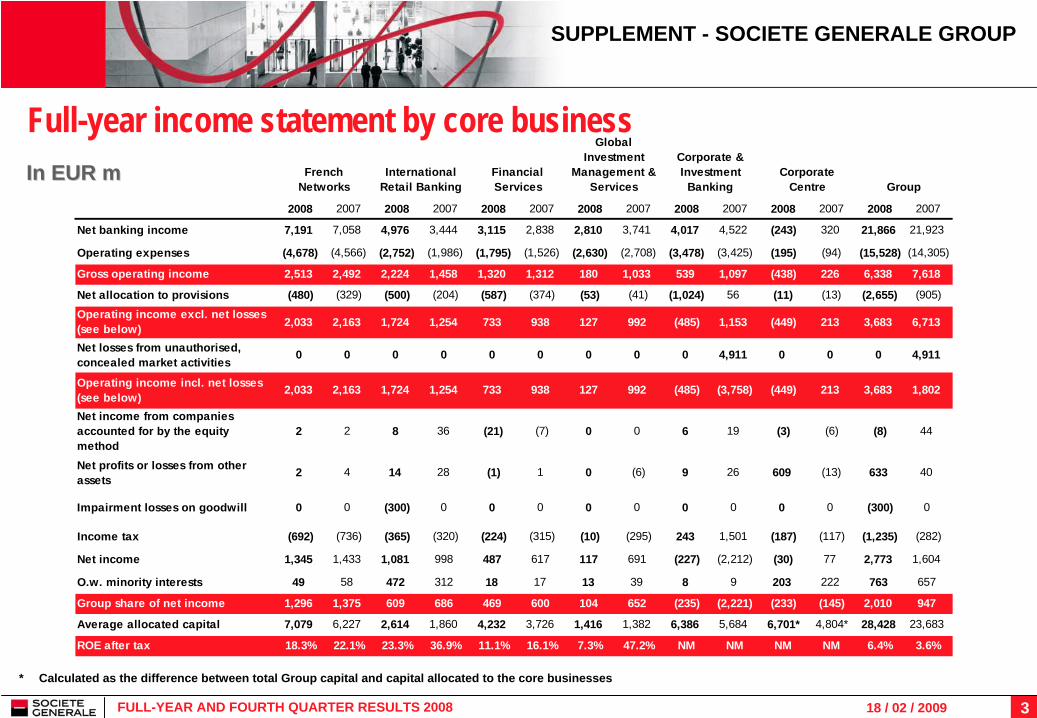
Full-year income statement by core business
* Calculated as the difference between total Group capital and capital allocated to the core businesses
In EUR mIn EUR m
SUPPLEMENT - SOCIETE GENERALE GROUP
2008 2007 2008 2007 2008 2007 2008 2007 2008 2007 2008 2007 2008 2007
Net banking income 7,191 7,058 4,976 3,444 3,115 2,838 2,810 3,741 4,017 4,522 (243) 320 21,866 21,923
Operating expenses (4,678) (4,566) (2,752) (1,986) (1,795) (1,526) (2,630) (2,708) (3,478) (3,425) (195) (94) (15,528) (14,305)
Gross operating income 2,513 2,492 2,224 1,458 1,320 1,312 180 1,033 539 1,097 (438) 226 6,338 7,618
Net allocation to provisions (480) (329) (500) (204) (587) (374) (53) (41) (1,024) 56 (11) (13) (2,655) (905)
Operating income excl. net losses (see below) 2,033 2,163 1,724 1,254 733 938 127 992 (485) 1,153 (449) 213 3,683 6,713
Net losses from unauthorised, concealed market activities 0 0 0 0 0 0 0 0 0 4,911 0 0 0 4,911
Operating income incl. net losses (see below)
2,033 2,163 1,724 1,254 733 938 127 992 (485) (3,758) (449) 213 3,683 1,802
Net income from companies accounted for by the equity method
2 2 8 36 (21) (7) 0 0 6 19 (3) (6) (8) 44
Net profits or losses from other assets 2 4 14 28 (1) 1 0 (6) 9 26 609 (13) 633 40
Impairment losses on goodwill 0 0 (300) 0 0 0 0 0 0 0 0 0 (300) 0
Income tax (692) (736) (365) (320) (224) (315) (10) (295) 243 1,501 (187) (117) (1,235) (282)
Net income 1,345 1,433 1,081 998 487 617 117 691 (227) (2,212) (30) 77 2,773 1,604
O.w. minority interests 49 58 472 312 18 17 13 39 8 9 203 222 763 657
Group share of net income 1,296 1,375 609 686 469 600 104 652 (235) (2,221) (233) (145) 2,010 947
Average allocated capital 7,079 6,227 2,614 1,860 4,232 3,726 1,416 1,382 6,386 5,684 6,701* 4,804* 28,428 23,683
ROE after tax 18.3% 22.1% 23.3% 36.9% 11.1% 16.1% 7.3% 47.2% NM NM NM NM 6.4% 3.6%
Corporate Centre Group
Corporate & Investment
BankingFrench
NetworksInternational
Retail BankingFinancial Services
Global Investment
Management & Services
418 / 02 / 2009FULL-YEAR AND FOURTH QUARTER RESULTS 2008
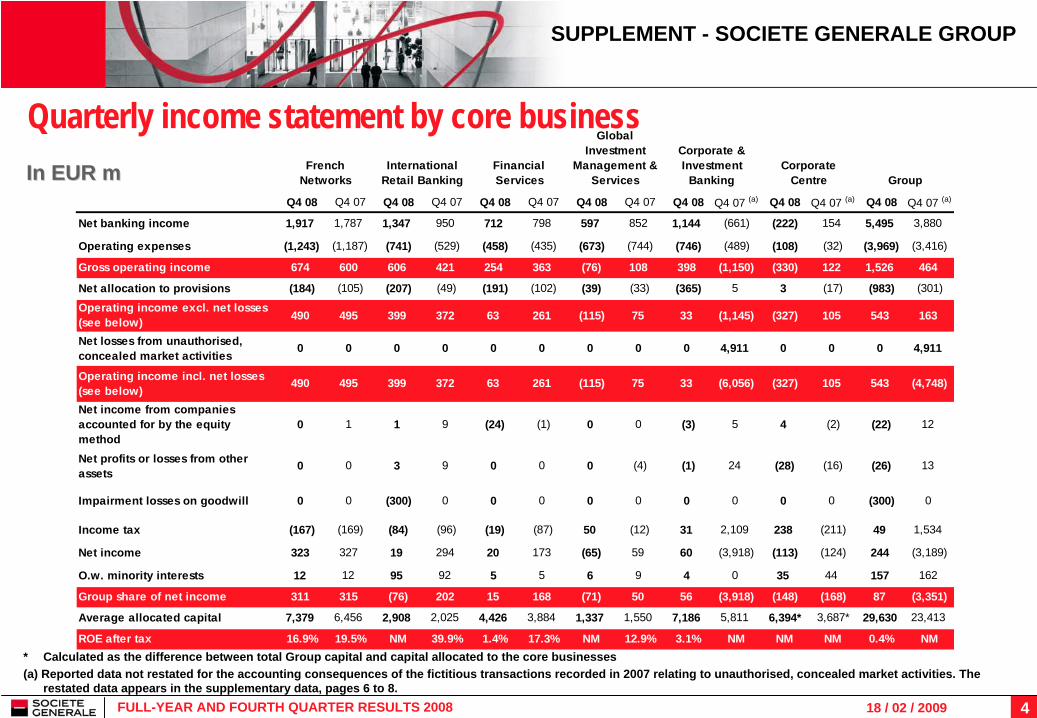
Quarterly income statement by core business
* Calculated as the difference between total Group capital and capital allocated to the core businesses(a) Reported data not restated for the accounting consequences of the fictitious transactions recorded in 2007 relating to unauthorised, concealed market activities. The
restated data appears in the supplementary data, pages 6 to 8.
In EUR mIn EUR m
SUPPLEMENT - SOCIETE GENERALE GROUP
Q4 08 Q4 07 Q4 08 Q4 07 Q4 08 Q4 07 Q4 08 Q4 07 Q4 08 Q4 07 (a) Q4 08 Q4 07 (a) Q4 08 Q4 07 (a)
Net banking income 1,917 1,787 1,347 950 712 798 597 852 1,144 (661) (222) 154 5,495 3,880
Operating expenses (1,243) (1,187) (741) (529) (458) (435) (673) (744) (746) (489) (108) (32) (3,969) (3,416)
Gross operating income 674 600 606 421 254 363 (76) 108 398 (1,150) (330) 122 1,526 464
Net allocation to provisions (184) (105) (207) (49) (191) (102) (39) (33) (365) 5 3 (17) (983) (301)
Operating income excl. net losses (see below) 490 495 399 372 63 261 (115) 75 33 (1,145) (327) 105 543 163
Net losses from unauthorised, concealed market activities 0 0 0 0 0 0 0 0 0 4,911 0 0 0 4,911
Operating income incl. net losses (see below) 490 495 399 372 63 261 (115) 75 33 (6,056) (327) 105 543 (4,748)
Net income from companies accounted for by the equity method
0 1 1 9 (24) (1) 0 0 (3) 5 4 (2) (22) 12
Net profits or losses from other assets 0 0 3 9 0 0 0 (4) (1) 24 (28) (16) (26) 13
Impairment losses on goodwill 0 0 (300) 0 0 0 0 0 0 0 0 0 (300) 0
Income tax (167) (169) (84) (96) (19) (87) 50 (12) 31 2,109 238 (211) 49 1,534
Net income 323 327 19 294 20 173 (65) 59 60 (3,918) (113) (124) 244 (3,189)
O.w. minority interests 12 12 95 92 5 5 6 9 4 0 35 44 157 162
Group share of net income 311 315 (76) 202 15 168 (71) 50 56 (3,918) (148) (168) 87 (3,351)
Average allocated capital 7,379 6,456 2,908 2,025 4,426 3,884 1,337 1,550 7,186 5,811 6,394* 3,687* 29,630 23,413
ROE after tax 16.9% 19.5% NM 39.9% 1.4% 17.3% NM 12.9% 3.1% NM NM NM 0.4% NM
Corporate & Investment
BankingCorporate
Centre GroupFrench
NetworksInternational
Retail BankingFinancial Services
Global Investment
Management & Services
518 / 02 / 2009FULL-YEAR AND FOURTH QUARTER RESULTS 2008
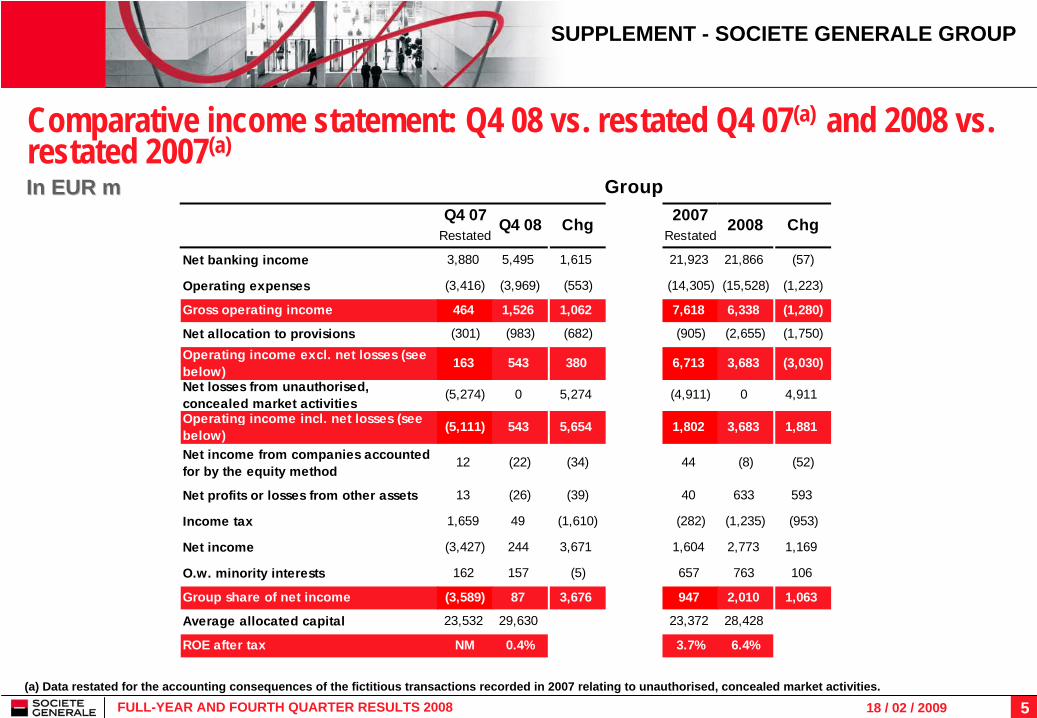
Comparative income statement: Q4 08 vs. restated Q4 07(a) and 2008 vs. restated 2007(a)
SUPPLEMENT - SOCIETE GENERALE GROUP
(a) Data restated for the accounting consequences of the fictitious transactions recorded in 2007 relating to unauthorised, concealed market activities.
In EUR mIn EUR mQ4 07 2007
Restated Restated
Net banking income 3,880 5,495 1,615 21,923 21,866 (57)
Operating expenses (3,416) (3,969) (553) (14,305) (15,528) (1,223)
Gross operating income 464 1,526 1,062 7,618 6,338 (1,280)
Net allocation to provisions (301) (983) (682) (905) (2,655) (1,750)Operating income excl. net losses (see below) 163 543 380 6,713 3,683 (3,030)
Net losses from unauthorised, concealed market activities
(5,274) 0 5,274 (4,911) 0 4,911
Operating income incl. net losses (see below) (5,111) 543 5,654 1,802 3,683 1,881
Net income from companies accounted for by the equity method
12 (22) (34) 44 (8) (52)
Net profits or losses from other assets 13 (26) (39) 40 633 593
Income tax 1,659 49 (1,610) (282) (1,235) (953)
Net income (3,427) 244 3,671 1,604 2,773 1,169
O.w. minority interests 162 157 (5) 657 763 106
Group share of net income (3,589) 87 3,676 947 2,010 1,063
Average allocated capital 23,532 29,630 23,372 28,428
ROE after tax NM 0.4% 3.7% 6.4%
Q4 08 Chg 2008 Chg
Group

618 / 02 / 2009FULL-YEAR AND FOURTH QUARTER RESULTS 2008
SUPPLEMENT - SOCIETE GENERALE GROUP
Quarterly and 2007 income statement of reported historic vs. restated figures(a) : GroupIn EURIn EUR m
(a) Data restated for the accounting consequences of the fictitious transactions recorded in 2007 relating to unauthorised, concealed market activities.
Reported Restated Reported Restated Reported Restated Reported Restated Reported Restated
Net banking income 6,046 6,046 6,622 6,622 5,375 5,375 3,880 3,880 21,923 21,923
Operating expenses (3,698) (3,698) (3,817) (3,817) (3,374) (3,374) (3,416) (3,416) (14,305) (14,305)
Gross operating income 2,348 2,348 2,805 2,805 2,001 2,001 464 464 7,618 7,618
Net allocation to provisions (192) (192) (186) (186) (226) (226) (301) (301) (905) (905)Operating income excl. net losses (see below)
2,156 2,156 2,619 2,619 1,775 1,775 163 163 6,713 6,713
Net losses from unauthorised, concealed market activities
0 (97) 0 (2,064) 0 2,524 (4,911) (5,274) (4,911) (4,911)
Operating income incl. net losses (see below)
2,156 2,059 2,619 555 1,775 4,299 (4,748) (5,111) 1,802 1,802
Net income from companies accounted for by the equity method
11 11 9 9 12 12 12 12 44 44
Net profits or losses from other assets 24 24 6 6 (3) (3) 13 13 40 40
Income tax (613) (580) (719) (8) (484) (1,353) 1,534 1,659 (282) (282)
Net income 1,578 1,514 1,915 562 1,300 2,955 (3,189) (3,427) 1,604 1,604
O.w. minority interests 147 147 171 171 177 177 162 162 657 657
Group share of net income 1,431 1,367 1,744 391 1,123 2,778 (3,351) (3,589) 947 947
Average allocated capital 23,268 23,236 23,727 22,986 24,324 23,734 23,413 23,532 23,683 23,372
ROE after tax 24.4% 23.3% 29.0% 6.4% 18.0% 46.4% NM NM 3.6% 3.7%
Q4 07Group
Q2 07 Q3 07Q1 07 2007
718 / 02 / 2009FULL-YEAR AND FOURTH QUARTER RESULTS 2008
SUPPLEMENT - SOCIETE GENERALE GROUP
In EUR mIn EUR m
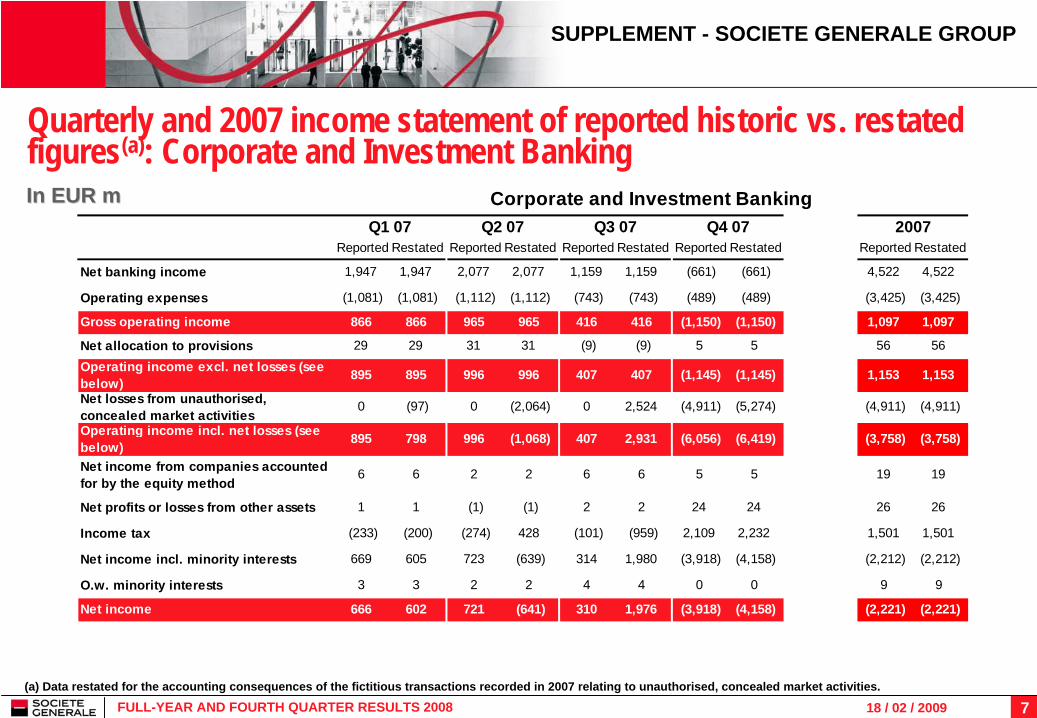
Quarterly and 2007 income statement of reported historic vs. restated figures(a): Corporate and Investment Banking
(a) Data restated for the accounting consequences of the fictitious transactions recorded in 2007 relating to unauthorised, concealed market activities.
Reported Restated Reported Restated Reported Restated Reported Restated Reported Restated
Net banking income 1,947 1,947 2,077 2,077 1,159 1,159 (661) (661) 4,522 4,522
Operating expenses (1,081) (1,081) (1,112) (1,112) (743) (743) (489) (489) (3,425) (3,425)
Gross operating income 866 866 965 965 416 416 (1,150) (1,150) 1,097 1,097
Net allocation to provisions 29 29 31 31 (9) (9) 5 5 56 56 Operating income excl. net losses (see below) 895 895 996 996 407 407 (1,145) (1,145) 1,153 1,153
Net losses from unauthorised, concealed market activities
0 (97) 0 (2,064) 0 2,524 (4,911) (5,274) (4,911) (4,911)
Operating income incl. net losses (see below) 895 798 996 (1,068) 407 2,931 (6,056) (6,419) (3,758) (3,758)
Net income from companies accounted for by the equity method
6 6 2 2 6 6 5 5 19 19
Net profits or losses from other assets 1 1 (1) (1) 2 2 24 24 26 26
Income tax (233) (200) (274) 428 (101) (959) 2,109 2,232 1,501 1,501
Net income incl. minority interests 669 605 723 (639) 314 1,980 (3,918) (4,158) (2,212) (2,212)
O.w. minority interests 3 3 2 2 4 4 0 0 9 9
Net income 666 602 721 (641) 310 1,976 (3,918) (4,158) (2,221) (2,221)
Corporate and Investment BankingQ3 07 Q4 07Q1 07 Q2 07 2007
818 / 02 / 2009FULL-YEAR AND FOURTH QUARTER RESULTS 2008
SUPPLEMENT - SOCIETE GENERALE GROUP
In EUR mIn EUR m
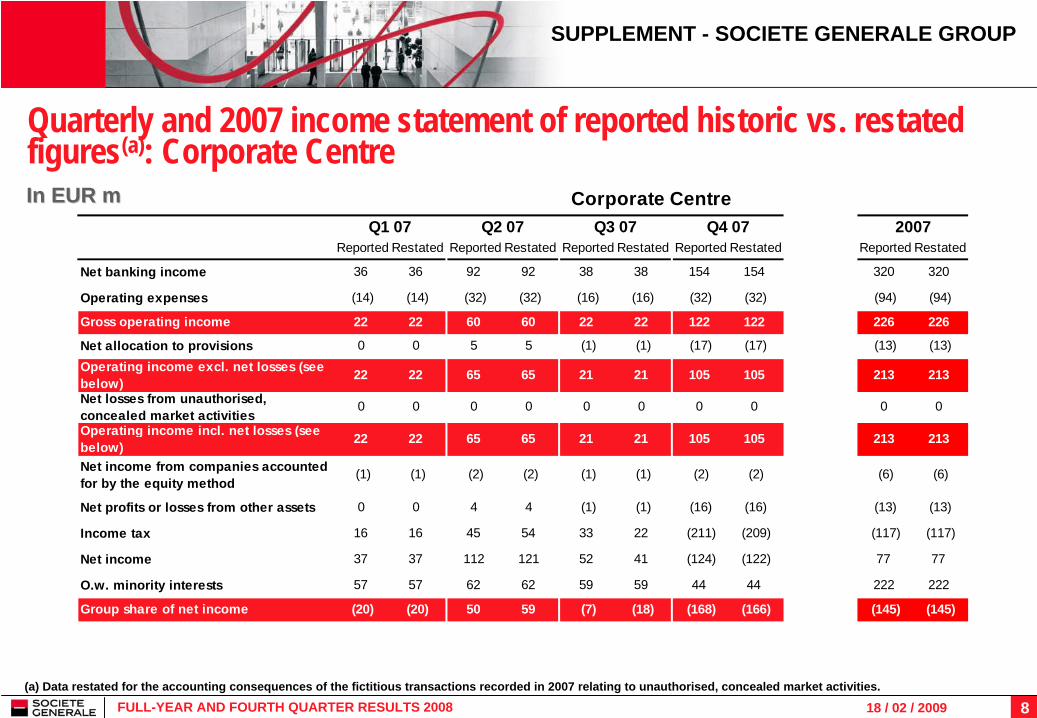
Quarterly and 2007 income statement of reported historic vs. restated figures(a): Corporate Centre
(a) Data restated for the accounting consequences of the fictitious transactions recorded in 2007 relating to unauthorised, concealed market activities.
Reported Restated Reported Restated Reported Restated Reported Restated Reported Restated
Net banking income 36 36 92 92 38 38 154 154 320 320
Operating expenses (14) (14) (32) (32) (16) (16) (32) (32) (94) (94)
Gross operating income 22 22 60 60 22 22 122 122 226 226
Net allocation to provisions 0 0 5 5 (1) (1) (17) (17) (13) (13)Operating income excl. net losses (see below) 22 22 65 65 21 21 105 105 213 213
Net losses from unauthorised, concealed market activities
0 0 0 0 0 0 0 0 0 0
Operating income incl. net losses (see below) 22 22 65 65 21 21 105 105 213 213
Net income from companies accounted for by the equity method
(1) (1) (2) (2) (1) (1) (2) (2) (6) (6)
Net profits or losses from other assets 0 0 4 4 (1) (1) (16) (16) (13) (13)
Income tax 16 16 45 54 33 22 (211) (209) (117) (117)
Net income 37 37 112 121 52 41 (124) (122) 77 77
O.w. minority interests 57 57 62 62 59 59 44 44 222 222
Group share of net income (20) (20) 50 59 (7) (18) (168) (166) (145) (145)
Corporate CentreQ1 07 Q2 07 2007Q3 07 Q4 07

918 / 02 / 2009FULL-YEAR AND FOURTH QUARTER RESULTS 2008
Amendment to IAS 39: reclassifications of non-derivative financial assets
Use of option provided by the amendment to the IAS 39 standards of October 2008 allowing reclassification of
Financial assets at fair value through profit or lossAvailable-for-sale financial assets
Transfer date: October 1st 2008
SOCIETE GENERALE GROUP
in EUR bnTransferred from Transferred to AmountTrading portfolio Loans & receivables 23.3Trading portfolio Available-for-Sale 1.0
Available-for-Sale Loans & receivables 4.3
28.6
in EUR bn OCI -0.5 Net Banking Income -1.5
Description of transfers
Transfer total
Change in fair value between transfer date and period end date
(date recorded if the instruments had not been transferred)
1018 / 02 / 2009FULL-YEAR AND FOURTH QUARTER RESULTS 2008
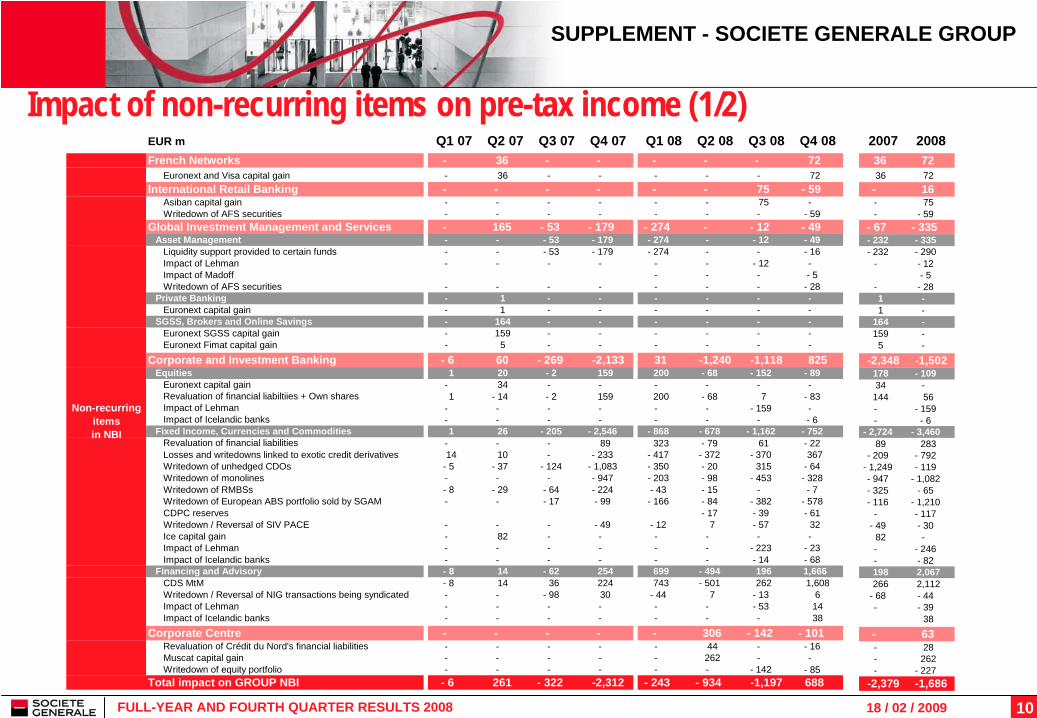
Impact of non-recurring items on pre-tax income (1/2)
SUPPLEMENT - SOCIETE GENERALE GROUP
EUR m Q1 07 Q2 07 Q3 07 Q4 07 Q1 08 Q2 08 Q3 08 Q4 08French Networks - 36 - - - - - 72
Euronext and Visa capital gain - 36 - - - - - 72 International Retail Banking - - - - - - 75 - 59
Asiban capital gain - - - - - - 75 - Writedown of AFS securities - - - - - - - - 59
Global Investment Management and Services - 165 - 53 - 179 - 274 - - 12 - 49 Asset Management - - - 53 - 179 - 274 - - 12 - 49
Liquidity support provided to certain funds - - - 53 - 179 - 274 - - - 16 Impact of Lehman - - - - - - - 12 - Impact of Madoff - - - - 5 Writedown of AFS securities - - - - - - - - 28
Private Banking - 1 - - - - - -Euronext capital gain - 1 - - - - - -
SGSS, Brokers and Online Savings - 164 - - - - - -Euronext SGSS capital gain - 159 - - - - - - Euronext Fimat capital gain - 5 - - - - - -
Corporate and Investment Banking - 6 60 - 269 -2,133 31 -1,240 -1,118 825Equities 1 20 - 2 159 200 - 68 - 152 - 89
Euronext capital gain - 34 - - - - - - Revaluation of financial liabiltiies + Own shares 1 - 14 - 2 159 200 - 68 7 - 83 Impact of Lehman - - - - - - - 159 -Impact of Icelandic banks - - - - - - - - 6
Fixed Income, Currencies and Commodities 1 26 - 205 - 2,546 - 868 - 678 - 1,162 - 752 Revaluation of financial liabilities - - - 89 323 - 79 61 - 22 Losses and writedowns linked to exotic credit derivatives 14 10 - - 233 - 417 - 372 - 370 367 Writedown of unhedged CDOs - 5 - 37 - 124 - 1,083 - 350 - 20 315 - 64 Writedown of monolines - - - - 947 - 203 - 98 - 453 - 328 Writedown of RMBSs - 8 - 29 - 64 - 224 - 43 - 15 - - 7 Writedown of European ABS portfolio sold by SGAM - - - 17 - 99 - 166 - 84 - 382 - 578 CDPC reserves - 17 - 39 - 61 Writedown / Reversal of SIV PACE - - - - 49 - 12 7 - 57 32 Ice capital gain - 82 - - - - - - Impact of Lehman - - - - - - - 223 - 23 Impact of Icelandic banks - - - - - - - 14 - 68
Financing and Advisory - 8 14 - 62 254 699 - 494 196 1,666 CDS MtM - 8 14 36 224 743 - 501 262 1,608Writedown / Reversal of NIG transactions being syndicated - - - 98 30 - 44 7 - 13 6Impact of Lehman - - - - - - - 53 14Impact of Icelandic banks - - - - - - - 38
Corporate Centre - - - - - 306 - 142 - 101 Revaluation of Crédit du Nord's financial liabilities - - - - - 44 - - 16 Muscat capital gain - - - - - 262 - - Writedown of equity portfolio - - - - - - - 142 - 85
Total impact on GROUP NBI - 6 261 - 322 -2,312 - 243 - 934 -1,197 688
Non-recurring items in NBI
2007 2008 36 72 36 72
- 16 - 75 - - 59
- 67 - 335 - 232 - 335 - 232 - 290 - - 12
- 5 - - 28
1 - 1 -
164 - 159 -
5 -
-2,348 -1,502178 - 109 34 -
144 56 - - 159 - - 6
- 2,724 - 3,460 89 283
- 209 - 792 - 1,249 - 119 - 947 - 1,082 - 325 - 65 - 116 - 1,210 - - 117 - 49 - 30 82 - - - 246 - - 82 198 2,067
266 2,112 - 68 - 44 - - 39
38 - 63 - 28 - 262 - - 227
-2,379 -1,686
1118 / 02 / 2009FULL-YEAR AND FOURTH QUARTER RESULTS 2008
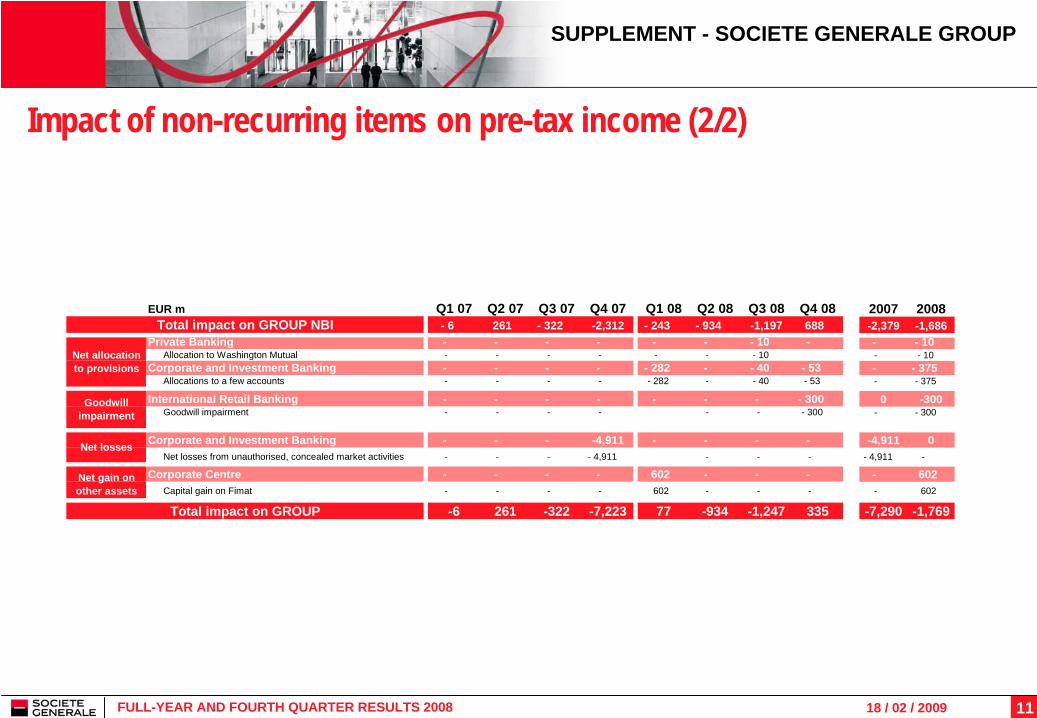
Impact of non-recurring items on pre-tax income (2/2)
SUPPLEMENT - SOCIETE GENERALE GROUP
2007 2008-2,379 -1,686- - 10 - - 10 - - 375 - - 375
0 -300 - - 300
-4,911 0- 4,911 -
- 602 - 602
-7,290 -1,769
EUR m Q1 07 Q2 07 Q3 07 Q4 07 Q1 08 Q2 08 Q3 08 Q4 08- 6 261 - 322 -2,312 - 243 - 934 -1,197 688
Private Banking - - - - - - - 10 -Allocation to Washington Mutual - - - - - - - 10
Corporate and Investment Banking - - - - - 282 - - 40 - 53 Allocations to a few accounts - - - - - 282 - - 40 - 53
International Retail Banking - - - - - - - - 300 Goodwill impairment - - - - - - - 300
Corporate and Investment Banking - - - -4,911 - - - - Net losses from unauthorised, concealed market activities - - - - 4,911 - - -
Corporate Centre - - - - 602 - - - Capital gain on Fimat - - - - 602 - - -
-6 261 -322 -7,223 77 -934 -1,247 335
Net gain on other assets
Net losses
Net allocation to provisions
Total impact on GROUP NBI
Goodwill impairment
Total impact on GROUP
1218 / 02 / 2009FULL-YEAR AND FOURTH QUARTER RESULTS 2008
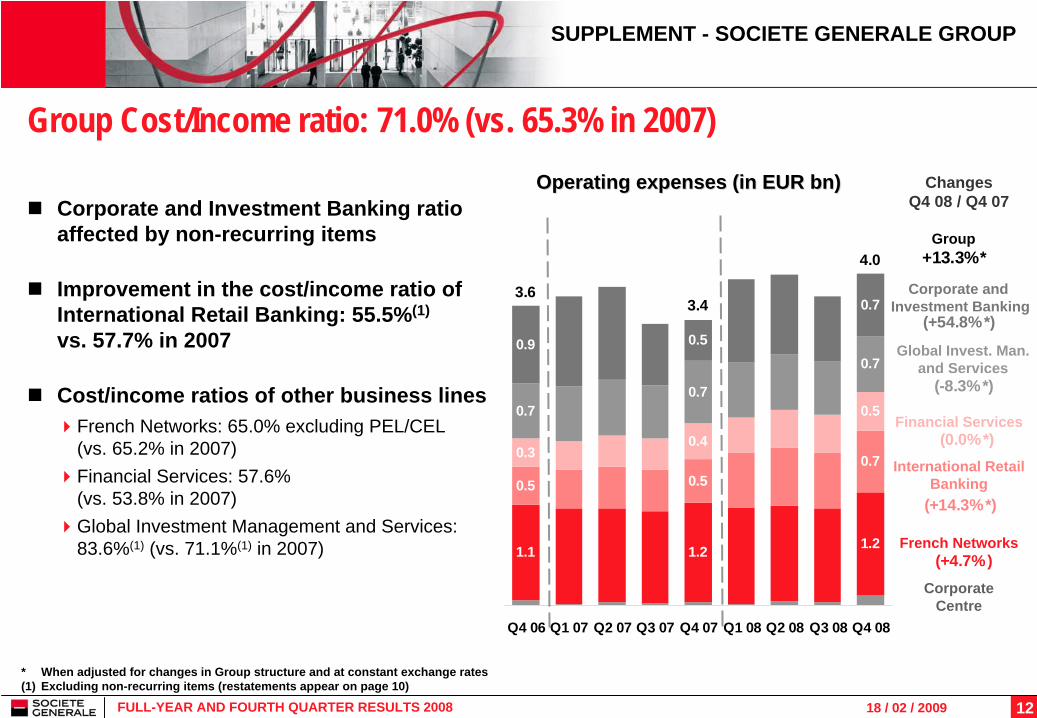
Group Cost/Income ratio: 71.0% (vs. 65.3% in 2007)
Corporate and Investment Banking ratio affected by non-recurring items
Improvement in the cost/income ratio of International Retail Banking: 55.5%(1)
vs. 57.7% in 2007
Cost/income ratios of other business lines French Networks: 65.0% excluding PEL/CEL(vs. 65.2% in 2007)Financial Services: 57.6%(vs. 53.8% in 2007)Global Investment Management and Services: 83.6%(1) (vs. 71.1%(1) in 2007)
Operating expenses (inOperating expenses (in EUR EUR bnbn))
French Networks
Corporate Centre
ChangesQ4 08 / Q4 07
International Retail Banking
Global Invest. Man. and Services
* When adjusted for changes in Group structure and at constant exchange rates (1) Excluding non-recurring items (restatements appear on page 10)
SUPPLEMENT - SOCIETE GENERALE GROUP
1.21.21.1
0.50.7
0.5
0.4
0.5
0.3
0.70.7
0.70.50.9
0.73.6
3.4
4.0
Q4 06 Q1 07 Q2 07 Q3 07 Q4 07 Q1 08 Q2 08 Q3 08 Q4 08
(+4.7%)
Corporate and Investment Banking
+13.3%*
(+54.8%*)
(-8.3%*)
(0.0%*)
(+14.3%*)
Group
Financial Services

1318 / 02 / 2009FULL-YEAR AND FOURTH QUARTER RESULTS 2008
Basel II Basel I Basel II Basel I Basel II Basel I Basel II Basel I Basel II Basel I Basel II Basel I Basel II Basel I2008 2008 2008 2008 2008 2008 2008 2008 2008 2008 2008 2008 2008 2008
Net banking income 7,105 7,191 4,990 4,976 3,100 3,115 2,818 2,810 4,064 4,017 (211) (243) 21,866 21,866
Operating expenses (4,678) (4,678) (2,752) (2,752) (1,795) (1,795) (2,630) (2,630) (3,478) (3,478) (195) (195) (15,528) (15,528)
Gross operating income 2,427 2,513 2,238 2,224 1,305 1,320 188 180 586 539 (406) (438) 6,338 6,338
Net allocation to provisions (480) (480) (500) (500) (587) (587) (53) (53) (1,024) (1,024) (11) (11) (2,655) (2,655)
Operating income 1,947 2,033 1,738 1,724 718 733 135 127 (438) (485) (417) (449) 3,683 3,683
Net income from companies accounted for by the equity method 2 2 8 8 (21) (21) 0 0 6 6 (3) (3) (8) (8)
Net income from other assets 2 2 14 14 (1) (1) 0 0 9 9 609 609 633 633
Impairment losses on goodwill 0 0 (300) (300) 0 0 0 0 0 0 0 0 (300) (300)
Income tax (663) (692) (368) (365) (219) (224) (12) (10) 227 243 (200) (187) (1,235) (1,235)
Net income before minority interests
1,288 1,345 1,092 1,081 477 487 123 117 (196) (227) (11) (30) 2,773 2,773
Minority interests 48 49 476 472 18 18 13 13 11 8 197 203 763 763
Net income 1,240 1,296 616 609 459 469 110 104 (207) (235) (208) (233) 2,010 2,010
Average allocated capital 5,105 7,079 2,855 2,614 3,881 4,232 1,566 1,416 7,477 6,386 7,544* 6,701* 28,428 28,428
ROE after tax 24.3% 18.3% 21.6% 23.3% 11.8% 11.1% 7.0% 7.3% NM NM NM NM 6.4% 6.4%
FrenchNetworks
Corporate Centre Group
InternationalRetail Banking
Financial Services
Global Investment
Management & Services
Corporate & Investment
Banking
Yearly Basel I / Basel II comparison
* Calculated as the difference between total Group capital and capital allocated to the core businesses
In EURIn EUR m
SUPPLEMENT APPLICATION OF THE BASEL II REFORM
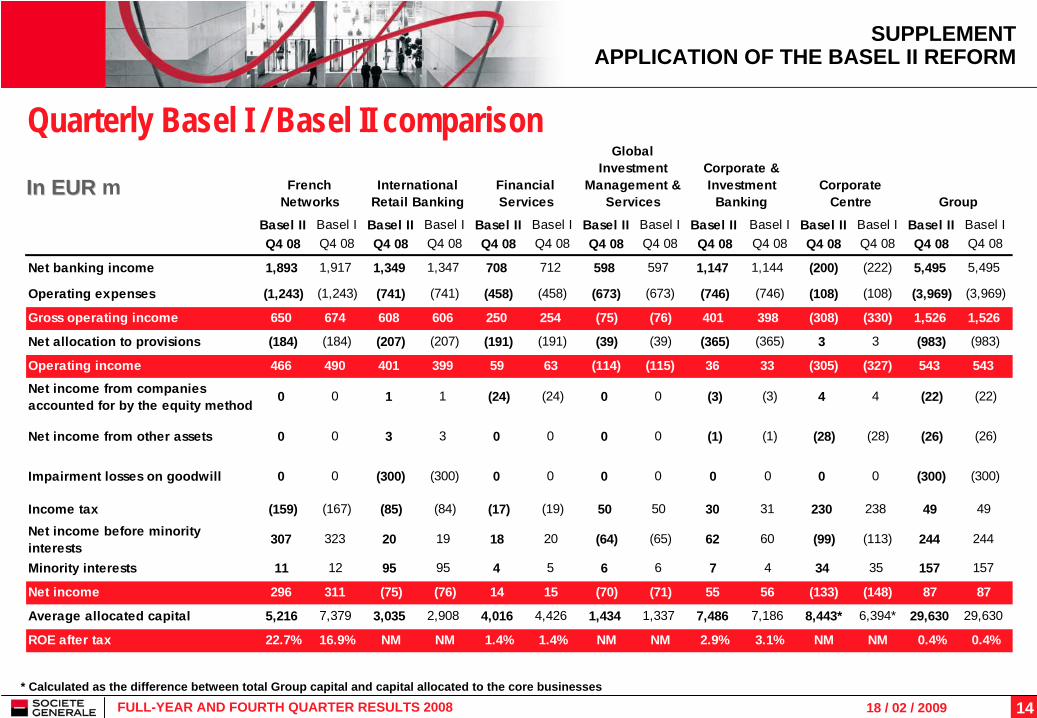
1418 / 02 / 2009FULL-YEAR AND FOURTH QUARTER RESULTS 2008
Basel II Basel I Basel II Basel I Basel II Basel I Basel II Basel I Basel II Basel I Basel II Basel I Basel II Basel IQ4 08 Q4 08 Q4 08 Q4 08 Q4 08 Q4 08 Q4 08 Q4 08 Q4 08 Q4 08 Q4 08 Q4 08 Q4 08 Q4 08
Net banking income 1,893 1,917 1,349 1,347 708 712 598 597 1,147 1,144 (200) (222) 5,495 5,495
Operating expenses (1,243) (1,243) (741) (741) (458) (458) (673) (673) (746) (746) (108) (108) (3,969) (3,969)
Gross operating income 650 674 608 606 250 254 (75) (76) 401 398 (308) (330) 1,526 1,526
Net allocation to provisions (184) (184) (207) (207) (191) (191) (39) (39) (365) (365) 3 3 (983) (983)
Operating income 466 490 401 399 59 63 (114) (115) 36 33 (305) (327) 543 543
Net income from companies accounted for by the equity method 0 0 1 1 (24) (24) 0 0 (3) (3) 4 4 (22) (22)
Net income from other assets 0 0 3 3 0 0 0 0 (1) (1) (28) (28) (26) (26)
Impairment losses on goodwill 0 0 (300) (300) 0 0 0 0 0 0 0 0 (300) (300)
Income tax (159) (167) (85) (84) (17) (19) 50 50 30 31 230 238 49 49
Net income before minority interests
307 323 20 19 18 20 (64) (65) 62 60 (99) (113) 244 244
Minority interests 11 12 95 95 4 5 6 6 7 4 34 35 157 157
Net income 296 311 (75) (76) 14 15 (70) (71) 55 56 (133) (148) 87 87
Average allocated capital 5,216 7,379 3,035 2,908 4,016 4,426 1,434 1,337 7,486 7,186 8,443* 6,394* 29,630 29,630
ROE after tax 22.7% 16.9% NM NM 1.4% 1.4% NM NM 2.9% 3.1% NM NM 0.4% 0.4%
Corporate & Investment
BankingCorporate
Centre GroupFrench
NetworksInternational
Retail BankingFinancial Services
Global Investment
Management & Services
InIn EUREUR m
Quarterly Basel I / Basel II comparison
* Calculated as the difference between total Group capital and capital allocated to the core businesses
SUPPLEMENT APPLICATION OF THE BASEL II REFORM

1518 / 02 / 2009FULL-YEAR AND FOURTH QUARTER RESULTS 2008
Average credit risk equivalent in EUR Average credit risk equivalent in EUR bnbn
Change in risk-weighted assets (Basel I & II)
Financial Services
French Networks
International Retail Banking
SUPPLEMENT APPLICATION OF THE BASEL II REFORM
Corporate and Investment BankingGlobal Investment and Management Services
100.2 102.9 106.1 109.3 114.4 120.9 125.2 126.5
73.6 77.6 76.9
36.2 38.6 41.1 44.0 53.161.7 67.2 69.2
55.069.0 70.2
36.6 37.6 38.6 39.842.7
44.1 46.0 47.3
35.037.0 38.0
19.5 20.6 22.4 25.2 26.726.1
25.1 24.4 23.4
28.324.1 23.3
82.0 85.9 93.1 95.0 92.3 91.193.3
96.3 111.9
111.5122.9 125.6
110.676.2
46.564.2
41.435.7
25.3
123.8
342.8340.3334.8311.3
389.2370.4356.2
337.1325.4320.7308.8293.0281.4
Q4 06 Q1 07 Q2 07 Q3 07 Q4 07 Q1 08(Basel I)
Q2 08(Basel I)
Q3 08(Basel I)
Q4 08(Basel I)
Q1 08(Basel II)
Q2 08(Basel II)
Q3 08(Basel II)
Q4 08(Basel II)
1618 / 02 / 2009FULL-YEAR AND FOURTH QUARTER RESULTS 2008
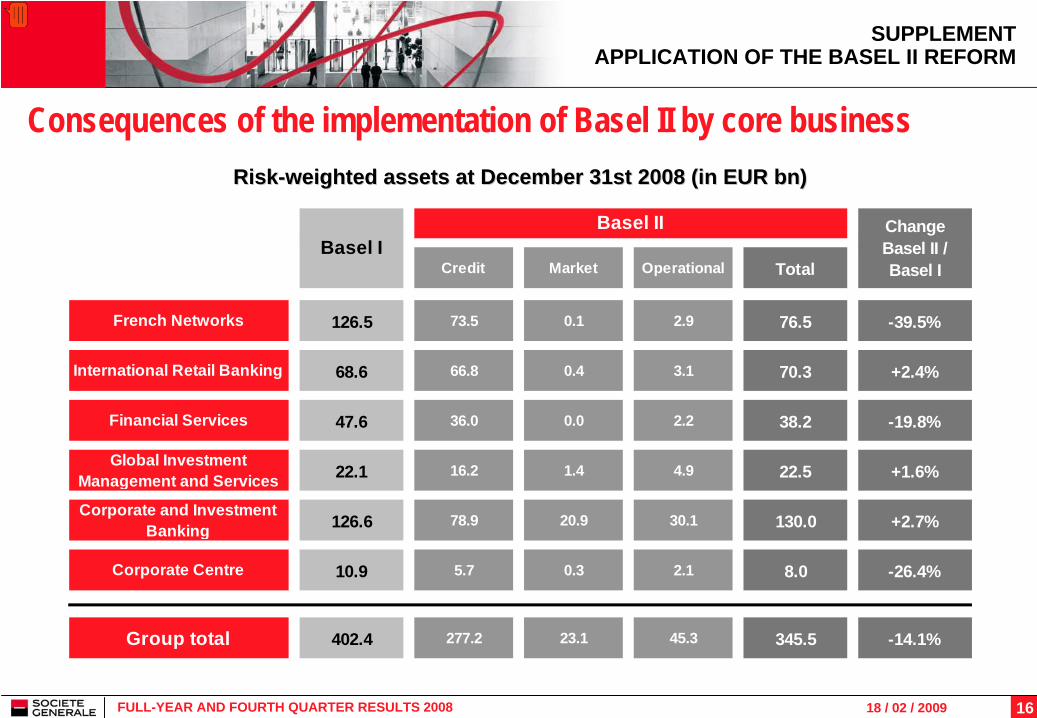
Consequences of the implementation of Basel II by core businessRiskRisk--weighted assets at December 31st 2008 (in EUR weighted assets at December 31st 2008 (in EUR bnbn))
SUPPLEMENT APPLICATION OF THE BASEL II REFORM
Credit Market Operational Total
French Networks 126.5 73.5 0.1 2.9 76.5 -39.5%
International Retail Banking 68.6 66.8 0.4 3.1 70.3 +2.4%
Financial Services 47.6 36.0 0.0 2.2 38.2 -19.8%
Global Investment Management and Services 22.1 16.2 1.4 4.9 22.5 +1.6%
Corporate and Investment Banking 126.6 78.9 20.9 30.1 130.0 +2.7%
Corporate Centre 10.9 5.7 0.3 2.1 8.0 -26.4%
Group total 402.4 277.2 23.1 45.3 345.5 -14.1%
Basel IIBasel I
Change Basel II / Basel I

1718 / 02 / 2009FULL-YEAR AND FOURTH QUARTER RESULTS 2008
Gro
up B
ook
Cap
ital
(afte
r dis
tribu
tion)
OCI
Deeply sub. notes
Undated sub. Notes
RO
E ca
pita
l (*)
GoodwillFixed
Assets &
OthersMinorityinterests
Pref. Shares
Deeply sub. notes
Bas
el I
Tier
1 c
apita
l
Basel II deductions
Bas
el II
Tie
r 1
capi
tal
- 6.1- 0.8
35.4
- 8.4
+ 3.0
+ 1.5
+ 6.1
- 1.429.5
31.7
30.3
+ 1.0
Calculation of ROE Capital and Tier 1 ratioData at end-Dec. 2008 in EUR bn
Accounting adjustmentPrudential adjustmentAdditional prudential adjustment
(*) Data at the end of the period; ROE is calculated based on the average capital at the end of the period
SUPPLEMENT APPLICATION OF THE BASEL II REFORM

1818 / 02 / 2009FULL-YEAR AND FOURTH QUARTER RESULTS 2008
Results - French Networks
SUPPLEMENT - FRENCH NETWORKS
(b) Excluding PEL/CEL provision of EUR 6m vs. a EUR 53m reversal in 2007 and excl. Euronext capital gain (EUR 36m in Q2 07) and Visa capital gain (EUR 72m in Q4 08)
In EUR m 2007 2008 Q4 07 Q4 08Net banking income 7,058 7,191 +1.9% +2.2%(b) 1,787 1,917 +7.3% +3.6%(b)
Operating expenses (4,566) (4,678) +2.5% (1,187) (1,243) +4.7%
Gross operating income 2,492 2,513 +0.8% +1.8%(b) 600 674 +12.3% +1.3%(b)
Net allocation to provisions (329) (480) +45.9% (105) (184) +75.2%
Operating income 2,163 2,033 -6.0% -5.2%(b) 495 490 -1.0% -14.5%(b)
Net income 1,375 1,296 -5.7% -5.1%(b) 315 311 -1.3% -14.5%(b)
Risk-weighted assets (end of period) 111,038 126,500
C/I ratio 64.7% 65.1% 66.4% 64.8%
Basel II indicators 2008 Q4 08Net banking income 7,105 1,893
Gross operating income 2,427 650
Net income 1,240 296
Risk-weighted assets (end of period) 76,495
C/I ratio 65.8% 65.7%
Average allocated capital 5,105 5,216
Change 08/07 Change Q4/Q4
1918 / 02 / 2009FULL-YEAR AND FOURTH QUARTER RESULTS 2008
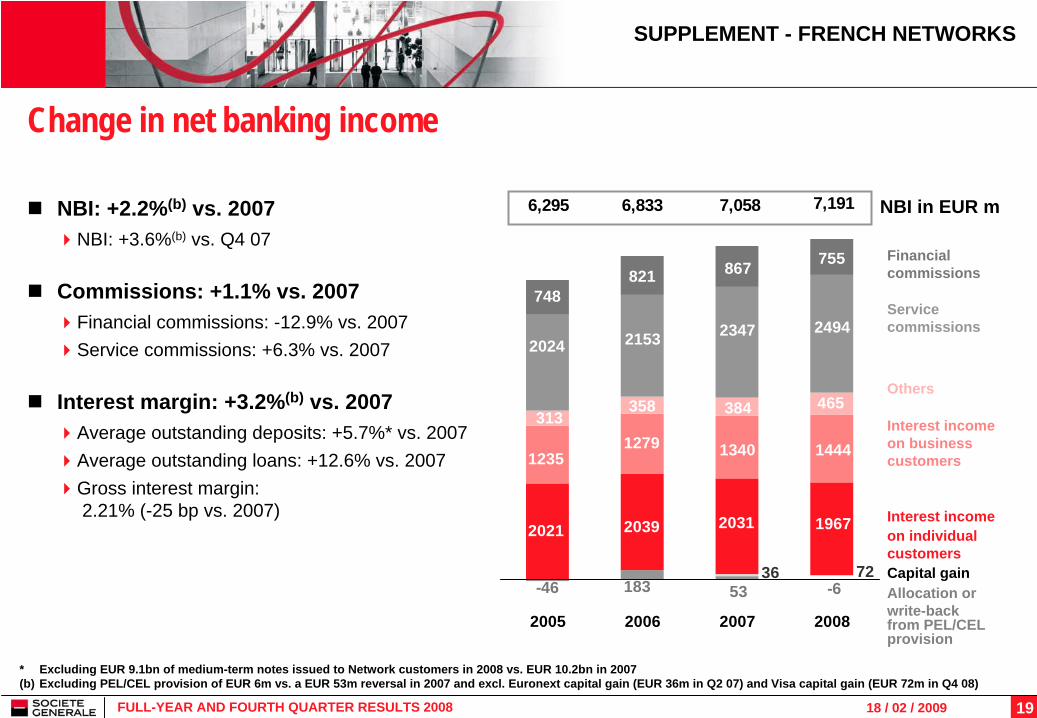
Change in net banking income
NBI: +2.2%(b) vs. 2007NBI: +3.6%(b) vs. Q4 07
Commissions: +1.1% vs. 2007Financial commissions: -12.9% vs. 2007Service commissions: +6.3% vs. 2007
Interest margin: +3.2%(b) vs. 2007Average outstanding deposits: +5.7%* vs. 2007Average outstanding loans: +12.6% vs. 2007Gross interest margin: 2.21% (-25 bp vs. 2007)
SUPPLEMENT - FRENCH NETWORKS
Interest income on individual customers
Interest income on business customers
Service commissions
Financial commissions
Others
NBI in EUR m
Allocation or write-back from PEL/CEL provision
Capital gain
* Excluding EUR 9.1bn of medium-term notes issued to Network customers in 2008 vs. EUR 10.2bn in 2007 (b) Excluding PEL/CEL provision of EUR 6m vs. a EUR 53m reversal in 2007 and excl. Euronext capital gain (EUR 36m in Q2 07) and Visa capital gain (EUR 72m in Q4 08)
-46 53 -61837236
2039 20312021 1967
1444134012791235
465384358313
2347 249421532024
867
748821
755
6,295 6,833 7,058 7,191
2005 2006 2007 2008
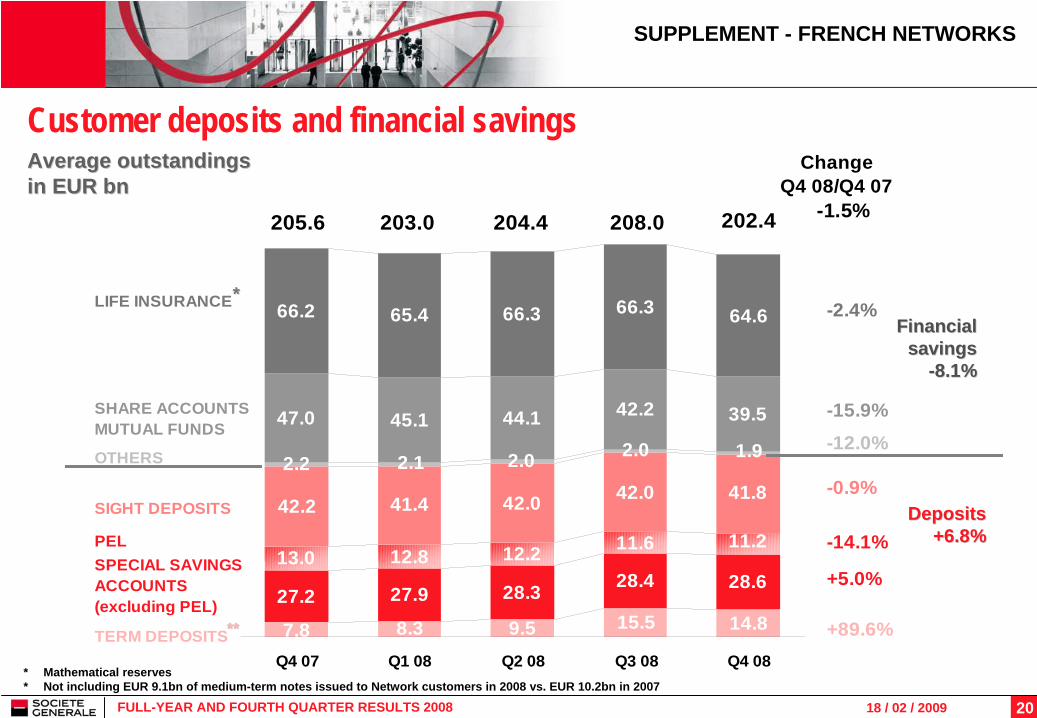
2018 / 02 / 2009FULL-YEAR AND FOURTH QUARTER RESULTS 2008
27.2 27.9 28.3 28.4 28.612.8 12.2 11.6
42.0 42.0
47.0 45.1 44.1 42.2 39.5
66.2 65.4 66.3 66.3
14.815.59.58.37.8
11.213.0
41.841.442.2
2.2 2.1 2.0 2.0 1.9
64.6
205.6 203.0 204.4 208.0 202.4
Q4 07 Q1 08 Q2 08 Q3 08 Q4 08TERM DEPOSITS
SPECIAL SAVINGS ACCOUNTS(excluding PEL)
SIGHT DEPOSITS
SHARE ACCOUNTSMUTUAL FUNDS
LIFE INSURANCE
OTHERS
ChangeQ4 08/Q4 07
-1.5%
-2.4%
-15.9%
-12.0%
-0.9%
+5.0%
+89.6%
PEL -14.1%
Average Average outstandings outstandings inin EUR EUR bn bn
Customer deposits and financial savings
DepositsDeposits +6.8%+6.8%
Financial Financial savingssavings
--8.1%8.1%
* Mathematical reserves * Not including EUR 9.1bn of medium-term notes issued to Network customers in 2008 vs. EUR 10.2bn in 2007
**
SUPPLEMENT - FRENCH NETWORKS
****
2118 / 02 / 2009FULL-YEAR AND FOURTH QUARTER RESULTS 2008
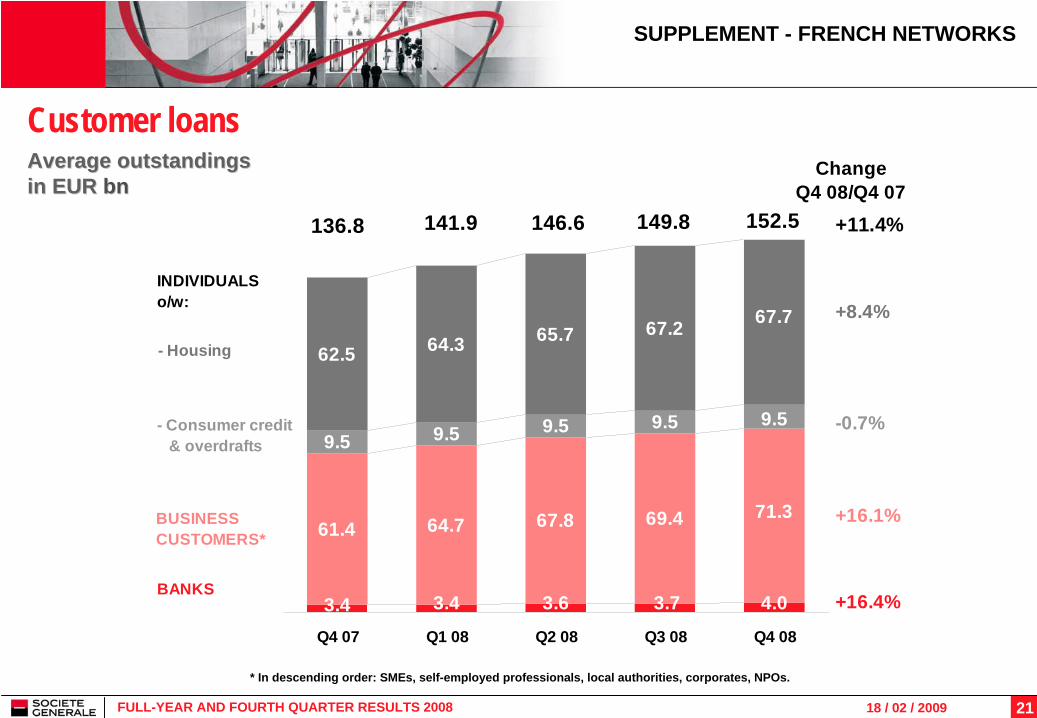
61.4 64.7 67.8 69.4
9.5 9.5 9.5 9.5
62.5 64.3 65.7 67.2
4.03.73.63.43.4
71.3
9.5
67.7
152.5149.8146.6141.9136.8
Q4 07 Q1 08 Q2 08 Q3 08 Q4 08
INDIVIDUALSo/w:
BUSINESSCUSTOMERS*
- Housing
- Consumer credit & overdrafts
BANKS
+8.4%
-0.7%
+16.1%
+16.4%
+11.4%
ChangeQ4 08/Q4 07
AverageAverage outstandingsoutstandingsin EURin EUR bnbn
Customer loans
* In descending order: SMEs, self-employed professionals, local authorities, corporates, NPOs.
SUPPLEMENT - FRENCH NETWORKS
2218 / 02 / 2009FULL-YEAR AND FOURTH QUARTER RESULTS 2008
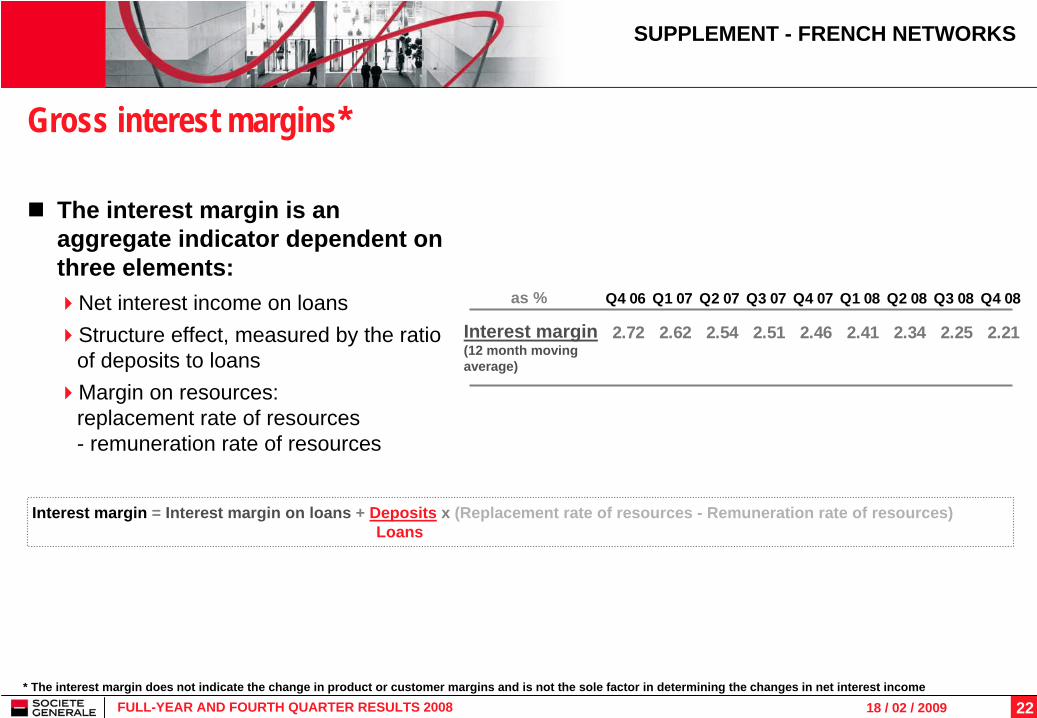
Q4 06 Q1 07 Q2 07 Q3 07 Q4 07 Q1 08 Q2 08 Q3 08 Q4 08
2.72 2.62 2.54 2.51 2.46 2.41 2.34 2.25 2.21
Gross interest margins*
The interest margin is anaggregate indicator dependent on three elements:
Net interest income on loansStructure effect, measured by the ratio of deposits to loans Margin on resources: replacement rate of resources - remuneration rate of resources
Interest margin = Interest margin on loans + Deposits x (Replacement rate of resources - Remuneration rate of resources)Loans
as %
Interest margin (12 month moving average)
SUPPLEMENT - FRENCH NETWORKS
* The interest margin does not indicate the change in product or customer margins and is not the sole factor in determining the changes in net interest income
2318 / 02 / 2009FULL-YEAR AND FOURTH QUARTER RESULTS 2008
SUPPLEMENT - INTERNATIONAL RETAIL BANKING
Results - International Retail Banking
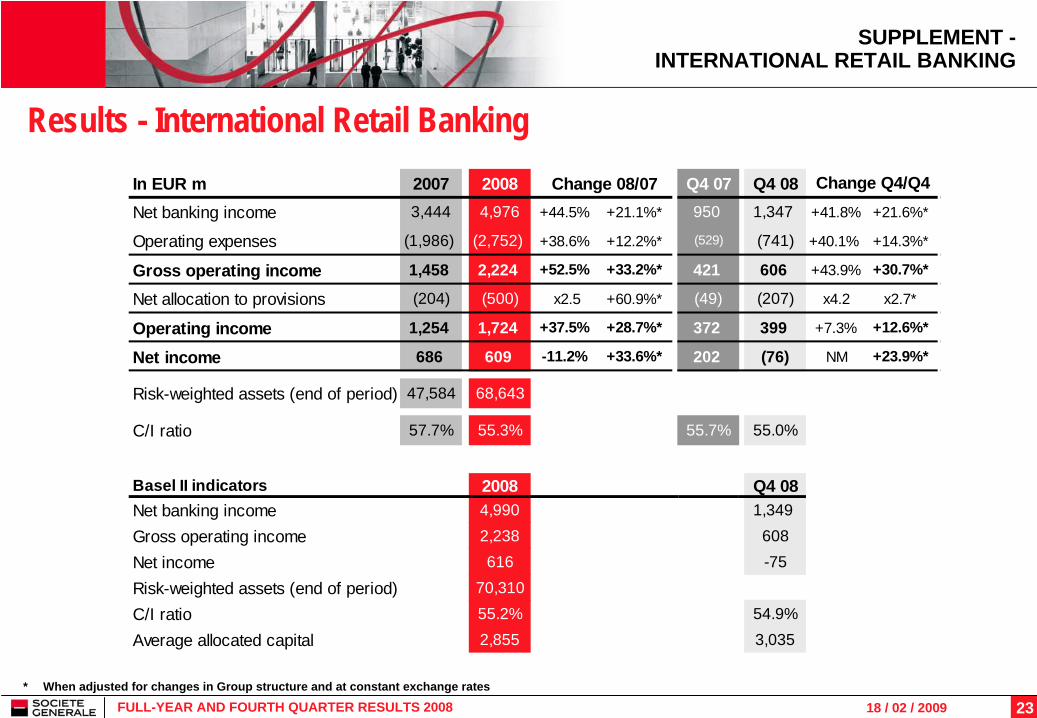
* When adjusted for changes in Group structure and at constant exchange rates
In EUR m 2007 2008 Change 08/07 Q4 07 Q4 08Net banking income 3,444 4,976 +44.5% +21.1%* 950 1,347 +41.8% +21.6%*
Operating expenses (1,986) (2,752) +38.6% +12.2%* (529) (741) +40.1% +14.3%*
Gross operating income 1,458 2,224 +52.5% +33.2%* 421 606 +43.9% +30.7%*
Net allocation to provisions (204) (500) x2.5 +60.9%* (49) (207) x4.2 x2.7*
Operating income 1,254 1,724 +37.5% +28.7%* 372 399 +7.3% +12.6%*
Net income 686 609 -11.2% +33.6%* 202 (76) NM +23.9%*
Risk-weighted assets (end of period) 47,584 68,643
C/I ratio 57.7% 55.3% 55.7% 55.0%
Basel II indicators 2008 Q4 08Net banking income 4,990 1,349
Gross operating income 2,238 608
Net income 616 -75
Risk-weighted assets (end of period) 70,310
C/I ratio 55.2% 54.9%
Average allocated capital 2,855 3,035
Change Q4/Q4
2418 / 02 / 2009FULL-YEAR AND FOURTH QUARTER RESULTS 2008
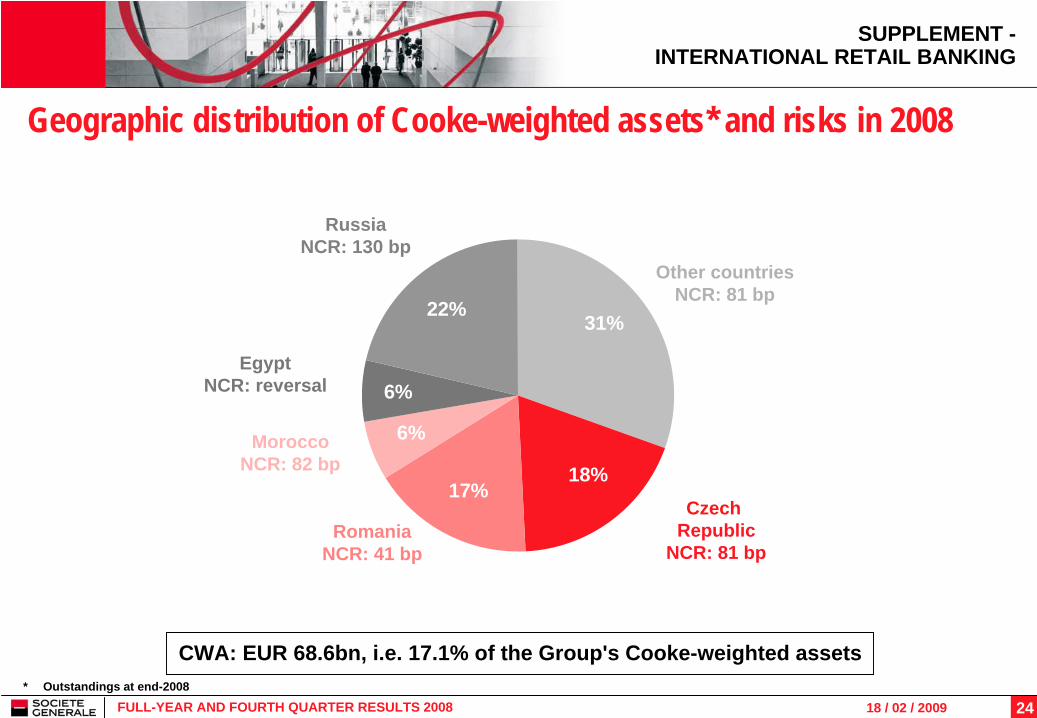
Geographic distribution of Cooke-weighted assets* and risks in 2008
SUPPLEMENT - INTERNATIONAL RETAIL BANKING
6%
6%
17%18%
22%31%
RussiaNCR: 130 bp
EgyptNCR: reversal
MoroccoNCR: 82 bp
RomaniaNCR: 41 bp
CzechRepublic
NCR: 81 bp
Other countries NCR: 81 bp
CWA: EUR 68.6bn, i.e. 17.1% of the Group's Cooke-weighted assets* Outstandings at end-2008

2518 / 02 / 2009FULL-YEAR AND FOURTH QUARTER RESULTS 2008
Indicators of subsidiaries
SUPPLEMENT - INTERNATIONAL RETAIL BANKING
* Indicators at end-December 2008 - In EUR m (1) The exposures reported relate to all International Retail Banking operations
Cr
Czech Republic (KB) 60.35% 12,601 13,653 20,725 65.9% 841.0
Russia (Rosbank) 57.57% 10,305 8,636 7,455 115.8% 556.1
Romania (BRD) 58.54% 11,622 8,099 6,784 119.4% 372.6
Morocco (SGMA) 56.91% 4,269 4,915 4,564 107.7% 242.2
Greece (GBG) 52.32% 4,393 3,989 2,507 159.1% 146.1
Egypt (NSGB) 77.17% 4,316 3,704 4,741 78.1% 540.2
Russia (BSGV) 100.00% 3,971 3,652 1,976 184.8% 186.8
Croatia (SB) 100.00% 2,583 2,552 1,754 145.4% 358.8
Slovenia (SKB) 99.69% 2,256 2,423 1,236 196.1% 215.3
Bulgaria (SGEB) 97.95% 1,365 1,075 628 171.1% 103.6
Reunion (BFCOI) 49.99% 1,170 1,506 1,408 107.0% 44.4
Algeria (SGA) 100.00% 990 842 724 116.3% 66.7
Serbia (SGS) 100.00% 1,112 501 412 121.5% 183.6
Loan to deposit ratio
(as %)(1)Net position*(1)Ownership
percentage CWA*(1) Loans*(1) Deposits*(1)

2618 / 02 / 2009FULL-YEAR AND FOURTH QUARTER RESULTS 2008
Results - Financial Services
SUPPLEMENT – FINANCIAL SERVICES
* When adjusted for changes in Group structure and at constant exchange rates
In EUR m 2007 2008 Change 08/07 Q4 07 Q4 08Net banking income 2,838 3,115 +9.8% +7.1%* 798 712 -10.8% -2.8%*
o.w. specialised financing 2,343 2,645 +12.9% +9.9%* 659 618 -6.2% +4.1%*
Operating expenses (1,526) (1,795) +17.6% +9.3%* (435) (458) +5.3% -0.0%*
Gross operating income 1,312 1,320 +0.6% +4.6%* 363 254 -30.0% -6.2%*
o.w. specialised financing 982 1,031 +5.0% +10.5%* 271 205 -24.4% +8.0%*
Net allocation to provisions (374) (587) +57.0% +38.5%* (102) (191) +87.3% +62.2%*
Operating income 938 733 -21.9% -8.3%* 261 63 -75.9% -32.3%*
o.w. specialised financing 608 450 -26.0% -5.0%* 169 17 -89.9% -22.4%*
Net income 600 469 -21.8% -8.9%* 168 15 -91.1% -45.5%*
Risk-weighted assets (end of period) 42,319 47,616
C/I ratio 53.8% 57.6% 54.5% 64.3%
Basel II indicators 2008 Q4 08Net banking income 3,100 708
Gross operating income 1,305 250
Net income 459 14
Risk-weighted assets (end of period) 38,210
C/I ratio 57.9% 64.7%
Average allocated capital 3,881 4,016
Change Q4/Q4
2718 / 02 / 2009FULL-YEAR AND FOURTH QUARTER RESULTS 2008
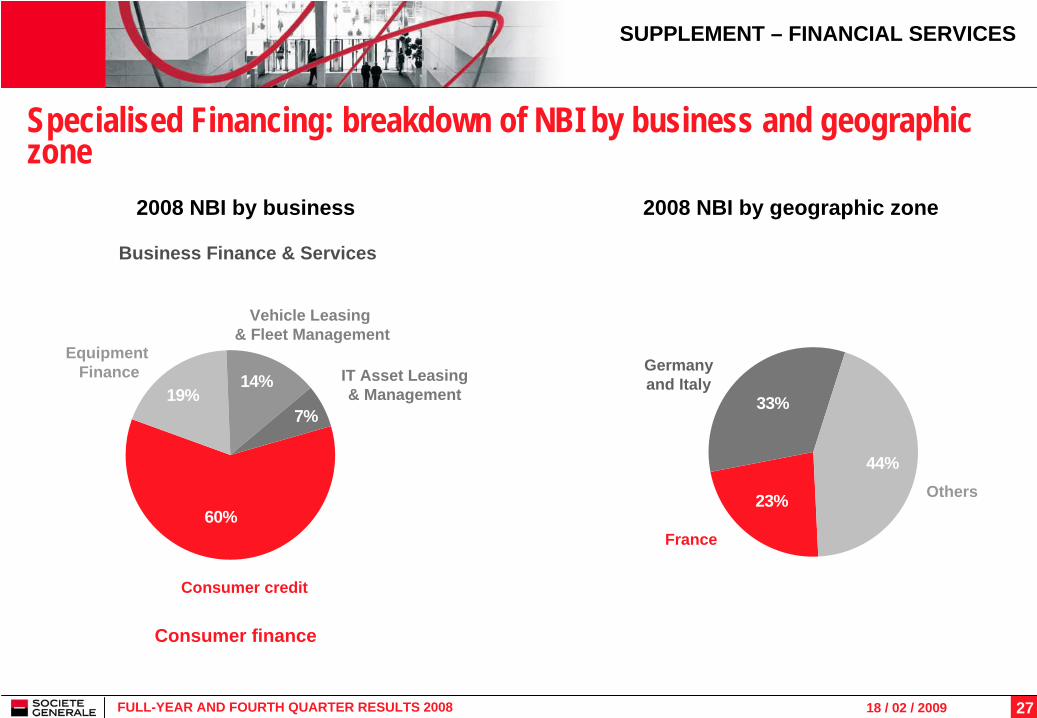
23%
33%
44%
Germany and Italy
Specialised Financing: breakdown of NBI by business and geographic zone
2008 NBI by geographic zone2008 NBI by business
France
Others
Business Finance & Services
Consumer finance
SUPPLEMENT – FINANCIAL SERVICES
IT Asset Leasing & Management
Consumer credit
Vehicle Leasing & Fleet Management
7%
14%19%
60%
Equipment Finance

2818 / 02 / 2009FULL-YEAR AND FOURTH QUARTER RESULTS 2008
Results - Global Investment Management and Services
SUPPLEMENT – GLOBAL INVESTMENT MANAGEMENT AND SERVICES
* When adjusted for changes in Group structure and at constant exchange ratesThe Securities Services NBI includes 50% of Newedge in 2008 (vs. 100% of Fimat in 2007)
In EUR m 2007 2008 Q4 07 Q4 08Net banking income 3,741 2,810 -24.9% -26.7%* 852 597 -29.9% - 35.6%*
Operating expenses (2,708) (2,630) -2.9% +2.9%* (744) (673) -9.5% - 8.3%*
Gross operating income 1,033 180 -82.6% - 92.2%* 108 (76) NM NM*
Net allocation to provisions (41) (53) +29.3% +79.2%* (33) (39) +18.2% +88.9%*
Operating income 992 127 -87.2% - 96.9%* 75 (115) NM NM*
Net income 652 104 -84.0% - 93.3%* 50 (71) NM NM*
C/I ratio 72.4% 93.6% 87.3% NM
Basel II indicators 2008 Q4 08Net banking income 2,818 598
Gross operating income 188 -75
Net income 110 -70
C/I ratio 93.3% NM
Change 08/07 Change Q4/Q4
2918 / 02 / 2009FULL-YEAR AND FOURTH QUARTER RESULTS 2008
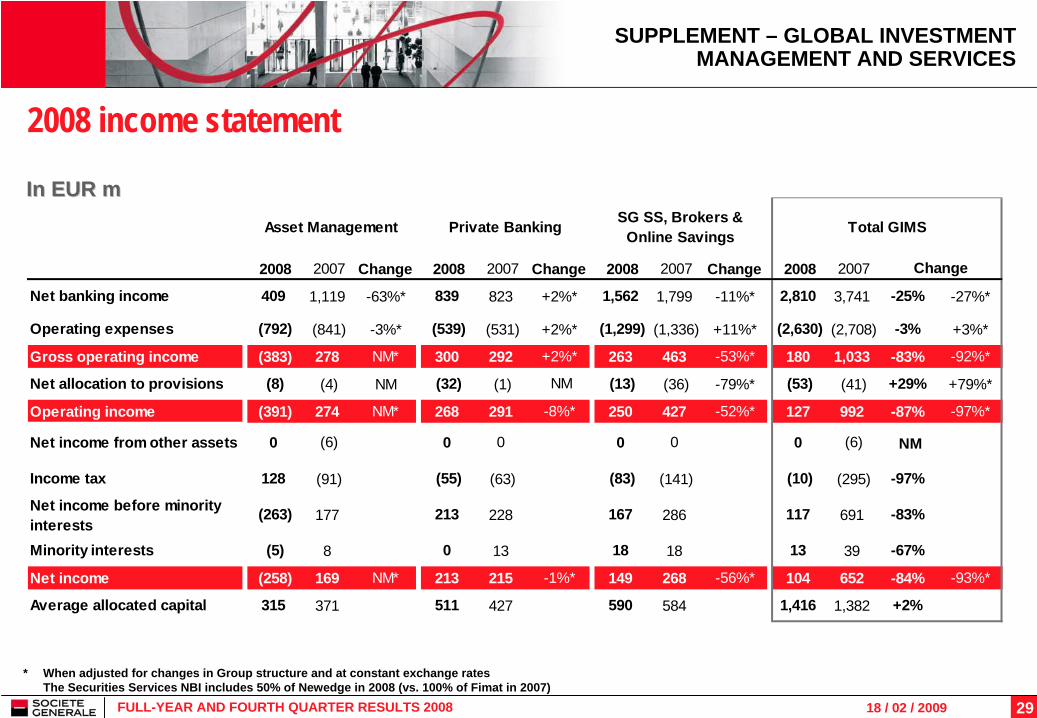
2008 income statement
In EUR mIn EUR m
SUPPLEMENT – GLOBAL INVESTMENTMANAGEMENT AND SERVICES
* When adjusted for changes in Group structure and at constant exchange ratesThe Securities Services NBI includes 50% of Newedge in 2008 (vs. 100% of Fimat in 2007)
2008 2007 Change 2008 2007 Change 2008 2007 Change 2008 2007
Net banking income 409 1,119 -63%* 839 823 +2%* 1,562 1,799 -11%* 2,810 3,741 -25% -27%*
Operating expenses (792) (841) -3%* (539) (531) +2%* (1,299) (1,336) +11%* (2,630) (2,708) -3% +3%*
Gross operating income (383) 278 NM* 300 292 +2%* 263 463 -53%* 180 1,033 -83% -92%*
Net allocation to provisions (8) (4) +100%* (32) (1) x 31,0* (13) (36) -79%* (53) (41) +29% +79%*
Operating income (391) 274 NM* 268 291 -8%* 250 427 -52%* 127 992 -87% -97%*
Net income from other assets 0 (6) 0 0 0 0 0 (6) +100%
Income tax 128 (91) (55) (63) (83) (141) (10) (295) -97%
Net income before minority interests
(263) 177 213 228 167 286 117 691 -83%
Minority interests (5) 8 0 13 18 18 13 39 -67%
Net income (258) 169 NM* 213 215 -1%* 149 268 -56%* 104 652 -84% -93%*
Average allocated capital 315 371 511 427 590 584 1,416 1,382 +2%
Asset Management
Change
Total GIMSSG SS, Brokers & Online SavingsPrivate Banking
NM NM
NM

3018 / 02 / 2009FULL-YEAR AND FOURTH QUARTER RESULTS 2008
Quarterly income statement
InIn EUR mEUR m
SUPPLEMENT – GLOBAL INVESTMENTMANAGEMENT AND SERVICES
* When adjusted for changes in Group structure and at constant exchange ratesThe Securities Services NBI includes 50% of Newedge in Q4 08 (vs. 100% of Fimat in Q4 07)
Q4 08 Q4 07 Q4 08 Q4 07 Q4 08 Q4 07 Q4 08 Q4 07
Net banking income (18) 191 NM* 224 233 -6%* 391 428 -9%* 597 852 -30% -36%*
Operating expenses (197) (227) -12%* (138) (157) -14%* (338) (360) +1%* (673) (744) -10% -8%*
Gross operating income (215) (36) NM* 86 76 +12%* 53 68 -59%* (76) 108 NM NM*
Net allocation to provisions (10) (4) x2.5* (20) 0 NM* (9) (29) -64%* (39) (33) +18% +89%*
Operating income (225) (40) NM* 66 76 -13%* 44 39 -57%* (115) 75 NM NM*
Net income from other assets 0 (4) 0 0 0 0 0 (4) +100%
Income tax 74 15 (9) (14) (15) (13) 50 (12) NM
Net income before minority interests
(151) (29) 57 62 29 26 (65) 59 NM
Minority interests 1 1 0 4 5 4 6 9 -33%
Net income (152) (30) NM* 57 58 -2%* 24 22 -91%* (71) 50 NM NM*
Average allocated capital 241 502 519 466 577 582 1,337 1,550 -14%
Asset Management
Change
Private Banking
Change Change
SG SS, Brokers & Online Savings
Change
Total GIMS
NM

3118 / 02 / 2009FULL-YEAR AND FOURTH QUARTER RESULTS 2008
5.647.8 49.7 48.6
81.4 80.3 79.0 80.5
45.1 31.3 29.6 28.1
54.2
48.0 45.6 43.7
45.0
44.2 40.9 41.4
0.91.33.411.050.042.6
80.1
25.1
78.4
41.554.461.062.034.6
37.0
269.2298.0309.2319.2357.7
Dec. 07 March 08 June 08 Sept. 08 Dec. 08
Alternative
Diversified
Equities
Bonds
Dyn. moneymarket
Money market
CDOs
Assets under management by product type
(1) Hedge funds, private equity, real estate, active structured asset management, index-fund management (2) Funds combining several asset classes (bonds, equities, cash), for example risk-profiled funds
(1)
(2)
SUPPLEMENT - ASSET MANAGEMENT
NB: excluding EUR 60.6bn of assets managed by Lyxor at
31/12/2008
NB: excluding EUR 60.6bn of NB: excluding EUR 60.6bn of assets managed by assets managed by LyxorLyxor atat
31/12/200831/12/2008
EUR 269.2bn EUR 269.2bn at Decemberat December 31st 200831st 2008
3218 / 02 / 2009FULL-YEAR AND FOURTH QUARTER RESULTS 2008
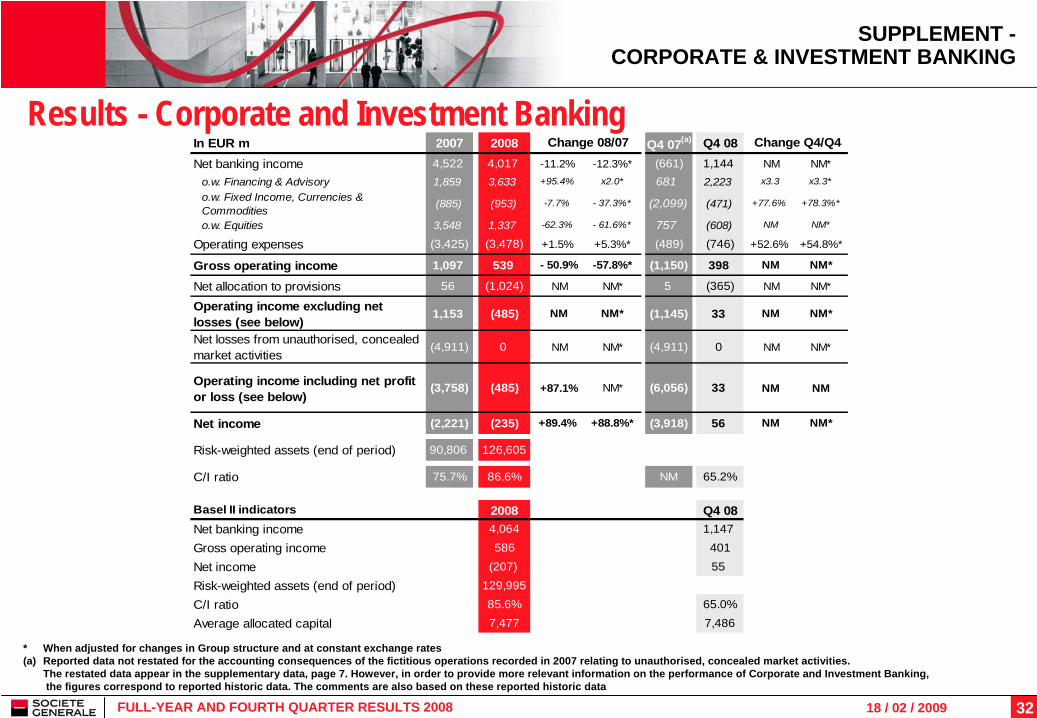
Results - Corporate and Investment Banking
SUPPLEMENT -CORPORATE & INVESTMENT BANKING
In EUR m 2007 2008 Q4 07(a) Q4 08Net banking income 4,522 4,017 -11.2% -12.3%* (661) 1,144 NM NM*
o.w. Financing & Advisory 1,859 3,633 +95.4% x2.0* 681 2,223 x3.3 x3.3*
o.w. Fixed Income, Currencies & Commodities (885) (953) -7.7% - 37.3%* (2,099) (471) +77.6% +78.3%*
o.w. Equities 3,548 1,337 -62.3% - 61.6%* 757 (608) NM NM*
Operating expenses (3,425) (3,478) +1.5% +5.3%* (489) (746) +52.6% +54.8%*
Gross operating income 1,097 539 - 50.9% -57.8%* (1,150) 398 NM NM*
Net allocation to provisions 56 (1,024) NM NM* 5 (365) NM NM*
Operating income excluding net losses (see below)
1,153 (485) NM NM* (1,145) 33 NM NM*
Net losses from unauthorised, concealed market activities
(4,911) 0 NM NM* (4,911) 0 NM NM*
Operating income including net profit or loss (see below)
(3,758) (485) +87.1% NM* (6,056) 33 NM NM
Net income (2,221) (235) +89.4% +88.8%* (3,918) 56 NM NM*
Risk-weighted assets (end of period) 90,806 126,605
C/I ratio 75.7% 86.6% NM 65.2%
Basel II indicators 2008 Q4 08Net banking income 4,064 1,147
Gross operating income 586 401
Net income (207) 55
Risk-weighted assets (end of period) 129,995
C/I ratio 85.6% 65.0%
Average allocated capital 7,477 7,486
Change 08/07 Change Q4/Q4
* When adjusted for changes in Group structure and at constant exchange rates(a) Reported data not restated for the accounting consequences of the fictitious operations recorded in 2007 relating to unauthorised, concealed market activities.
The restated data appear in the supplementary data, page 7. However, in order to provide more relevant information on the performance of Corporate and Investment Banking, the figures correspond to reported historic data. The comments are also based on these reported historic data
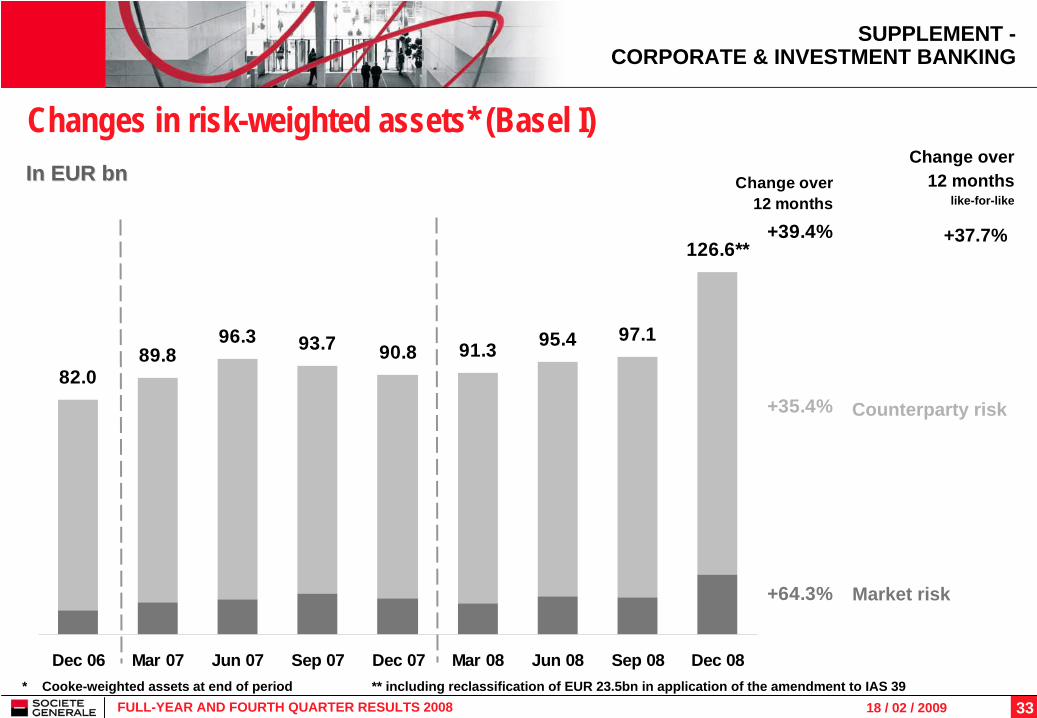
3318 / 02 / 2009FULL-YEAR AND FOURTH QUARTER RESULTS 2008
82.089.8
96.3 93.7 90.8 91.3 95.4 97.1
126.6**
Dec 06 Mar 07 Jun 07 Sep 07 Dec 07 Mar 08 Jun 08 Sep 08 Dec 08
+35.4%
+64.3%
+39.4%
Change over 12 months
Changes in risk-weighted assets* (Basel I)
SUPPLEMENT - CORPORATE & INVESTMENT BANKING
Change over 12 months
like-for-like
+37.7%
* Cooke-weighted assets at end of period ** including reclassification of EUR 23.5bn in application of the amendment to IAS 39
Market risk
Counterparty risk
In EUR bnIn EUR bn
3418 / 02 / 2009FULL-YEAR AND FOURTH QUARTER RESULTS 2008
SUPPLEMENT - CORPORATE & INVESTMENT BANKING
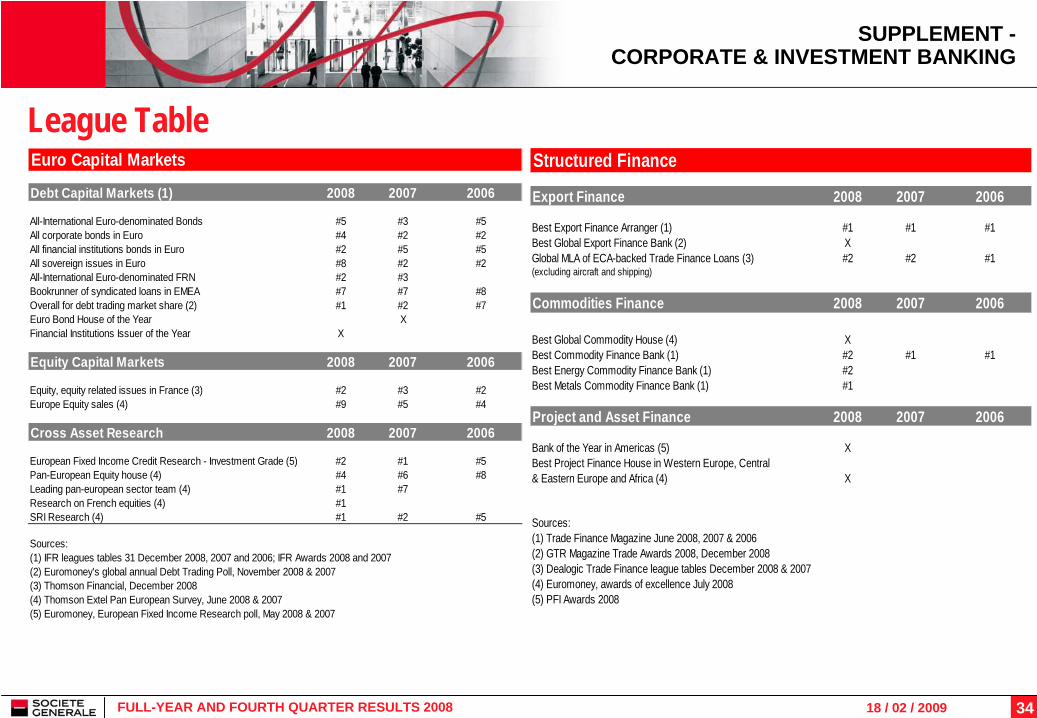
League TableEuro Capital Markets
Debt Capital Markets (1) 2008 2007 2006
All-International Euro-denominated Bonds #5 #3 #5All corporate bonds in Euro #4 #2 #2All financial institutions bonds in Euro #2 #5 #5All sovereign issues in Euro #8 #2 #2All-International Euro-denominated FRN #2 #3Bookrunner of syndicated loans in EMEA #7 #7 #8Overall for debt trading market share (2) #1 #2 #7Euro Bond House of the Year XFinancial Institutions Issuer of the Year X
Equity Capital Markets 2008 2007 2006
Equity, equity related issues in France (3) #2 #3 #2Europe Equity sales (4) #9 #5 #4
Cross Asset Research 2008 2007 2006
European Fixed Income Credit Research - Investment Grade (5) #2 #1 #5Pan-European Equity house (4) #4 #6 #8Leading pan-european sector team (4) #1 #7Research on French equities (4) #1SRI Research (4) #1 #2 #5
Sources:(1) IFR leagues tables 31 December 2008, 2007 and 2006; IFR Awards 2008 and 2007(2) Euromoney's global annual Debt Trading Poll, November 2008 & 2007(3) Thomson Financial, December 2008(4) Thomson Extel Pan European Survey, June 2008 & 2007(5) Euromoney, European Fixed Income Research poll, May 2008 & 2007
Structured Finance
Export Finance 2008 2007 2006
Best Export Finance Arranger (1) #1 #1 #1Best Global Export Finance Bank (2) XGlobal MLA of ECA-backed Trade Finance Loans (3) #2 #2 #1(excluding aircraft and shipping)
Commodities Finance 2008 2007 2006
Best Global Commodity House (4) XBest Commodity Finance Bank (1) #2 #1 #1Best Energy Commodity Finance Bank (1) #2Best Metals Commodity Finance Bank (1) #1
Project and Asset Finance 2008 2007 2006
Bank of the Year in Americas (5) XBest Project Finance House in Western Europe, Central & Eastern Europe and Africa (4) X
Sources:(1) Trade Finance Magazine June 2008, 2007 & 2006(2) GTR Magazine Trade Awards 2008, December 2008(3) Dealogic Trade Finance league tables December 2008 & 2007(4) Euromoney, awards of excellence July 2008 (5) PFI Awards 2008
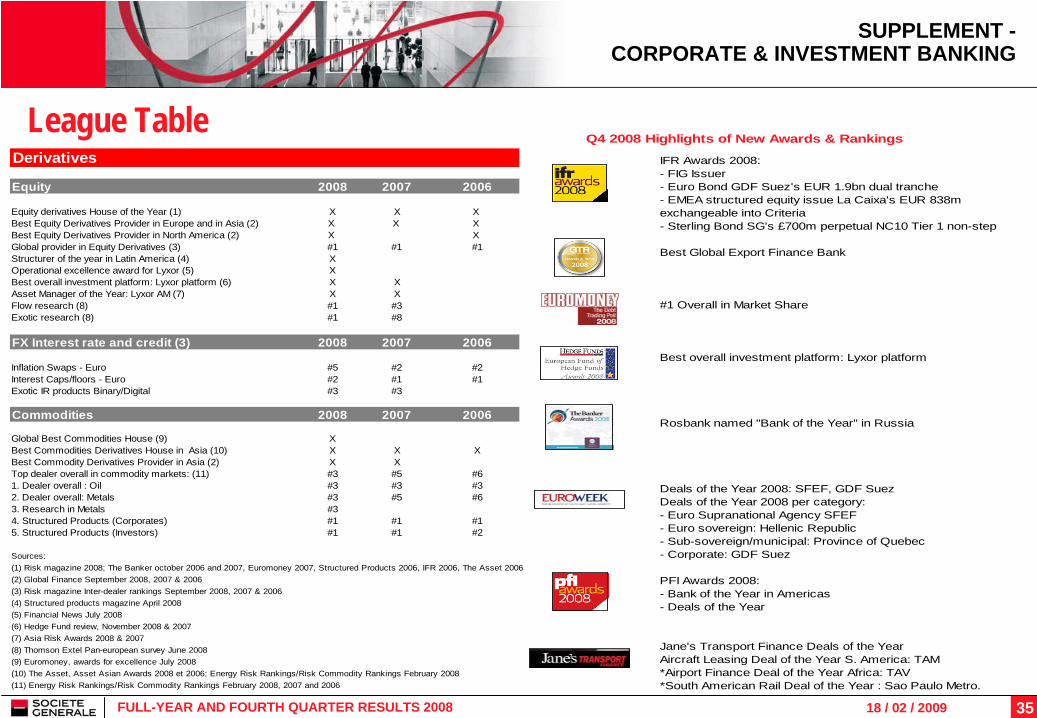
3518 / 02 / 2009FULL-YEAR AND FOURTH QUARTER RESULTS 2008
SUPPLEMENT - CORPORATE & INVESTMENT BANKING
League TableDerivatives
Equity 2008 2007 2006
Equity derivatives House of the Year (1) X X X Best Equity Derivatives Provider in Europe and in Asia (2) X X X Best Equity Derivatives Provider in North America (2) X X Global provider in Equity Derivatives (3) #1 #1 #1Structurer of the year in Latin America (4) XOperational excellence award for Lyxor (5) XBest overall investment platform: Lyxor platform (6) X XAsset Manager of the Year: Lyxor AM (7) X XFlow research (8) #1 #3Exotic research (8) #1 #8
FX Interest rate and credit (3) 2008 2007 2006
Inflation Swaps - Euro #5 #2 #2Interest Caps/floors - Euro #2 #1 #1Exotic IR products Binary/Digital #3 #3
Commodities 2008 2007 2006
Global Best Commodities House (9) XBest Commodities Derivatives House in Asia (10) X X XBest Commodity Derivatives Provider in Asia (2) X XTop dealer overall in commodity markets: (11) #3 #5 #61. Dealer overall : Oil #3 #3 #32. Dealer overall: Metals #3 #5 #63. Research in Metals #34. Structured Products (Corporates) #1 #1 #15. Structured Products (Investors) #1 #1 #2
Sources:(1) Risk magazine 2008; The Banker october 2006 and 2007, Euromoney 2007, Structured Products 2006, IFR 2006, The Asset 2006(2) Global Finance September 2008, 2007 & 2006(3) Risk magazine Inter-dealer rankings September 2008, 2007 & 2006(4) Structured products magazine April 2008(5) Financial News July 2008(6) Hedge Fund review, November 2008 & 2007(7) Asia Risk Awards 2008 & 2007(8) Thomson Extel Pan-european survey June 2008(9) Euromoney, awards for excellence July 2008(10) The Asset, Asset Asian Awards 2008 et 2006; Energy Risk Rankings/Risk Commodity Rankings February 2008(11) Energy Risk Rankings/Risk Commodity Rankings February 2008, 2007 and 2006
Q4 2008 Highlights of New Awards & Rankings
IFR Awards 2008:- FIG Issuer- Euro Bond GDF Suez's EUR 1.9bn dual tranche- EMEA structured equity issue La Caixa's EUR 838m exchangeable into Criteria- Sterling Bond SG's £700m perpetual NC10 Tier 1 non-step
Best Global Export Finance Bank
#1 Overall in Market Share
Best overall investment platform: Lyxor platform
Rosbank named "Bank of the Year" in Russia
Deals of the Year 2008: SFEF, GDF SuezDeals of the Year 2008 per category:- Euro Supranational Agency SFEF- Euro sovereign: Hellenic Republic - Sub-sovereign/municipal: Province of Quebec- Corporate: GDF Suez
PFI Awards 2008:- Bank of the Year in Americas- Deals of the Year
Jane's Transport Finance Deals of the YearAircraft Leasing Deal of the Year S. America: TAM*Airport Finance Deal of the Year Africa: TAV*South American Rail Deal of the Year : Sao Paulo Metro.
3618 / 02 / 2009FULL-YEAR AND FOURTH QUARTER RESULTS 2008
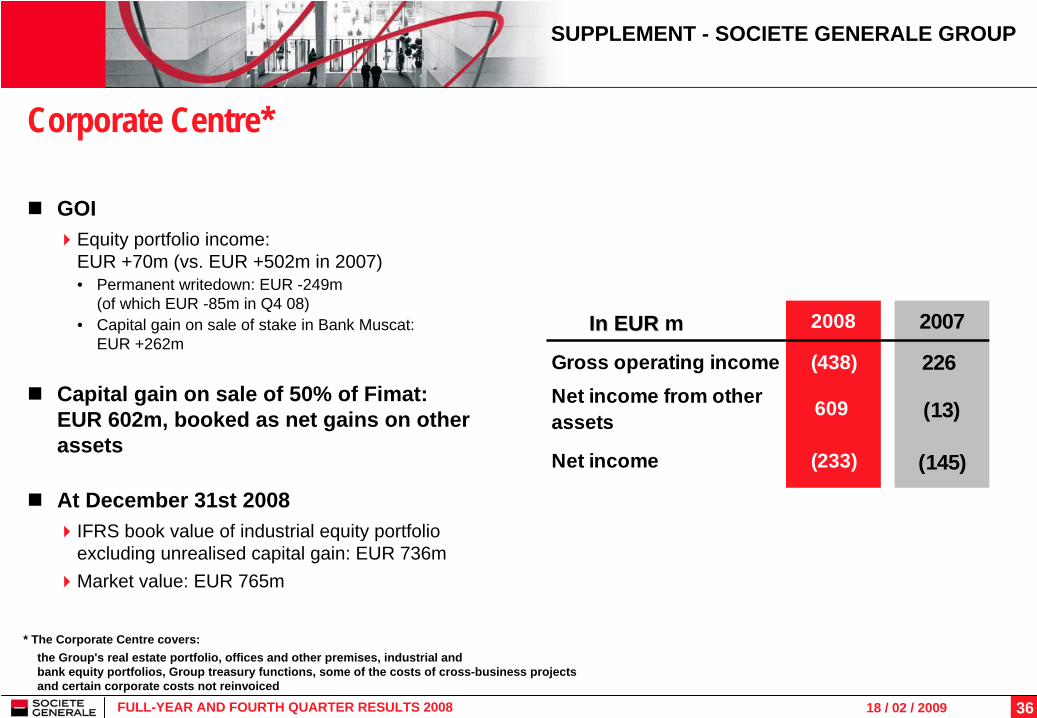
2008 2007
Gross operating income (438) 226 Net income from other assets 609 (13)
Net income (233) (145)
Corporate Centre*
GOIEquity portfolio income: EUR +70m (vs. EUR +502m in 2007)• Permanent writedown: EUR -249m
(of which EUR -85m in Q4 08)• Capital gain on sale of stake in Bank Muscat:
EUR +262m
Capital gain on sale of 50% of Fimat:EUR 602m, booked as net gains on other assets
At December 31st 2008IFRS book value of industrial equity portfolio excluding unrealised capital gain: EUR 736mMarket value: EUR 765m
SUPPLEMENT - SOCIETE GENERALE GROUP
* The Corporate Centre covers:the Group's real estate portfolio, offices and other premises, industrial and bank equity portfolios, Group treasury functions, some of the costs of cross-business projects and certain corporate costs not reinvoiced
In EURIn EUR m
3718 / 02 / 2009FULL-YEAR AND FOURTH QUARTER RESULTS 2008
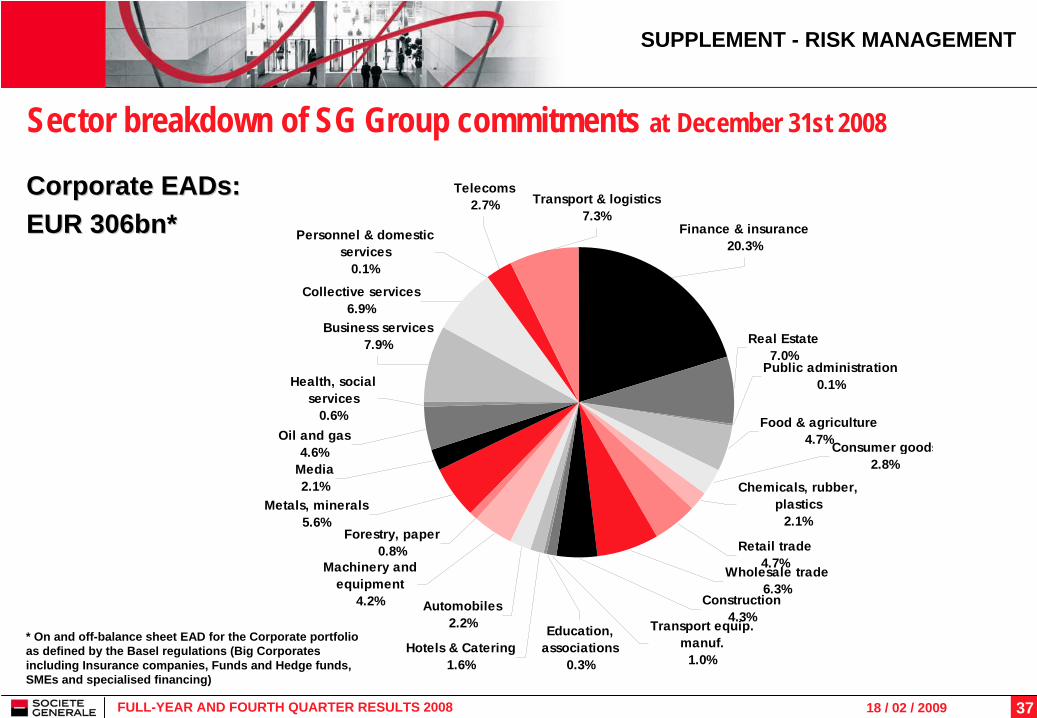
Sector breakdown of SG Group commitments at December 31st 2008
* On and off-balance sheet EAD for the Corporate portfolio as defined by the Basel regulations (Big Corporates including Insurance companies, Funds and Hedge funds, SMEs and specialised financing)
Corporate Corporate EADsEADs::EUR 306bn*EUR 306bn*
SUPPLEMENT - RISK MANAGEMENT
Media2.1%
Finance & insurance20.3%
Transport & logistics7.3%
Telecoms2.7%
Personnel & domestic services
0.1%
Collective services6.9%
Business services7.9%
Health, social services
0.6%Oil and gas
4.6%
Metals, minerals5.6%
Forestry, paper0.8%
Machinery and equipment
4.2% Automobiles2.2%
Hotels & Catering1.6%
Transport equip. manuf.
1.0%
Education, associations
0.3%
Construction4.3%
Real Estate7.0%
Public administration0.1%
Food & agriculture4.7%Consumer goods
2.8%
Chemicals, rubber, plastics
2.1%
Retail trade4.7%
Wholesale trade6.3%
3818 / 02 / 2009FULL-YEAR AND FOURTH QUARTER RESULTS 2008
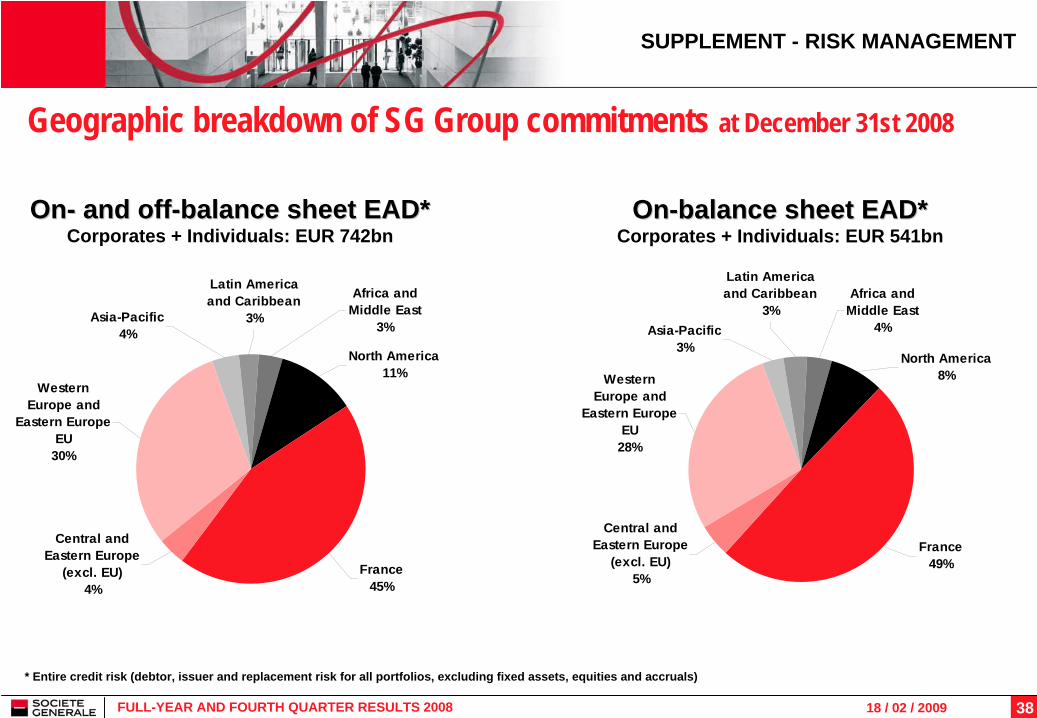
Geographic breakdown of SG Group commitments at December 31st 2008
OnOn-- and offand off--balance sheet EAD*balance sheet EAD*Corporates + Individuals: EUR 742bn
OnOn--balance sheet EAD*balance sheet EAD*Corporates + Individuals: EUR 541bn
* Entire credit risk (debtor, issuer and replacement risk for all portfolios, excluding fixed assets, equities and accruals)
SUPPLEMENT - RISK MANAGEMENT
North America11%
Africa and Middle East
3%
Latin America and Caribbean
3%Asia-Pacific4%
France45%
Central and Eastern Europe
(excl. EU)4%
Western Europe and
Eastern Europe EU
30%
France49%
Africa and Middle East
4%
North America8%
Latin America and Caribbean
3%Asia-Pacific
3%
Central and Eastern Europe
(excl. EU)5%
Western Europe and
Eastern Europe EU
28%
3918 / 02 / 2009FULL-YEAR AND FOURTH QUARTER RESULTS 2008
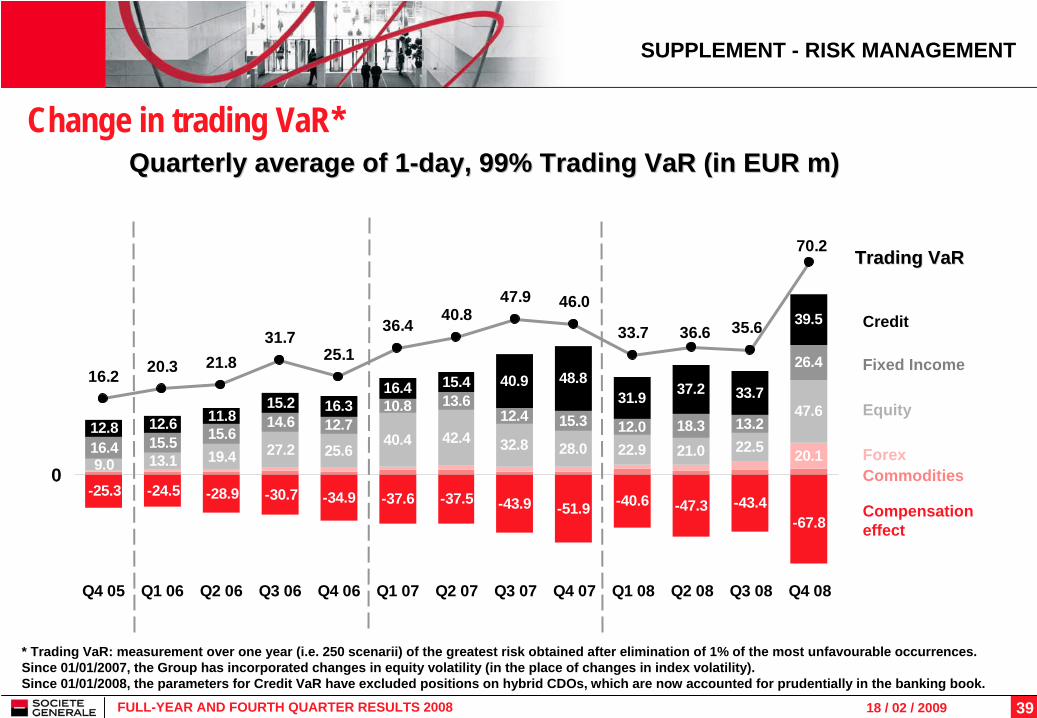
0
Credit
Equity
ForexCommodities
Compensation effect
Trading Trading VaRVaR
Fixed Income
-25.3 -24.5 -28.9 -30.7 -34.9 -37.6 -37.5 -43.9 -51.9 -40.6 -47.3 -43.4
9.0 13.1 19.4 27.2 25.640.4 42.4 32.8 28.0 22.9 21.0 22.516.4 15.5 15.6
14.6 12.710.8 13.6
12.4 15.3 12.0 18.3 13.212.8 12.6 11.815.2 16.3
16.4 15.4 40.9 48.831.9 37.2 33.7
-67.8
20.1
47.6
26.4
39.5
16.2 20.3 21.831.7
25.1
36.4 40.847.9 46.0
33.7
70.2
36.6 35.6
Q4 05 Q1 06 Q2 06 Q3 06 Q4 06 Q1 07 Q2 07 Q3 07 Q4 07 Q1 08 Q2 08 Q3 08 Q4 08
Change in trading VaR*Quarterly average of 1Quarterly average of 1--day, 99% Trading day, 99% Trading VaRVaR (in(in EUR m)EUR m)
SUPPLEMENT - RISK MANAGEMENT
* Trading VaR: measurement over one year (i.e. 250 scenarii) of the greatest risk obtained after elimination of 1% of the most unfavourable occurrences.Since 01/01/2007, the Group has incorporated changes in equity volatility (in the place of changes in index volatility).Since 01/01/2008, the parameters for Credit VaR have excluded positions on hybrid CDOs, which are now accounted for prudentially in the banking book.
4018 / 02 / 2009FULL-YEAR AND FOURTH QUARTER RESULTS 2008
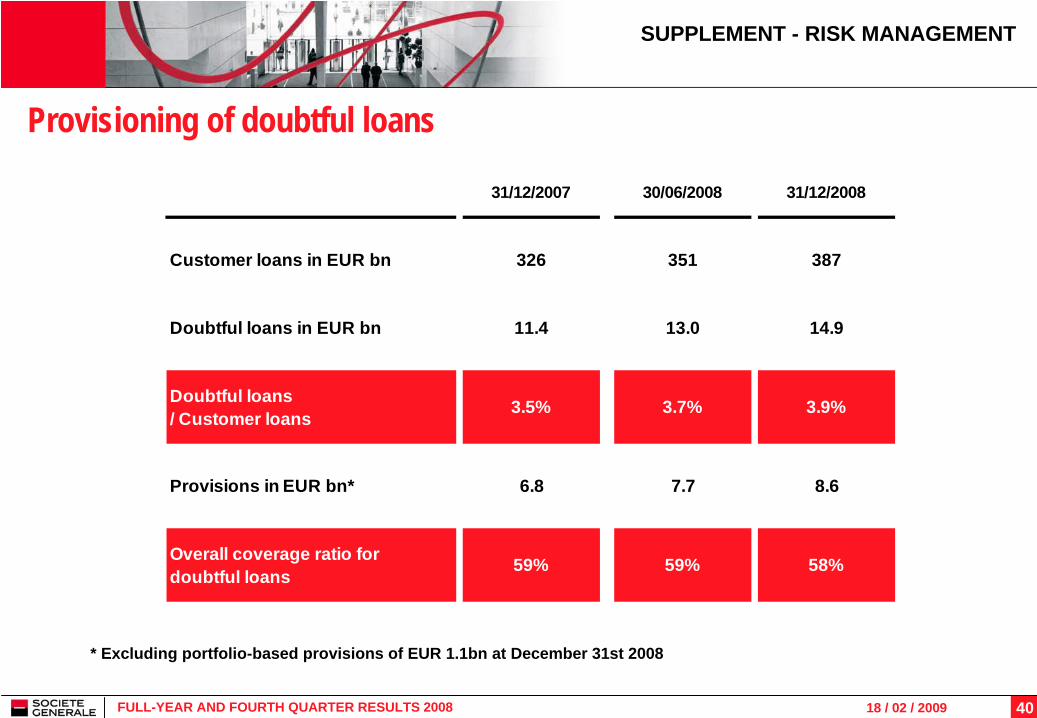
Provisioning of doubtful loans
SUPPLEMENT - RISK MANAGEMENT
* Excluding portfolio-based provisions of EUR 1.1bn at December 31st 2008
31/12/2007 30/06/2008 31/12/2008
Customer loans in EUR bn 326 351 387
Doubtful loans in EUR bn 11.4 13.0 14.9
Doubtful loans / Customer loans 3.5% 3.7% 3.9%
Provisions in EUR bn* 6.8 7.7 8.6
Overall coverage ratio for doubtful loans 59% 59% 58%
4118 / 02 / 2009FULL-YEAR AND FOURTH QUARTER RESULTS 2008
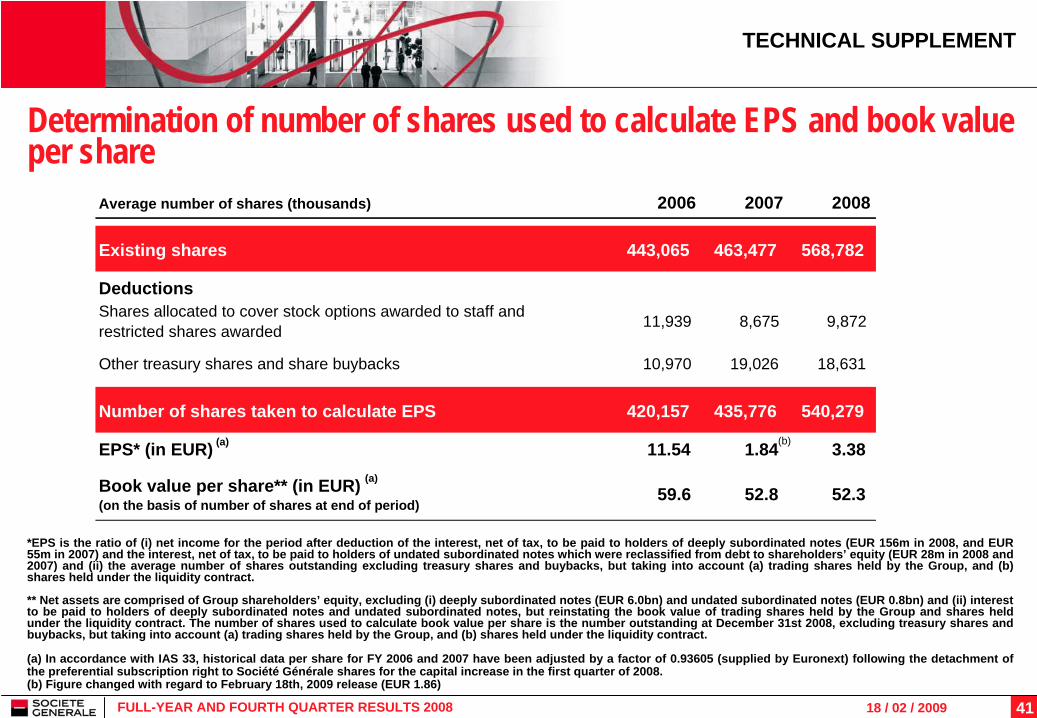
Determination of number of shares used to calculate EPS and book value per share
TECHNICAL SUPPLEMENT
*EPS is the ratio of (i) net income for the period after deduction of the interest, net of tax, to be paid to holders of deeply subordinated notes (EUR 156m in 2008, and EUR 55m in 2007) and the interest, net of tax, to be paid to holders of undated subordinated notes which were reclassified from debt to shareholders’ equity (EUR 28m in 2008 and 2007) and (ii) the average number of shares outstanding excluding treasury shares and buybacks, but taking into account (a) trading shares held by the Group, and (b) shares held under the liquidity contract.
** Net assets are comprised of Group shareholders’ equity, excluding (i) deeply subordinated notes (EUR 6.0bn) and undated subordinated notes (EUR 0.8bn) and (ii) interest to be paid to holders of deeply subordinated notes and undated subordinated notes, but reinstating the book value of trading shares held by the Group and shares held under the liquidity contract. The number of shares used to calculate book value per share is the number outstanding at December 31st 2008, excluding treasury shares and buybacks, but taking into account (a) trading shares held by the Group, and (b) shares held under the liquidity contract.
(a) In accordance with IAS 33, historical data per share for FY 2006 and 2007 have been adjusted by a factor of 0.93605 (supplied by Euronext) following the detachment of the preferential subscription right to Société Générale shares for the capital increase in the first quarter of 2008.(b) Figure changed with regard to February 18th, 2009 release (EUR 1.86)
Average number of shares (thousands) 2006 2007 2008
Existing shares 443,065 463,477 568,782
DeductionsShares allocated to cover stock options awarded to staff and restricted shares awarded 11,939 8,675 9,872
Other treasury shares and share buybacks 10,970 19,026 18,631
Number of shares taken to calculate EPS 420,157 435,776 540,279
EPS* (in EUR) (a) 11.54 1.84 3.38
Book value per share** (in EUR) (a)
(on the basis of number of shares at end of period)59.6 52.8 52.3
(b)
4218 / 02 / 2009FULL-YEAR AND FOURTH QUARTER RESULTS 2008
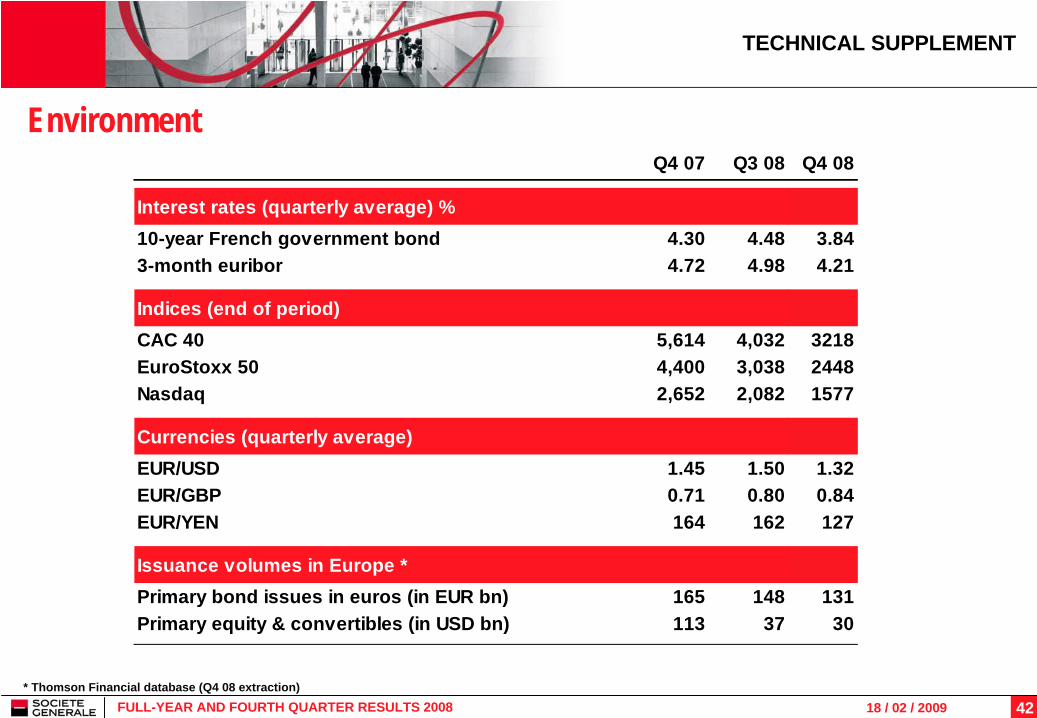
Environment
* Thomson Financial database (Q4 08 extraction)
TECHNICAL SUPPLEMENT
Q4 07 Q3 08 Q4 08
Interest rates (quarterly average) %10-year French government bond 4.30 4.48 3.843-month euribor 4.72 4.98 4.21
Indices (end of period)CAC 40 5,614 4,032 3218EuroStoxx 50 4,400 3,038 2448Nasdaq 2,652 2,082 1577
Currencies (quarterly average)EUR/USD 1.45 1.50 1.32EUR/GBP 0.71 0.80 0.84EUR/YEN 164 162 127
Issuance volumes in Europe *Primary bond issues in euros (in EUR bn) 165 148 131Primary equity & convertibles (in USD bn) 113 37 30

18 / 02 / 2009
Investor RelationsPatrick SOMMELET, Louise DE L’ESTANG, Stéphane MARTY, Nathalie SAND
Tel.: +33 (0) 1 42 14 47 72E-mail: [email protected] - Internet: www.investor.socgen.com