Embed Size (px)
Citation preview
Full-year 2018 results presentation 13 March 2019 Zurich
Page 1
EFG International
Full-year 2018 results presentation 13 March 2019
This document has been prepared by EFG International AG (“EFG”) solely for use by you for general information only and does not contain and is not to be taken as containing any securities advice, recommendation, offer or invitation to subscribe for, purchase or redeem any securities regarding EFG. This presentation contains specific forward-looking statements that include terms like “believe”, “assume”, “expect”, “target” or similar expressions. Such forward-looking statements represent EFG’s judgments and expectations and are subject to known and unknown risks, uncertainties and other factors that may result in a substantial divergence between the actual results, the financial situation, and/or the development or performance of the company and those explicitly or implicitly presumed in these statements. These factors include, but are not limited to: (1) the ability to successfully realize the synergies expected from the integration of BSI SA (“BSI”), (2) general market, macroeconomic, governmental and regulatory trends, (3) movements in securities markets, exchange rates and interest rates, (4) competitive pressures, and (5) other risks and uncertainties inherent in the business of EFG and its subsidiaries, including BSI legacy risks. EFG is not under any obligation to (and expressly disclaims any such obligation to) update or alter its forward-looking statements, whether as a result of new information, future events or otherwise, except as required by applicable law or regulation. Nothing contained herein is, or shall be relied on as, a promise or representation concerning the future performance of EFG and its subsidiaries. EFG may not realize the full benefits of the integration of BSI, including the expected synergies, cost savings or growth opportunities within the anticipated time frame or at all.
Important Legal Disclaimer
Page 2
EFG International
Full-year 2018 results presentation 13 March 2019
Key highlights Giorgio Pradelli, Chief Executive Officer
Page 3 Full-year 2018 results presentation 13 March 2019
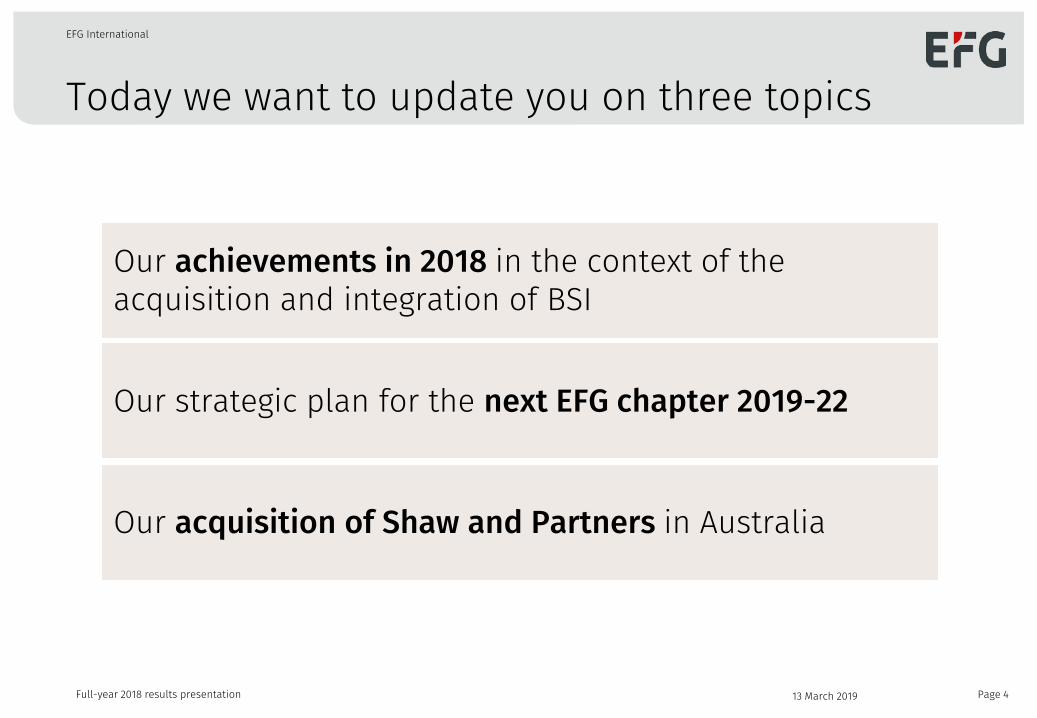
Today we want to update you on three topics
Page 4
EFG International
Full-year 2018 results presentation
Our achievements in 2018 in the context of the acquisition and integration of BSI
Our strategic plan for the next EFG chapter 2019-22
Our acquisition of Shaw and Partners in Australia
13 March 2019
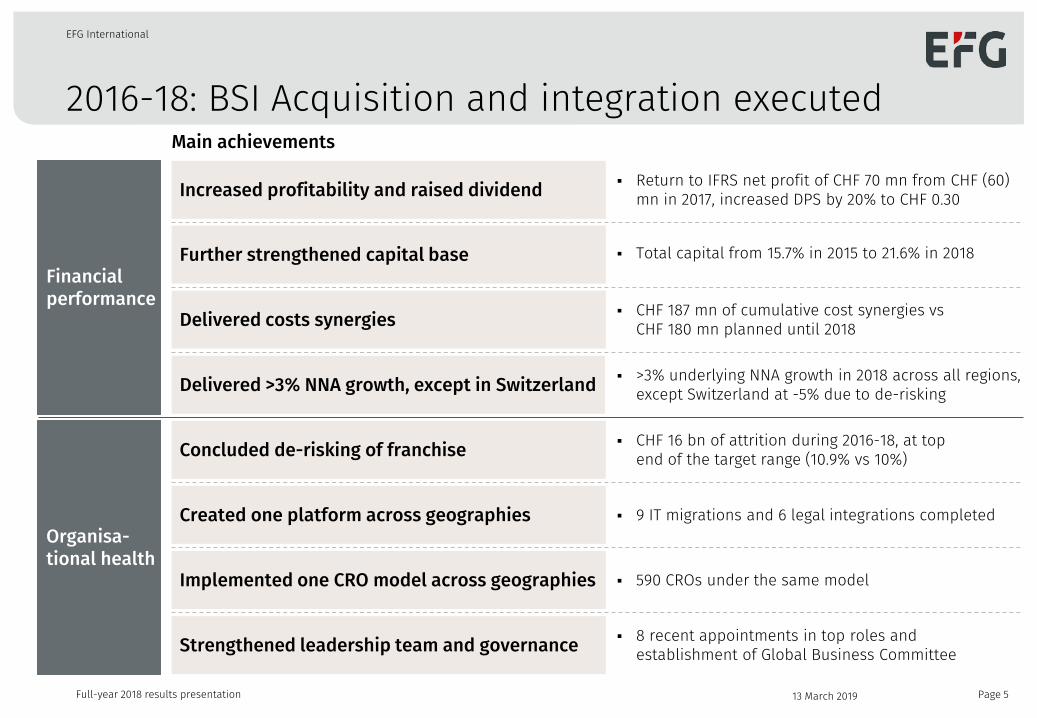
2016-18: BSI Acquisition and integration executed
Page 5
EFG International
Full-year 2018 results presentation
Main achievements
Financial performance
Organisa-tional health
Delivered costs synergies
Further strengthened capital base
Concluded de-risking of franchise
Created one platform across geographies
Implemented one CRO model across geographies
Strengthened leadership team and governance
Increased profitability and raised dividend
Delivered >3% NNA growth, except in Switzerland
CHF 187 mn of cumulative cost synergies vs CHF 180 mn planned until 2018
Total capital from 15.7% in 2015 to 21.6% in 2018
CHF 16 bn of attrition during 2016-18, at top end of the target range (10.9% vs 10%)
9 IT migrations and 6 legal integrations completed
590 CROs under the same model
8 recent appointments in top roles and establishment of Global Business Committee
Return to IFRS net profit of CHF 70 mn from CHF (60) mn in 2017, increased DPS by 20% to CHF 0.30
>3% underlying NNA growth in 2018 across all regions, except Switzerland at -5% due to de-risking
13 March 2019
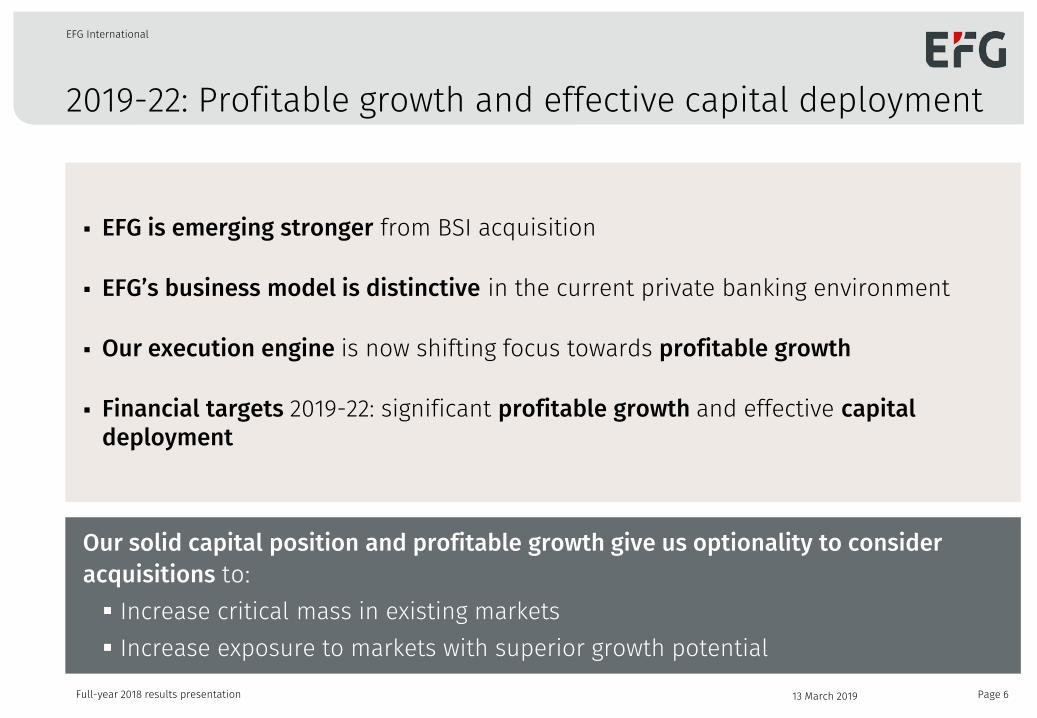
2019-22: Profitable growth and effective capital deployment
Page 6
EFG International
Full-year 2018 results presentation
EFG is emerging stronger from BSI acquisition
EFG’s business model is distinctive in the current private banking environment
Our execution engine is now shifting focus towards profitable growth
Financial targets 2019-22: significant profitable growth and effective capital deployment
Our solid capital position and profitable growth give us optionality to consider acquisitions to: Increase critical mass in existing markets Increase exposure to markets with superior growth potential
13 March 2019
Acquisition of majority stake in Shaw and Partners
Page 7 Full-year 2018 results presentation 13 March 2019
Giorgio Pradelli, Chief Executive Officer Dimitris Politis, Chief Financial Officer
Expansion of Asia Pacific footprint with entry into Australia
Page 8
EFG International
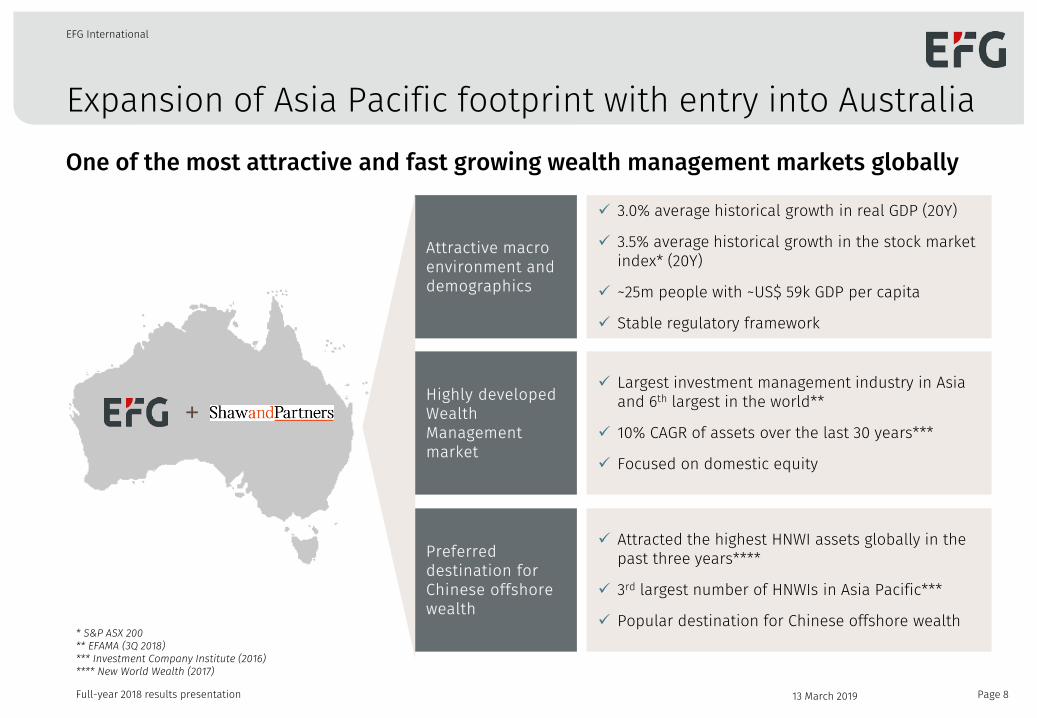
One of the most attractive and fast growing wealth management markets globally
* S&P ASX 200 ** EFAMA (3Q 2018) *** Investment Company Institute (2016) **** New World Wealth (2017)
Attractive macro environment and demographics
3.0% average historical growth in real GDP (20Y)
3.5% average historical growth in the stock market index* (20Y)
~25m people with ~US$ 59k GDP per capita
Stable regulatory framework
Preferred destination for Chinese offshore wealth
Attracted the highest HNWI assets globally in the past three years****
3rd largest number of HNWIs in Asia Pacific***
Popular destination for Chinese offshore wealth
Highly developed Wealth Management market
Largest investment management industry in Asia and 6th largest in the world**
10% CAGR of assets over the last 30 years***
Focused on domestic equity
+
Full-year 2018 results presentation 13 March 2019
Mutually beneficial partnership providing growth opportunities
Page 9
EFG International
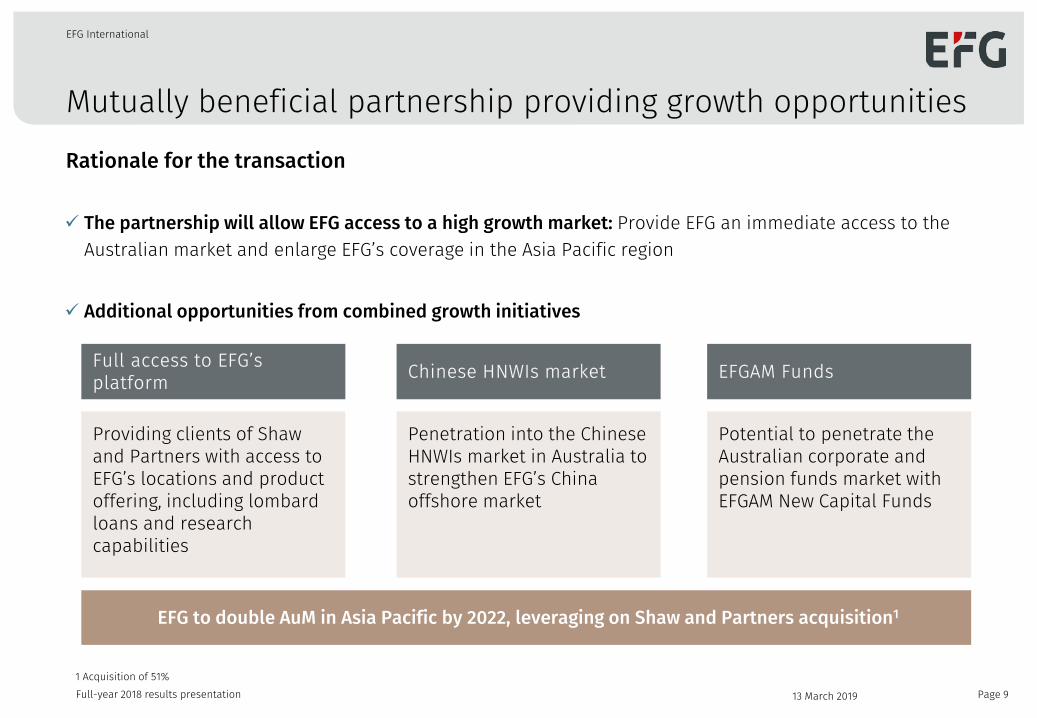
Rationale for the transaction
The partnership will allow EFG access to a high growth market: Provide EFG an immediate access to the Australian market and enlarge EFG’s coverage in the Asia Pacific region
Additional opportunities from combined growth initiatives
Chinese HNWIs market
Penetration into the Chinese HNWIs market in Australia to strengthen EFG’s China offshore market
EFGAM Funds
Potential to penetrate the Australian corporate and pension funds market with EFGAM New Capital Funds
Full access to EFG’s platform
Providing clients of Shaw and Partners with access to EFG’s locations and product offering, including lombard loans and research capabilities
Full-year 2018 results presentation 13 March 2019
EFG to double AuM in Asia Pacific by 2022, leveraging on Shaw and Partners acquisition1
1 Acquisition of 51%
Key metrics
Shaw and Partners
Page 10
EFG International
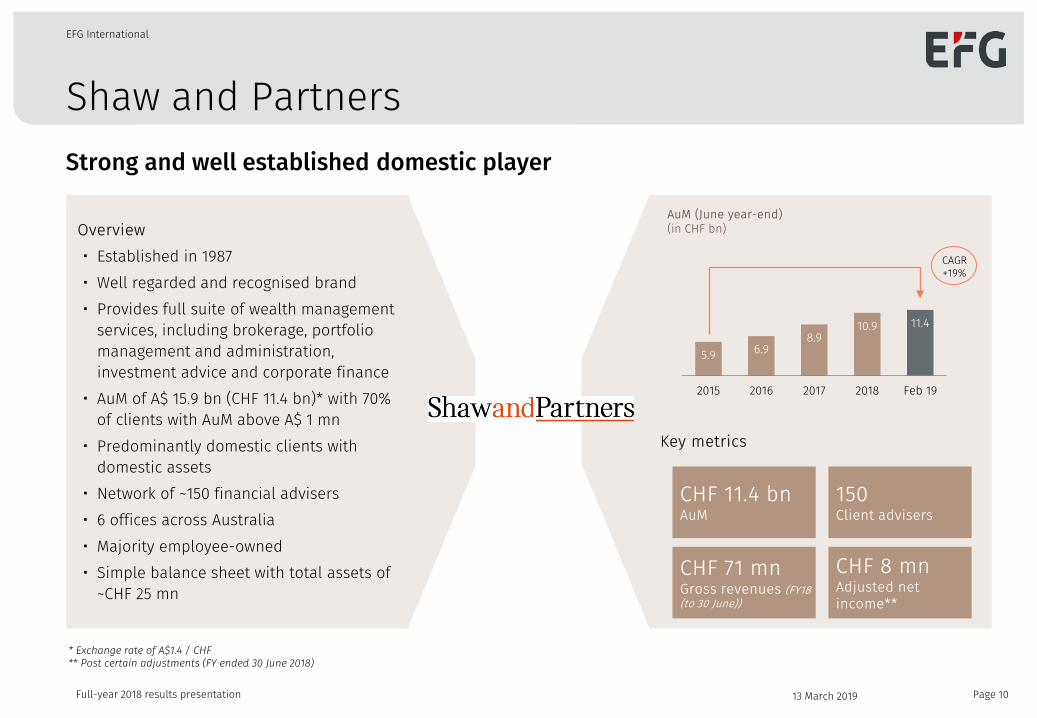
Strong and well established domestic player
* Exchange rate of A$1.4 / CHF ** Post certain adjustments (FY ended 30 June 2018)
Overview ・ Established in 1987 ・ Well regarded and recognised brand ・ Provides full suite of wealth management
services, including brokerage, portfolio management and administration, investment advice and corporate finance
・ AuM of A$ 15.9 bn (CHF 11.4 bn)* with 70% of clients with AuM above A$ 1 mn
・ Predominantly domestic clients with domestic assets
・ Network of ~150 financial advisers ・ 6 offices across Australia ・ Majority employee-owned ・ Simple balance sheet with total assets of
~CHF 25 mn
CHF 11.4 bn AuM
150 Client advisers
CHF 71 mn Gross revenues (FY18 (to 30 June))
CHF 8 mn Adjusted net income**
5.9 6.9 8.9
10.9 11.4
2015 2016 2017 2018 Feb 19
CAGR +19%
AuM (June year-end) (in CHF bn)
Full-year 2018 results presentation 13 March 2019
Transaction structure
Page 11
EFG International
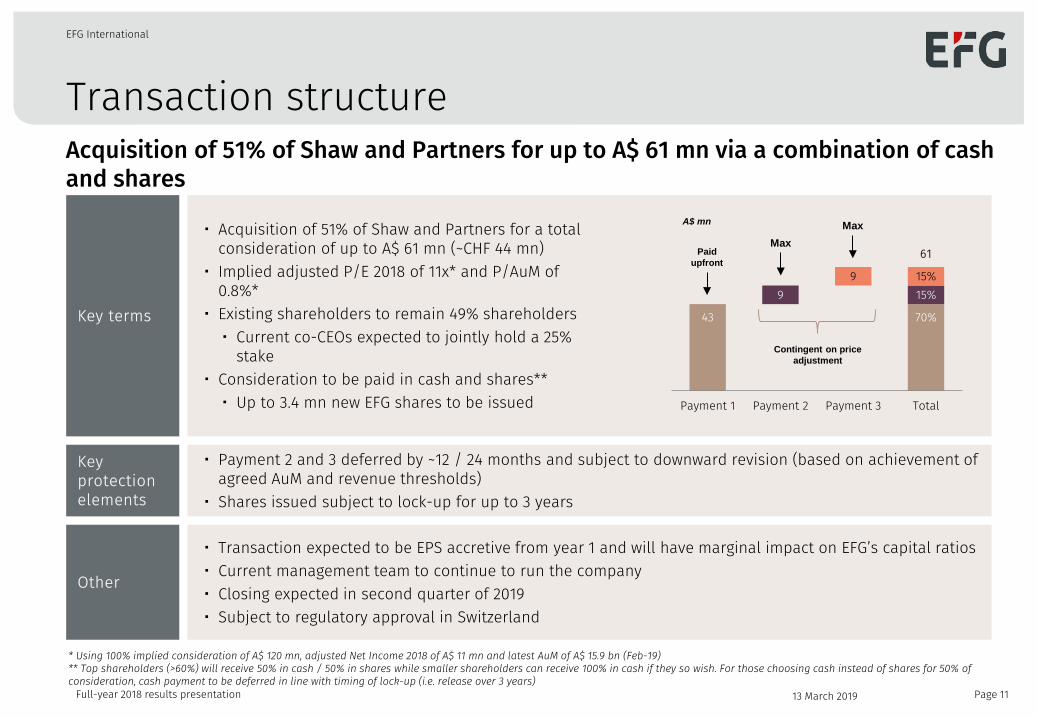
Acquisition of 51% of Shaw and Partners for up to A$ 61 mn via a combination of cash and shares
* Using 100% implied consideration of A$ 120 mn, adjusted Net Income 2018 of A$ 11 mn and latest AuM of A$ 15.9 bn (Feb-19) ** Top shareholders (>60%) will receive 50% in cash / 50% in shares while smaller shareholders can receive 100% in cash if they so wish. For those choosing cash instead of shares for 50% of consideration, cash payment to be deferred in line with timing of lock-up (i.e. release over 3 years)
Key terms
・ Acquisition of 51% of Shaw and Partners for a total consideration of up to A$ 61 mn (~CHF 44 mn)
・ Implied adjusted P/E 2018 of 11x* and P/AuM of 0.8%*
・ Existing shareholders to remain 49% shareholders ・ Current co-CEOs expected to jointly hold a 25%
stake ・ Consideration to be paid in cash and shares**
・ Up to 3.4 mn new EFG shares to be issued
Other
・ Transaction expected to be EPS accretive from year 1 and will have marginal impact on EFG’s capital ratios ・ Current management team to continue to run the company ・ Closing expected in second quarter of 2019 ・ Subject to regulatory approval in Switzerland
Key protection elements
・ Payment 2 and 3 deferred by ~12 / 24 months and subject to downward revision (based on achievement of agreed AuM and revenue thresholds)
・ Shares issued subject to lock-up for up to 3 years
43 70%
9 15% 9 15%
61
Payment 1 Payment 2 Payment 3 Total
Max Max
Contingent on price adjustment
Paid upfront
A$ mn
Full-year 2018 results presentation 13 March 2019
Financial performance Dimitris Politis, Chief Financial Officer
Page 12 Full-year 2018 results presentation 13 March 2019
FY 2018 financial results in perspective
Page 13
EFG International
Full-year 2018 results presentation
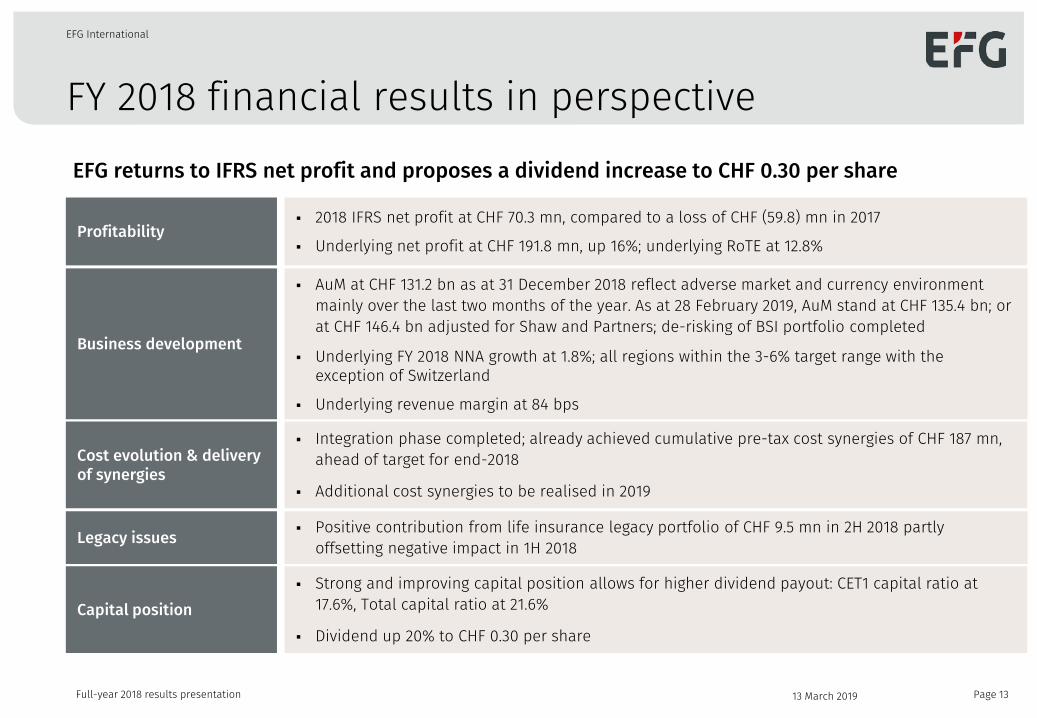
Profitability 2018 IFRS net profit at CHF 70.3 mn, compared to a loss of CHF (59.8) mn in 2017
Underlying net profit at CHF 191.8 mn, up 16%; underlying RoTE at 12.8%
Capital position
Strong and improving capital position allows for higher dividend payout: CET1 capital ratio at
17.6%, Total capital ratio at 21.6%
Dividend up 20% to CHF 0.30 per share
Integration phase completed; already achieved cumulative pre-tax cost synergies of CHF 187 mn,
ahead of target for end-2018
Additional cost synergies to be realised in 2019
Cost evolution & delivery of synergies
Business development
AuM at CHF 131.2 bn as at 31 December 2018 reflect adverse market and currency environment
mainly over the last two months of the year. As at 28 February 2019, AuM stand at CHF 135.4 bn; or at CHF 146.4 bn adjusted for Shaw and Partners; de-risking of BSI portfolio completed
Underlying FY 2018 NNA growth at 1.8%; all regions within the 3-6% target range with the exception of Switzerland
Underlying revenue margin at 84 bps
Legacy issues Positive contribution from life insurance legacy portfolio of CHF 9.5 mn in 2H 2018 partly offsetting negative impact in 1H 2018
EFG returns to IFRS net profit and proposes a dividend increase to CHF 0.30 per share
13 March 2019
Financials summary
Page 14
EFG International
Full-year 2018 results presentation
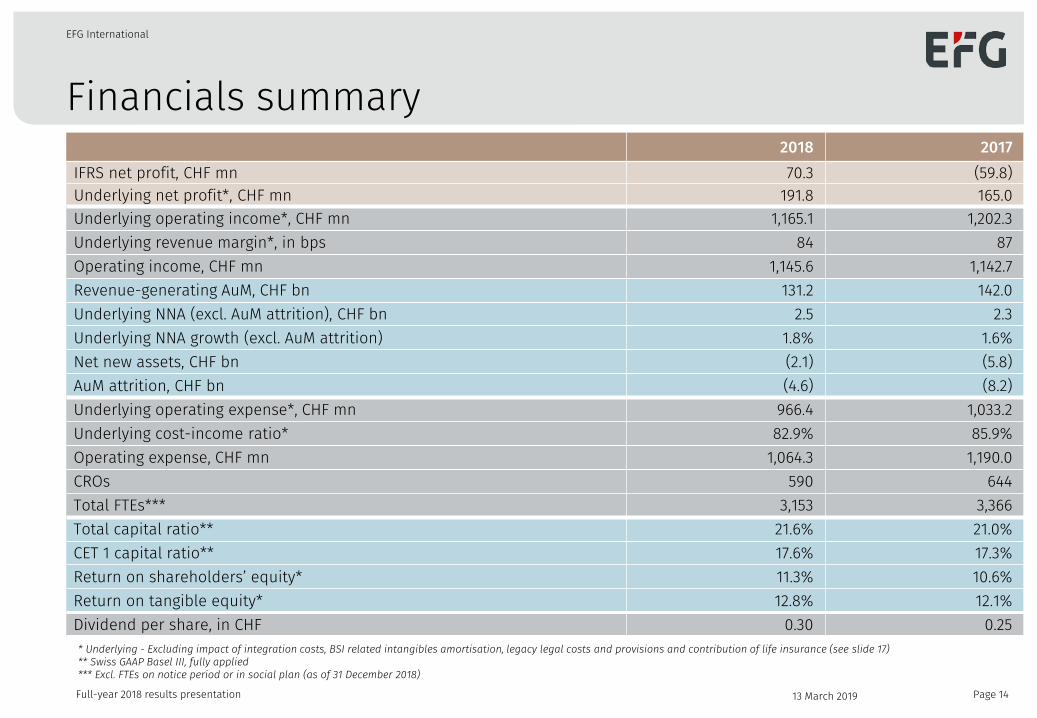
2018 2017 IFRS net profit, CHF mn 70.3 (59.8) Underlying net profit*, CHF mn 191.8 165.0 Underlying operating income*, CHF mn 1,165.1 1,202.3 Underlying revenue margin*, in bps 84 87 Operating income, CHF mn 1,145.6 1,142.7 Revenue-generating AuM, CHF bn 131.2 142.0 Underlying NNA (excl. AuM attrition), CHF bn 2.5 2.3 Underlying NNA growth (excl. AuM attrition) 1.8% 1.6% Net new assets, CHF bn (2.1) (5.8) AuM attrition, CHF bn (4.6) (8.2) Underlying operating expense*, CHF mn 966.4 1,033.2 Underlying cost-income ratio* 82.9% 85.9% Operating expense, CHF mn 1,064.3 1,190.0 CROs 590 644 Total FTEs*** 3,153 3,366 Total capital ratio** 21.6% 21.0% CET 1 capital ratio** 17.6% 17.3% Return on shareholders’ equity* 11.3% 10.6% Return on tangible equity* 12.8% 12.1% Dividend per share, in CHF 0.30 0.25 * Underlying - Excluding impact of integration costs, BSI related intangibles amortisation, legacy legal costs and provisions and contribution of life insurance (see slide 17) ** Swiss GAAP Basel III, fully applied *** Excl. FTEs on notice period or in social plan (as of 31 December 2018)
13 March 2019
84 87 84
2016 2017 2018
Results highlights (I)
Page 15
EFG International
Full-year 2018 results presentation
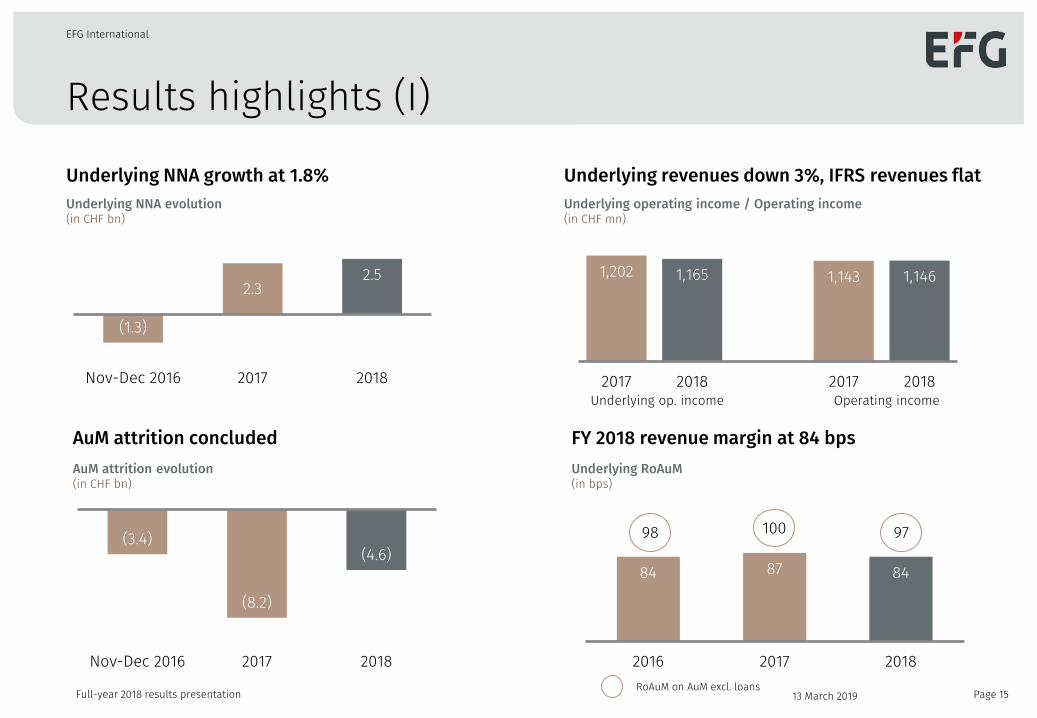
(1.3)
2.3 2.5
Nov-Dec 2016 2017 2018
Underlying NNA evolution (in CHF bn)
Underlying NNA growth at 1.8%
AuM attrition concluded FY 2018 revenue margin at 84 bps Underlying RoAuM (in bps)
AuM attrition evolution (in CHF bn)
RoAuM on AuM excl. loans
Underlying revenues down 3%, IFRS revenues flat Underlying operating income / Operating income (in CHF mn)
1,202 1,165 1,143 1,146
2017 2018 2017 2018
98 100 97 (3.4)
(8.2)
(4.6)
Nov-Dec 2016 2017 2018
Operating income Underlying op. income
13 March 2019
Results highlights (II)
Page 16
EFG International
Full-year 2018 results presentation
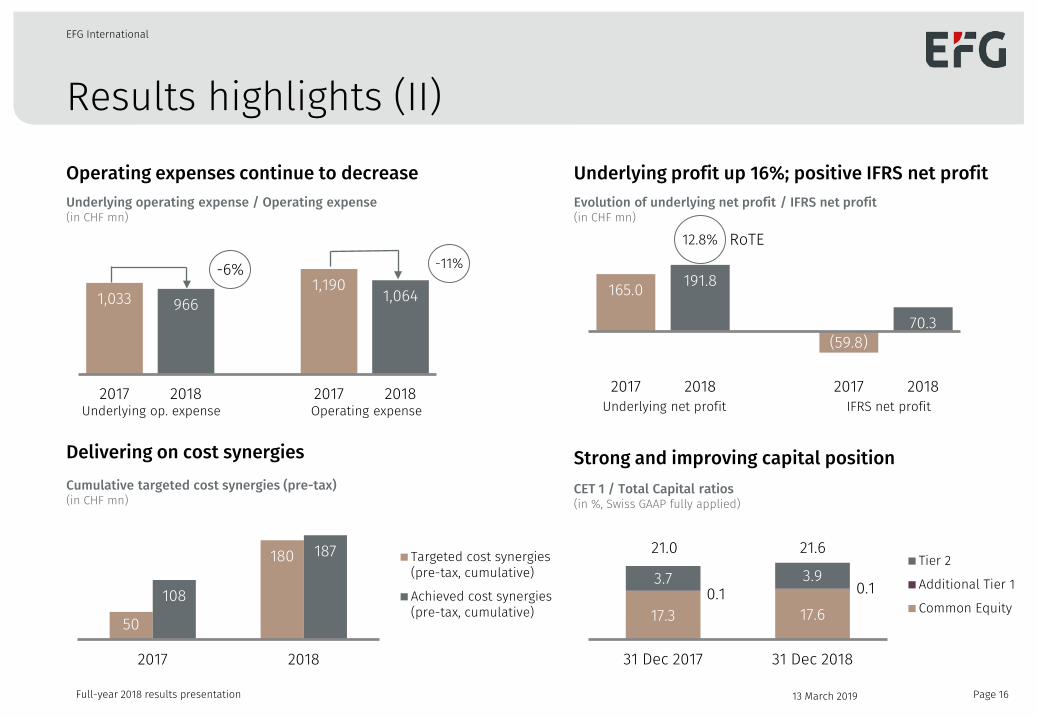
Underlying operating expense / Operating expense (in CHF mn)
Operating expenses continue to decrease
Delivering on cost synergies Strong and improving capital position CET 1 / Total Capital ratios (in %, Swiss GAAP fully applied)
17.3 17.6 0.1
3.7 3.9
31 Dec 2017 31 Dec 2018
Tier 2
Additional Tier 1
Common Equity
21.0 21.6
Cumulative targeted cost synergies (pre-tax) (in CHF mn)
0.1
Evolution of underlying net profit / IFRS net profit (in CHF mn)
Underlying profit up 16%; positive IFRS net profit
50
180
108
187
2017 2018
Targeted cost synergies(pre-tax, cumulative)
Achieved cost synergies(pre-tax, cumulative)
165.0 191.8
(59.8) 70.3
2017 2018 2017 2018
RoTE 12.8%
1,033 966 1,190
1,064
2017 2018 2017 2018
-6% -11%
Operating expense Underlying op. expense IFRS net profit Underlying net profit
13 March 2019
Results highlights (III)
Page 17
EFG International
Full-year 2018 results presentation
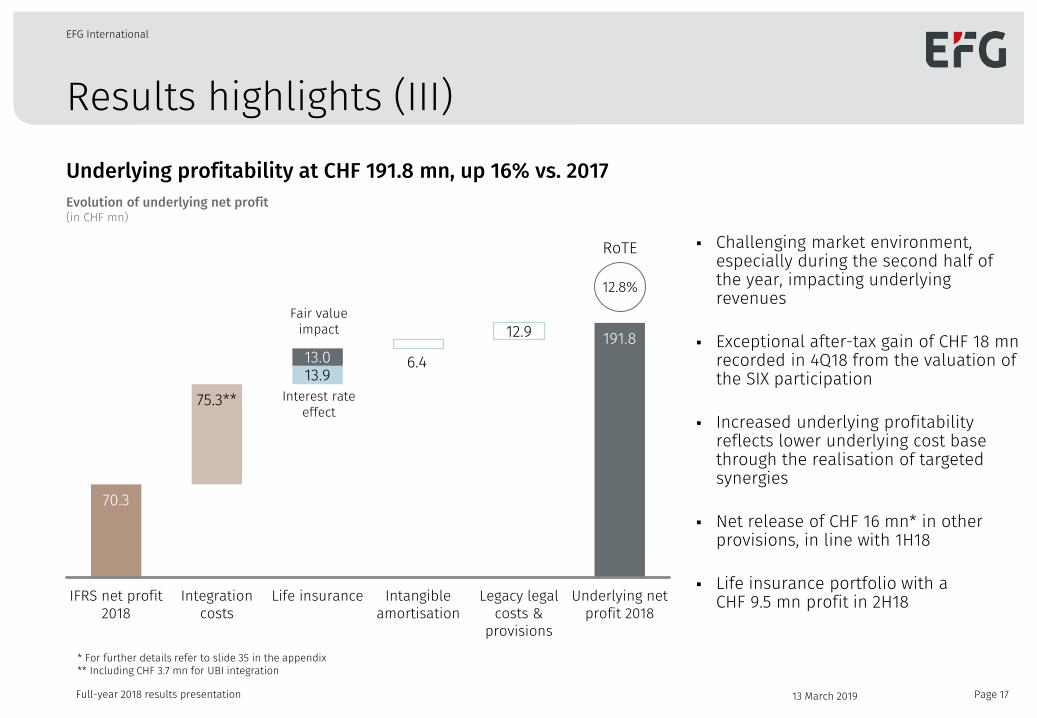
Evolution of underlying net profit (in CHF mn)
Underlying profitability at CHF 191.8 mn, up 16% vs. 2017
Challenging market environment, especially during the second half of the year, impacting underlying revenues
Exceptional after-tax gain of CHF 18 mn recorded in 4Q18 from the valuation of the SIX participation
Increased underlying profitability reflects lower underlying cost base through the realisation of targeted synergies
Net release of CHF 16 mn* in other provisions, in line with 1H18
Life insurance portfolio with a CHF 9.5 mn profit in 2H18
70.3
191.8
75.3** 13.9
6.4
12.9 13.0
IFRS net profit2018
Integrationcosts
Life insurance Intangibleamortisation
Legacy legalcosts &
provisions
Underlying netprofit 2018
* For further details refer to slide 35 in the appendix ** Including CHF 3.7 mn for UBI integration
[13.1]%
Fair value impact
Interest rate effect
RoTE
12.8%
13 March 2019
Revenue-generating AuM development
Page 18
EFG International
Full-year 2018 results presentation
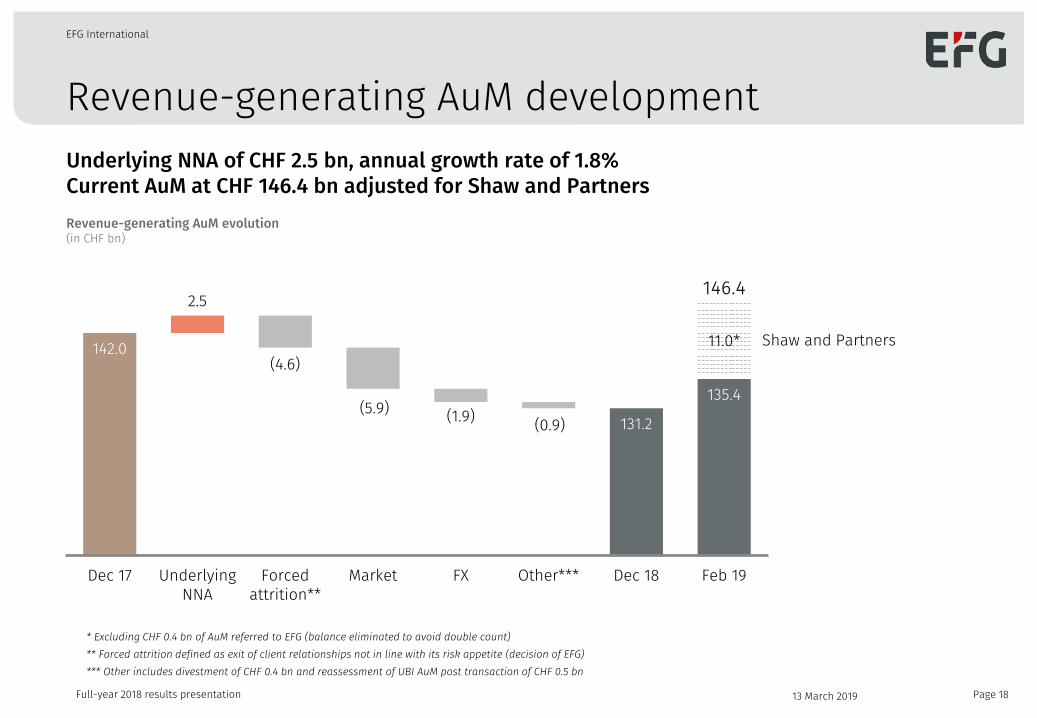
Underlying NNA of CHF 2.5 bn, annual growth rate of 1.8% Current AuM at CHF 146.4 bn adjusted for Shaw and Partners Revenue-generating AuM evolution (in CHF bn)
142.0
131.2
135.4
2.5
(4.6)
(5.9) (1.9) (0.9)
11.0*
Dec 17 UnderlyingNNA
Forcedattrition**
Market FX Other*** Dec 18 Feb 19
** Forced attrition defined as exit of client relationships not in line with its risk appetite (decision of EFG) *** Other includes divestment of CHF 0.4 bn and reassessment of UBI AuM post transaction of CHF 0.5 bn
146.4
Shaw and Partners
13 March 2019
* Excluding CHF 0.4 bn of AuM referred to EFG (balance eliminated to avoid double count)
Evolution of NNA & AuM attrition
Page 19
EFG International
Full-year 2018 results presentation
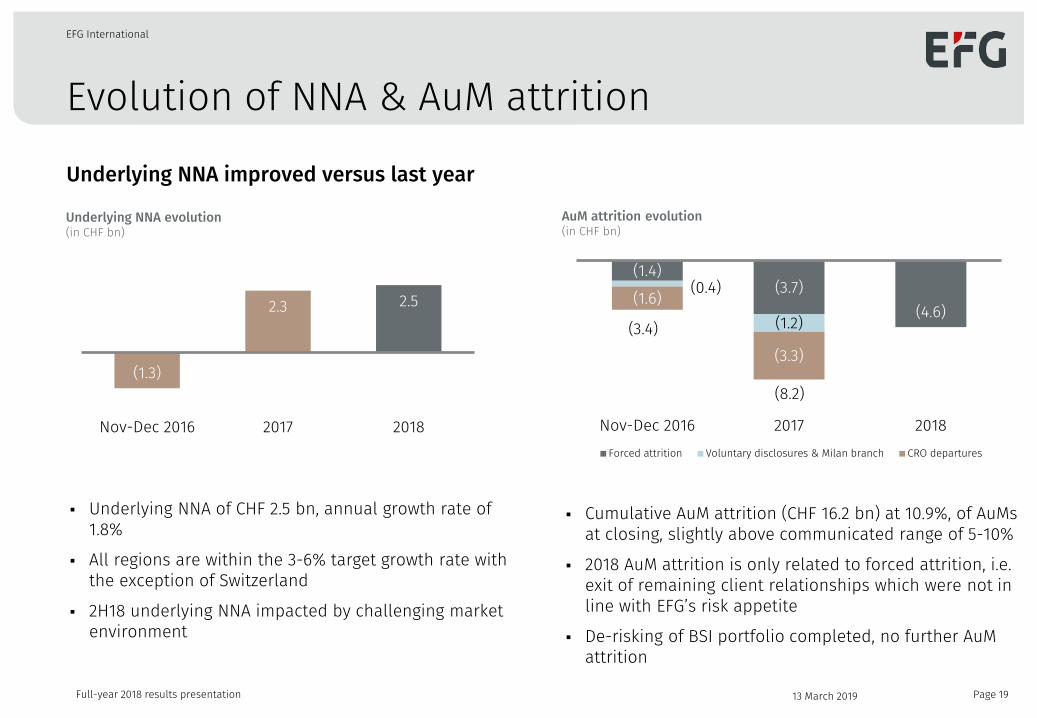
Underlying NNA evolution (in CHF bn)
Underlying NNA of CHF 2.5 bn, annual growth rate of 1.8%
All regions are within the 3-6% target growth rate with the exception of Switzerland
2H18 underlying NNA impacted by challenging market environment
AuM attrition evolution (in CHF bn)
Underlying NNA improved versus last year
(1.4) (3.7)
(4.6) (0.4)
(1.2) (1.6)
(3.3)
Nov-Dec 2016 2017 2018Forced attrition Voluntary disclosures & Milan branch CRO departures
(1.3)
2.3 2.5
Nov-Dec 2016 2017 2018
Cumulative AuM attrition (CHF 16.2 bn) at 10.9%, of AuMs at closing, slightly above communicated range of 5-10%
2018 AuM attrition is only related to forced attrition, i.e. exit of remaining client relationships which were not in line with EFG’s risk appetite
De-risking of BSI portfolio completed, no further AuM attrition
(3.4)
(8.2)
13 March 2019
Business development by region
Page 20
EFG International
Full-year 2018 results presentation
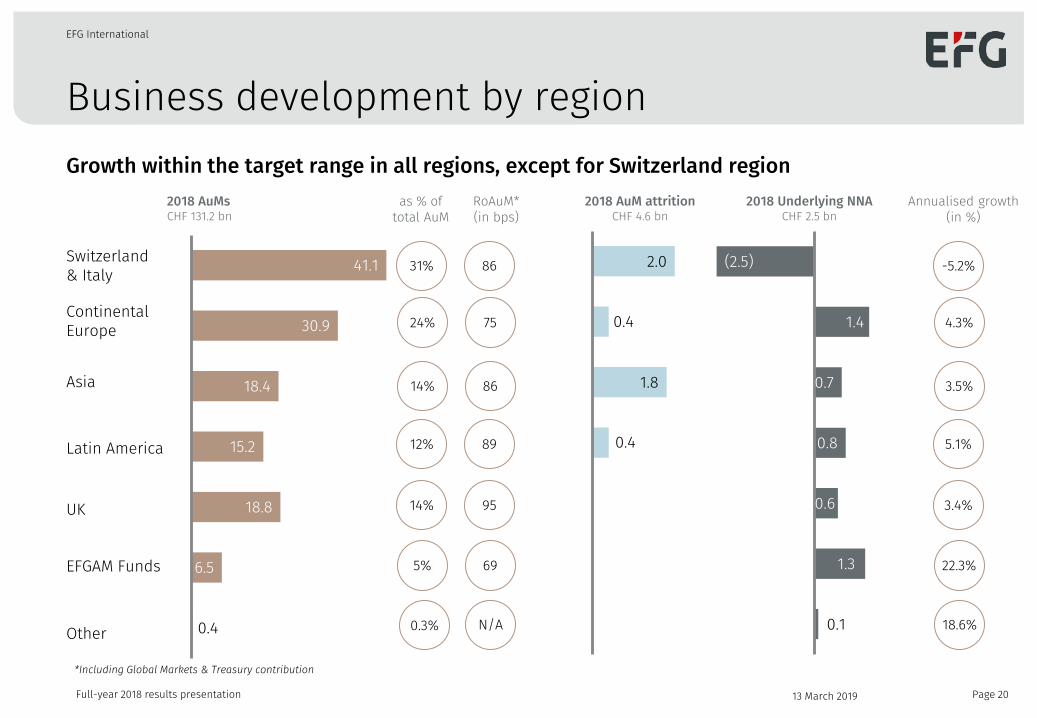
2018 AuMs CHF 131.2 bn
2018 AuM attrition CHF 4.6 bn
Continental Europe
Asia
Latin America UK
Switzerland & Italy
Other
Growth within the target range in all regions, except for Switzerland region as % of
total AuM RoAuM* (in bps)
2018 Underlying NNA CHF 2.5 bn
EFGAM Funds
*Including Global Markets & Treasury contribution
0.4
6.5
18.8
15.2
18.4
30.9
41.1
1.8
2.0
0.1
1.3
0.6
0.8
0.7
1.4
(2.5)
0.4
0.4
Annualised growth (in %)
0.3% N/A
69 5%
95 14%
89 12%
86 14%
75 24%
86 31%
18.6%
22.3%
3.4%
5.1%
3.5%
4.3%
-5.2%
13 March 2019
Evolution of mandates penetration
Page 21
EFG International
Full-year 2018 results presentation
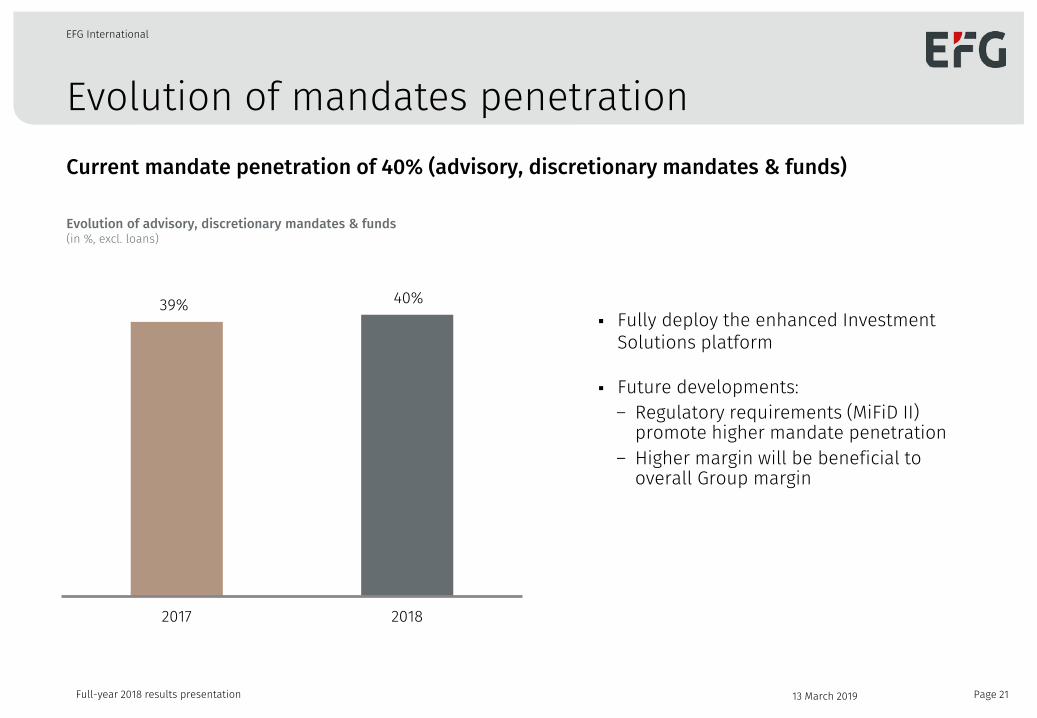
Evolution of advisory, discretionary mandates & funds (in %, excl. loans)
Fully deploy the enhanced Investment Solutions platform
Future developments:
― Regulatory requirements (MiFiD II) promote higher mandate penetration
― Higher margin will be beneficial to overall Group margin
Current mandate penetration of 40% (advisory, discretionary mandates & funds)
39% 40%
2017 2018
13 March 2019
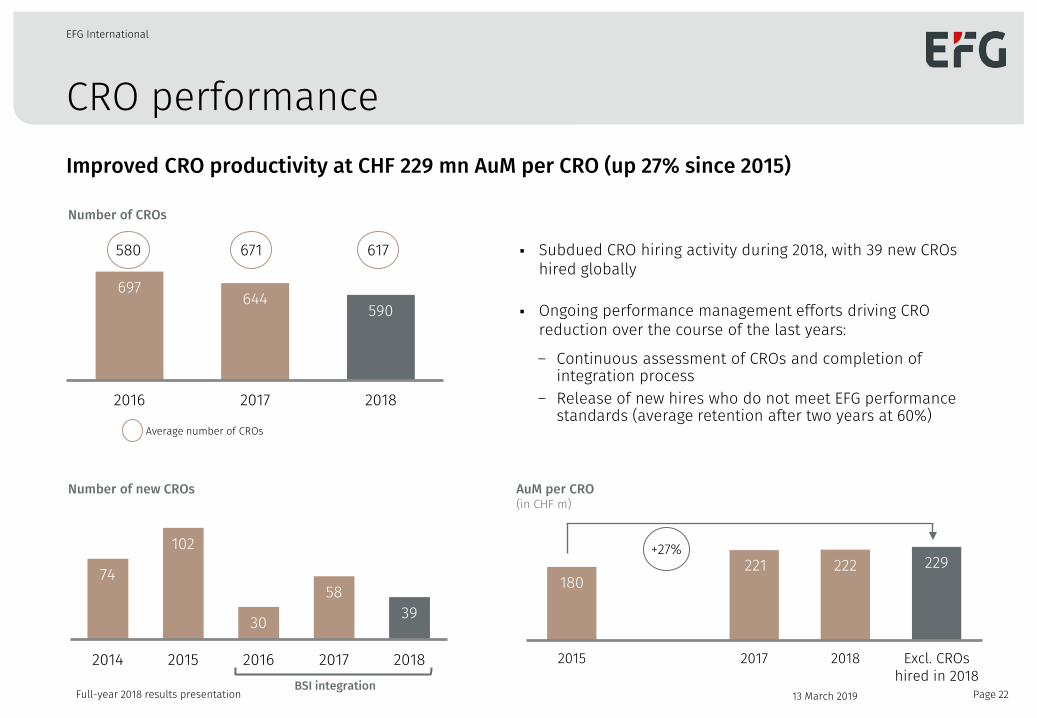
74
102
30
58 39
2014 2015 2016 2017 2018
CRO performance
Page 22
EFG International
Full-year 2018 results presentation
697 644
590
2016 2017 2018
Improved CRO productivity at CHF 229 mn AuM per CRO (up 27% since 2015)
Number of CROs
AuM per CRO (in CHF m)
Average number of CROs
Number of new CROs
Subdued CRO hiring activity during 2018, with 39 new CROs hired globally
Ongoing performance management efforts driving CRO reduction over the course of the last years:
― Continuous assessment of CROs and completion of integration process
― Release of new hires who do not meet EFG performance standards (average retention after two years at 60%)
580 671 617
180 221 222 229
2015 2017 2018 Excl. CROshired in 2018
+27%
BSI integration 13 March 2019
Underlying operating income
Page 23
EFG International
Full-year 2018 results presentation
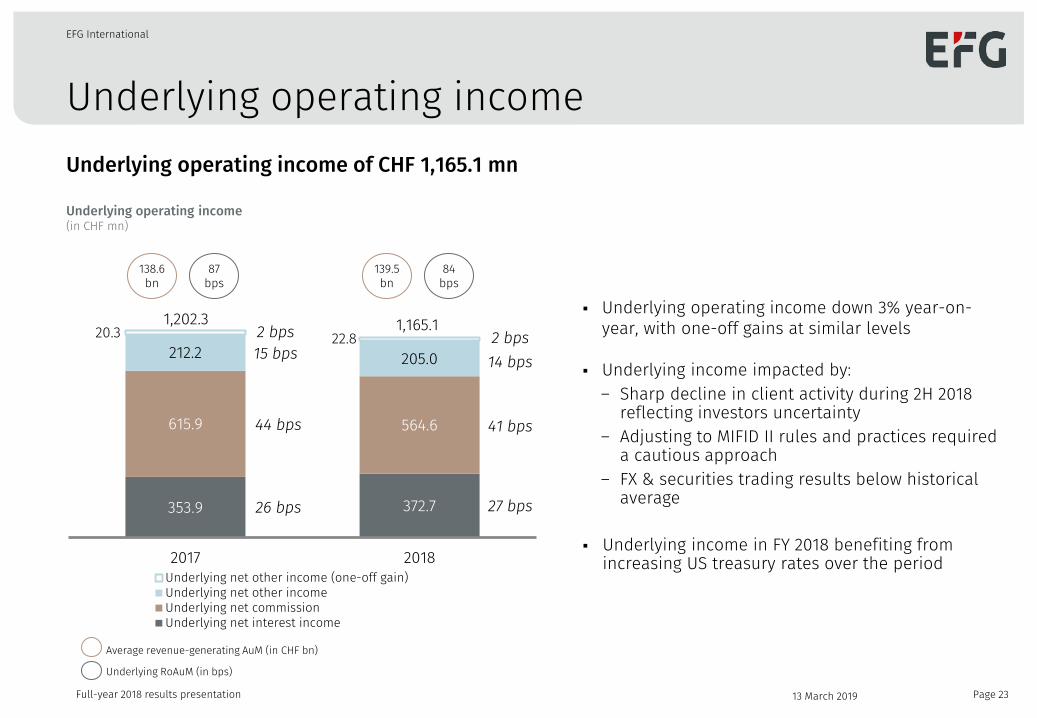
Underlying operating income of CHF 1,165.1 mn
Underlying operating income down 3% year-on-year, with one-off gains at similar levels
Underlying income impacted by: ― Sharp decline in client activity during 2H 2018
reflecting investors uncertainty ― Adjusting to MIFID II rules and practices required
a cautious approach ― FX & securities trading results below historical
average
Underlying income in FY 2018 benefiting from increasing US treasury rates over the period
353.9 372.7
615.9 564.6
212.2 205.0
2017 2018Underlying net other income (one-off gain)Underlying net other incomeUnderlying net commissionUnderlying net interest income
Underlying operating income (in CHF mn)
1,165.1 1,202.3
Average revenue-generating AuM (in CHF bn)
Underlying RoAuM (in bps)
26 bps
44 bps
15 bps
27 bps
41 bps
14 bps
138.6 bn
87 bps
139.5 bn
84 bps
13 March 2019
20.3 22.8 2 bps 2 bps
Underlying operating expenses
Page 24
EFG International
Full-year 2018 results presentation
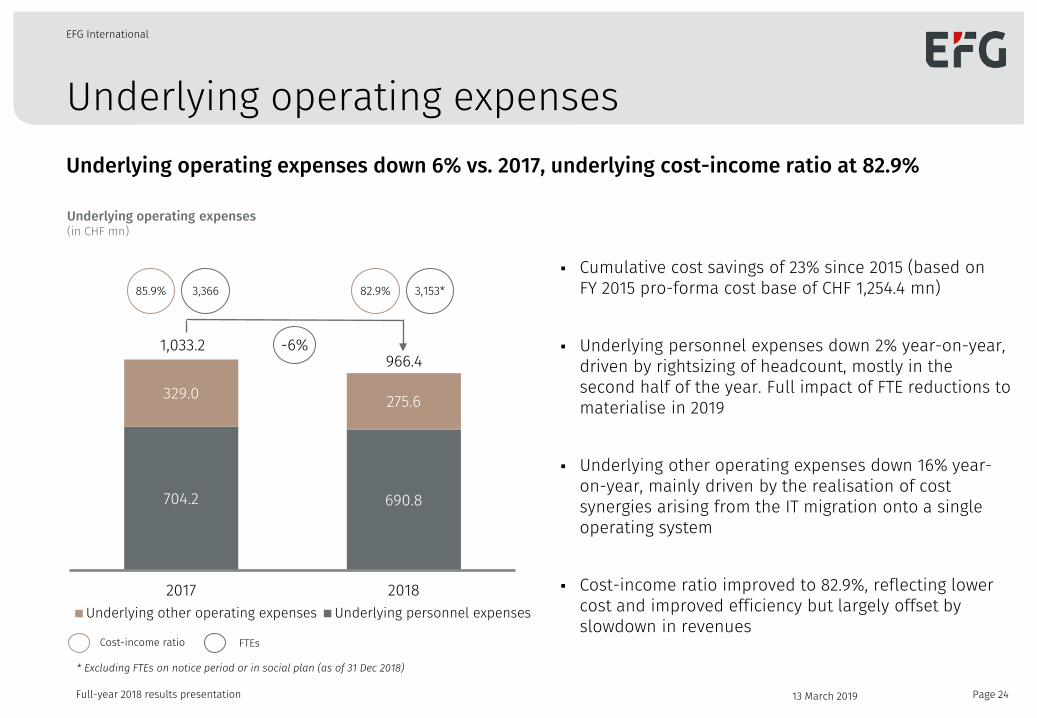
Underlying operating expenses down 6% vs. 2017, underlying cost-income ratio at 82.9%
704.2 690.8
329.0 275.6
2017 2018Underlying other operating expenses Underlying personnel expenses
Underlying operating expenses (in CHF mn)
Cost-income ratio
1,033.2
Cumulative cost savings of 23% since 2015 (based on FY 2015 pro-forma cost base of CHF 1,254.4 mn)
Underlying personnel expenses down 2% year-on-year,
driven by rightsizing of headcount, mostly in the second half of the year. Full impact of FTE reductions to materialise in 2019
Underlying other operating expenses down 16% year-
on-year, mainly driven by the realisation of cost synergies arising from the IT migration onto a single operating system
Cost-income ratio improved to 82.9%, reflecting lower
cost and improved efficiency but largely offset by slowdown in revenues
966.4
FTEs
* Excluding FTEs on notice period or in social plan (as of 31 Dec 2018)
-6%
85.9% 3,366 82.9% 3,153*
13 March 2019
Update on cost synergies from BSI transaction
Page 25
EFG International
Full-year 2018 results presentation
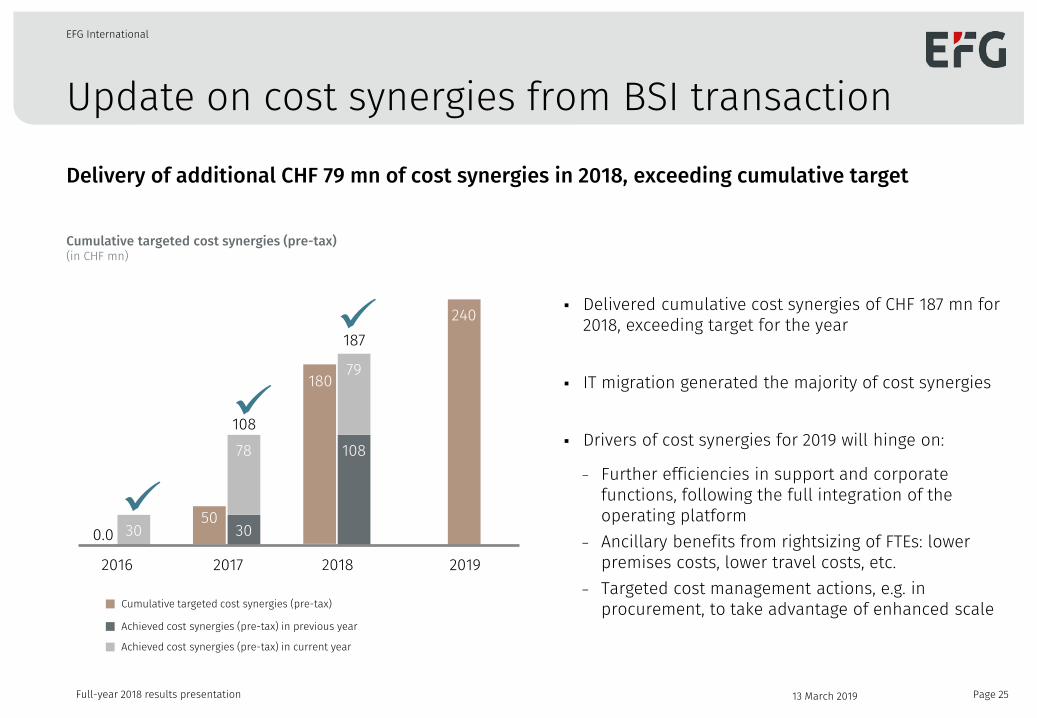
Delivery of additional CHF 79 mn of cost synergies in 2018, exceeding cumulative target
Cumulative targeted cost synergies (pre-tax) (in CHF mn)
Delivered cumulative cost synergies of CHF 187 mn for 2018, exceeding target for the year
IT migration generated the majority of cost synergies Drivers of cost synergies for 2019 will hinge on:
― Further efficiencies in support and corporate functions, following the full integration of the operating platform
― Ancillary benefits from rightsizing of FTEs: lower premises costs, lower travel costs, etc.
― Targeted cost management actions, e.g. in procurement, to take advantage of enhanced scale Cumulative targeted cost synergies (pre-tax)
Achieved cost synergies (pre-tax) in previous year
30 30
108
240
78
79
2017 2019
50
108
Achieved cost synergies (pre-tax) in current year
2018
180
187
2016
0.0
13 March 2019
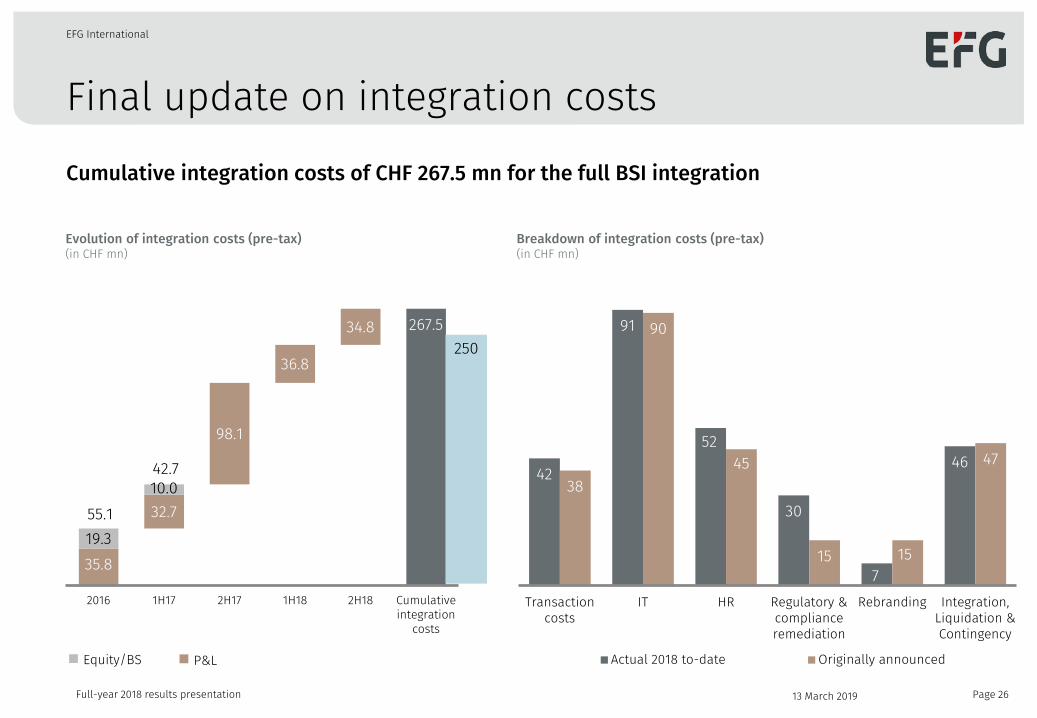
35.8
267.5
19.3 32.7 10.0
98.1
36.8
34.8
2016 1H17 2H17 1H18 2H18 Cumulativeintegration
costs
250
Final update on integration costs
Page 26
EFG International
Full-year 2018 results presentation
Cumulative integration costs of CHF 267.5 mn for the full BSI integration
Evolution of integration costs (pre-tax) (in CHF mn)
P&L Equity/BS
55.1
42.7
42
91
52
30
7
46 38
90
45
15 15
47
Transactioncosts
IT HR Regulatory &complianceremediation
Rebranding Integration,Liquidation &Contingency
Actual 2018 to-date Originally announced
Breakdown of integration costs (pre-tax) (in CHF mn)
13 March 2019
Balance sheet
Page 27
EFG International
Full-year 2018 results presentation
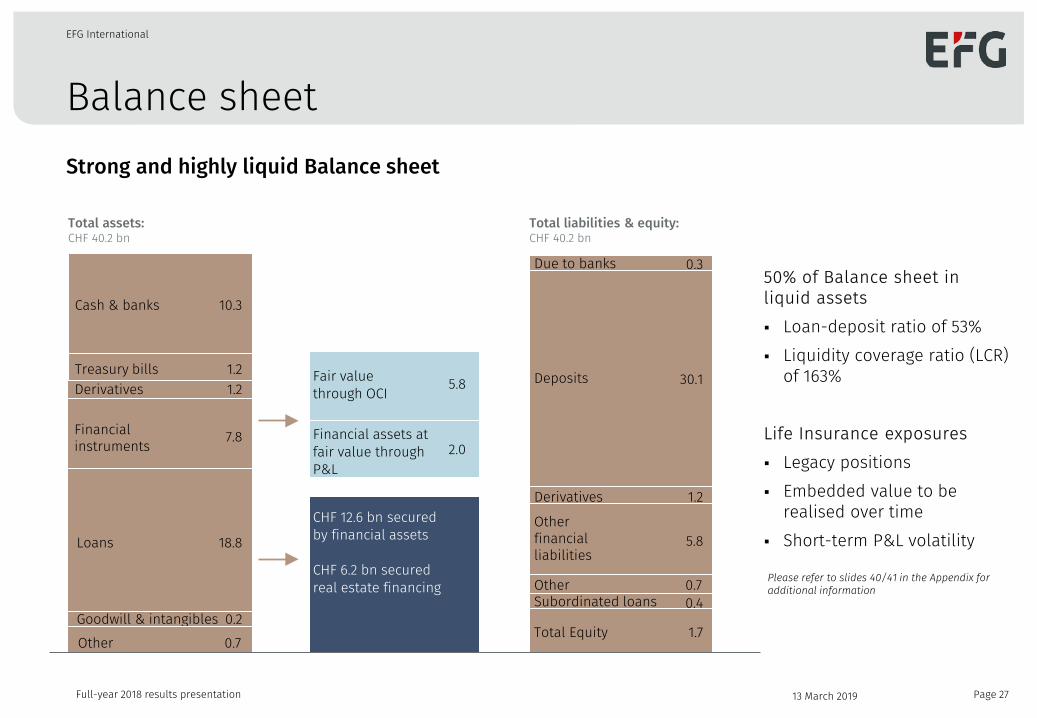
Strong and highly liquid Balance sheet
Total assets: CHF 40.2 bn
50% of Balance sheet in liquid assets Loan-deposit ratio of 53% Liquidity coverage ratio (LCR)
of 163%
Life Insurance exposures
Legacy positions Embedded value to be
realised over time Short-term P&L volatility
Total liabilities & equity: CHF 40.2 bn
Cash & banks 10.3
Treasury bills 1.2 1.2 Derivatives
7.8 Financial instruments
18.8 Loans
0.2 Goodwill & intangibles 0.7 Other
5.8
Derivatives 1.2
30.1
0.3 Due to banks
Deposits
Other financial liabilities
1.7 Total Equity
0.7 Other
CHF 12.6 bn secured by financial assets CHF 6.2 bn secured real estate financing
Fair value through OCI 5.8
2.0 Financial assets at fair value through P&L
0.4 Subordinated loans
13 March 2019
Please refer to slides 40/41 in the Appendix for additional information
Capital position (I)
Page 28
EFG International
Full-year 2018 results presentation
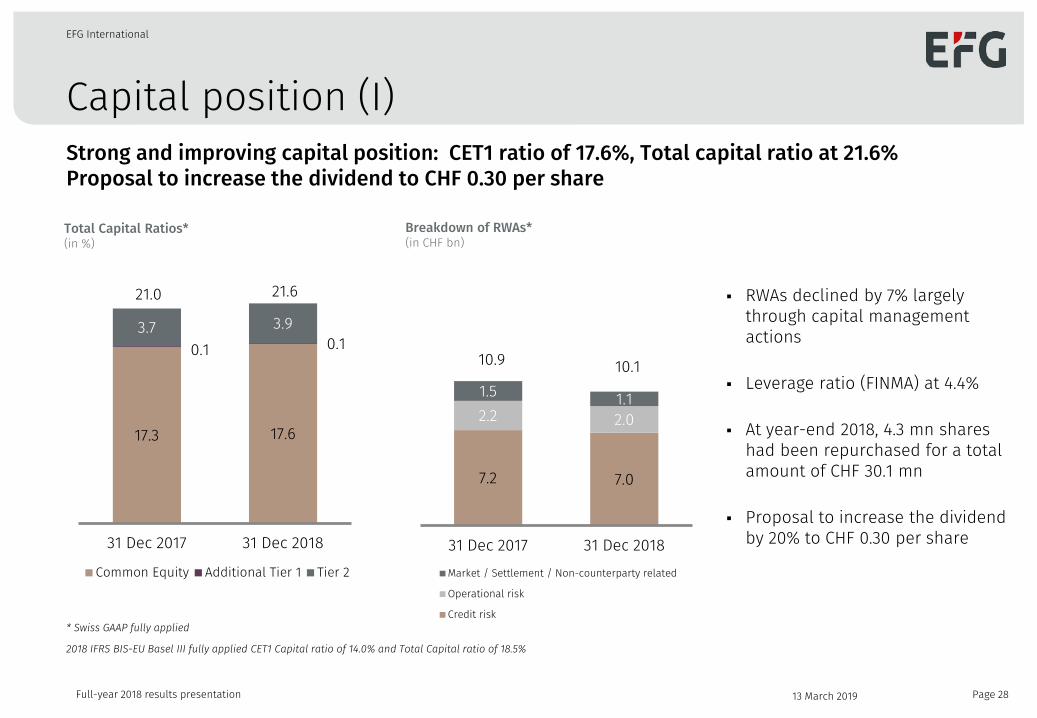
Strong and improving capital position: CET1 ratio of 17.6%, Total capital ratio at 21.6% Proposal to increase the dividend to CHF 0.30 per share
Total Capital Ratios* (in %)
Breakdown of RWAs* (in CHF bn)
RWAs declined by 7% largely through capital management actions
Leverage ratio (FINMA) at 4.4%
At year-end 2018, 4.3 mn shares had been repurchased for a total amount of CHF 30.1 mn
Proposal to increase the dividend by 20% to CHF 0.30 per share
7.2 7.0
2.2 2.0
1.5 1.1
31 Dec 2017 31 Dec 2018Market / Settlement / Non-counterparty related
Operational risk
Credit risk
17.3 17.6
0.1 0.1 3.7 3.9
31 Dec 2017 31 Dec 2018
Common Equity Additional Tier 1 Tier 2
21.0 21.6
2018 IFRS BIS-EU Basel III fully applied CET1 Capital ratio of 14.0% and Total Capital ratio of 18.5%
* Swiss GAAP fully applied
10.9 10.1
13 March 2019
Capital position (II)
Page 29
EFG International
Full-year 2018 results presentation
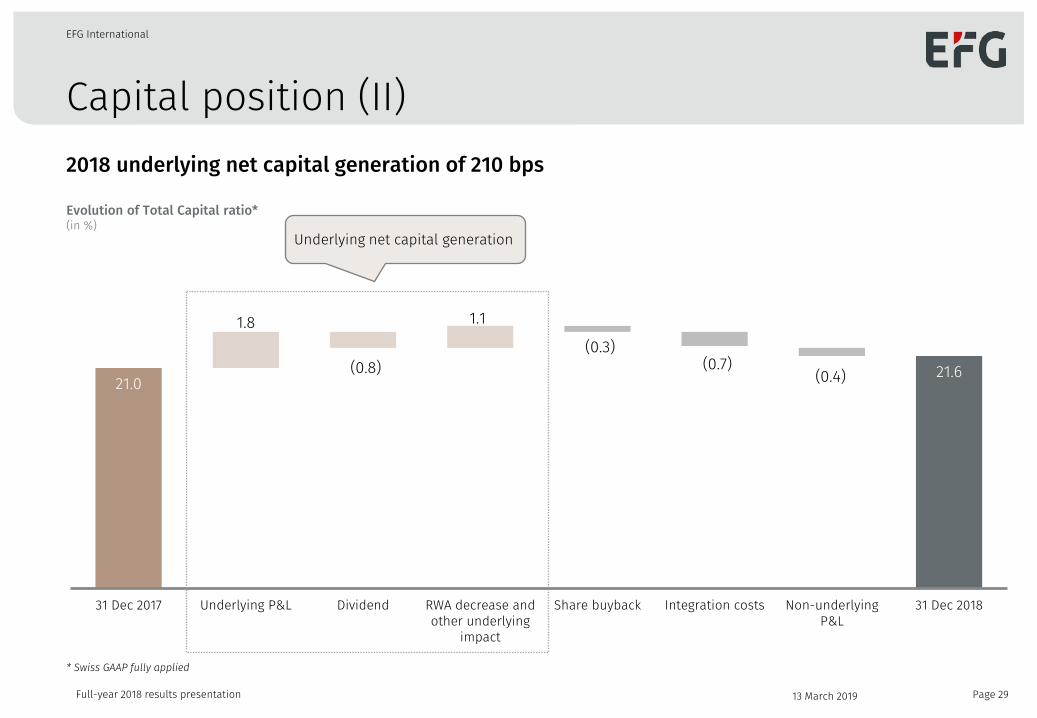
2018 underlying net capital generation of 210 bps
21.0 21.6 21.6
1.8
(0.8)
1.1
(0.3) (0.7)
(0.4)
31 Dec 2017 Underlying P&L Dividend RWA decrease andother underlying
impact
Share buyback Integration costs Non-underlyingP&L
31 Dec 2018
* Swiss GAAP fully applied
Underlying net capital generation
Evolution of Total Capital ratio* (in %)
13 March 2019
Page 30
EFG International
Full-year 2018 results presentation 13 March 2019
Appendix
Page 31 Full-year 2018 results presentation 13 March 2019
Income statement (IFRS)
Page 32
EFG International
Full-year 2018 results presentation
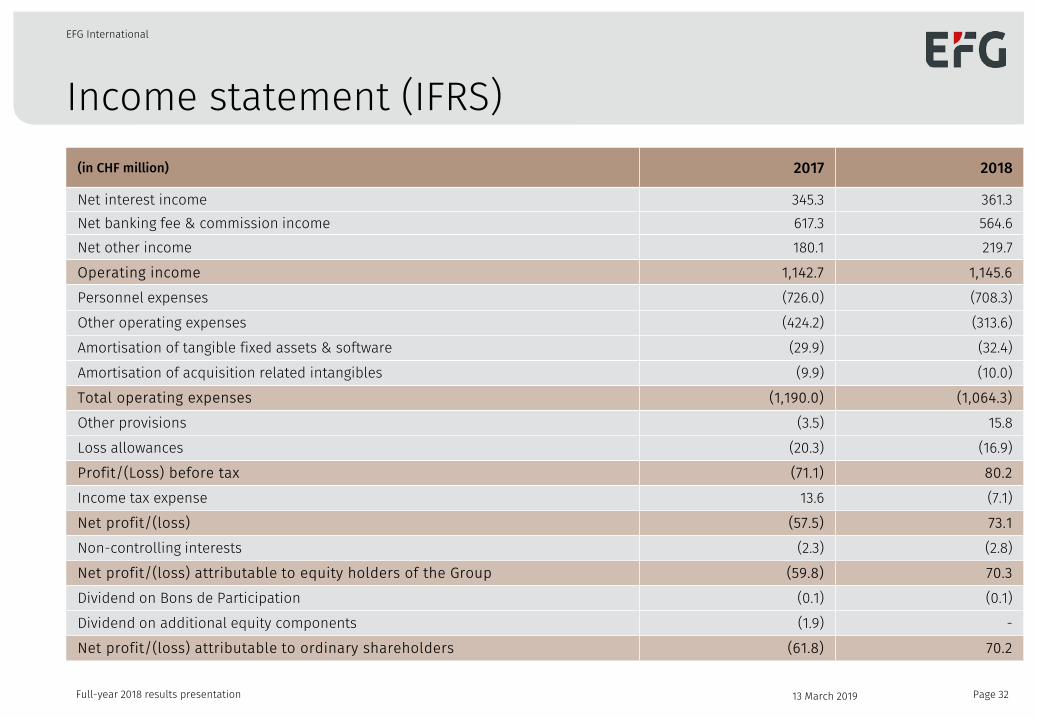
(in CHF million) 2017 2018
Net interest income 345.3 361.3 Net banking fee & commission income 617.3 564.6 Net other income 180.1 219.7 Operating income 1,142.7 1,145.6 Personnel expenses (726.0) (708.3) Other operating expenses (424.2) (313.6) Amortisation of tangible fixed assets & software (29.9) (32.4) Amortisation of acquisition related intangibles (9.9) (10.0) Total operating expenses (1,190.0) (1,064.3) Other provisions (3.5) 15.8 Loss allowances (20.3) (16.9) Profit/(Loss) before tax (71.1) 80.2 Income tax expense 13.6 (7.1) Net profit/(loss) (57.5) 73.1 Non-controlling interests (2.3) (2.8) Net profit/(loss) attributable to equity holders of the Group (59.8) 70.3 Dividend on Bons de Participation (0.1) (0.1) Dividend on additional equity components (1.9) - Net profit/(loss) attributable to ordinary shareholders (61.8) 70.2
13 March 2019
Income statement (IFRS)
Page 33
EFG International
Full-year 2018 results presentation
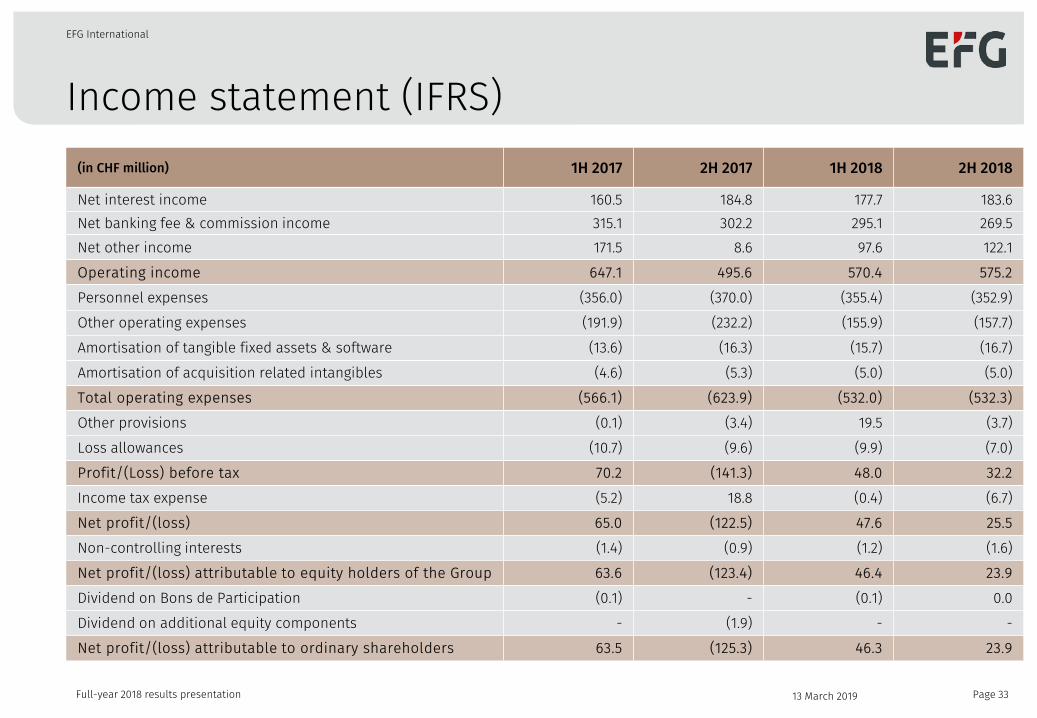
(in CHF million) 1H 2017 2H 2017 1H 2018 2H 2018
Net interest income 160.5 184.8 177.7 183.6 Net banking fee & commission income 315.1 302.2 295.1 269.5 Net other income 171.5 8.6 97.6 122.1 Operating income 647.1 495.6 570.4 575.2 Personnel expenses (356.0) (370.0) (355.4) (352.9) Other operating expenses (191.9) (232.2) (155.9) (157.7) Amortisation of tangible fixed assets & software (13.6) (16.3) (15.7) (16.7) Amortisation of acquisition related intangibles (4.6) (5.3) (5.0) (5.0) Total operating expenses (566.1) (623.9) (532.0) (532.3) Other provisions (0.1) (3.4) 19.5 (3.7) Loss allowances (10.7) (9.6) (9.9) (7.0) Profit/(Loss) before tax 70.2 (141.3) 48.0 32.2 Income tax expense (5.2) 18.8 (0.4) (6.7) Net profit/(loss) 65.0 (122.5) 47.6 25.5 Non-controlling interests (1.4) (0.9) (1.2) (1.6) Net profit/(loss) attributable to equity holders of the Group 63.6 (123.4) 46.4 23.9 Dividend on Bons de Participation (0.1) - (0.1) 0.0 Dividend on additional equity components - (1.9) - - Net profit/(loss) attributable to ordinary shareholders 63.5 (125.3) 46.3 23.9
13 March 2019
Underlying income statement
Page 34
EFG International
Full-year 2018 results presentation
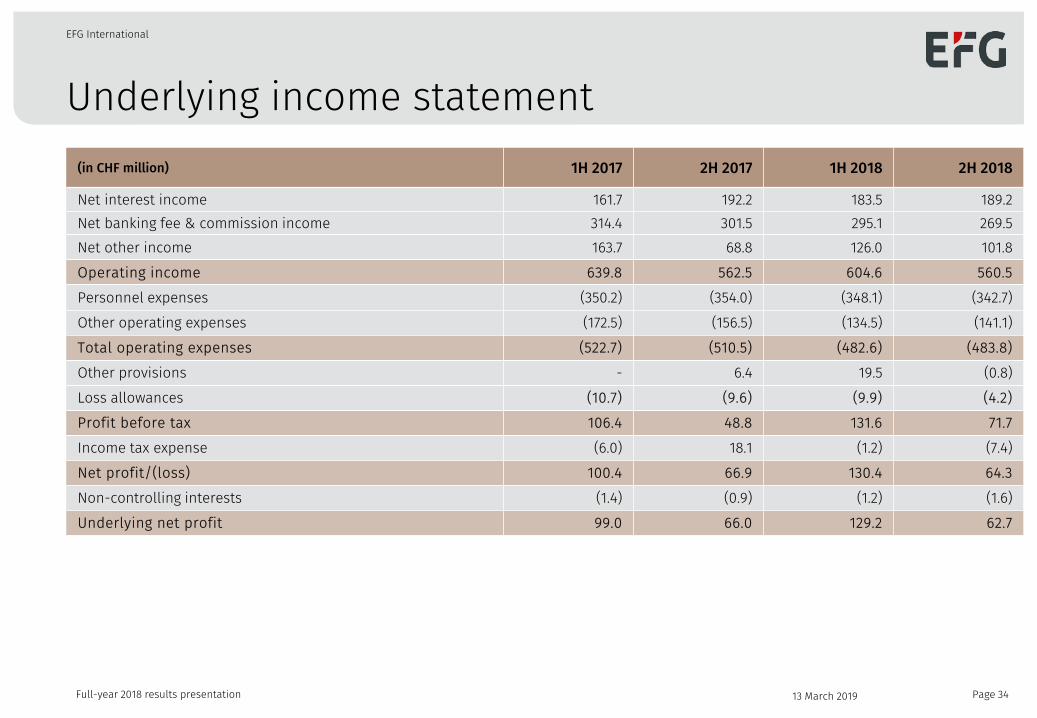
(in CHF million) 1H 2017 2H 2017 1H 2018 2H 2018
Net interest income 161.7 192.2 183.5 189.2 Net banking fee & commission income 314.4 301.5 295.1 269.5 Net other income 163.7 68.8 126.0 101.8 Operating income 639.8 562.5 604.6 560.5 Personnel expenses (350.2) (354.0) (348.1) (342.7) Other operating expenses (172.5) (156.5) (134.5) (141.1) Total operating expenses (522.7) (510.5) (482.6) (483.8) Other provisions - 6.4 19.5 (0.8) Loss allowances (10.7) (9.6) (9.9) (4.2) Profit before tax 106.4 48.8 131.6 71.7 Income tax expense (6.0) 18.1 (1.2) (7.4) Net profit/(loss) 100.4 66.9 130.4 64.3 Non-controlling interests (1.4) (0.9) (1.2) (1.6) Underlying net profit 99.0 66.0 129.2 62.7
13 March 2019
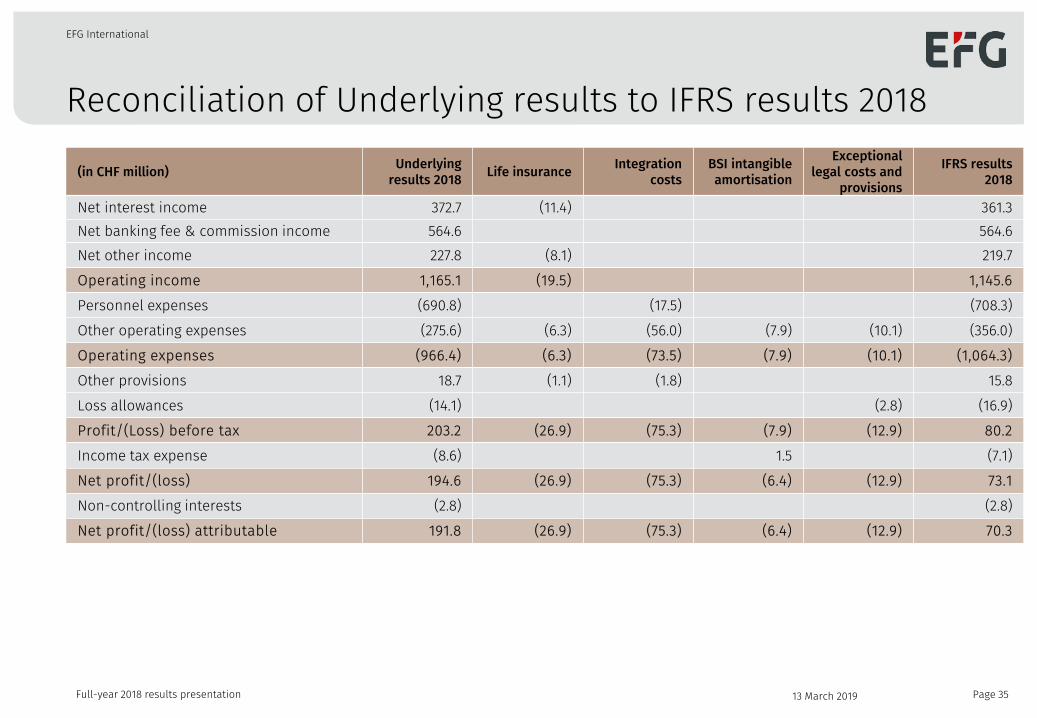
Reconciliation of Underlying results to IFRS results 2018
Page 35
EFG International
Full-year 2018 results presentation
(in CHF million) Underlying results 2018 Life insurance Integration
costs BSI intangible amortisation
Exceptional legal costs and
provisions
IFRS results 2018
Net interest income 372.7 (11.4) 361.3 Net banking fee & commission income 564.6 564.6 Net other income 227.8 (8.1) 219.7 Operating income 1,165.1 (19.5) 1,145.6 Personnel expenses (690.8) (17.5) (708.3) Other operating expenses (275.6) (6.3) (56.0) (7.9) (10.1) (356.0) Operating expenses (966.4) (6.3) (73.5) (7.9) (10.1) (1,064.3) Other provisions 18.7 (1.1) (1.8) 15.8 Loss allowances (14.1) (2.8) (16.9) Profit/(Loss) before tax 203.2 (26.9) (75.3) (7.9) (12.9) 80.2 Income tax expense (8.6) 1.5 (7.1) Net profit/(loss) 194.6 (26.9) (75.3) (6.4) (12.9) 73.1 Non-controlling interests (2.8) (2.8) Net profit/(loss) attributable 191.8 (26.9) (75.3) (6.4) (12.9) 70.3
13 March 2019
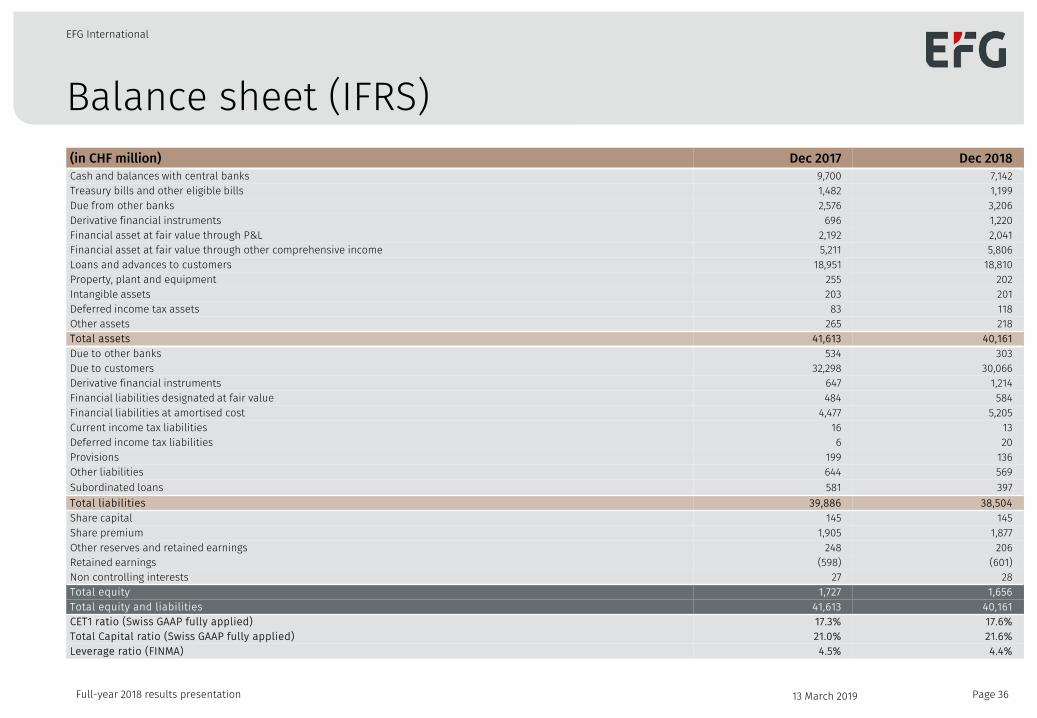
Balance sheet (IFRS)
Page 36
EFG International
Full-year 2018 results presentation
(in CHF million) Dec 2017 Dec 2018 Cash and balances with central banks 9,700 7,142 Treasury bills and other eligible bills 1,482 1,199 Due from other banks 2,576 3,206 Derivative financial instruments 696 1,220 Financial asset at fair value through P&L 2,192 2,041 Financial asset at fair value through other comprehensive income 5,211 5,806 Loans and advances to customers 18,951 18,810 Property, plant and equipment 255 202 Intangible assets 203 201 Deferred income tax assets 83 118 Other assets 265 218 Total assets 41,613 40,161 Due to other banks 534 303 Due to customers 32,298 30,066 Derivative financial instruments 647 1,214 Financial liabilities designated at fair value 484 584 Financial liabilities at amortised cost 4,477 5,205 Current income tax liabilities 16 13 Deferred income tax liabilities 6 20 Provisions 199 136 Other liabilities 644 569 Subordinated loans 581 397 Total liabilities 39,886 38,504 Share capital 145 145 Share premium 1,905 1,877 Other reserves and retained earnings 248 206 Retained earnings (598) (601) Non controlling interests 27 28 Total equity 1,727 1,656 Total equity and liabilities 41,613 40,161 CET1 ratio (Swiss GAAP fully applied) 17.3% 17.6% Total Capital ratio (Swiss GAAP fully applied) 21.0% 21.6% Leverage ratio (FINMA) 4.5% 4.4%
13 March 2019
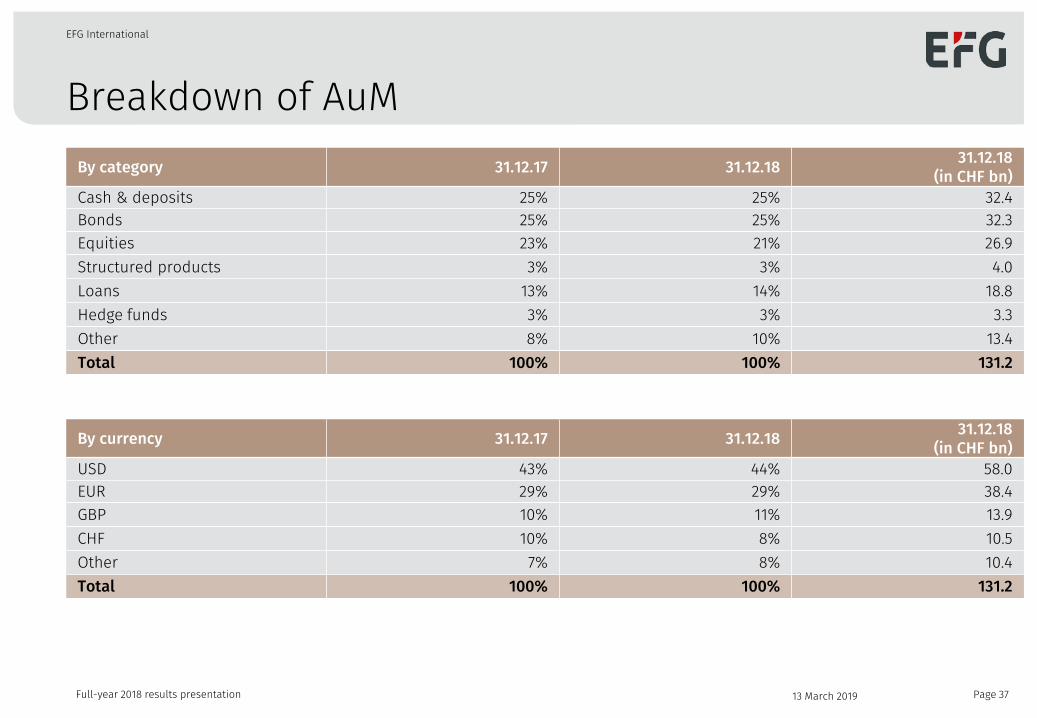
Breakdown of AuM
Page 37
EFG International
Full-year 2018 results presentation
By category 31.12.17 31.12.18 31.12.18 (in CHF bn)
Cash & deposits 25% 25% 32.4 Bonds 25% 25% 32.3 Equities 23% 21% 26.9 Structured products 3% 3% 4.0 Loans 13% 14% 18.8 Hedge funds 3% 3% 3.3 Other 8% 10% 13.4 Total 100% 100% 131.2
By currency 31.12.17 31.12.18 31.12.18 (in CHF bn)
USD 43% 44% 58.0 EUR 29% 29% 38.4 GBP 10% 11% 13.9 CHF 10% 8% 10.5 Other 7% 8% 10.4 Total 100% 100% 131.2
13 March 2019
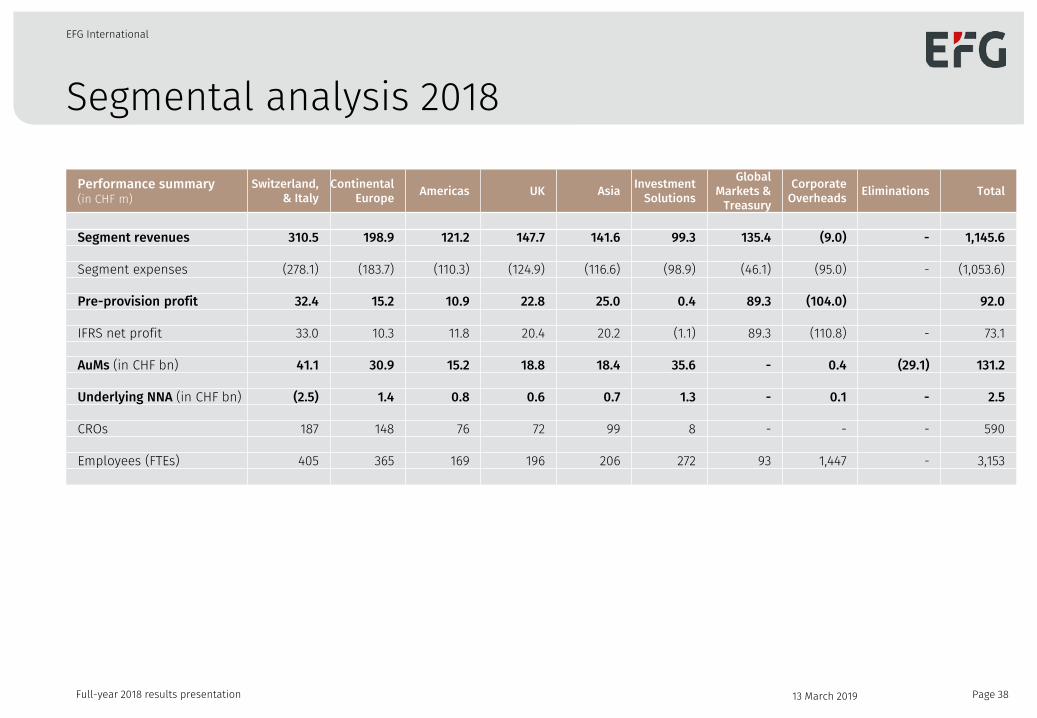
Segmental analysis 2018
Page 38
EFG International
Full-year 2018 results presentation
Performance summary (in CHF m)
Switzerland, & Italy
Continental Europe Americas UK Asia Investment
Solutions
Global Markets &
Treasury
Corporate Overheads Eliminations Total
Segment revenues 310.5 198.9 121.2 147.7 141.6 99.3 135.4 (9.0) - 1,145.6
Segment expenses (278.1) (183.7) (110.3) (124.9) (116.6) (98.9) (46.1) (95.0) - (1,053.6)
Pre-provision profit 32.4 15.2 10.9 22.8 25.0 0.4 89.3 (104.0) 92.0
IFRS net profit 33.0 10.3 11.8 20.4 20.2 (1.1) 89.3 (110.8) - 73.1
AuMs (in CHF bn) 41.1 30.9 15.2 18.8 18.4 35.6 - 0.4 (29.1) 131.2
Underlying NNA (in CHF bn) (2.5) 1.4 0.8 0.6 0.7 1.3 - 0.1 - 2.5
CROs 187 148 76 72 99 8 - - - 590
Employees (FTEs) 405 365 169 196 206 272 93 1,447 - 3,153
13 March 2019
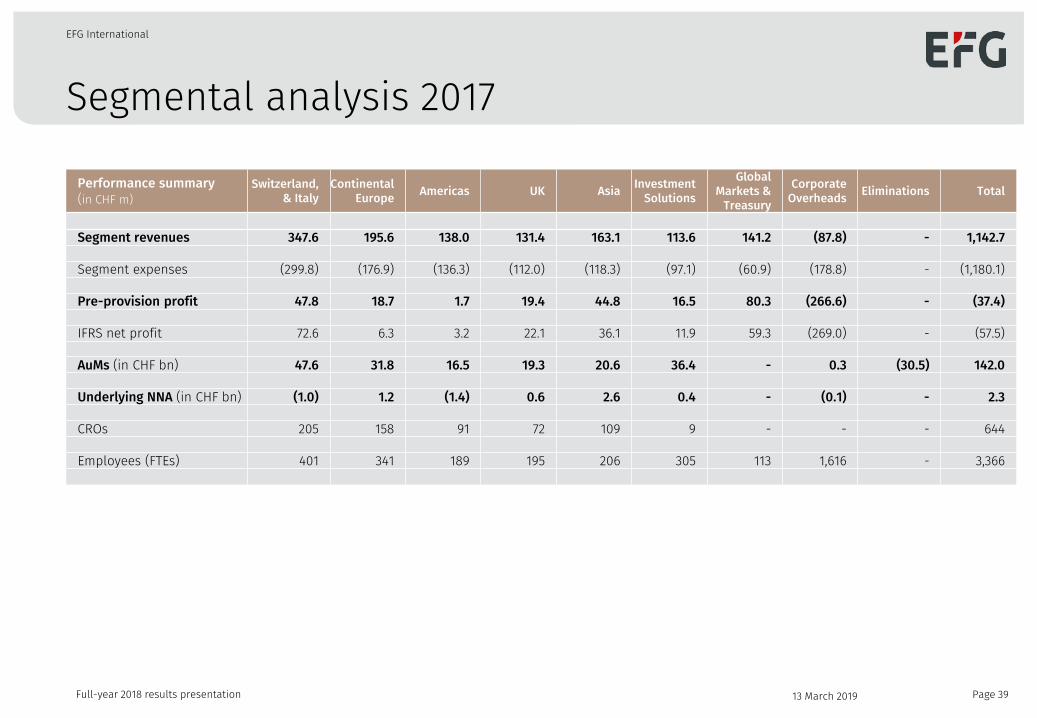
Segmental analysis 2017
Page 39
EFG International
Full-year 2018 results presentation
Performance summary (in CHF m)
Switzerland, & Italy
Continental Europe Americas UK Asia Investment
Solutions
Global Markets &
Treasury
Corporate Overheads Eliminations Total
Segment revenues 347.6 195.6 138.0 131.4 163.1 113.6 141.2 (87.8) - 1,142.7
Segment expenses (299.8) (176.9) (136.3) (112.0) (118.3) (97.1) (60.9) (178.8) - (1,180.1)
Pre-provision profit 47.8 18.7 1.7 19.4 44.8 16.5 80.3 (266.6) - (37.4)
IFRS net profit 72.6 6.3 3.2 22.1 36.1 11.9 59.3 (269.0) - (57.5)
AuMs (in CHF bn) 47.6 31.8 16.5 19.3 20.6 36.4 - 0.3 (30.5) 142.0
Underlying NNA (in CHF bn) (1.0) 1.2 (1.4) 0.6 2.6 0.4 - (0.1) - 2.3
CROs 205 158 91 72 109 9 - - - 644
Employees (FTEs) 401 341 189 195 206 305 113 1,616 - 3,366
13 March 2019
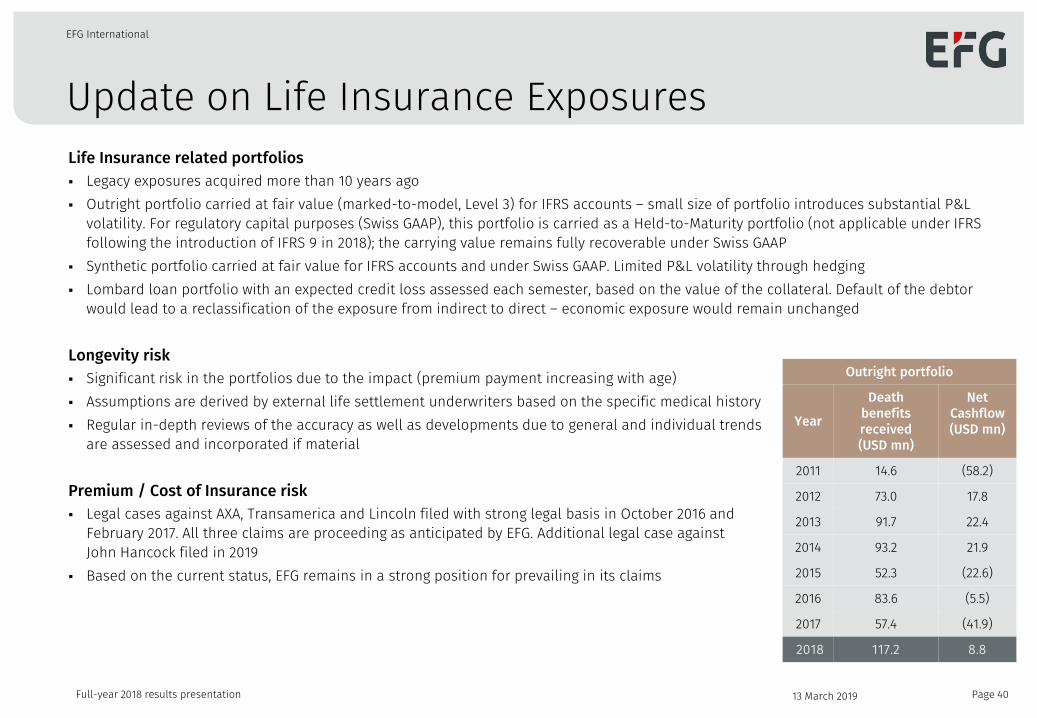
Update on Life Insurance Exposures
Page 40
EFG International
Full-year 2018 results presentation
Life Insurance related portfolios Legacy exposures acquired more than 10 years ago Outright portfolio carried at fair value (marked-to-model, Level 3) for IFRS accounts – small size of portfolio introduces substantial P&L
volatility. For regulatory capital purposes (Swiss GAAP), this portfolio is carried as a Held-to-Maturity portfolio (not applicable under IFRS following the introduction of IFRS 9 in 2018); the carrying value remains fully recoverable under Swiss GAAP
Synthetic portfolio carried at fair value for IFRS accounts and under Swiss GAAP. Limited P&L volatility through hedging Lombard loan portfolio with an expected credit loss assessed each semester, based on the value of the collateral. Default of the debtor
would lead to a reclassification of the exposure from indirect to direct – economic exposure would remain unchanged Longevity risk Significant risk in the portfolios due to the impact (premium payment increasing with age) Assumptions are derived by external life settlement underwriters based on the specific medical history Regular in-depth reviews of the accuracy as well as developments due to general and individual trends
are assessed and incorporated if material Premium / Cost of Insurance risk Legal cases against AXA, Transamerica and Lincoln filed with strong legal basis in October 2016 and
February 2017. All three claims are proceeding as anticipated by EFG. Additional legal case against John Hancock filed in 2019
Based on the current status, EFG remains in a strong position for prevailing in its claims
Outright portfolio
Year
Death benefits received (USD mn)
Net Cashflow (USD mn)
2011 14.6 (58.2)
2012 73.0 17.8
2013 91.7 22.4
2014 93.2 21.9
2015 52.3 (22.6)
2016 83.6 (5.5)
2017 57.4 (41.9)
2018 117.2 8.8
13 March 2019
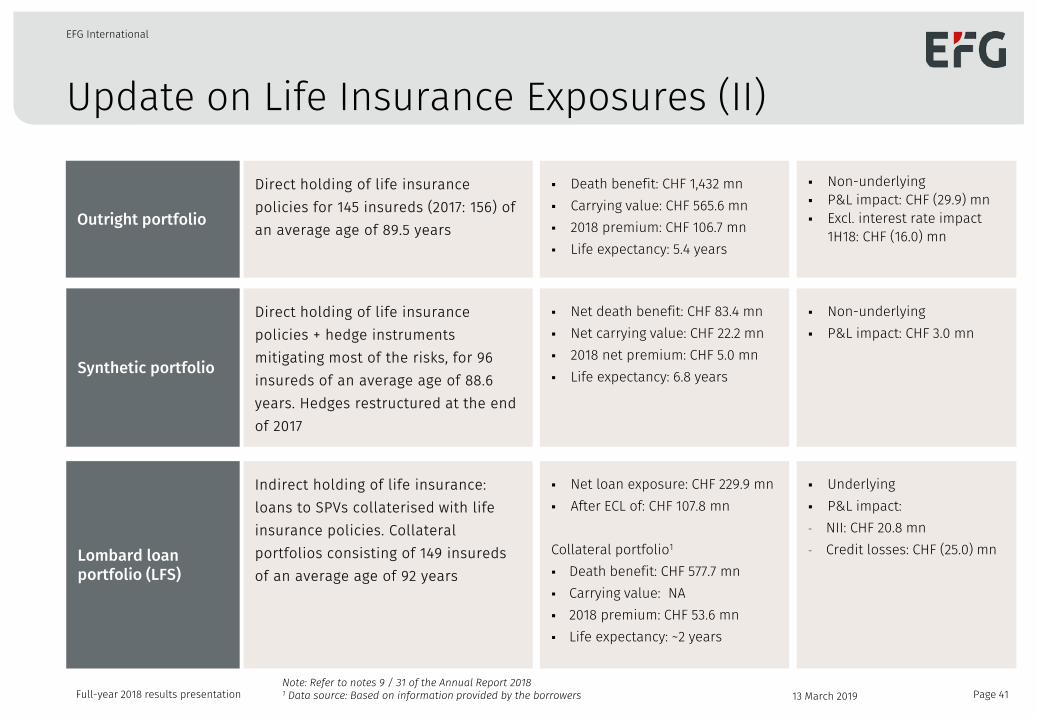
Update on Life Insurance Exposures (II)
Page 41
EFG International
Full-year 2018 results presentation
Outright portfolio
Direct holding of life insurance policies for 145 insureds (2017: 156) of an average age of 89.5 years
Death benefit: CHF 1,432 mn Carrying value: CHF 565.6 mn 2018 premium: CHF 106.7 mn Life expectancy: 5.4 years
Non-underlying P&L impact: CHF (29.9) mn Excl. interest rate impact
1H18: CHF (16.0) mn
Synthetic portfolio
Direct holding of life insurance policies + hedge instruments mitigating most of the risks, for 96 insureds of an average age of 88.6 years. Hedges restructured at the end of 2017
Net death benefit: CHF 83.4 mn Net carrying value: CHF 22.2 mn 2018 net premium: CHF 5.0 mn Life expectancy: 6.8 years
Non-underlying P&L impact: CHF 3.0 mn
Lombard loan portfolio (LFS)
Indirect holding of life insurance: loans to SPVs collaterised with life insurance policies. Collateral portfolios consisting of 149 insureds of an average age of 92 years
Net loan exposure: CHF 229.9 mn After ECL of: CHF 107.8 mn Collateral portfolio1
Death benefit: CHF 577.7 mn Carrying value: NA 2018 premium: CHF 53.6 mn Life expectancy: ~2 years
Underlying P&L impact: - NII: CHF 20.8 mn - Credit losses: CHF (25.0) mn
13 March 2019 Note: Refer to notes 9 / 31 of the Annual Report 2018 1 Data source: Based on information provided by the borrowers
Contacts
Page 42
EFG International
Full-year 2018 results presentation
Investor Relations Jens Brueckner Head of Investor Relations
Phone +41 44 226 1799 [email protected] EFG International AG Bleicherweg 8 8001 Zurich Switzerland
Phone +41 44 212 73 77 Fax +41 44 226 18 55
efginternational.com Reuters: EFGN.S Bloomberg: EFGN SW
Marketing & Communications Daniela Haesler Head of Marketing & Communications
Phone +41 44 226 1804 [email protected]
Media Investors
13 March 2019