Embed Size (px)
Citation preview
1
Full Year 2017Results Presentation8 March 2018]
2
Olivier BrousseChief Executive Officer
2
www.laing.com
3
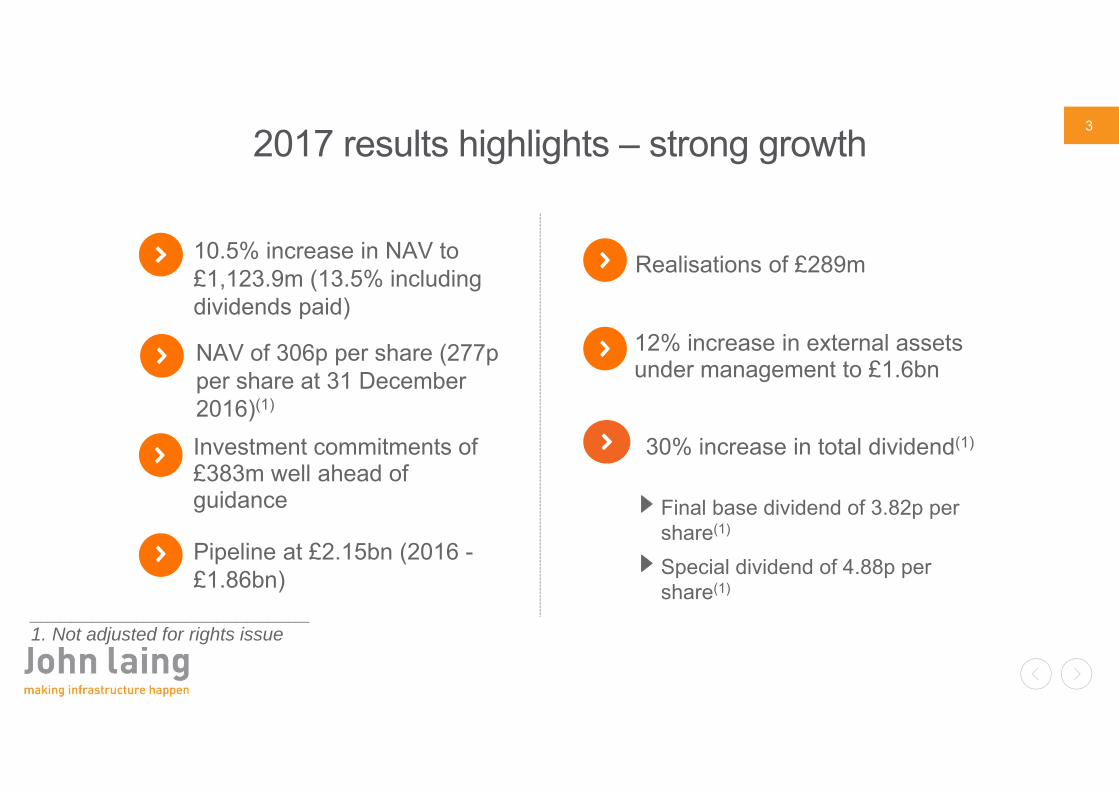
2017 results highlights – strong growth
10.5% increase in NAV to £1,123.9m (13.5% including dividends paid)
NAV of 306p per share (277p per share at 31 December 2016)(1)
Investment commitments of £383m well ahead of guidance
Pipeline at £2.15bn (2016 -£1.86bn)
Realisations of £289m
12% increase in external assets under management to £1.6bn
30% increase in total dividend(1)
Final base dividend of 3.82p per share(1)
Special dividend of 4.88p per share(1)
___________________________1. Not adjusted for rights issue
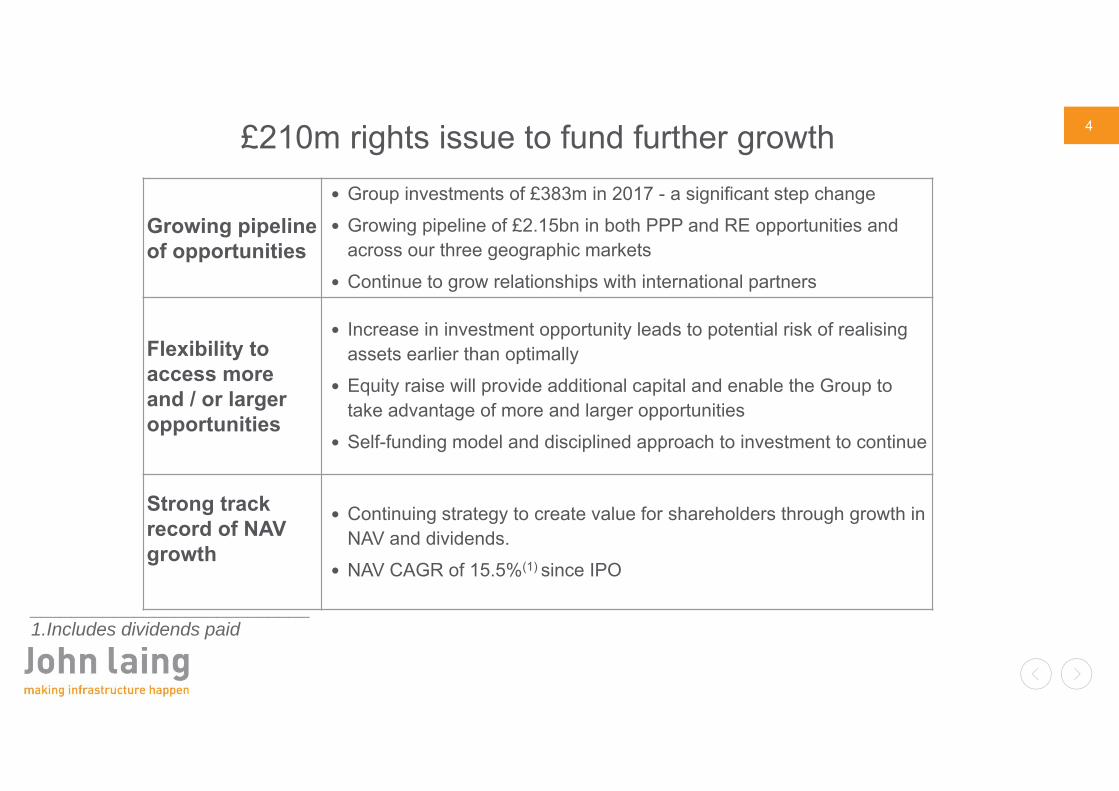
4£210m rights issue to fund further growth
___________________________1.Includes dividends paid
Growing pipeline of opportunities
Group investments of £383m in 2017 - a significant step change Growing pipeline of £2.15bn in both PPP and RE opportunities and
across our three geographic markets Continue to grow relationships with international partners
Flexibility to access more and / or larger opportunities
Increase in investment opportunity leads to potential risk of realisingassets earlier than optimally
Equity raise will provide additional capital and enable the Group to take advantage of more and larger opportunities
Self-funding model and disciplined approach to investment to continue
Strong track record of NAVgrowth
Continuing strategy to create value for shareholders through growth in NAV and dividends.
NAV CAGR of 15.5%(1) since IPO
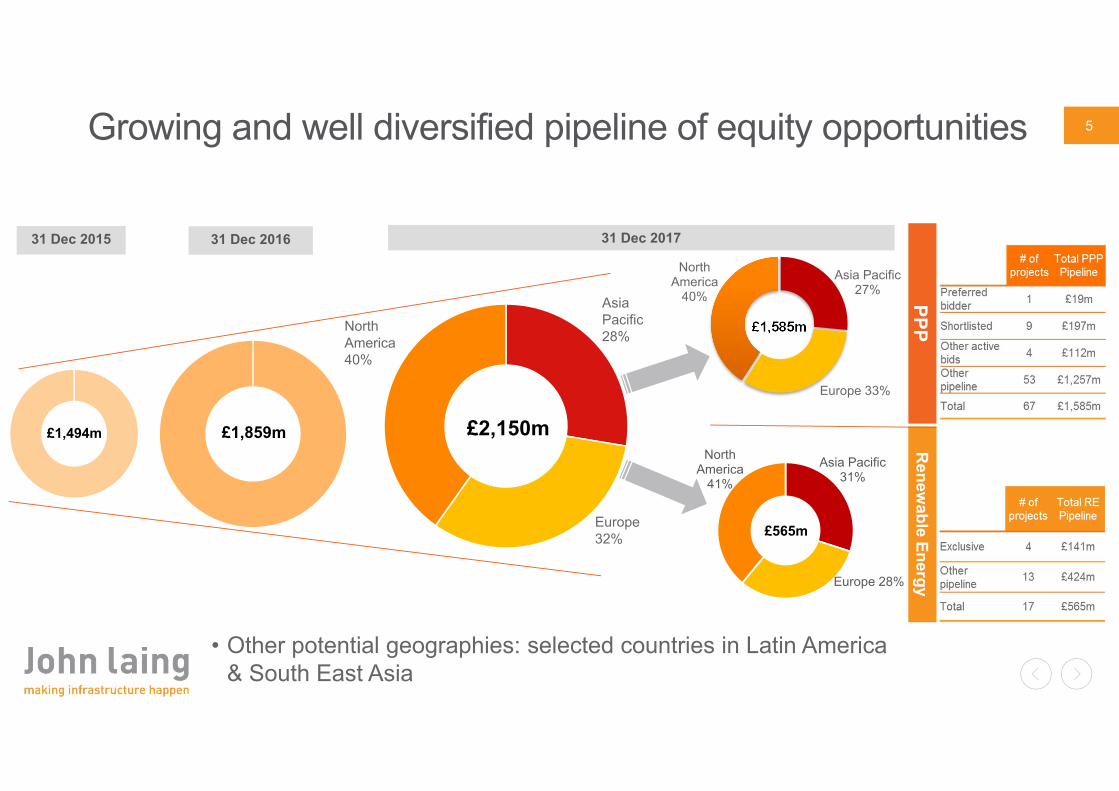
5Growing and well diversified pipeline of equity opportunities
£1,494m £2,150m
Renew
able EnergyPPP£1,585m
Asia Pacific27%
Europe 33%
North America
40%
Asia Pacific31%
Europe 28%
North America
41%
£565m
£1,859m
31 Dec 201631 Dec 2015 31 Dec 2017
North America 40%
Asia Pacific 28%
Europe 32%
• Other potential geographies: selected countries in Latin America & South East Asia
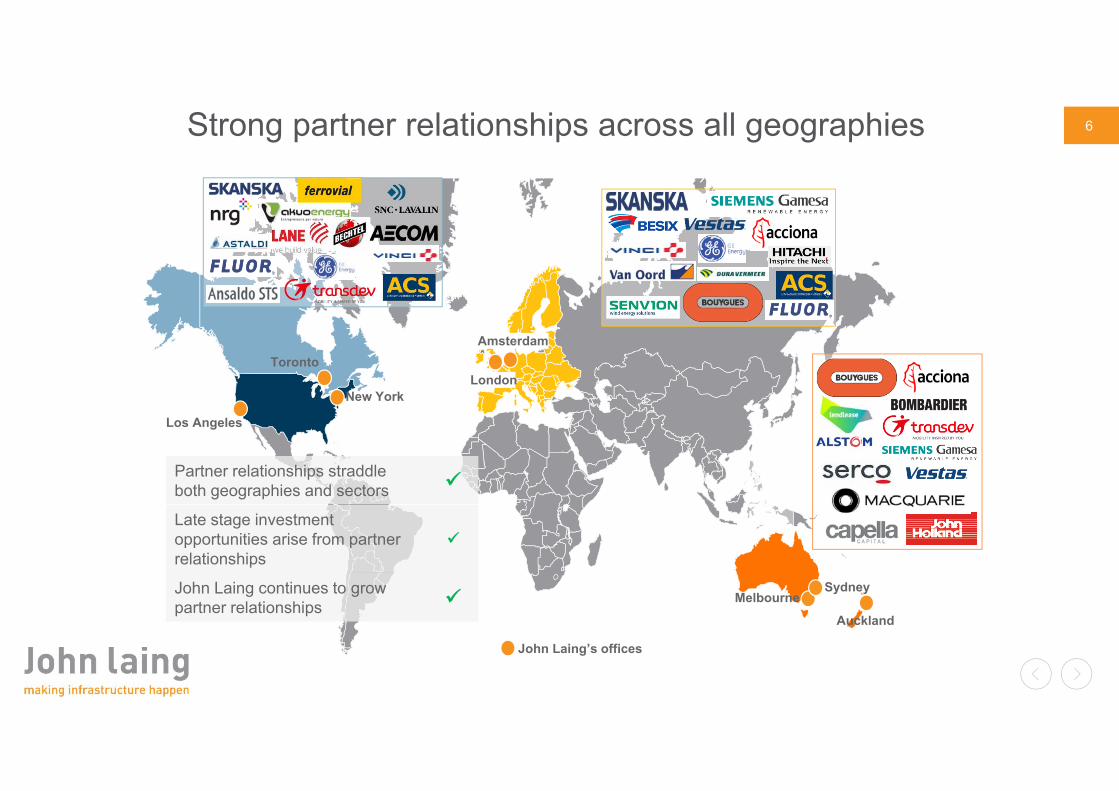
6Strong partner relationships across all geographies
Toronto
New YorkLondon
MelbourneSydney
Auckland
Amsterdam
John Laing’s offices
Partner relationships straddle both geographies and sectors
Late stage investment opportunities arise from partner relationships
John Laing continues to grow partner relationships
Los Angeles
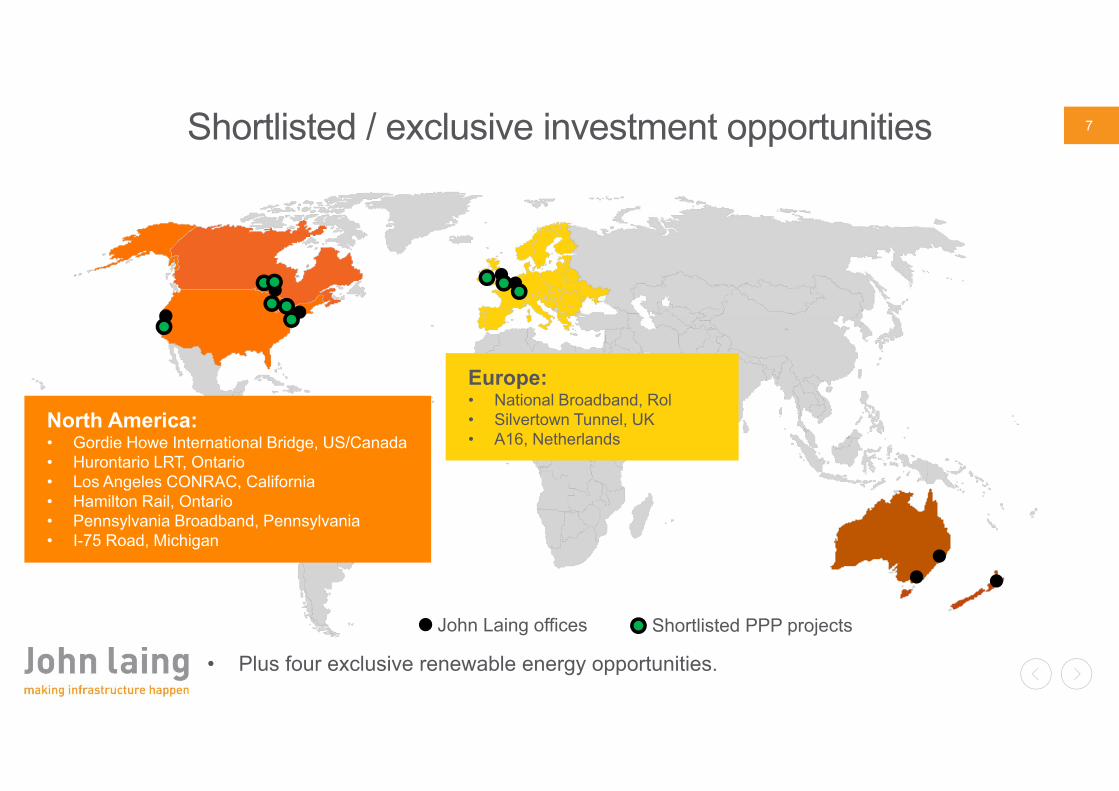
7Shortlisted / exclusive investment opportunities
John Laing offices Shortlisted PPP projects
Europe:• National Broadband, Rol• Silvertown Tunnel, UK• A16, Netherlands
• Plus four exclusive renewable energy opportunities.
North America:• Gordie Howe International Bridge, US/Canada• Hurontario LRT, Ontario• Los Angeles CONRAC, California • Hamilton Rail, Ontario• Pennsylvania Broadband, Pennsylvania• I-75 Road, Michigan
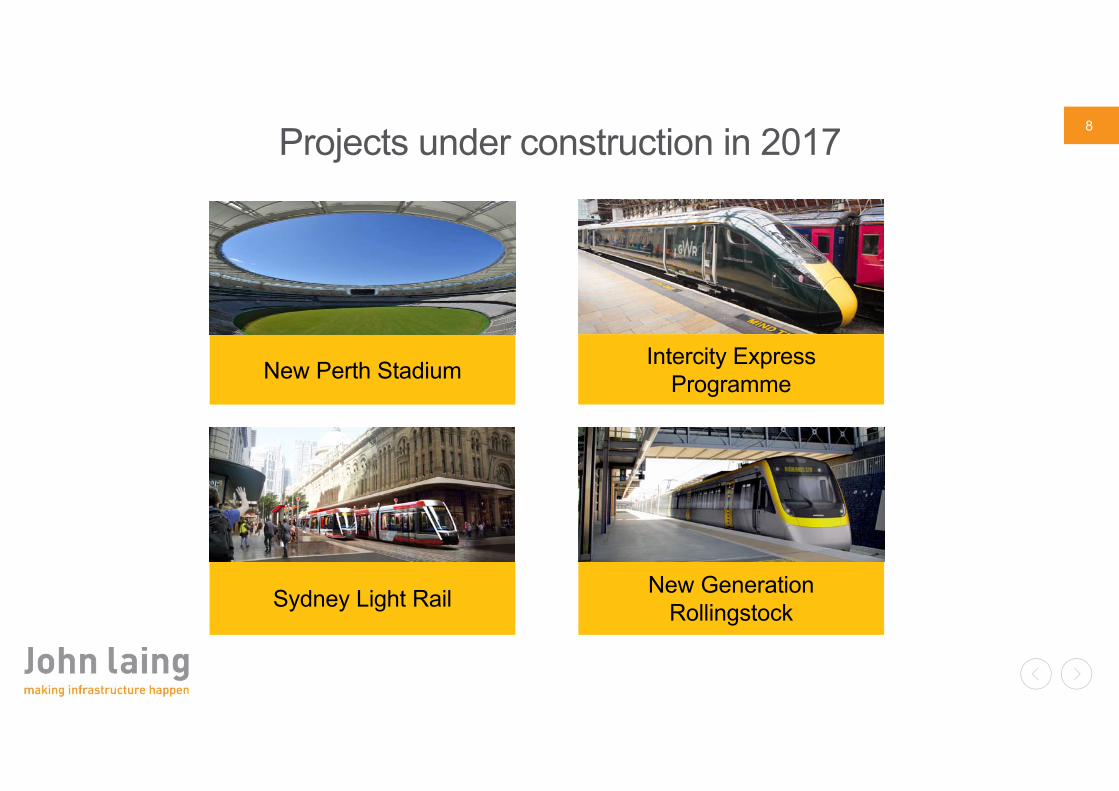
8Projects under construction in 2017
Intercity Express ProgrammeNew Perth Stadium
New Generation RollingstockSydney Light Rail
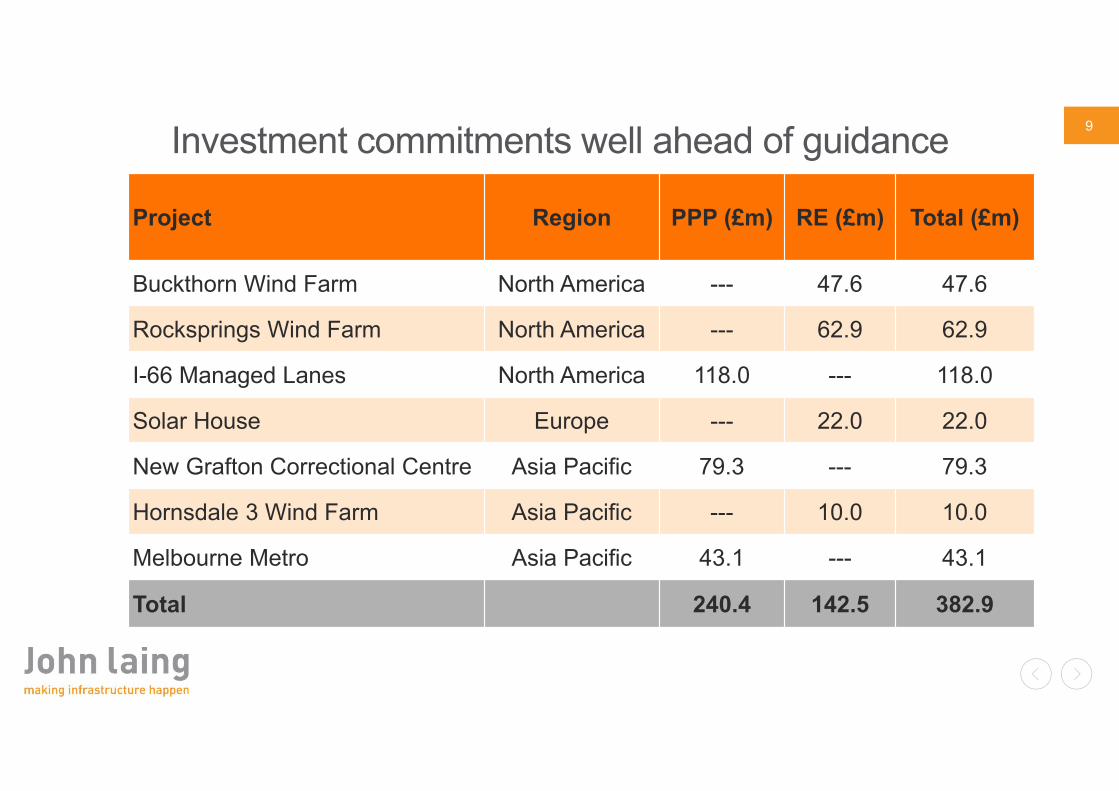
9Investment commitments well ahead of guidance
Project Region PPP (£m) RE (£m) Total (£m)
Buckthorn Wind Farm North America --- 47.6 47.6
Rocksprings Wind Farm North America --- 62.9 62.9
I-66 Managed Lanes North America 118.0 --- 118.0
Solar House Europe --- 22.0 22.0
New Grafton Correctional Centre Asia Pacific 79.3 --- 79.3
Hornsdale 3 Wind Farm Asia Pacific --- 10.0 10.0
Melbourne Metro Asia Pacific 43.1 --- 43.1
Total 240.4 142.5 382.9
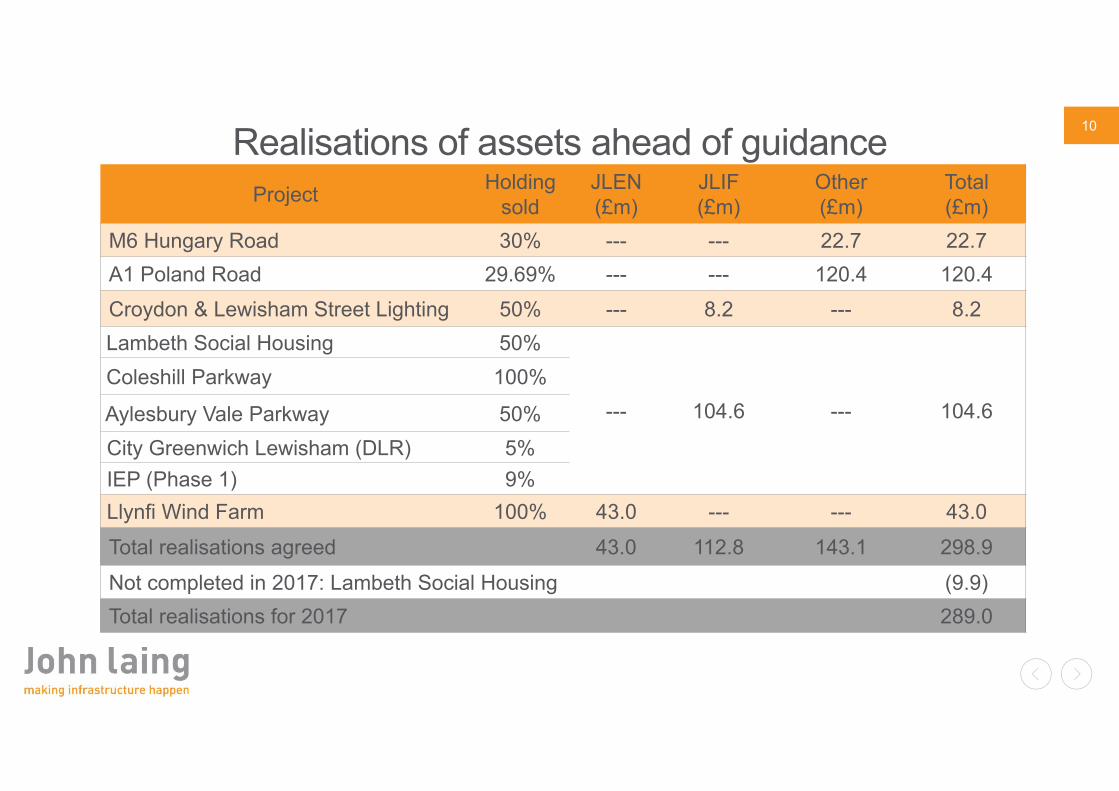
10Realisations of assets ahead of guidanceProject Holding
soldJLEN(£m)
JLIF(£m)
Other(£m)
Total(£m)
M6 Hungary Road 30% --- --- 22.7 22.7A1 Poland Road 29.69% --- --- 120.4 120.4Croydon & Lewisham Street Lighting 50% --- 8.2 --- 8.2Lambeth Social Housing 50%
--- 104.6 --- 104.6Coleshill Parkway 100%
Aylesbury Vale Parkway 50%City Greenwich Lewisham (DLR) 5%IEP (Phase 1) 9%Llynfi Wind Farm 100% 43.0 --- --- 43.0Total realisations agreed 43.0 112.8 143.1 298.9Not completed in 2017: Lambeth Social Housing (9.9)Total realisations for 2017 289.0

11
Patrick O’D BourkeGroup Finance Director
11
www.laing.com
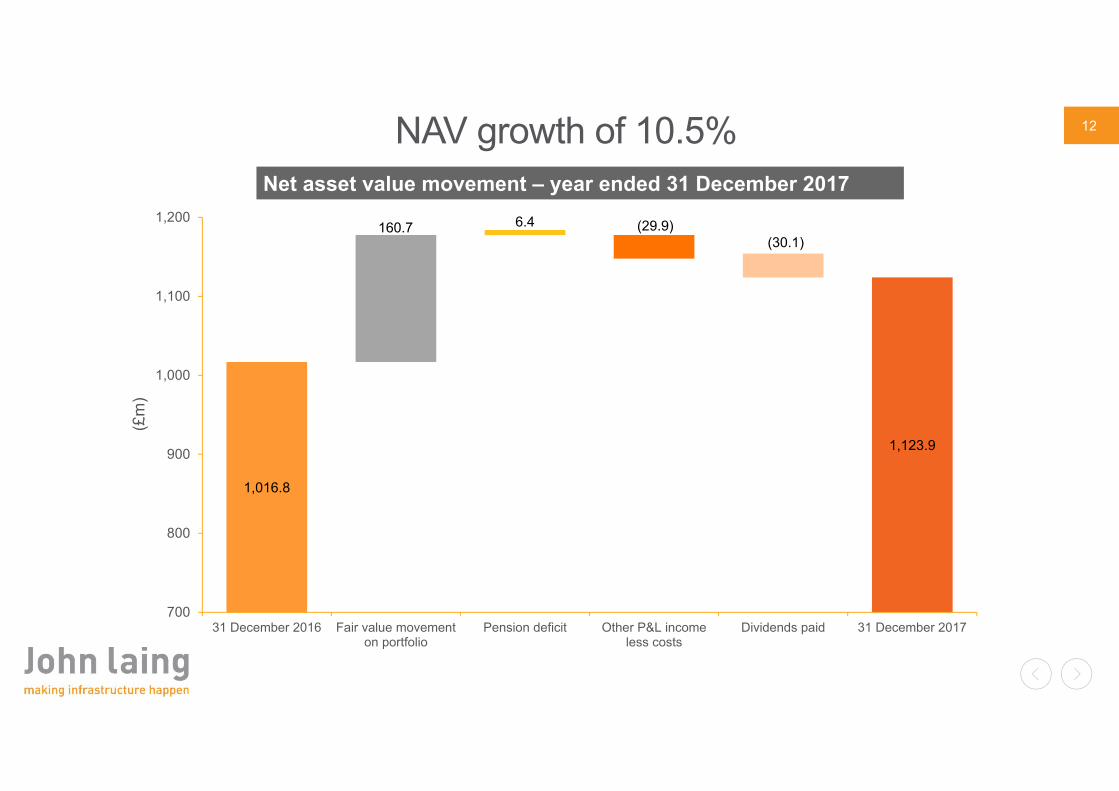
12NAV growth of 10.5%Net asset value movement – year ended 31 December 2017
1,016.8
1,123.9
160.7 6.4 (29.9)(30.1)
700
800
900
1,000
1,100
1,200
31 December 2016 Fair value movementon portfolio
Pension deficit Other P&L incomeless costs
Dividends paid 31 December 2017
(£m
)
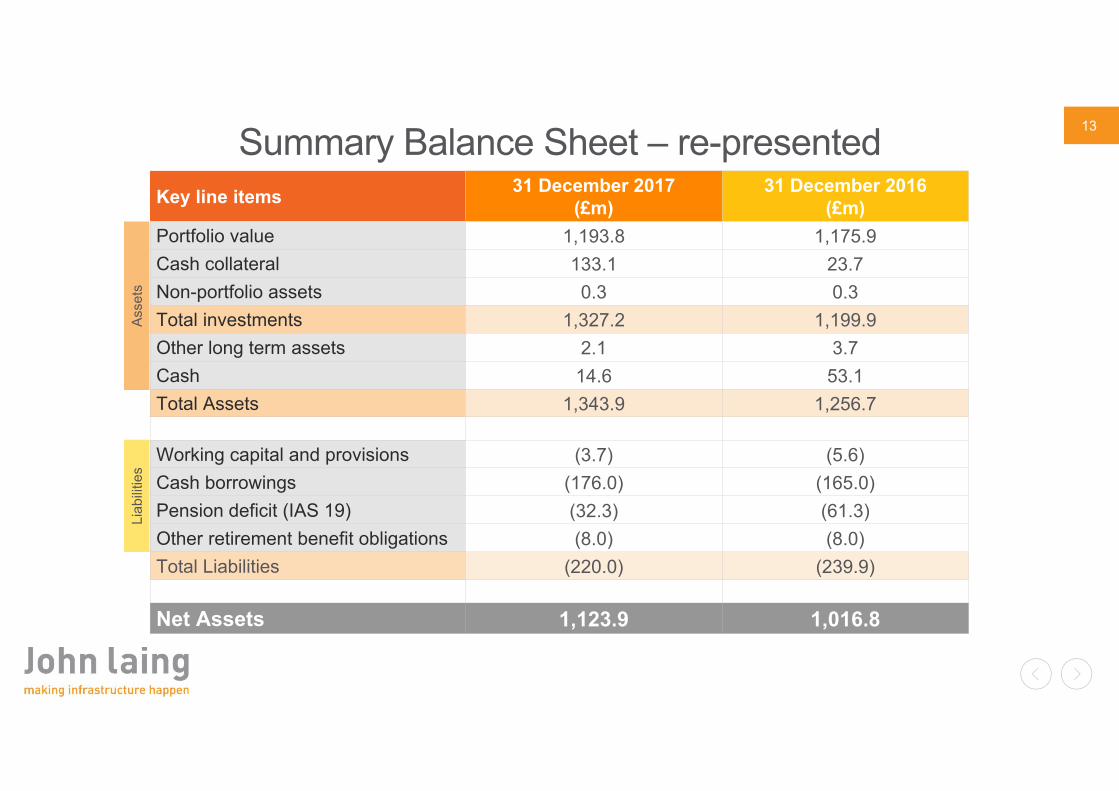
13Summary Balance Sheet – re-presentedKey line items 31 December 2017
(£m)31 December 2016
(£m)Portfolio value 1,193.8 1,175.9Cash collateral 133.1 23.7Non-portfolio assets 0.3 0.3Total investments 1,327.2 1,199.9Other long term assets 2.1 3.7Cash 14.6 53.1Total Assets 1,343.9 1,256.7
Working capital and provisions (3.7) (5.6)Cash borrowings (176.0) (165.0)Pension deficit (IAS 19) (32.3) (61.3)Other retirement benefit obligations (8.0) (8.0)Total Liabilities (220.0) (239.9)
Net Assets 1,123.9 1,016.8
Asse
tsLi
abilit
ies
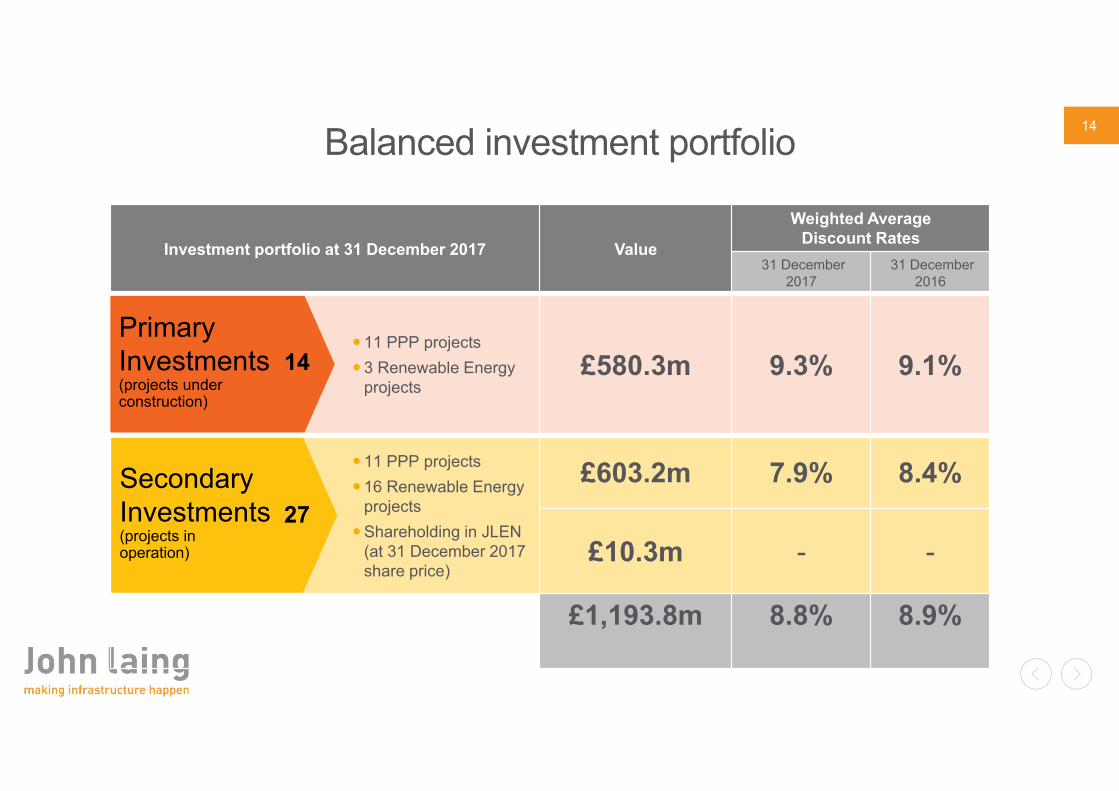
14
Investment portfolio at 31 December 2017 Value
Weighted Average Discount Rates
31 December 2017
31 December2016
£580.3m 9.3% 9.1%
£603.2m 7.9% 8.4%
£10.3m - -
£1,193.8m 8.8% 8.9%
Primary Investments(projects under construction)
Balanced investment portfolio
Secondary Investments(projects inoperation)
11 PPP projects 3 Renewable Energy
projects
11 PPP projects 16 Renewable Energy
projectsShareholding in JLEN
(at 31 December 2017 share price)
14
27
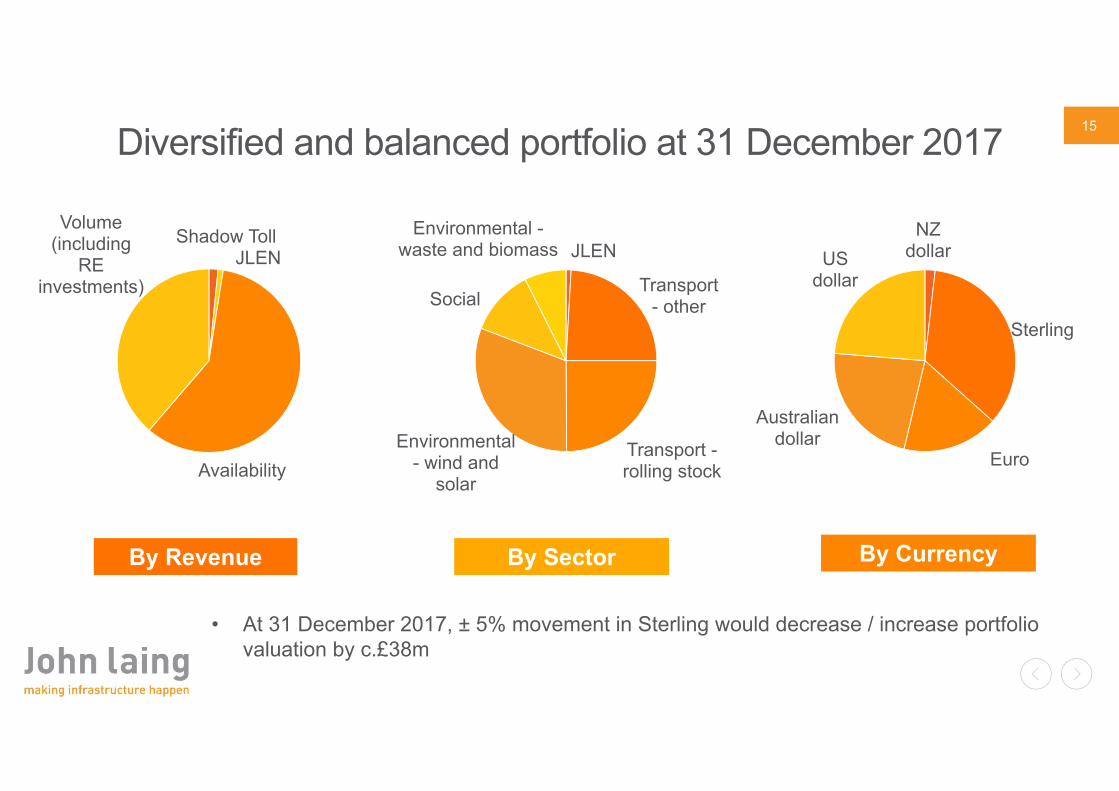
15Diversified and balanced portfolio at 31 December 2017
Shadow TollJLEN
Availability
Volume (including
RE investments)
By Revenue
JLEN
Transport - other
Transport -rolling stock
Environmental - wind and
solar
Social
Environmental -waste and biomass
By Sector
NZ dollar
Sterling
Euro
Australian dollar
US dollar
By Currency
• At 31 December 2017, ± 5% movement in Sterling would decrease / increase portfolio valuation by c.£38m
16
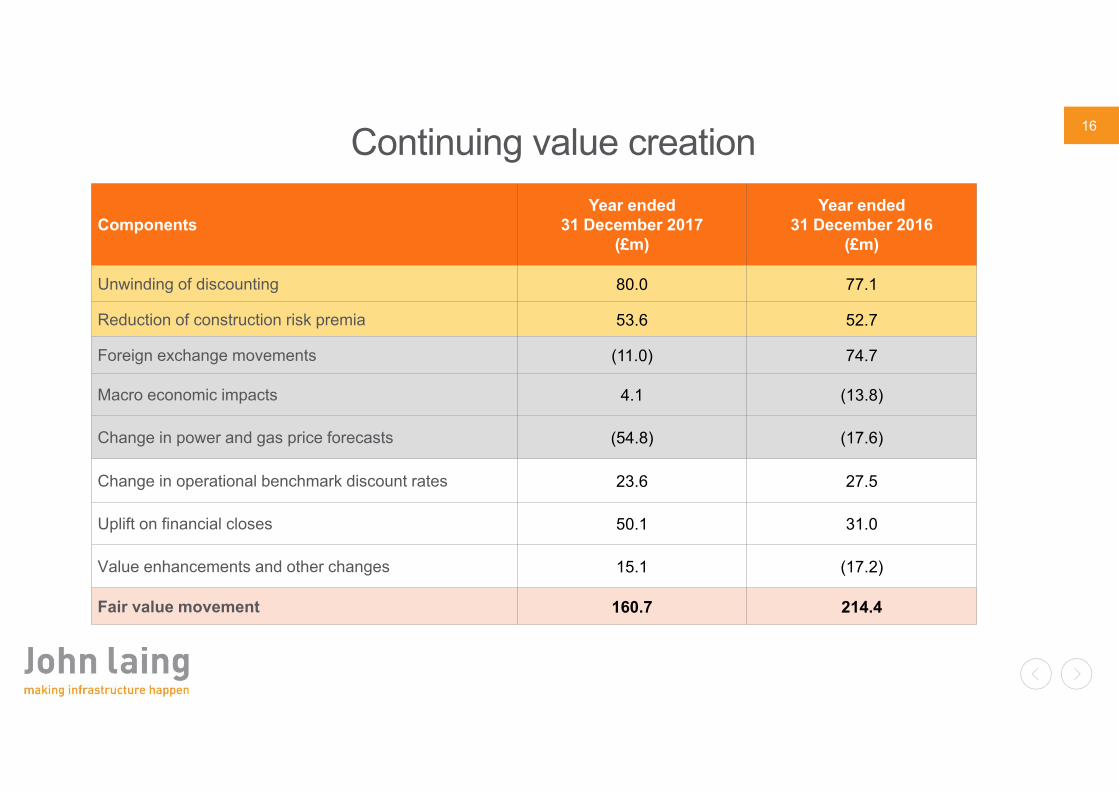
ComponentsYear ended
31 December 2017(£m)
Year ended31 December 2016
(£m)
Unwinding of discounting 80.0 77.1
Reduction of construction risk premia 53.6 52.7
Foreign exchange movements (11.0) 74.7
Macro economic impacts 4.1 (13.8)
Change in power and gas price forecasts (54.8) (17.6)
Change in operational benchmark discount rates 23.6 27.5
Uplift on financial closes 50.1 31.0
Value enhancements and other changes 15.1 (17.2)
Fair value movement 160.7 214.4
Continuing value creation
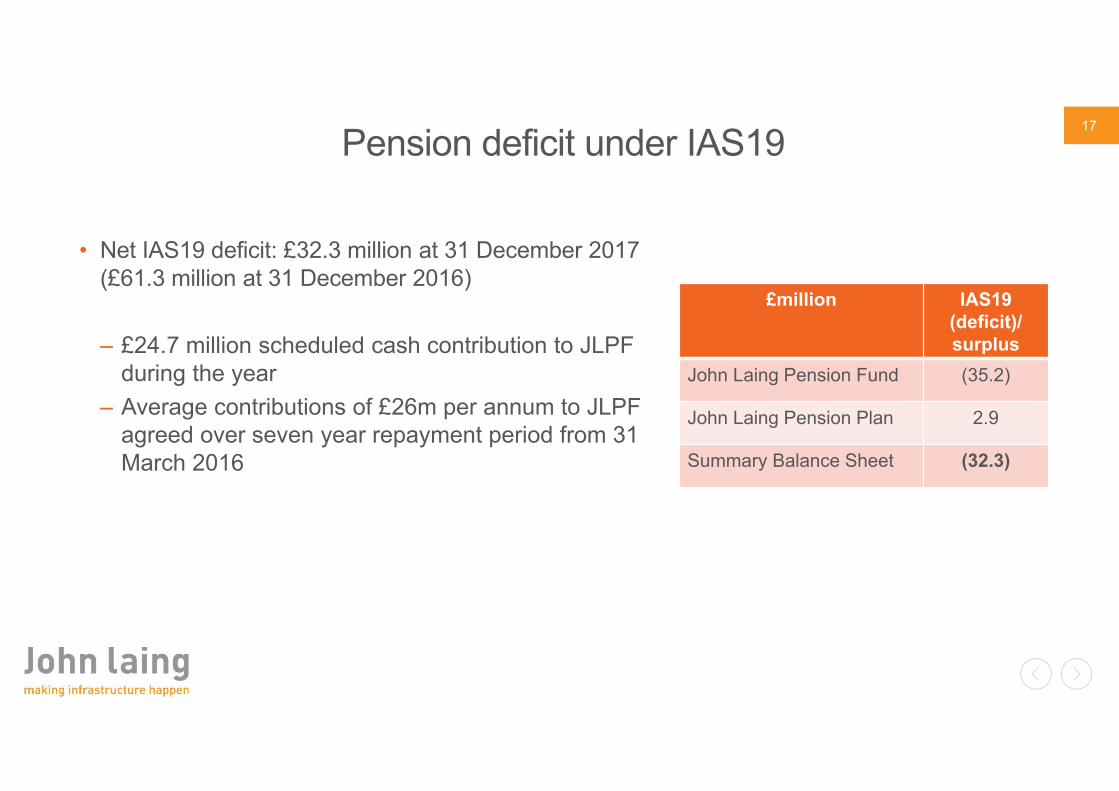
17Pension deficit under IAS19
• Net IAS19 deficit: £32.3 million at 31 December 2017 (£61.3 million at 31 December 2016)
– £24.7 million scheduled cash contribution to JLPF during the year
– Average contributions of £26m per annum to JLPF agreed over seven year repayment period from 31 March 2016
£million IAS19(deficit)/ surplus
John Laing Pension Fund (35.2)
John Laing Pension Plan 2.9
Summary Balance Sheet (32.3)
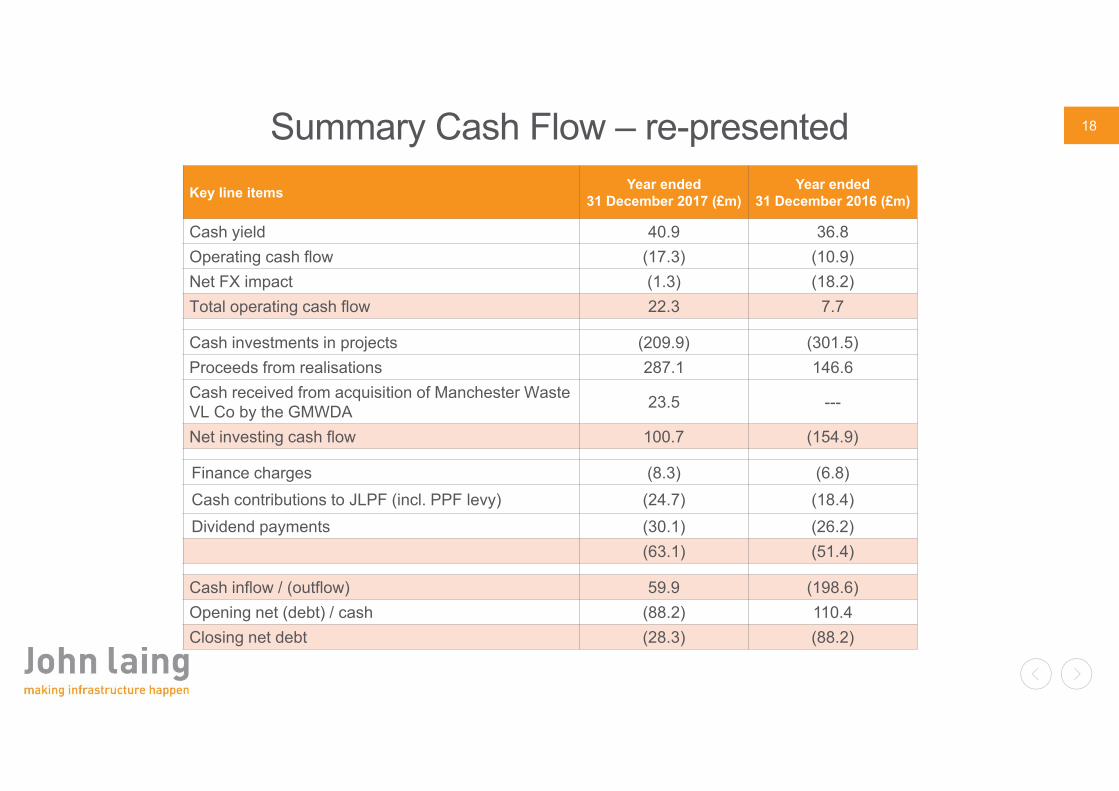
18Summary Cash Flow – re-presented
1 include cash collateral balances and are net of cash borrowings
Key line items Year ended 31 December 2017 (£m)
Year ended 31 December 2016 (£m)
Cash yield 40.9 36.8Operating cash flow (17.3) (10.9)Net FX impact (1.3) (18.2)Total operating cash flow 22.3 7.7
Cash investments in projects (209.9) (301.5)Proceeds from realisations 287.1 146.6Cash received from acquisition of Manchester Waste VL Co by the GMWDA 23.5 ---
Net investing cash flow 100.7 (154.9)
Finance charges (8.3) (6.8)Cash contributions to JLPF (incl. PPF levy) (24.7) (18.4)Dividend payments (30.1) (26.2)
(63.1) (51.4)
Cash inflow / (outflow) 59.9 (198.6)Opening net (debt) / cash (88.2) 110.4Closing net debt (28.3) (88.2)
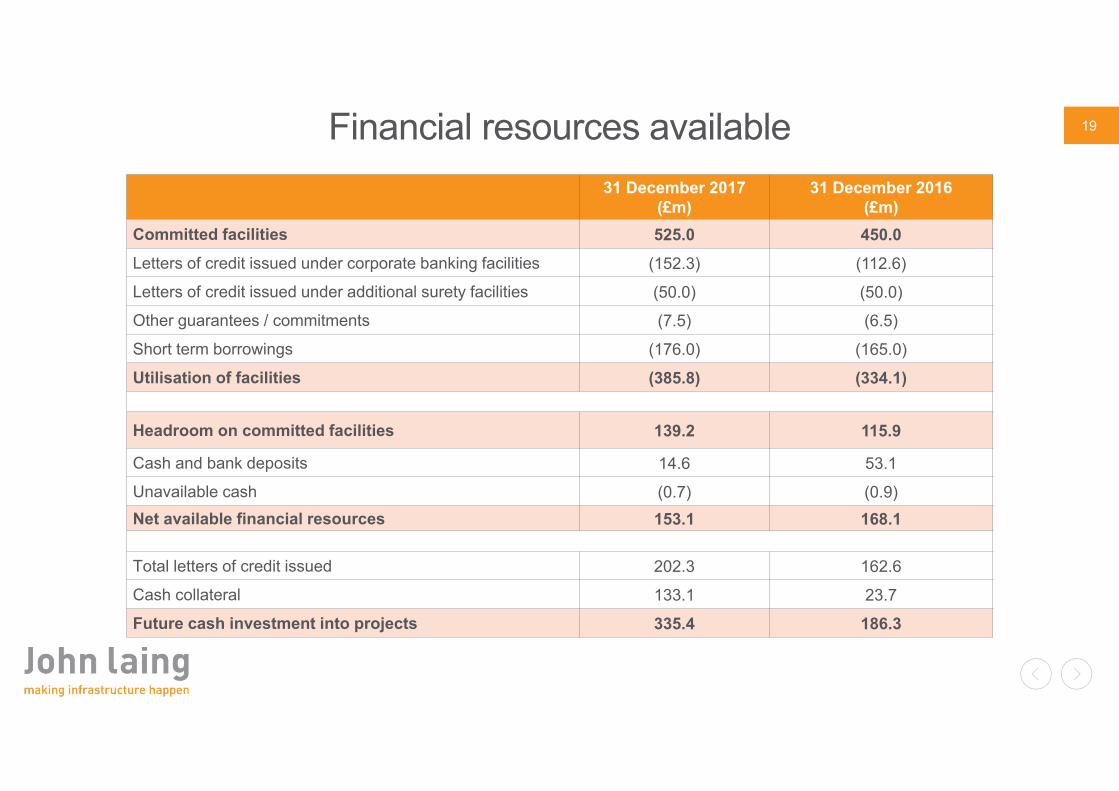
19Financial resources available31 December 2017
(£m)31 December 2016
(£m)Committed facilities 525.0 450.0Letters of credit issued under corporate banking facilities (152.3) (112.6)
Letters of credit issued under additional surety facilities (50.0) (50.0)
Other guarantees / commitments (7.5) (6.5)
Short term borrowings (176.0) (165.0)
Utilisation of facilities (385.8) (334.1)
Headroom on committed facilities 139.2 115.9
Cash and bank deposits 14.6 53.1
Unavailable cash (0.7) (0.9)Net available financial resources 153.1 168.1
Total letters of credit issued 202.3 162.6
Cash collateral 133.1 23.7
Future cash investment into projects 335.4 186.3
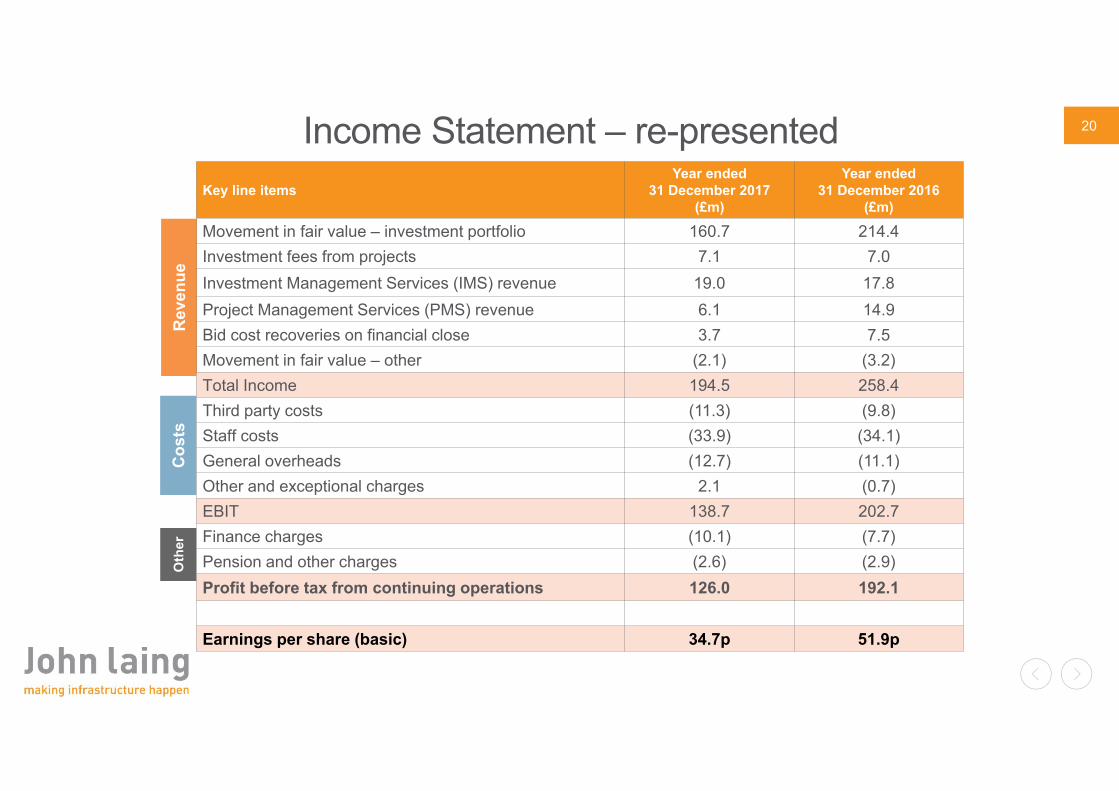
20Income Statement – re-presentedR
even
ueC
osts
Key line itemsYear ended
31 December 2017(£m)
Year ended31 December 2016
(£m)
Movement in fair value – investment portfolio 160.7 214.4Investment fees from projects 7.1 7.0Investment Management Services (IMS) revenue 19.0 17.8Project Management Services (PMS) revenue 6.1 14.9Bid cost recoveries on financial close 3.7 7.5Movement in fair value – other (2.1) (3.2)Total Income 194.5 258.4Third party costs (11.3) (9.8)Staff costs (33.9) (34.1)General overheads (12.7) (11.1)Other and exceptional charges 2.1 (0.7)EBIT 138.7 202.7Finance charges (10.1) (7.7)Pension and other charges (2.6) (2.9)Profit before tax from continuing operations 126.0 192.1
Earnings per share (basic) 34.7p 51.9p
Oth
er
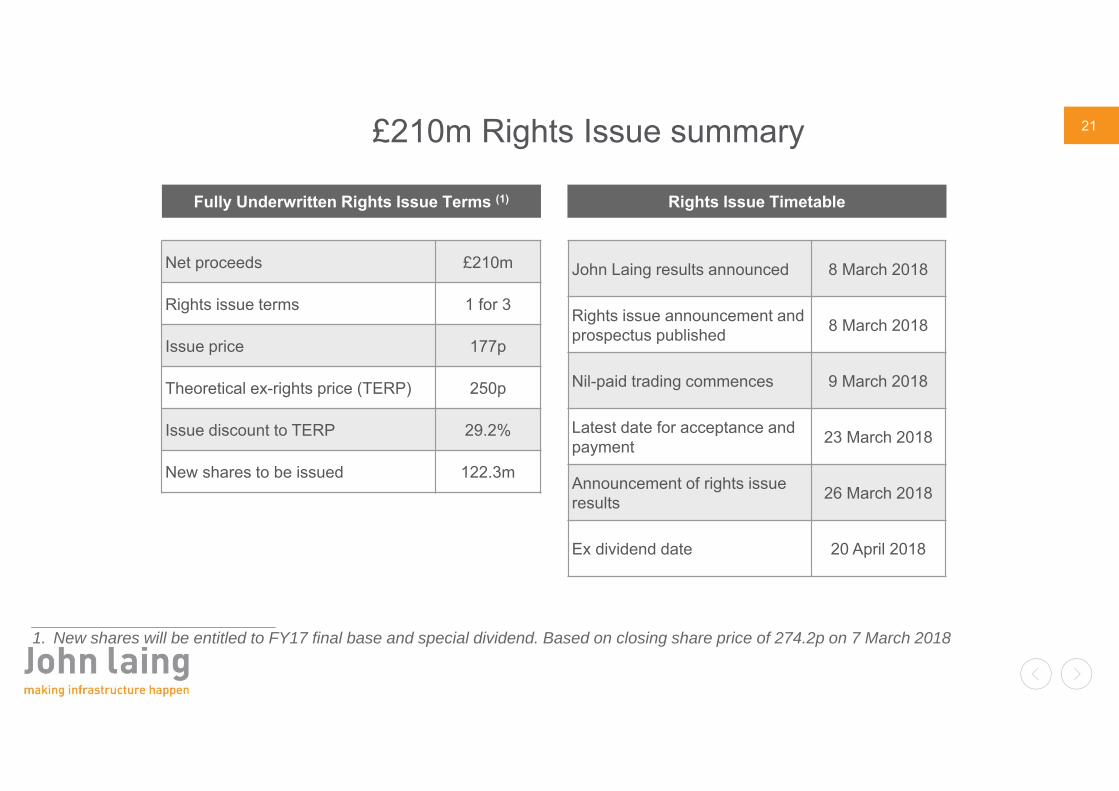
21£210m Rights Issue summary
Fully Underwritten Rights Issue Terms (1) Rights Issue Timetable
___________________________1. New shares will be entitled to FY17 final base and special dividend. Based on closing share price of 274.2p on 7 March 2018
Net proceeds £210m
Rights issue terms 1 for 3
Issue price 177p
Theoretical ex-rights price (TERP) 250p
Issue discount to TERP 29.2%
New shares to be issued 122.3m
John Laing results announced 8 March 2018
Rights issue announcement and prospectus published 8 March 2018
Nil-paid trading commences 9 March 2018
Latest date for acceptance and payment 23 March 2018
Announcement of rights issue results 26 March 2018
Ex dividend date 20 April 2018
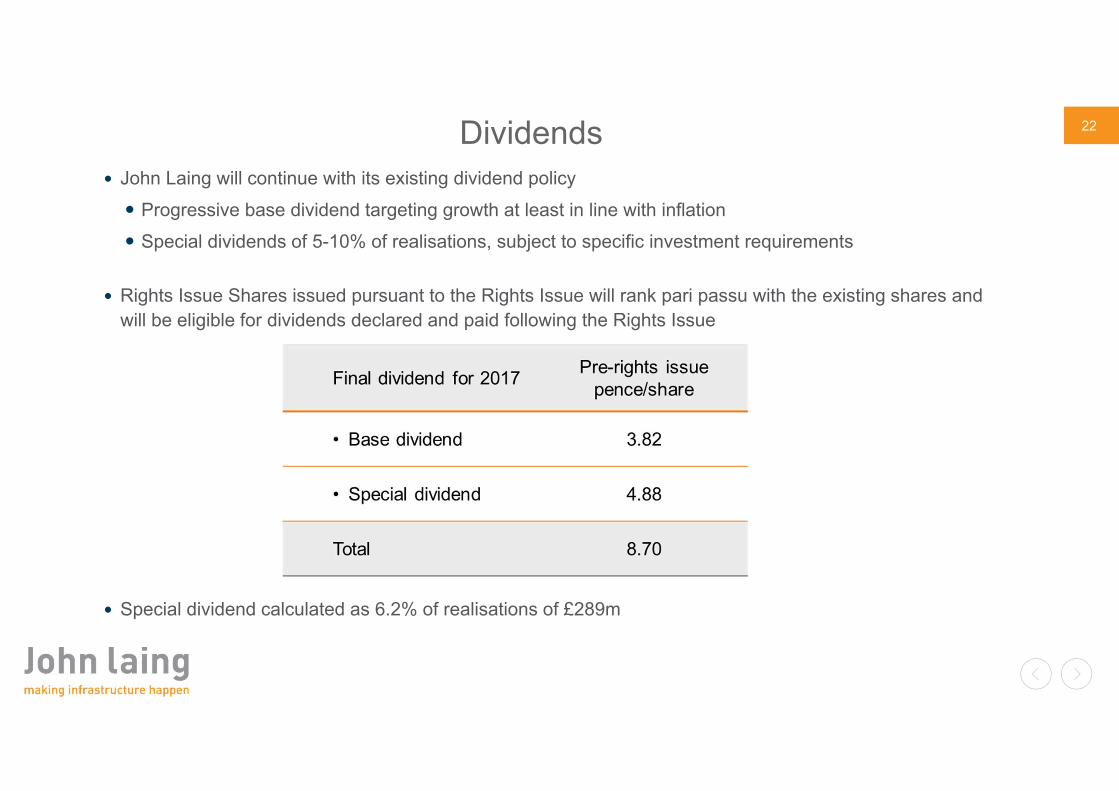
22Dividends John Laing will continue with its existing dividend policy Progressive base dividend targeting growth at least in line with inflation Special dividends of 5-10% of realisations, subject to specific investment requirements
Rights Issue Shares issued pursuant to the Rights Issue will rank pari passu with the existing shares and will be eligible for dividends declared and paid following the Rights Issue
Special dividend calculated as 6.2% of realisations of £289m
23
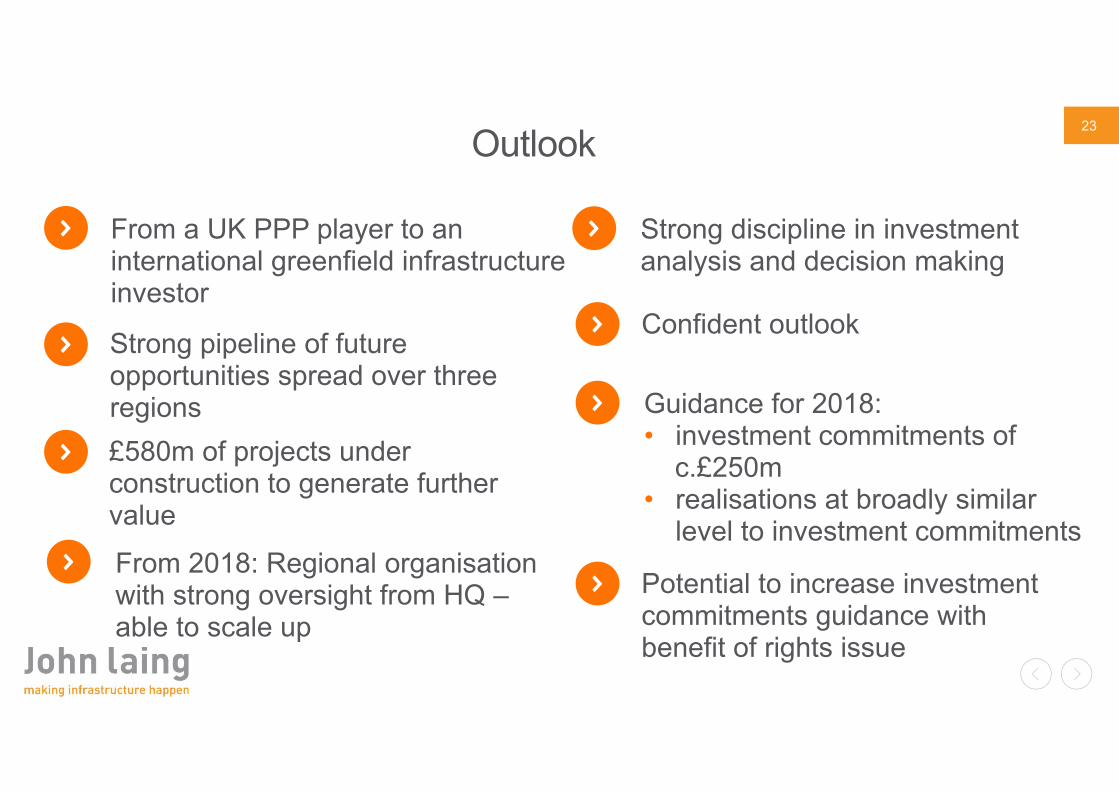
Outlook
From a UK PPP player to an international greenfield infrastructure investor
Strong pipeline of future opportunities spread over three regions£580m of projects under construction to generate further value
From 2018: Regional organisation with strong oversight from HQ –able to scale up
Strong discipline in investment analysis and decision making
Confident outlook
Guidance for 2018:• investment commitments of
c.£250m• realisations at broadly similar
level to investment commitments
Potential to increase investment commitments guidance with benefit of rights issue

24
Q & A

25
Appendices
26
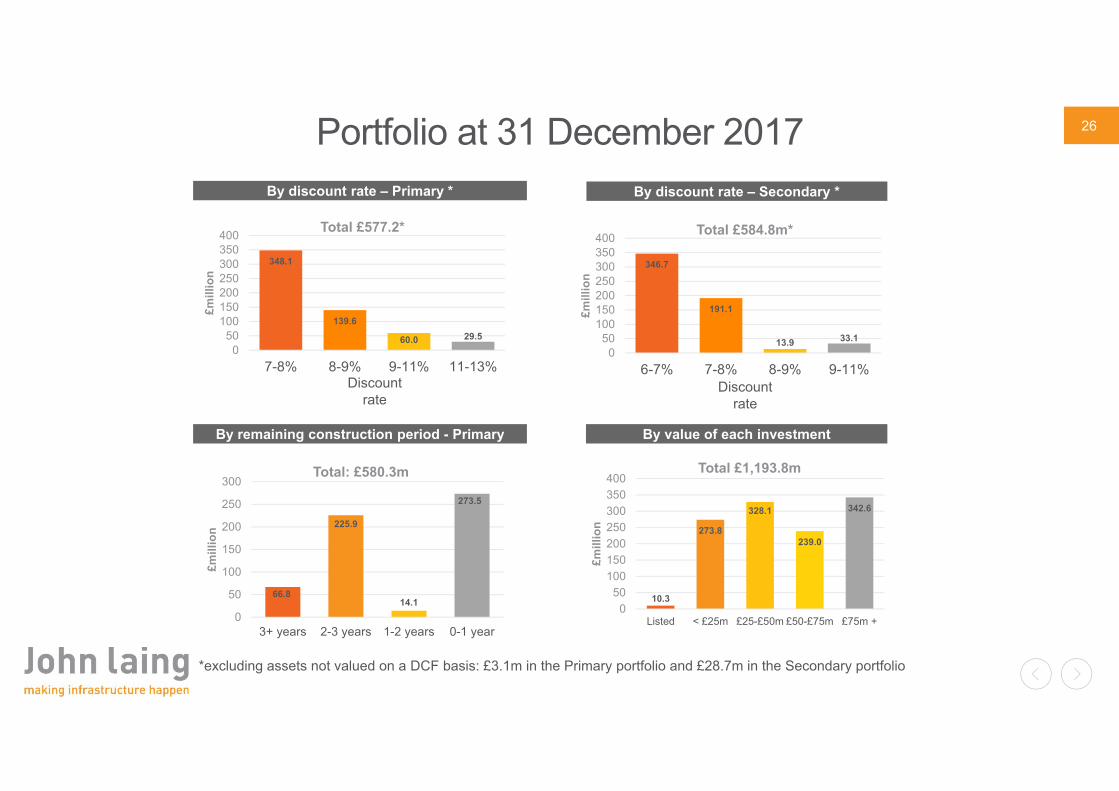
By remaining construction period - Primary
66.8
225.9
14.1
273.5
0
50
100
150
200
250
300
3+ years 2-3 years 1-2 years 0-1 year
£mill
ion
Total: £580.3m
By value of each investment
10.3
273.8
328.1
239.0
342.6
050
100150200250300350400
Listed < £25m £25-£50m £50-£75m £75m +
£mill
ion
Total £1,193.8m
By discount rate – Primary * By discount rate – Secondary *
*excluding assets not valued on a DCF basis: £3.1m in the Primary portfolio and £28.7m in the Secondary portfolio
Portfolio at 31 December 2017
346.7
191.1
13.9 33.10
50100150200250300350400
6-7% 7-8% 8-9% 9-11%
£mill
ion
Total £584.8m*
Discount rate
348.1
139.6
60.0 29.50
50100150200250300350400
7-8% 8-9% 9-11% 11-13%
£mill
ion
Total £577.2*
Discount rate
27
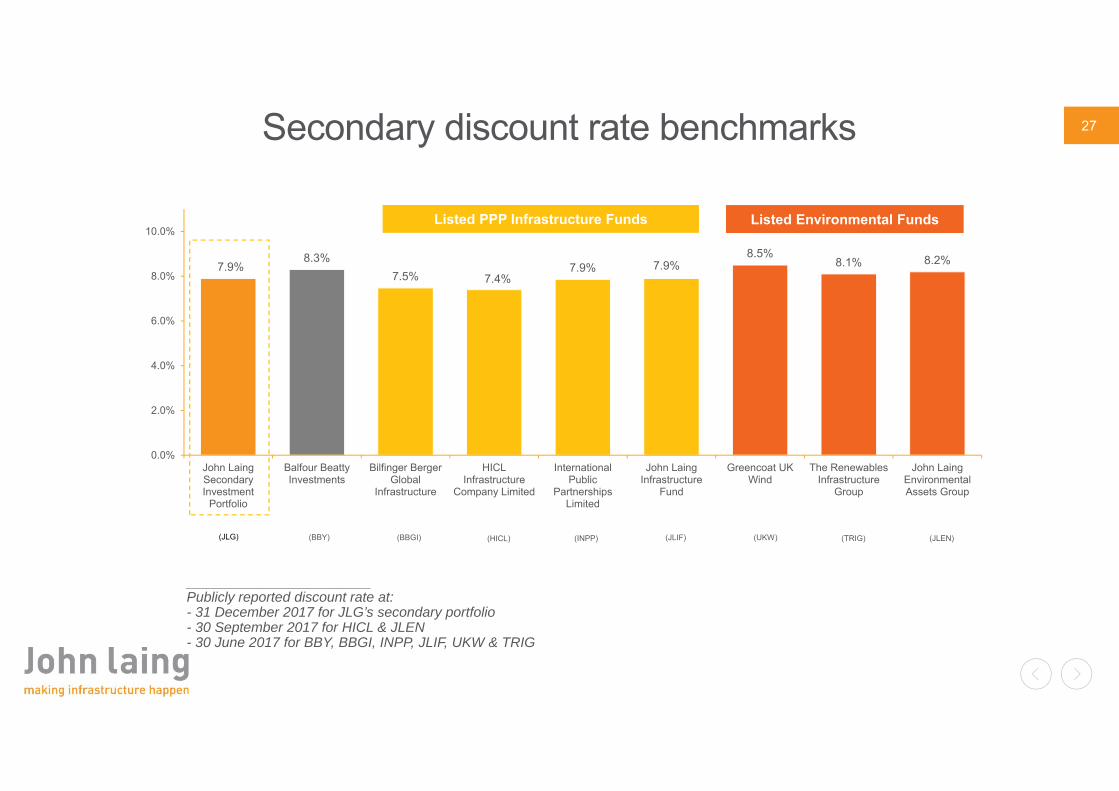
7.9%8.3%
7.5% 7.4%7.9% 7.9%
8.5%8.1% 8.2%
0.0%
2.0%
4.0%
6.0%
8.0%
10.0%
John LaingSecondaryInvestment
Portfolio
Balfour BeattyInvestments
Bilfinger BergerGlobal
Infrastructure
HICLInfrastructure
Company Limited
InternationalPublic
PartnershipsLimited
John LaingInfrastructure
Fund
Greencoat UKWind
The RenewablesInfrastructure
Group
John LaingEnvironmentalAssets Group
(JLG) (BBGI) (HICL) (INPP) (JLIF) (TRIG) (JLEN)
Listed PPP Infrastructure Funds Listed Environmental Funds
(BBY) (UKW)
___________________________Publicly reported discount rate at:- 31 December 2017 for JLG’s secondary portfolio- 30 September 2017 for HICL & JLEN- 30 June 2017 for BBY, BBGI, INPP, JLIF, UKW & TRIG
Secondary discount rate benchmarks
28
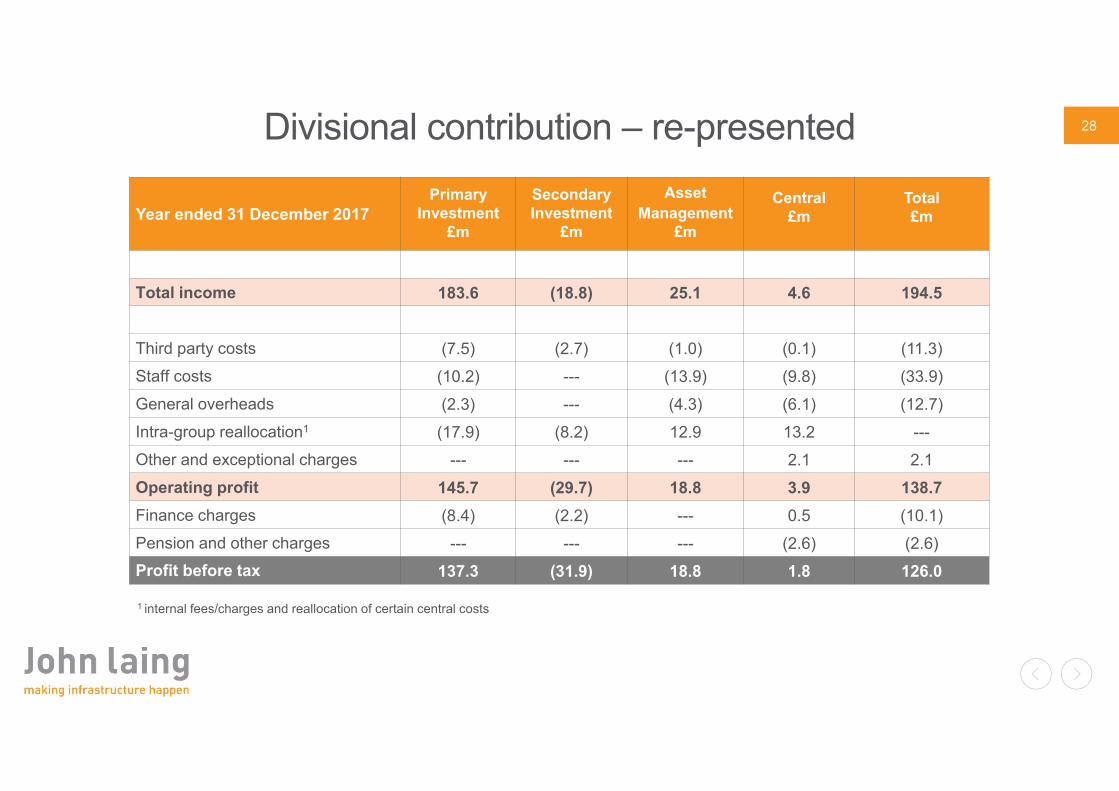
Year ended 31 December 2017Primary
Investment£m
Secondary Investment
£m
AssetManagement
£m
Central£m
Total£m
Total income 183.6 (18.8) 25.1 4.6 194.5
Third party costs (7.5) (2.7) (1.0) (0.1) (11.3)Staff costs (10.2) --- (13.9) (9.8) (33.9)General overheads (2.3) --- (4.3) (6.1) (12.7)Intra-group reallocation1 (17.9) (8.2) 12.9 13.2 ---Other and exceptional charges --- --- --- 2.1 2.1Operating profit 145.7 (29.7) 18.8 3.9 138.7Finance charges (8.4) (2.2) --- 0.5 (10.1)Pension and other charges --- --- --- (2.6) (2.6)Profit before tax 137.3 (31.9) 18.8 1.8 126.0
Divisional contribution – re-presented
1 internal fees/charges and reallocation of certain central costs
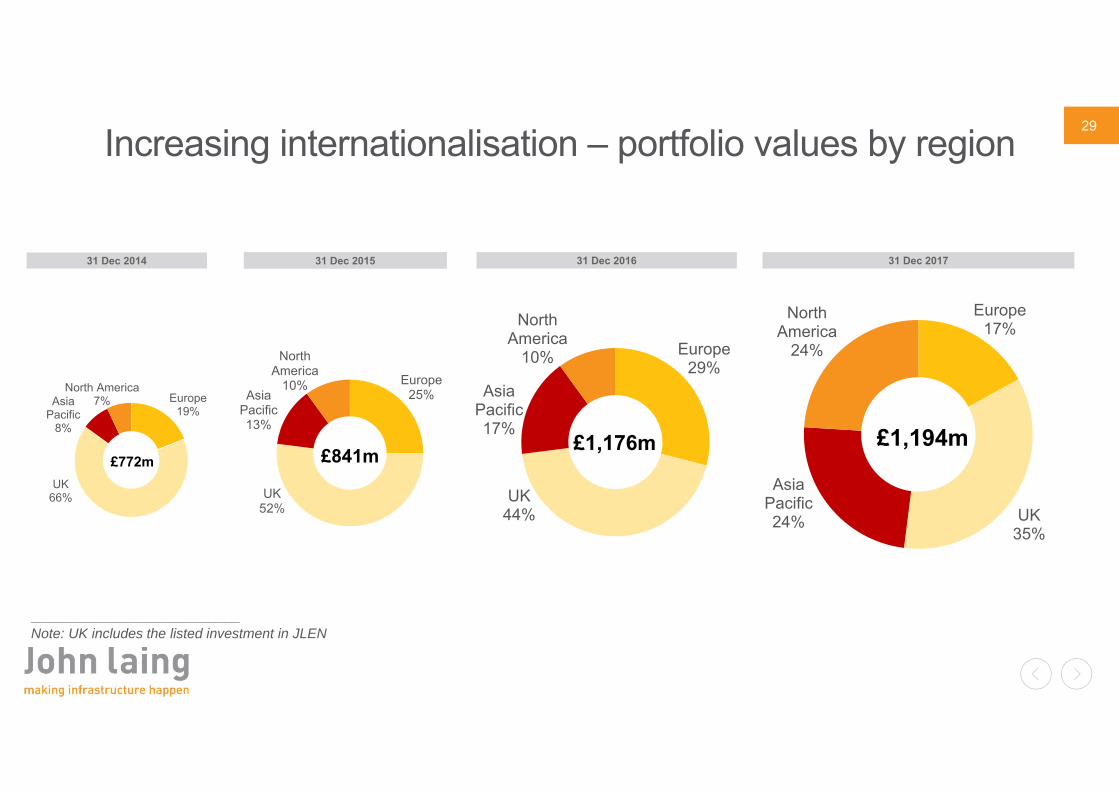
29Increasing internationalisation – portfolio values by region
31 Dec 2014 31 Dec 2015 31 Dec 2016 31 Dec 2017
Europe19%
UK66%
Asia Pacific
8%
North America7%
£772m
Europe25%
UK52%
Asia Pacific13%
North America
10%
£841m
Europe29%
UK44%
Asia Pacific17%
North America
10%
£1,176m
Europe17%
UK35%
Asia Pacific24%
North America
24%
£1,194m
___________________________Note: UK includes the listed investment in JLEN