Embed Size (px)
Citation preview
M1 LIMITED (Reg. No. 199206031W)
Full Year 2017 Financial Statement Announcement
TABLE OF CONTENTS Page No:
1(a) Consolidated Statement of Comprehensive Income 1
1(b) Statements of Financial Position 2
1(c) Consolidated Cash Flow Statement 3
1(d) Statements of Changes In Equity 4
1(e) Notes to Financial Statements 8
2(a) Negative Assurance 11
2(b) Audit / Review 11
3 Basis of Preparation 12
4 Accounting Policies 12
5 Earnings Per Share 12
6 Net Asset Value 12
7,8 Dividend 13
9 Significant Related Party Transactions 14
10 Interested Person Transactions 14
11 Review of Performance of the Group 14
12 Auditors’ Report 14
13 Review of Performance 15
14 Variance From Prospect Statement 22
15 Outlook 22
16,17 Segment Revenue and Results 23,24
18,19 Breakdown of Sales and Total Dividend 24
20 Disclosure under Rule 704(13) of the Listing Manual 24
21
Confirmation that the issuer has procured
undertakings from all its Directors and Executive
Officers
25
Notes:
(1) Numbers in all tables may not exactly add due to rounding.
Page 1 of 25
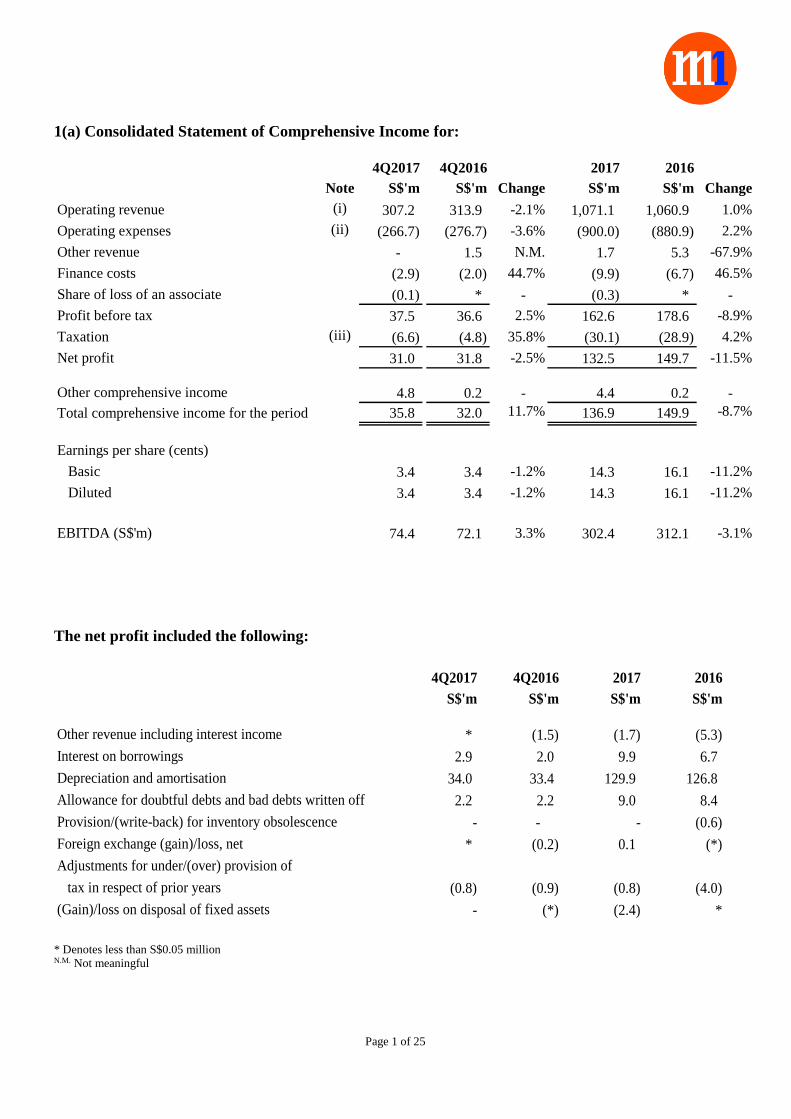
1(a) Consolidated Statement of Comprehensive Income for:
4Q2017 4Q2016 2017 2016
Note S$'m S$'m Change S$'m S$'m Change
Operating revenue (i) 307.2 313.9 -2.1% 1,071.1 1,060.9 1.0%
Operating expenses (ii) (266.7) (276.7) -3.6% (900.0) (880.9) 2.2%
Other revenue - 1.5 N.M. 1.7 5.3 -67.9%
Finance costs (2.9) (2.0) 44.7% (9.9) (6.7) 46.5%
Share of loss of an associate (0.1) * - (0.3) * -
Profit before tax 37.5 36.6 2.5% 162.6 178.6 -8.9%
Taxation (iii) (6.6) (4.8) 35.8% (30.1) (28.9) 4.2%
Net profit 31.0 31.8 -2.5% 132.5 149.7 -11.5%
Other comprehensive income 4.8 0.2 - 4.4 0.2 -
Total comprehensive income for the period 35.8 32.0 11.7% 136.9 149.9 -8.7%
Earnings per share (cents)
Basic 3.4 3.4 -1.2% 14.3 16.1 -11.2%
Diluted 3.4 3.4 -1.2% 14.3 16.1 -11.2%
EBITDA (S$'m) 74.4 72.1 3.3% 302.4 312.1 -3.1%
The net profit included the following:
4Q2017 4Q2016 2017 2016
S$'m S$'m S$'m S$'m
Other revenue including interest income * (1.5) (1.7) (5.3)
Interest on borrowings 2.9 2.0 9.9 6.7
Depreciation and amortisation 34.0 33.4 129.9 126.8
Allowance for doubtful debts and bad debts written off 2.2 2.2 9.0 8.4
Provision/(write-back) for inventory obsolescence - - - (0.6)
Foreign exchange (gain)/loss, net * (0.2) 0.1 (*)
Adjustments for under/(over) provision of
tax in respect of prior years
(Gain)/loss on disposal of fixed assets - (*) (2.4) *
(0.9)(0.8) (0.8) (4.0)
* Denotes less than S$0.05 million N.M. Not meaningful
Page 2 of 25
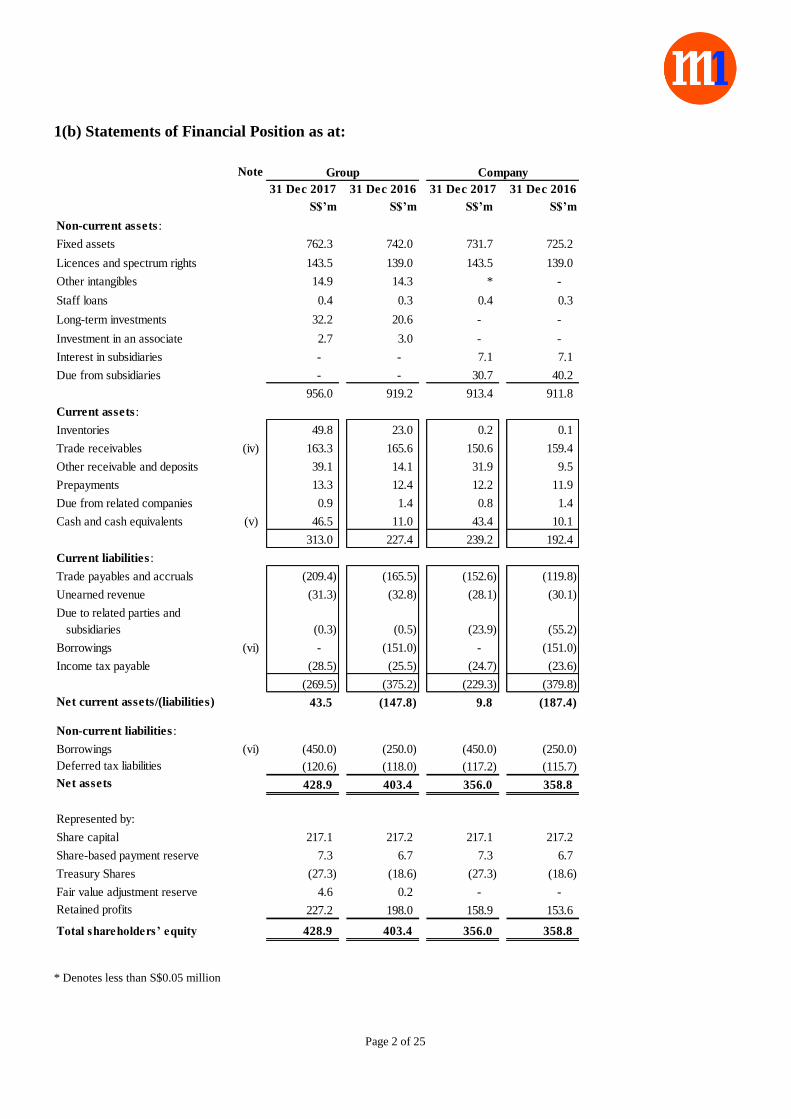
1(b) Statements of Financial Position as at:
* Denotes less than S$0.05 million
Note
31 Dec 2017 31 Dec 2016 31 Dec 2017 31 Dec 2016
S$’m S$’m S$’m S$’m
Non-current assets :
Fixed assets 762.3 742.0 731.7 725.2
Licences and spectrum rights 143.5 139.0 143.5 139.0
Other intangibles 14.9 14.3 * -
Staff loans 0.4 0.3 0.4 0.3
Long-term investments 32.2 20.6 - -
Investment in an associate 2.7 3.0 - -
Interest in subsidiaries - - 7.1 7.1
Due from subsidiaries - - 30.7 40.2
956.0 919.2 913.4 911.8
Current assets :
Inventories 49.8 23.0 0.2 0.1
Trade receivables (iv) 163.3 165.6 150.6 159.4
Other receivable and deposits 39.1 14.1 31.9 9.5
Prepayments 13.3 12.4 12.2 11.9
Due from related companies 0.9 1.4 0.8 1.4
Cash and cash equivalents (v) 46.5 11.0 43.4 10.1
313.0 227.4 239.2 192.4
Current liabilities :
Trade payables and accruals (209.4) (165.5) (152.6) (119.8)
Unearned revenue (31.3) (32.8) (28.1) (30.1)
Due to related parties and
subsidiaries (0.3) (0.5) (23.9) (55.2)
Borrowings (vi) - (151.0) - (151.0)
Income tax payable (28.5) (25.5) (24.7) (23.6)
(269.5) (375.2) (229.3) (379.8)
Net current assets/(liabilities) 43.5 (147.8) 9.8 (187.4)
Non-current liabilities :
Borrowings (vi) (450.0) (250.0) (450.0) (250.0)
Deferred tax liabilities (120.6) (118.0) (117.2) (115.7)
Net assets 428.9 403.4 356.0 358.8
Represented by:
Share capital 217.1 217.2 217.1 217.2
Share-based payment reserve 7.3 6.7 7.3 6.7
Treasury Shares (27.3) (18.6) (27.3) (18.6)
Fair value adjustment reserve 4.6 0.2 - -
Retained profits 227.2 198.0 158.9 153.6
Total shareholders’ equity 428.9 403.4 356.0 358.8
403.4 358.8
Group Company
Page 3 of 25
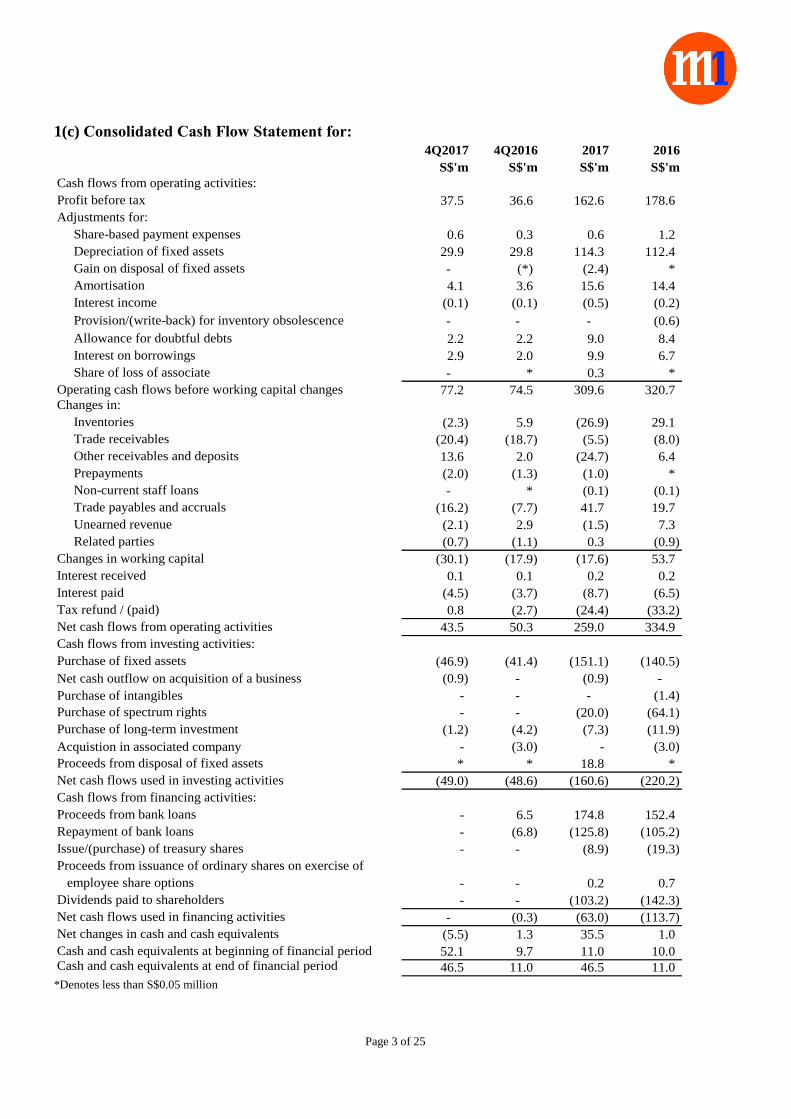
1(c) Consolidated Cash Flow Statement for:
4Q2017 4Q2016 2017 2016
S$'m S$'m S$'m S$'m
Cash flows from operating activities:
Profit before tax 37.5 36.6 162.6 178.6
Adjustments for:
Share-based payment expenses 0.6 0.3 0.6 1.2
Depreciation of fixed assets 29.9 29.8 114.3 112.4
Gain on disposal of fixed assets - (*) (2.4) *
Amortisation 4.1 3.6 15.6 14.4
Interest income (0.1) (0.1) (0.5) (0.2)
Provision/(write-back) for inventory obsolescence - - - (0.6)
Allowance for doubtful debts 2.2 2.2 9.0 8.4
Interest on borrowings 2.9 2.0 9.9 6.7
Share of loss of associate - * 0.3 *
Operating cash flows before working capital changes 77.2 74.5 309.6 320.7
Changes in:
Inventories (2.3) 5.9 (26.9) 29.1
Trade receivables (20.4) (18.7) (5.5) (8.0)
Other receivables and deposits 13.6 2.0 (24.7) 6.4
Prepayments (2.0) (1.3) (1.0) *
Non-current staff loans - * (0.1) (0.1)
Trade payables and accruals (16.2) (7.7) 41.7 19.7
Unearned revenue (2.1) 2.9 (1.5) 7.3
Related parties (0.7) (1.1) 0.3 (0.9)
Changes in working capital (30.1) (17.9) (17.6) 53.7
Interest received 0.1 0.1 0.2 0.2
Interest paid (4.5) (3.7) (8.7) (6.5)
Tax refund / (paid) 0.8 (2.7) (24.4) (33.2)
Net cash flows from operating activities 43.5 50.3 259.0 334.9
Cash flows from investing activities:
Purchase of fixed assets (46.9) (41.4) (151.1) (140.5)
Net cash outflow on acquisition of a business (0.9) - (0.9) -
Purchase of intangibles - - - (1.4)
Purchase of spectrum rights - - (20.0) (64.1)
Purchase of long-term investment (1.2) (4.2) (7.3) (11.9)
Acquistion in associated company - (3.0) - (3.0)
Proceeds from disposal of fixed assets * * 18.8 *
Net cash flows used in investing activities (49.0) (48.6) (160.6) (220.2)
Cash flows from financing activities:
Proceeds from bank loans - 6.5 174.8 152.4
Repayment of bank loans - (6.8) (125.8) (105.2)
Issue/(purchase) of treasury shares - - (8.9) (19.3)
Proceeds from issuance of ordinary shares on exercise of
employee share options - - 0.2 0.7
Dividends paid to shareholders - - (103.2) (142.3)
Net cash flows used in financing activities - (0.3) (63.0) (113.7)
Net changes in cash and cash equivalents (5.5) 1.3 35.5 1.0
Cash and cash equivalents at beginning of financial period 52.1 9.7 11.0 10.0 Cash and cash equivalents at end of financial period 46.5 11.0 46.5 11.0
*Denotes less than S$0.05 million
Page 4 of 25
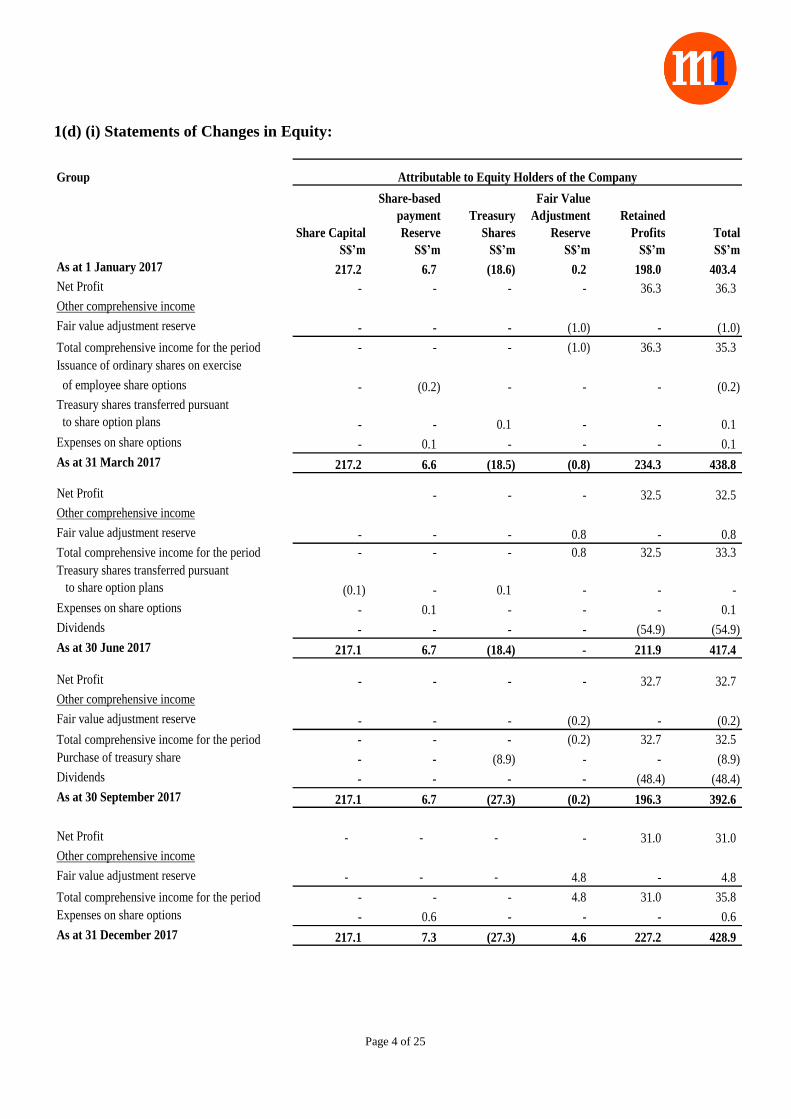
1(d) (i) Statements of Changes in Equity:
Group
Share Capital
Share-based
payment
Reserve
Treasury
Shares
Fair Value
Adjustment
Reserve
Retained
Profits Total
S$’m S$’m S$’m S$’m S$’m S$’m
As at 1 January 2017 217.2 6.7 (18.6) 0.2 198.0 403.4
Net Profit - - - - 36.3 36.3
Other comprehensive income
Fair value adjustment reserve - - - (1.0) - (1.0)
Total comprehensive income for the period - - - (1.0) 36.3 35.3
Issuance of ordinary shares on exercise
of employee share options - (0.2) - - - (0.2)
Treasury shares transferred pursuant
to share option plans - - 0.1 - - 0.1
Expenses on share options - 0.1 - - - 0.1
As at 31 March 2017 217.2 6.6 (18.5) (0.8) 234.3 438.8
Net Profit - - - 32.5 32.5
Other comprehensive income
Fair value adjustment reserve - - - 0.8 - 0.8
Total comprehensive income for the period - - - 0.8 32.5 33.3
Treasury shares transferred pursuant
to share option plans (0.1) - 0.1 - - -
Expenses on share options - 0.1 - - - 0.1
Dividends - - - - (54.9) (54.9)
As at 30 June 2017 217.1 6.7 (18.4) - 211.9 417.4
Net Profit - - - - 32.7 32.7
Other comprehensive income
Fair value adjustment reserve - - - (0.2) - (0.2)
Total comprehensive income for the period - - - (0.2) 32.7 32.5
Purchase of treasury share - - (8.9) - - (8.9)
Dividends - - - - (48.4) (48.4)
As at 30 September 2017 217.1 6.7 (27.3) (0.2) 196.3 392.6
Net Profit - - - - 31.0 31.0
Other comprehensive income
Fair value adjustment reserve - - - 4.8 - 4.8
Total comprehensive income for the period - - - 4.8 31.0 35.8
Expenses on share options - 0.6 - - - 0.6
As at 31 December 2017 217.1 7.3 (27.3) 4.6 227.2 428.9
Attributable to Equity Holders of the Company
Page 5 of 25
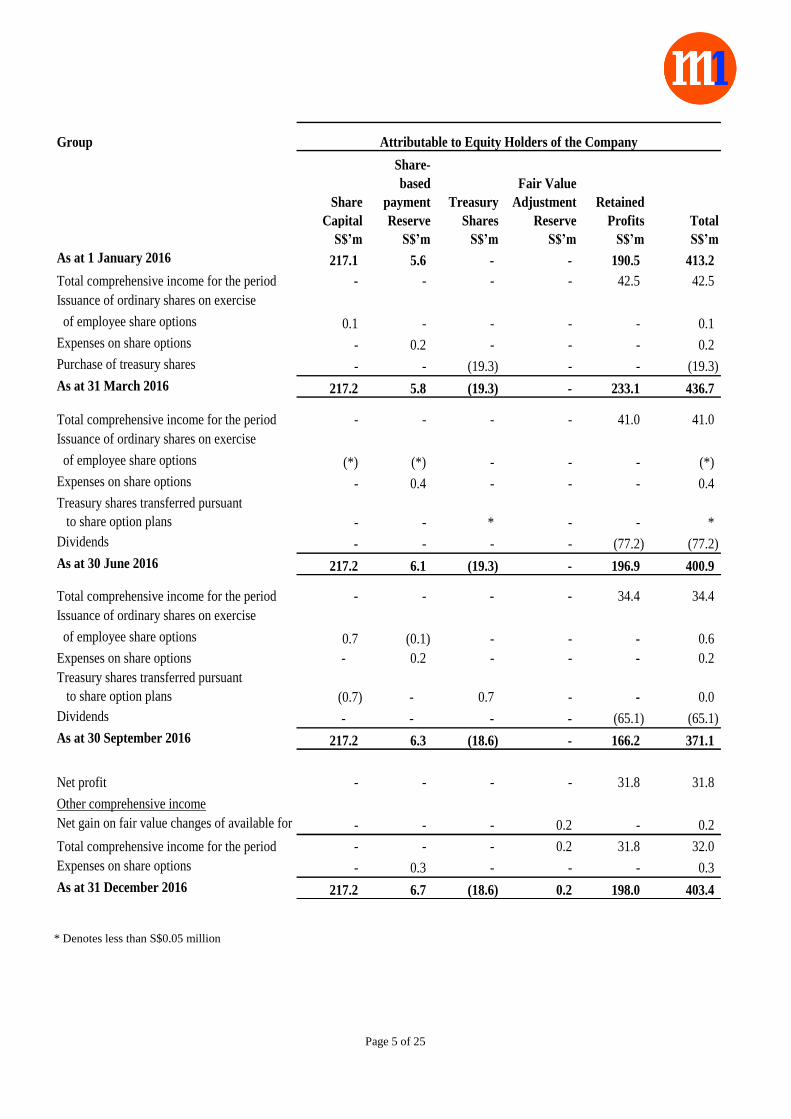
Group
Share
Capital
Share-
based
payment
Reserve
Treasury
Shares
Fair Value
Adjustment
Reserve
Retained
Profits Total
S$’m S$’m S$’m S$’m S$’m S$’m
As at 1 January 2016 217.1 5.6 - - 190.5 413.2
Total comprehensive income for the period - - - - 42.5 42.5
Issuance of ordinary shares on exercise
of employee share options 0.1 - - - - 0.1
Expenses on share options - 0.2 - - - 0.2
Purchase of treasury shares - - (19.3) - - (19.3)
As at 31 March 2016 217.2 5.8 (19.3) - 233.1 436.7
Total comprehensive income for the period - - - - 41.0 41.0
Issuance of ordinary shares on exercise
of employee share options (*) (*) - - - (*)
Expenses on share options - 0.4 - - - 0.4
Treasury shares transferred pursuant
to share option plans - - * - - *
Dividends - - - - (77.2) (77.2)
As at 30 June 2016 217.2 6.1 (19.3) - 196.9 400.9
Total comprehensive income for the period - - - - 34.4 34.4
Issuance of ordinary shares on exercise
of employee share options -
Expenses on share options - 0.2 - - - 0.2
Treasury shares transferred pursuant
to share option plans (0.7) - 0.7 - - 0.0
Dividends - - - - (65.1) (65.1)
As at 30 September 2016 217.2 6.3 (18.6) - 166.2 371.1
Net profit - - - - 31.8 31.8
Other comprehensive income
Net gain on fair value changes of available for
sale financial assets- - - 0.2 - 0.2
Total comprehensive income for the period - - - 0.2 31.8 32.0
Expenses on share options - 0.3 - - - 0.3
As at 31 December 2016 217.2 6.7 (18.6) 0.2 198.0 403.4
-
Attributable to Equity Holders of the Company
0.60.7 (0.1) -
* Denotes less than S$0.05 million
Page 6 of 25
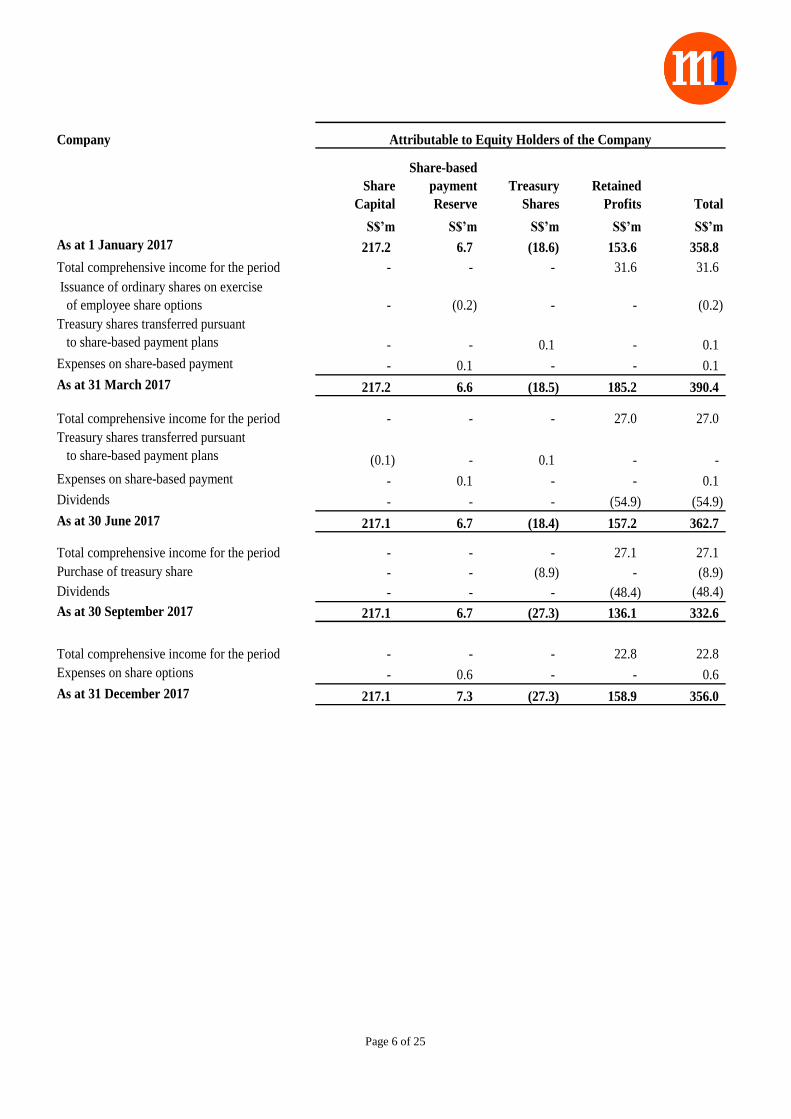
Company
Share
Capital
Share-based
payment
Reserve
Treasury
Shares
Retained
Profits Total
S$’m S$’m S$’m S$’m S$’m
As at 1 January 2017 217.2 6.7 (18.6) 153.6 358.8
Total comprehensive income for the period - - - 31.6 31.6
Issuance of ordinary shares on exercise
of employee share options - (0.2) - - (0.2)
Treasury shares transferred pursuant
to share-based payment plans - - 0.1 - 0.1
Expenses on share-based payment - 0.1 - - 0.1
As at 31 March 2017 217.2 6.6 (18.5) 185.2 390.4
Total comprehensive income for the period - - - 27.0 27.0
Treasury shares transferred pursuant
to share-based payment plans (0.1) - 0.1 - -
Expenses on share-based payment - 0.1 - - 0.1
Dividends - - - (54.9) (54.9)
As at 30 June 2017 217.1 6.7 (18.4) 157.2 362.7
Total comprehensive income for the period - - - 27.1 27.1
Purchase of treasury share - - (8.9) - (8.9)
Dividends - - - (48.4) (48.4)
As at 30 September 2017 217.1 6.7 (27.3) 136.1 332.6
Total comprehensive income for the period - - - 22.8 22.8
Expenses on share options - 0.6 - - 0.6
As at 31 December 2017 217.1 7.3 (27.3) 158.9 356.0
Attributable to Equity Holders of the Company
Page 7 of 25
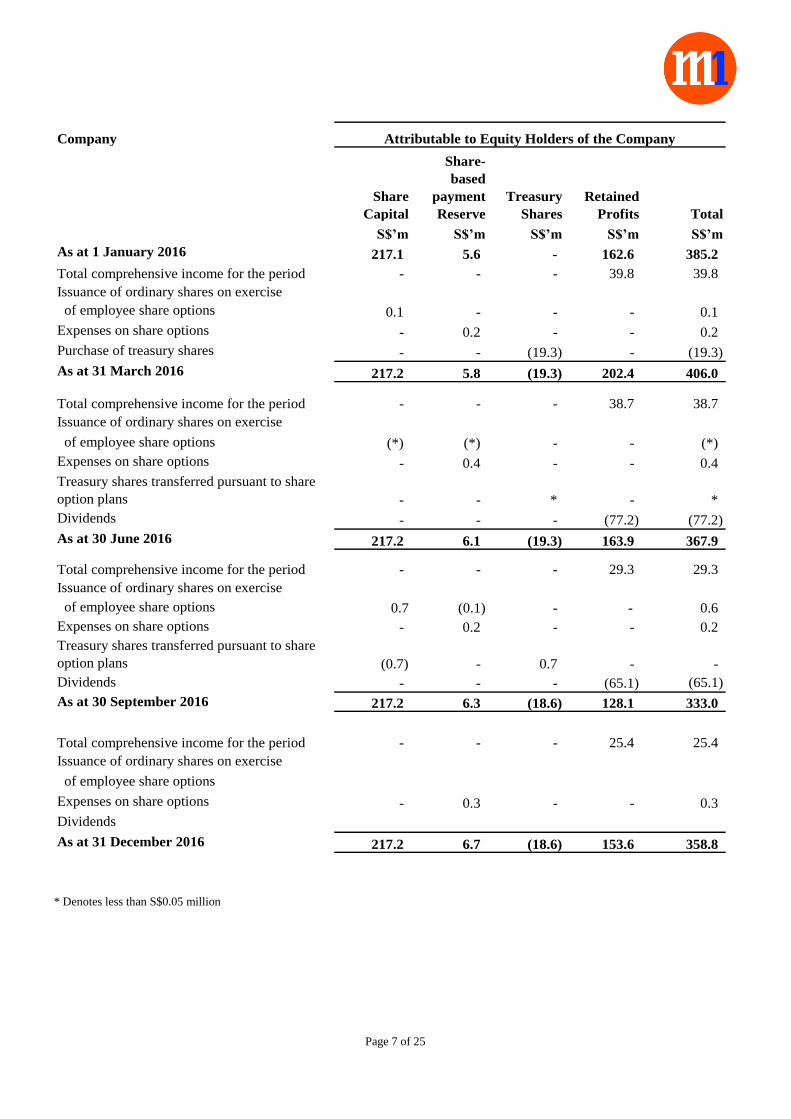
Company
Share
Capital
Share-
based
payment
Reserve
Treasury
Shares
Retained
Profits Total
S$’m S$’m S$’m S$’m S$’m
As at 1 January 2016 217.1 5.6 - 162.6 385.2
Total comprehensive income for the period - - - 39.8 39.8
Issuance of ordinary shares on exercise
of employee share options 0.1 - - - 0.1
Expenses on share options - 0.2 - - 0.2
Purchase of treasury shares - - (19.3) - (19.3)
As at 31 March 2016 217.2 5.8 (19.3) 202.4 406.0
Total comprehensive income for the period - - - 38.7 38.7
Issuance of ordinary shares on exercise
of employee share options (*) (*) - - (*)
Expenses on share options - 0.4 - - 0.4
Treasury shares transferred pursuant to share
option plans - - * - *
Dividends - - - (77.2) (77.2)
As at 30 June 2016 217.2 6.1 (19.3) 163.9 367.9
Total comprehensive income for the period - - - 29.3 29.3
Issuance of ordinary shares on exercise
of employee share options
Expenses on share options - 0.2 - - 0.2
Treasury shares transferred pursuant to share
option plans (0.7) - 0.7 - -
Dividends - - - (65.1) (65.1)
As at 30 September 2016 217.2 6.3 (18.6) 128.1 333.0
Total comprehensive income for the period - - - 25.4 25.4
Issuance of ordinary shares on exercise
of employee share options
Expenses on share options - 0.3 - - 0.3
Dividends
As at 31 December 2016 217.2 6.7 (18.6) 153.6 358.8
0.7 (0.1) - - 0.6
Attributable to Equity Holders of the Company
* Denotes less than S$0.05 million
Page 8 of 25
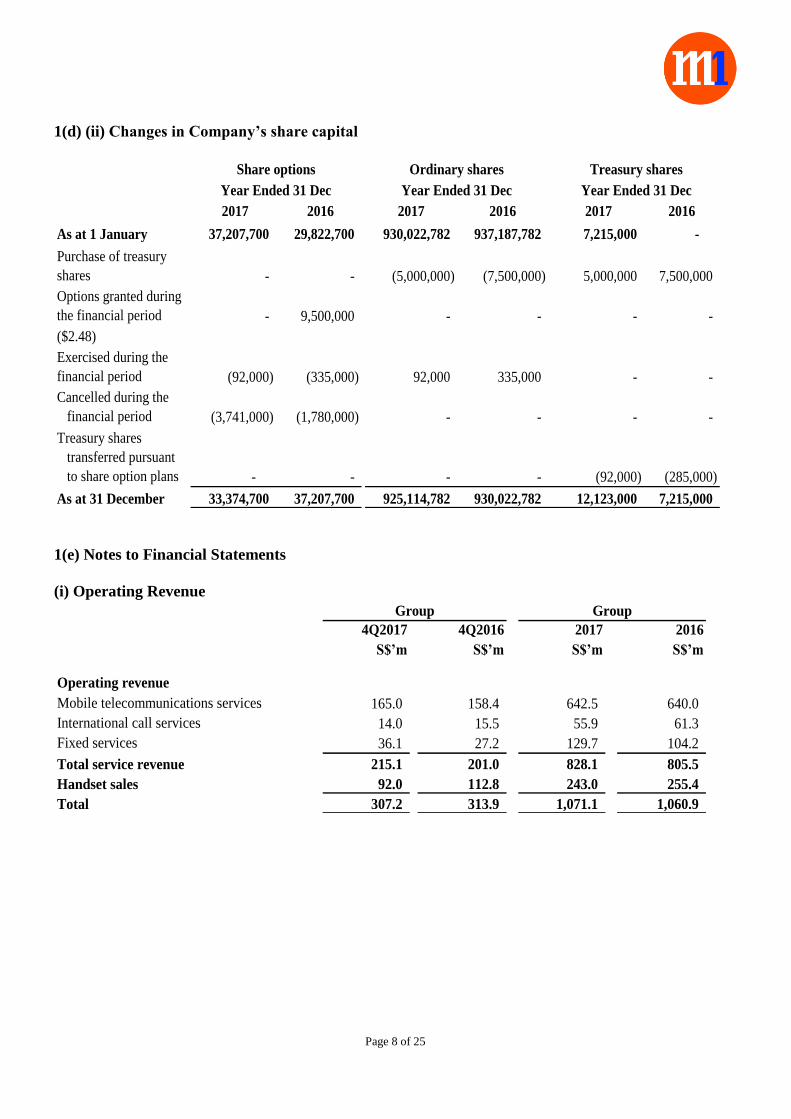
1(d) (ii) Changes in Company’s share capital
2017 2016 2017 2016 2017 2016
As at 1 January 37,207,700 29,822,700 930,022,782 937,187,782 7,215,000 -
Purchase of treasury
shares - - (5,000,000) (7,500,000) 5,000,000 7,500,000
Options granted during
the financial period - 9,500,000 - - - -
($2.48)
Exercised during the
financial period (92,000) (335,000) 92,000 335,000 - -
Cancelled during the
financial period (3,741,000) (1,780,000) - - - -
Treasury shares
transferred pursuant
to share option plans - - - - (92,000) (285,000)
As at 31 December 33,374,700 37,207,700 925,114,782 930,022,782 12,123,000 7,215,000
Share options Ordinary shares
Year Ended 31 Dec Year Ended 31 Dec
Treasury shares
Year Ended 31 Dec
1(e) Notes to Financial Statements
(i) Operating Revenue
4Q2017 4Q2016 2017 2016
S$’m S$’m S$’m S$’m
Operating revenue
Mobile telecommunications services 165.0 158.4 642.5 640.0
International call services 14.0 15.5 55.9 61.3
Fixed services 36.1 27.2 129.7 104.2
Total service revenue 215.1 201.0 828.1 805.5
Handset sales 92.0 112.8 243.0 255.4
Total 307.2 313.9 1,071.1 1,060.9
Group Group
Page 9 of 25
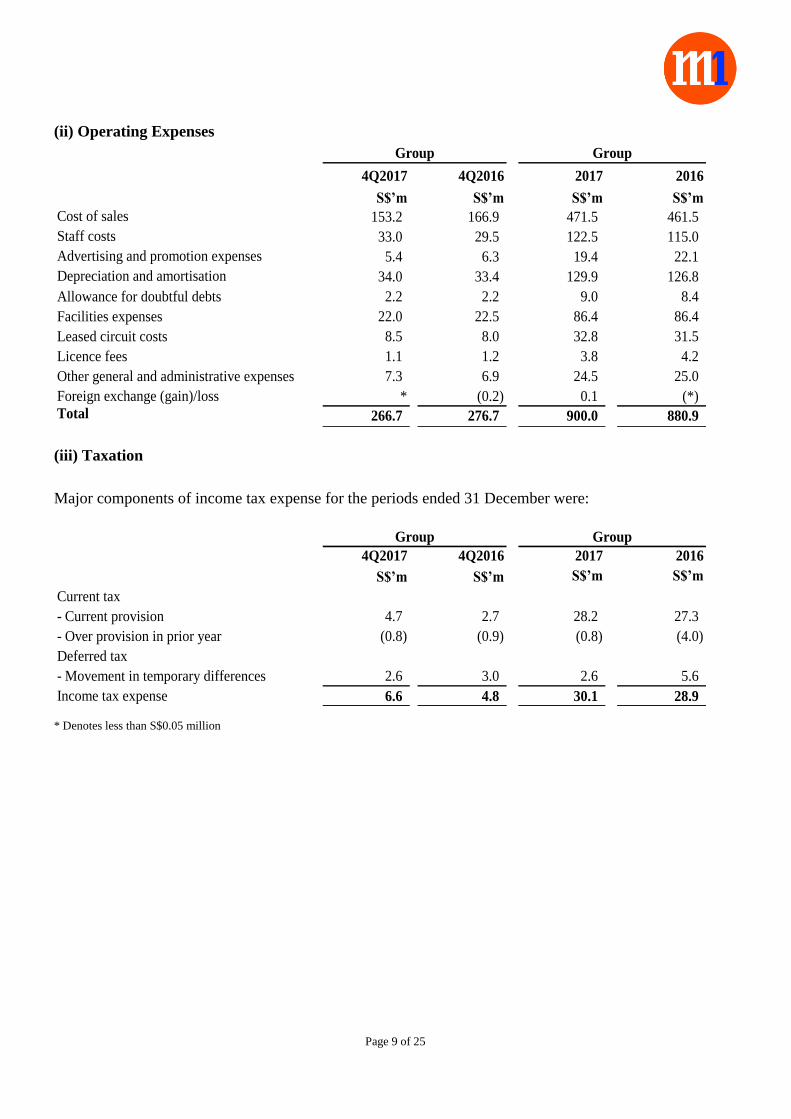
(ii) Operating Expenses
4Q2017 4Q2016 2017 2016
S$’m S$’m S$’m S$’m
Cost of sales 153.2 166.9 471.5 461.5
Staff costs 33.0 29.5 122.5 115.0
Advertising and promotion expenses 5.4 6.3 19.4 22.1
Depreciation and amortisation 34.0 33.4 129.9 126.8
Allowance for doubtful debts 2.2 2.2 9.0 8.4
Facilities expenses 22.0 22.5 86.4 86.4
Leased circuit costs 8.5 8.0 32.8 31.5
Licence fees 1.1 1.2 3.8 4.2
Other general and administrative expenses 7.3 6.9 24.5 25.0
Foreign exchange (gain)/loss * (0.2) 0.1 (*)
Total 266.7 276.7 900.0 880.9
Group Group
(iii) Taxation
Major components of income tax expense for the periods ended 31 December were:
4Q2017 4Q2016 2017 2016
S$’m S$’m S$’m S$’m
Current tax
- Current provision 4.7 2.7 28.2 27.3
- Over provision in prior year (0.8) (0.9) (0.8) (4.0)
Deferred tax
- Movement in temporary differences 2.6 3.0 2.6 5.6
Income tax expense 6.6 4.8 30.1 28.9
Group Group
* Denotes less than S$0.05 million
Page 10 of 25
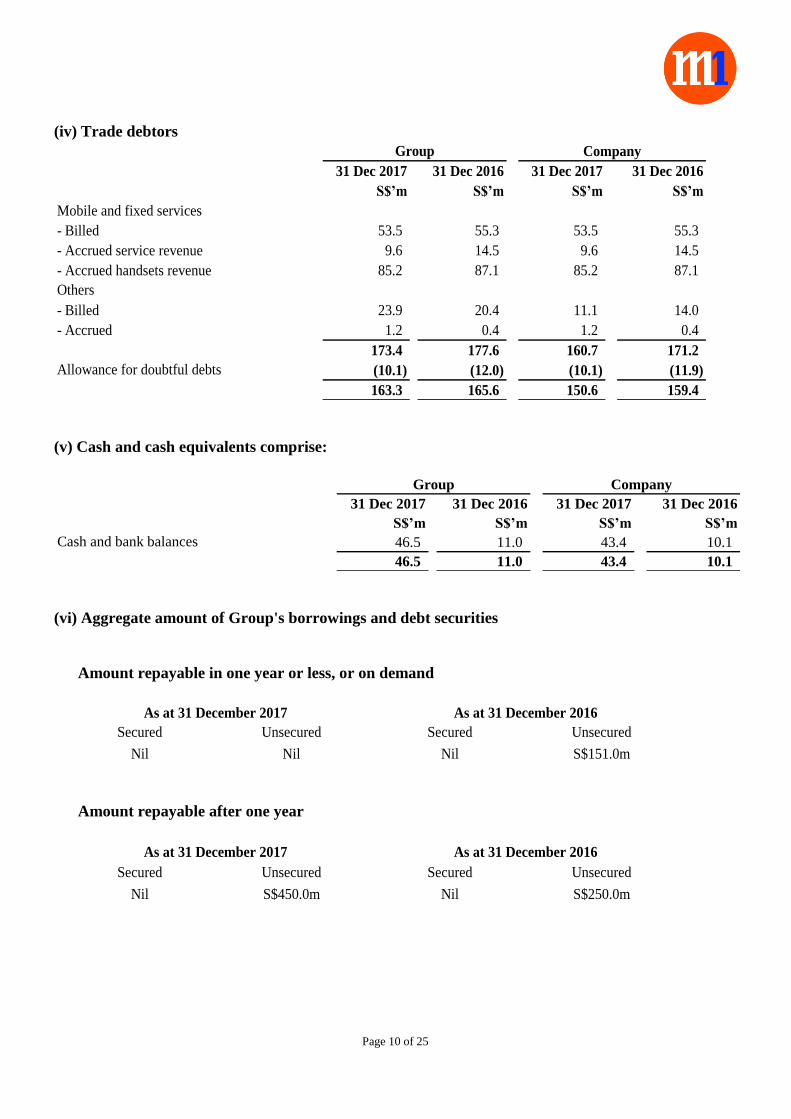
(iv) Trade debtors
31 Dec 2017 31 Dec 2016 31 Dec 2017 31 Dec 2016
S$’m S$’m S$’m S$’m
Mobile and fixed services
- Billed 53.5 55.3 53.5 55.3
- Accrued service revenue 9.6 14.5 9.6 14.5
- Accrued handsets revenue 85.2 87.1 85.2 87.1
Others
- Billed 23.9 20.4 11.1 14.0
- Accrued 1.2 0.4 1.2 0.4
173.4 177.6 160.7 171.2
Allowance for doubtful debts (10.1) (12.0) (10.1) (11.9)
163.3 165.6 150.6 159.4
Group Company
(v) Cash and cash equivalents comprise:
31 Dec 2017 31 Dec 2016 31 Dec 2017 31 Dec 2016
S$’m S$’m S$’m S$’m
Cash and bank balances 46.5 11.0 43.4 10.1
46.5 11.0 43.4 10.1
Group Company
(vi) Aggregate amount of Group's borrowings and debt securities
Amount repayable in one year or less, or on demand
Secured Unsecured Secured Unsecured
Nil Nil Nil S$151.0m
As at 31 December 2017 As at 31 December 2016
Amount repayable after one year
Secured Unsecured Secured Unsecured
Nil S$450.0m Nil S$250.0m
As at 31 December 2017 As at 31 December 2016
Page 11 of 25
Details of any collateral
None.
The $450 million long term loan comprises:-
(a) $250 million long term loan that was refinanced in May 2016 at an effective interest rate of 2.65%
per annum and is repayable in full in May 2021.
(b) $200 million long term loans with an effective interest rate at 2.45% per annum and are repayable
in full by July 2020.
2(a) NEGATIVE ASSURANCE
We, DANNY TEOH LEONG KAY and KAREN KOOI, being two directors of M1 Limited (the
“Company”) do hereby confirm on behalf of the directors of the Company that, to the best of their
knowledge, nothing has come to the attention of the board of directors of the Company that may render
the Fourth Quarter and Full Year Ended 31 December 2017 financial results to be false or misleading.
On behalf of the directors
DANNY TEOH LEONG KAY KAREN KOOI
Director Director
Singapore
23 January 2018
2(b) AUDIT/ REVIEW
The figures have not been audited or reviewed in accordance with Singapore Standard on Review
Engagements (“SSRE”) 2410.
Page 12 of 25
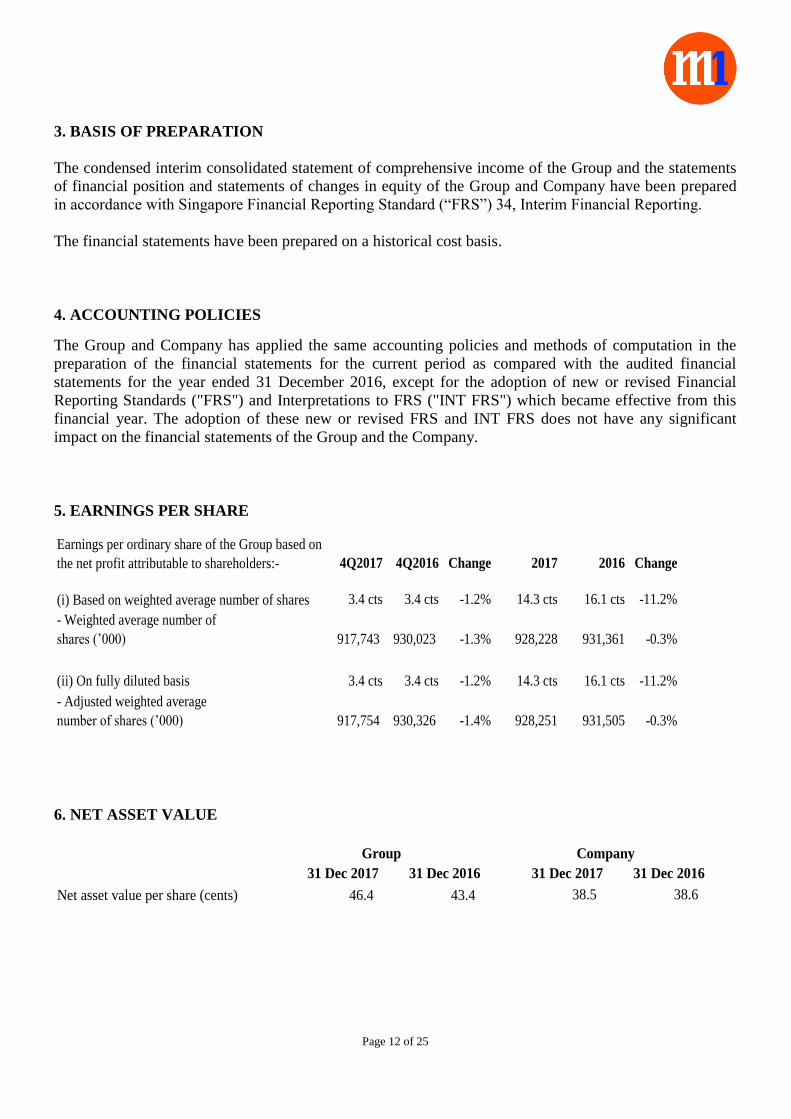
3. BASIS OF PREPARATION
The condensed interim consolidated statement of comprehensive income of the Group and the statements
of financial position and statements of changes in equity of the Group and Company have been prepared
in accordance with Singapore Financial Reporting Standard (“FRS”) 34, Interim Financial Reporting.
The financial statements have been prepared on a historical cost basis.
4. ACCOUNTING POLICIES
The Group and Company has applied the same accounting policies and methods of computation in the
preparation of the financial statements for the current period as compared with the audited financial
statements for the year ended 31 December 2016, except for the adoption of new or revised Financial
Reporting Standards ("FRS") and Interpretations to FRS ("INT FRS") which became effective from this
financial year. The adoption of these new or revised FRS and INT FRS does not have any significant
impact on the financial statements of the Group and the Company.
5. EARNINGS PER SHARE
Earnings per ordinary share of the Group based on
the net profit attributable to shareholders:- 4Q2017 4Q2016 Change 2017 2016 Change
3.4 cts 3.4 cts -1.2% 14.3 cts 16.1 cts -11.2%
- Weighted average number of
shares (’000) 917,743 930,023 -1.3% 928,228 931,361 -0.3%
(ii) On fully diluted basis 3.4 cts 3.4 cts -1.2% 14.3 cts 16.1 cts -11.2%
- Adjusted weighted average
number of shares (’000) 917,754 930,326 -1.4% 928,251 931,505 -0.3%
(i) Based on weighted average number of shares
6. NET ASSET VALUE
31 Dec 2017 31 Dec 2016 31 Dec 2017 31 Dec 2016
Net asset value per share (cents) 46.4 43.4 38.5 38.6
Group Company
Page 13 of 25
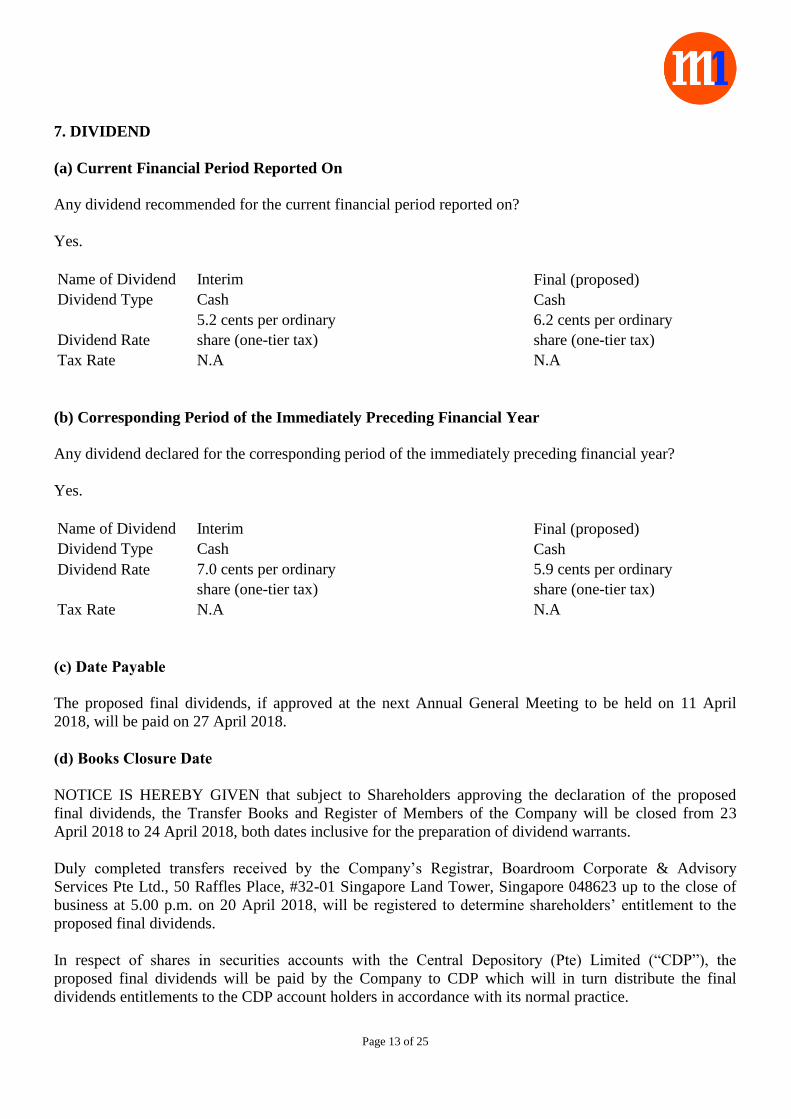
7. DIVIDEND
(a) Current Financial Period Reported On
Any dividend recommended for the current financial period reported on?
Yes.
Name of Dividend Interim Final (proposed)
Dividend Type Cash Cash
Dividend Rate
5.2 cents per ordinary
share (one-tier tax)
6.2 cents per ordinary
share (one-tier tax)
Tax Rate N.A N.A
(b) Corresponding Period of the Immediately Preceding Financial Year
Any dividend declared for the corresponding period of the immediately preceding financial year?
Yes.
Name of Dividend Interim Final (proposed)
Dividend Type Cash Cash
Dividend Rate 7.0 cents per ordinary
share (one-tier tax)
5.9 cents per ordinary
share (one-tier tax)
Tax Rate N.A N.A
(c) Date Payable
The proposed final dividends, if approved at the next Annual General Meeting to be held on 11 April
2018, will be paid on 27 April 2018.
(d) Books Closure Date
NOTICE IS HEREBY GIVEN that subject to Shareholders approving the declaration of the proposed
final dividends, the Transfer Books and Register of Members of the Company will be closed from 23
April 2018 to 24 April 2018, both dates inclusive for the preparation of dividend warrants.
Duly completed transfers received by the Company’s Registrar, Boardroom Corporate & Advisory
Services Pte Ltd., 50 Raffles Place, #32-01 Singapore Land Tower, Singapore 048623 up to the close of
business at 5.00 p.m. on 20 April 2018, will be registered to determine shareholders’ entitlement to the
proposed final dividends.
In respect of shares in securities accounts with the Central Depository (Pte) Limited (“CDP”), the
proposed final dividends will be paid by the Company to CDP which will in turn distribute the final
dividends entitlements to the CDP account holders in accordance with its normal practice.
Page 14 of 25
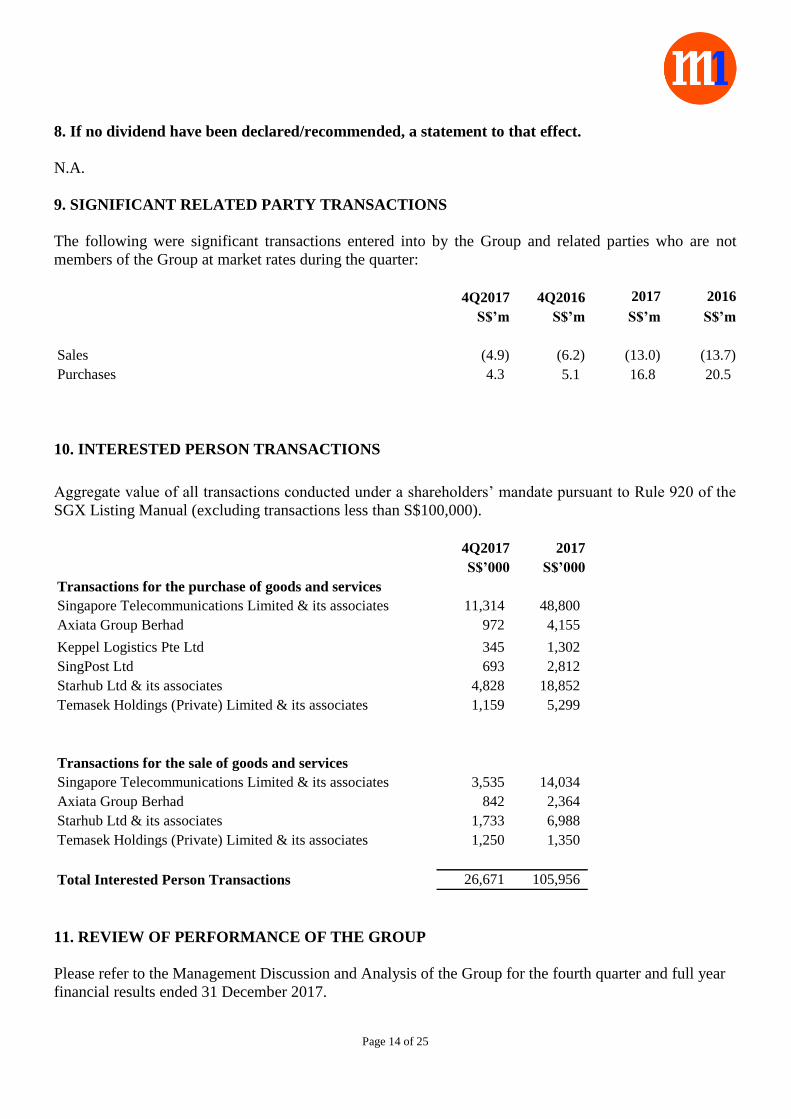
8. If no dividend have been declared/recommended, a statement to that effect.
N.A.
9. SIGNIFICANT RELATED PARTY TRANSACTIONS
The following were significant transactions entered into by the Group and related parties who are not
members of the Group at market rates during the quarter:
4Q2017 4Q2016 2017 2016
S$’m S$’m S$’m S$’m
Sales (4.9) (6.2) (13.0) (13.7)
Purchases 4.3 5.1 16.8 20.5
10. INTERESTED PERSON TRANSACTIONS
Aggregate value of all transactions conducted under a shareholders’ mandate pursuant to Rule 920 of the
SGX Listing Manual (excluding transactions less than S$100,000).
4Q2017 2017
S$’000 S$’000
Transactions for the purchase of goods and services
Singapore Telecommunications Limited & its associates 11,314 48,800
Axiata Group Berhad 972 4,155
Keppel Logistics Pte Ltd 345 1,302
SingPost Ltd 693 2,812
Starhub Ltd & its associates 4,828 18,852
Temasek Holdings (Private) Limited & its associates 1,159 5,299
Transactions for the sale of goods and services
Singapore Telecommunications Limited & its associates 3,535 14,034
Axiata Group Berhad 842 2,364
Starhub Ltd & its associates 1,733 6,988
Temasek Holdings (Private) Limited & its associates 1,250 1,350
Total Interested Person Transactions 26,671 105,956
11. REVIEW OF PERFORMANCE OF THE GROUP
Please refer to the Management Discussion and Analysis of the Group for the fourth quarter and full year
financial results ended 31 December 2017.
Page 15 of 25
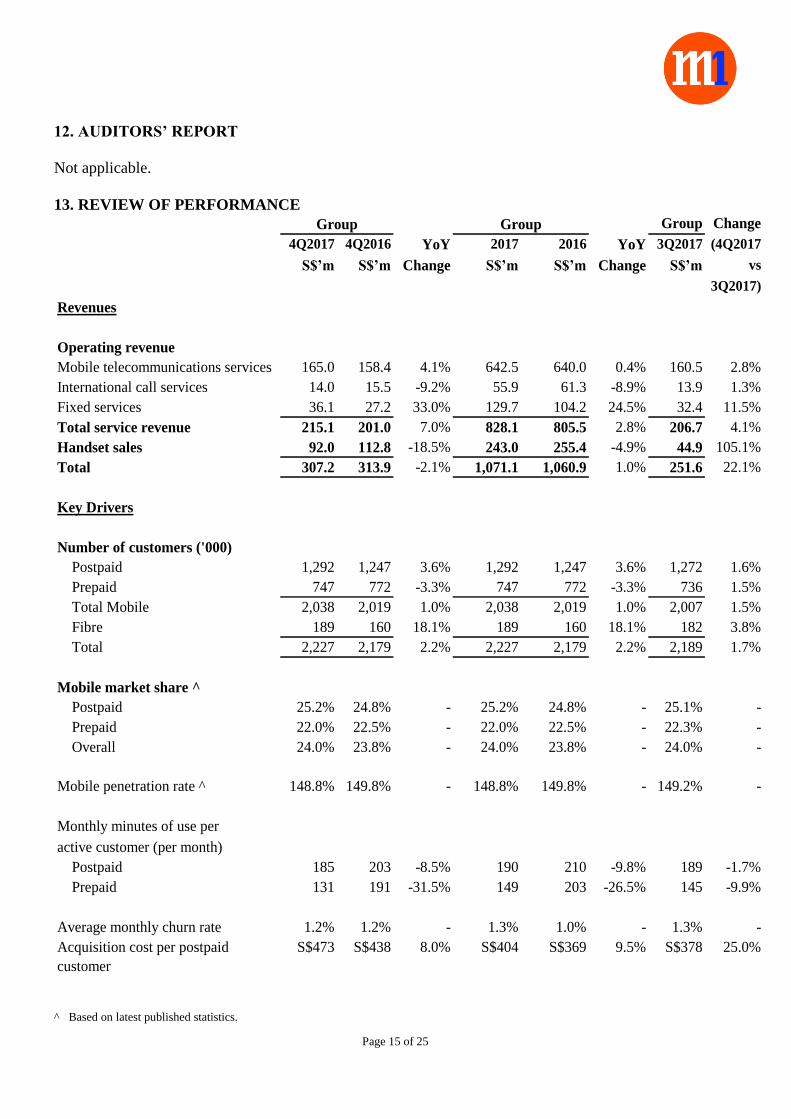
12. AUDITORS’ REPORT
Not applicable.
13. REVIEW OF PERFORMANCE
Group Change
4Q2017 4Q2016 YoY 2017 2016 YoY 3Q2017 (4Q2017
S$’m S$’m Change S$’m S$’m Change S$’m vs
3Q2017)
Revenues
Operating revenue
Mobile telecommunications services 165.0 158.4 4.1% 642.5 640.0 0.4% 160.5 2.8%
International call services 14.0 15.5 -9.2% 55.9 61.3 -8.9% 13.9 1.3%
Fixed services 36.1 27.2 33.0% 129.7 104.2 24.5% 32.4 11.5%
Total service revenue 215.1 201.0 7.0% 828.1 805.5 2.8% 206.7 4.1%
Handset sales 92.0 112.8 -18.5% 243.0 255.4 -4.9% 44.9 105.1%
Total 307.2 313.9 -2.1% 1,071.1 1,060.9 1.0% 251.6 22.1%
Key Drivers
Number of customers ('000)
Postpaid 1,292 1,247 3.6% 1,292 1,247 3.6% 1,272 1.6%
Prepaid 747 772 -3.3% 747 772 -3.3% 736 1.5%
Total Mobile 2,038 2,019 1.0% 2,038 2,019 1.0% 2,007 1.5%
Fibre 189 160 18.1% 189 160 18.1% 182 3.8%
Total 2,227 2,179 2.2% 2,227 2,179 2.2% 2,189 1.7%
Mobile market share ^
Postpaid 25.2% 24.8% - 25.2% 24.8% - 25.1% -
Prepaid 22.0% 22.5% - 22.0% 22.5% - 22.3% -
Overall 24.0% 23.8% - 24.0% 23.8% - 24.0% -
Mobile penetration rate ^ 148.8% 149.8% - 148.8% 149.8% - 149.2% -
Monthly minutes of use per
active customer (per month)
Postpaid 185 203 -8.5% 190 210 -9.8% 189 -1.7%
Prepaid 131 191 -31.5% 149 203 -26.5% 145 -9.9%
Average monthly churn rate 1.2% 1.2% - 1.3% 1.0% - 1.3% -
Acquisition cost per postpaid
customer
9.5% 25.0%
Group
S$473 S$438 S$369 S$404 8.0%
Group
S$378
^ Based on latest published statistics.
Page 16 of 25
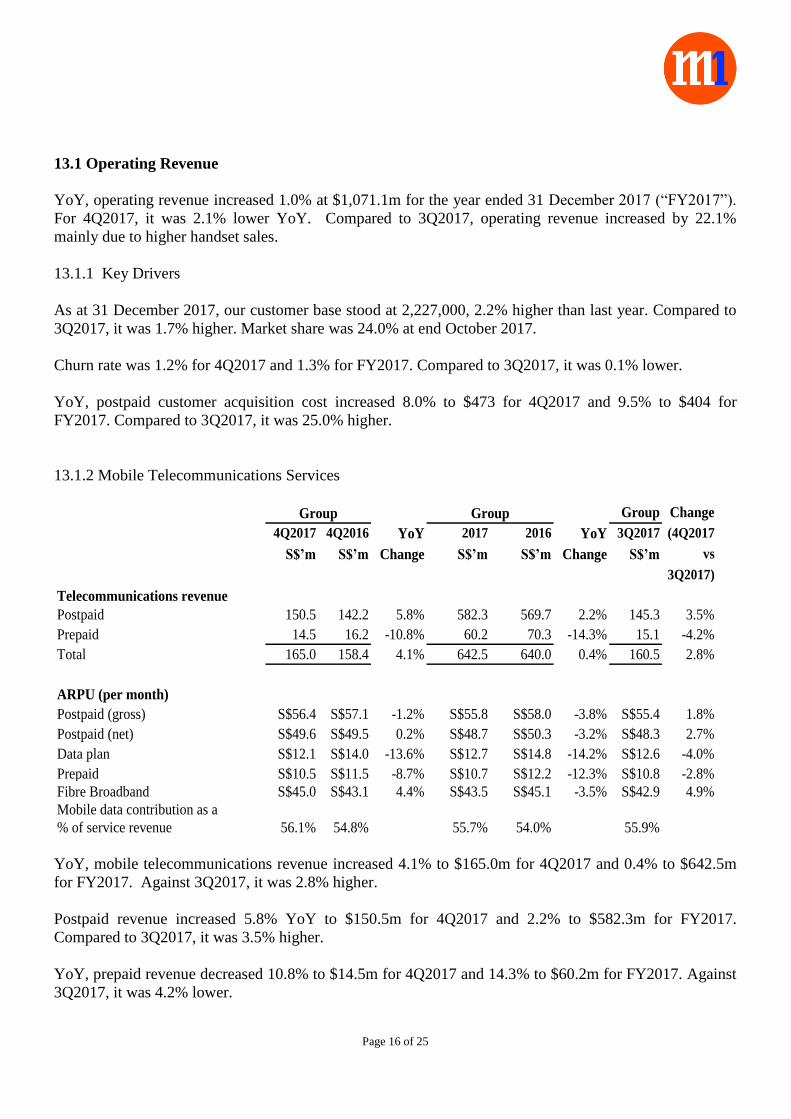
13.1 Operating Revenue
YoY, operating revenue increased 1.0% at $1,071.1m for the year ended 31 December 2017 (“FY2017”).
For 4Q2017, it was 2.1% lower YoY. Compared to 3Q2017, operating revenue increased by 22.1%
mainly due to higher handset sales.
13.1.1 Key Drivers
As at 31 December 2017, our customer base stood at 2,227,000, 2.2% higher than last year. Compared to
3Q2017, it was 1.7% higher. Market share was 24.0% at end October 2017.
Churn rate was 1.2% for 4Q2017 and 1.3% for FY2017. Compared to 3Q2017, it was 0.1% lower.
YoY, postpaid customer acquisition cost increased 8.0% to $473 for 4Q2017 and 9.5% to $404 for
FY2017. Compared to 3Q2017, it was 25.0% higher.
13.1.2 Mobile Telecommunications Services
Group Change
4Q2017 4Q2016 YoY 2017 2016 YoY 3Q2017 (4Q2017
S$’m S$’m Change S$’m S$’m Change S$’m vs
3Q2017)
Telecommunications revenue
Postpaid 150.5 142.2 5.8% 582.3 569.7 2.2% 145.3 3.5%
Prepaid 14.5 16.2 -10.8% 60.2 70.3 -14.3% 15.1 -4.2%
Total 165.0 158.4 4.1% 642.5 640.0 0.4% 160.5 2.8%
ARPU (per month)
Postpaid (gross) S$56.4 S$57.1 -1.2% S$55.8 S$58.0 -3.8% S$55.4 1.8%
Postpaid (net) S$49.6 S$49.5 0.2% S$48.7 S$50.3 -3.2% S$48.3 2.7%
Data plan S$12.1 S$14.0 -13.6% S$12.7 S$14.8 -14.2% S$12.6 -4.0%
Prepaid S$10.5 S$11.5 -8.7% S$10.7 S$12.2 -12.3% S$10.8 -2.8%
Fibre Broadband S$45.0 S$43.1 4.4% S$43.5 S$45.1 -3.5% S$42.9 4.9%
Mobile data contribution as a
% of service revenue 56.1% 54.8% 55.7% 54.0% 55.9%
Group Group
YoY, mobile telecommunications revenue increased 4.1% to $165.0m for 4Q2017 and 0.4% to $642.5m
for FY2017. Against 3Q2017, it was 2.8% higher.
Postpaid revenue increased 5.8% YoY to $150.5m for 4Q2017 and 2.2% to $582.3m for FY2017.
Compared to 3Q2017, it was 3.5% higher.
YoY, prepaid revenue decreased 10.8% to $14.5m for 4Q2017 and 14.3% to $60.2m for FY2017. Against
3Q2017, it was 4.2% lower.
Page 17 of 25
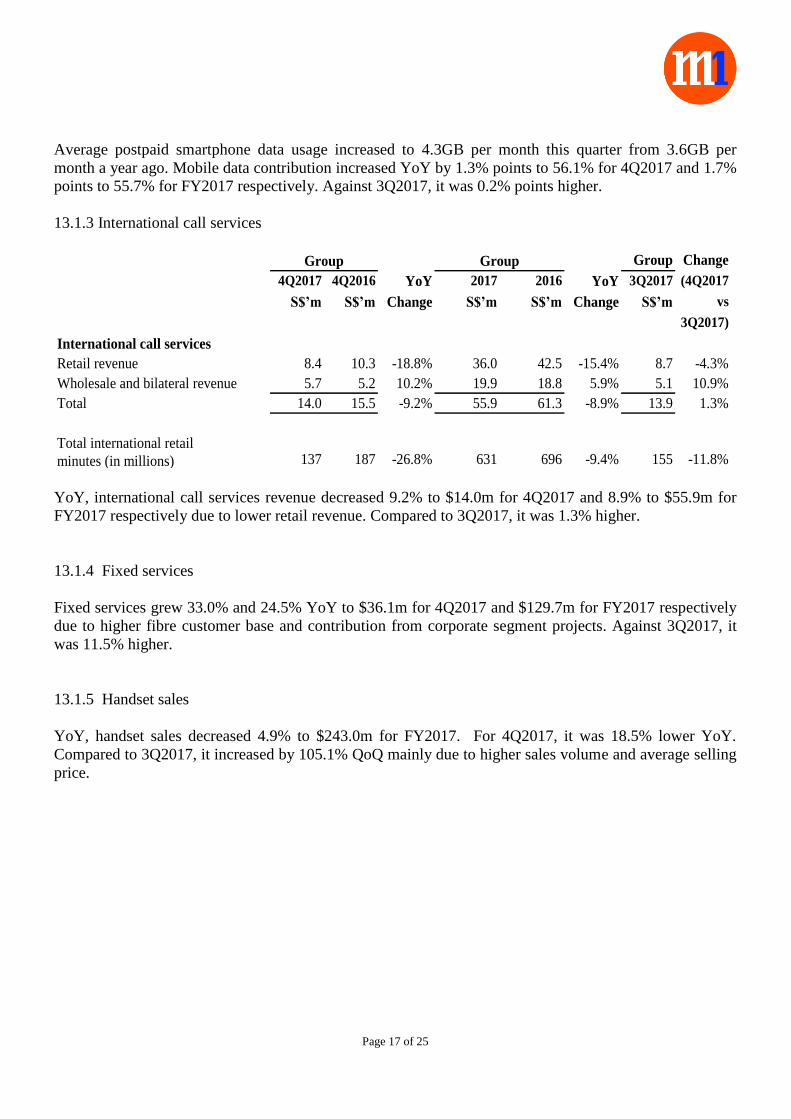
Average postpaid smartphone data usage increased to 4.3GB per month this quarter from 3.6GB per
month a year ago. Mobile data contribution increased YoY by 1.3% points to 56.1% for 4Q2017 and 1.7%
points to 55.7% for FY2017 respectively. Against 3Q2017, it was 0.2% points higher.
13.1.3 International call services
Group Change
4Q2017 4Q2016 YoY 2017 2016 YoY 3Q2017 (4Q2017
S$’m S$’m Change S$’m S$’m Change S$’m vs
3Q2017)
International call services
Retail revenue 8.4 10.3 -18.8% 36.0 42.5 -15.4% 8.7 -4.3%
Wholesale and bilateral revenue 5.7 5.2 10.2% 19.9 18.8 5.9% 5.1 10.9%
Total 14.0 15.5 -9.2% 55.9 61.3 -8.9% 13.9 1.3%
Total international retail
minutes (in millions) -9.4%
Group
696 -11.8% 631
Group
155 137 187 -26.8%
YoY, international call services revenue decreased 9.2% to $14.0m for 4Q2017 and 8.9% to $55.9m for
FY2017 respectively due to lower retail revenue. Compared to 3Q2017, it was 1.3% higher.
13.1.4 Fixed services
Fixed services grew 33.0% and 24.5% YoY to $36.1m for 4Q2017 and $129.7m for FY2017 respectively
due to higher fibre customer base and contribution from corporate segment projects. Against 3Q2017, it
was 11.5% higher.
13.1.5 Handset sales
YoY, handset sales decreased 4.9% to $243.0m for FY2017. For 4Q2017, it was 18.5% lower YoY.
Compared to 3Q2017, it increased by 105.1% QoQ mainly due to higher sales volume and average selling
price.
Page 18 of 25
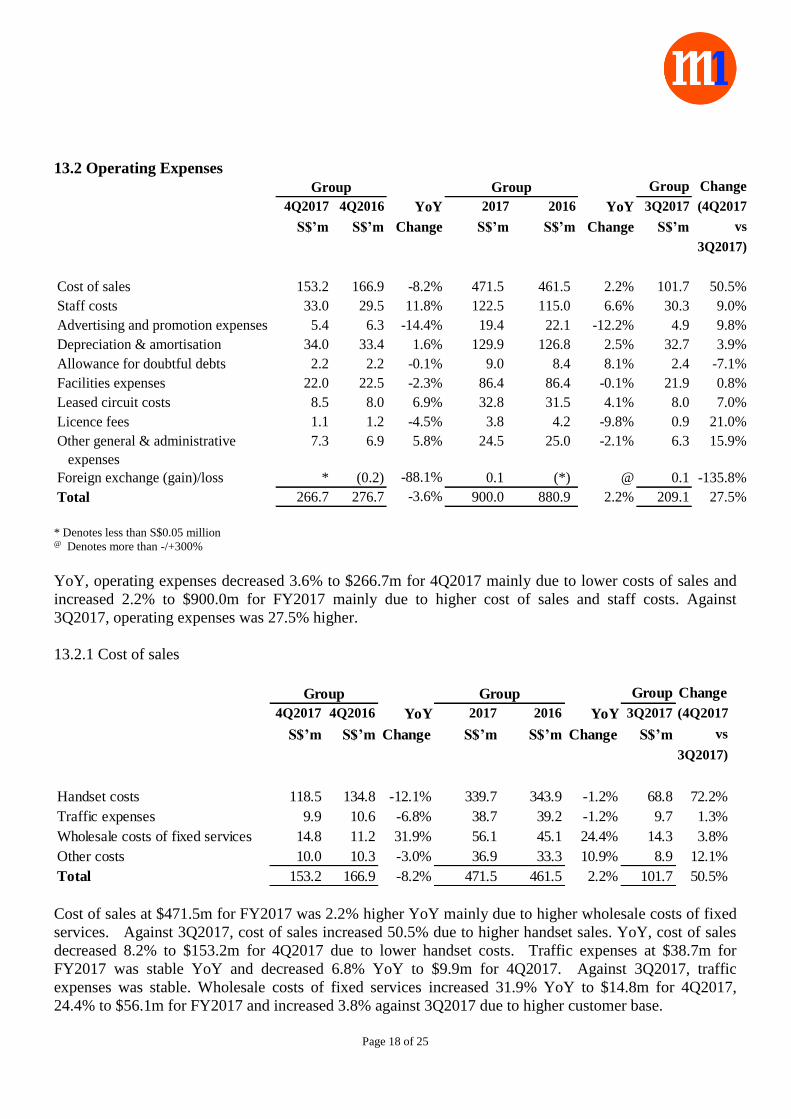
13.2 Operating Expenses Group Change
4Q2017 4Q2016 YoY 2017 2016 YoY 3Q2017 (4Q2017
S$’m S$’m Change S$’m S$’m Change S$’m vs
3Q2017)
Cost of sales 153.2 166.9 -8.2% 471.5 461.5 2.2% 101.7 50.5%
Staff costs 33.0 29.5 11.8% 122.5 115.0 6.6% 30.3 9.0%
Advertising and promotion expenses 5.4 6.3 -14.4% 19.4 22.1 -12.2% 4.9 9.8%
Depreciation & amortisation 34.0 33.4 1.6% 129.9 126.8 2.5% 32.7 3.9%
Allowance for doubtful debts 2.2 2.2 -0.1% 9.0 8.4 8.1% 2.4 -7.1%
Facilities expenses 22.0 22.5 -2.3% 86.4 86.4 -0.1% 21.9 0.8%
Leased circuit costs 8.5 8.0 6.9% 32.8 31.5 4.1% 8.0 7.0%
Licence fees 1.1 1.2 -4.5% 3.8 4.2 -9.8% 0.9 21.0%
Other general & administrative
expenses
7.3 6.9 5.8% 24.5 25.0 -2.1% 6.3 15.9%
Foreign exchange (gain)/loss * (0.2) -88.1% 0.1 (*) @ 0.1 -135.8%
Total 266.7 276.7 -3.6% 900.0 880.9 2.2% 209.1 27.5%
Group Group
* Denotes less than S$0.05 million @ Denotes more than -/+300%
YoY, operating expenses decreased 3.6% to $266.7m for 4Q2017 mainly due to lower costs of sales and
increased 2.2% to $900.0m for FY2017 mainly due to higher cost of sales and staff costs. Against
3Q2017, operating expenses was 27.5% higher.
13.2.1 Cost of sales
Group Change
4Q2017 4Q2016 YoY 2017 2016 YoY 3Q2017 (4Q2017
S$’m S$’m Change S$’m S$’m Change S$’m vs
3Q2017)
Handset costs 118.5 134.8 -12.1% 339.7 343.9 -1.2% 68.8 72.2%
Traffic expenses 9.9 10.6 -6.8% 38.7 39.2 -1.2% 9.7 1.3%
Wholesale costs of fixed services 14.8 11.2 31.9% 56.1 45.1 24.4% 14.3 3.8%
Other costs 10.0 10.3 -3.0% 36.9 33.3 10.9% 8.9 12.1%
Total 153.2 166.9 -8.2% 471.5 461.5 2.2% 101.7 50.5%
Group Group
Cost of sales at $471.5m for FY2017 was 2.2% higher YoY mainly due to higher wholesale costs of fixed
services. Against 3Q2017, cost of sales increased 50.5% due to higher handset sales. YoY, cost of sales
decreased 8.2% to $153.2m for 4Q2017 due to lower handset costs. Traffic expenses at $38.7m for
FY2017 was stable YoY and decreased 6.8% YoY to $9.9m for 4Q2017. Against 3Q2017, traffic
expenses was stable. Wholesale costs of fixed services increased 31.9% YoY to $14.8m for 4Q2017,
24.4% to $56.1m for FY2017 and increased 3.8% against 3Q2017 due to higher customer base.
Page 19 of 25
13.2.2 Staff costs
Staff costs increased 11.8% to $33.0m for 4Q2017 and 6.6% to $122.5m for FY2017 due to salary
increment and bonus payout.
13.2.3 Advertising and promotion expenses
For the quarter, advertising & promotion expenses decreased 14.4% YoY. Compare to 3Q2017, adverting
and promotion expenses increased 9.8% to $5.4m. For FY2017, it was 12.2% lower.
13.2.4 Depreciation and amortisation
Depreciation and amortisation expenses at $34.0m for 4Q2017 and $129.9m for FY2017 were 1.6% and
2.5% higher YoY respectively mainly due to higher fixed asset base. Against 3Q2017, it was 3.9% higher.
13.2.5 Allowance for bad and doubtful debt
Allowance for bad and doubtful debt for 4Q2017 was stable YoY. FY2017, doubtful debt allowance
increased 8.1% to $9.0m. Against 3Q2017, it was 7.1% lower.
13.2.6 Facilities expenses
Facilities expenses at $22.0m was 2.3% lower YoY. Against 3Q2017, it was 0.8% higher.
13.2.7 Leased circuit costs
Leased circuit costs at $8.5m for 4Q2017 and $32.8m for FY2017 were 6.9% and 4.1% higher YoY.
Against 3Q2017, leased circuit costs was 7% higher.
13.2.8 Other general and administrative expenses
YoY, other general and administrative expenses increased 5.8% to $7.3m for 4Q2017. Against 3Q2017, it
was 15.9 % higher.
13.3 Finance Costs
Compared to last year, finance costs increased 44.7% to $2.9m for 4Q2017 and 46.5% to $9.9m for
FY2017 due to higher borrowings and interest rate.
13.4 Taxation
YoY, provision for taxation increased 35.8% to $6.6m for 4Q2017 and increased 4.2% to $30.1m for
FY2017. FY2016 benefited from a write-back of overprovision for tax.
Page 20 of 25
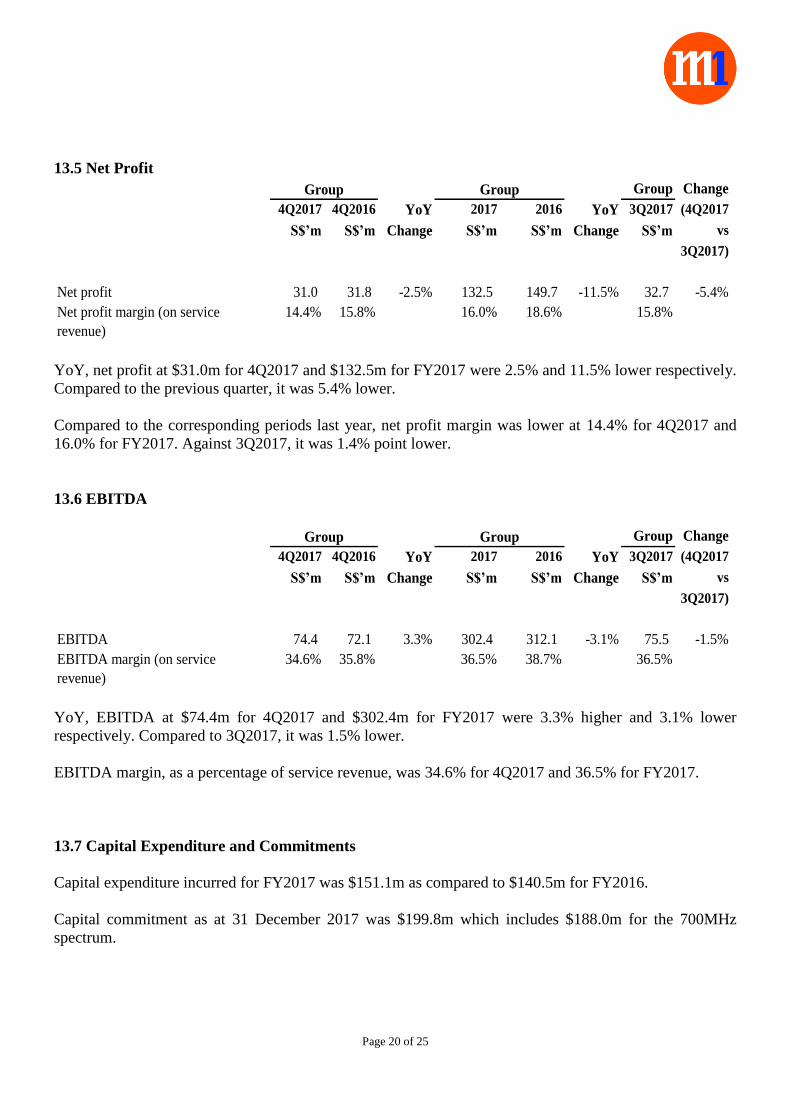
13.5 Net Profit
Group Change
4Q2017 4Q2016 YoY 2017 2016 YoY 3Q2017 (4Q2017
S$’m S$’m Change S$’m S$’m Change S$’m vs
3Q2017)
Net profit 31.0 31.8 -2.5% 132.5 149.7 -11.5% 32.7 -5.4%
Net profit margin (on service
revenue)
14.4% 15.8% 16.0% 18.6% 15.8%
Group Group
YoY, net profit at $31.0m for 4Q2017 and $132.5m for FY2017 were 2.5% and 11.5% lower respectively.
Compared to the previous quarter, it was 5.4% lower.
Compared to the corresponding periods last year, net profit margin was lower at 14.4% for 4Q2017 and
16.0% for FY2017. Against 3Q2017, it was 1.4% point lower.
13.6 EBITDA
Group Change
4Q2017 4Q2016 YoY 2017 2016 YoY 3Q2017 (4Q2017
S$’m S$’m Change S$’m S$’m Change S$’m vs
3Q2017)
EBITDA 74.4 72.1 3.3% 302.4 312.1 -3.1% 75.5 -1.5%
EBITDA margin (on service
revenue)
34.6% 35.8% 36.5% 38.7% 36.5%
GroupGroup
YoY, EBITDA at $74.4m for 4Q2017 and $302.4m for FY2017 were 3.3% higher and 3.1% lower
respectively. Compared to 3Q2017, it was 1.5% lower.
EBITDA margin, as a percentage of service revenue, was 34.6% for 4Q2017 and 36.5% for FY2017.
13.7 Capital Expenditure and Commitments
Capital expenditure incurred for FY2017 was $151.1m as compared to $140.5m for FY2016.
Capital commitment as at 31 December 2017 was $199.8m which includes $188.0m for the 700MHz
spectrum.
Page 21 of 25
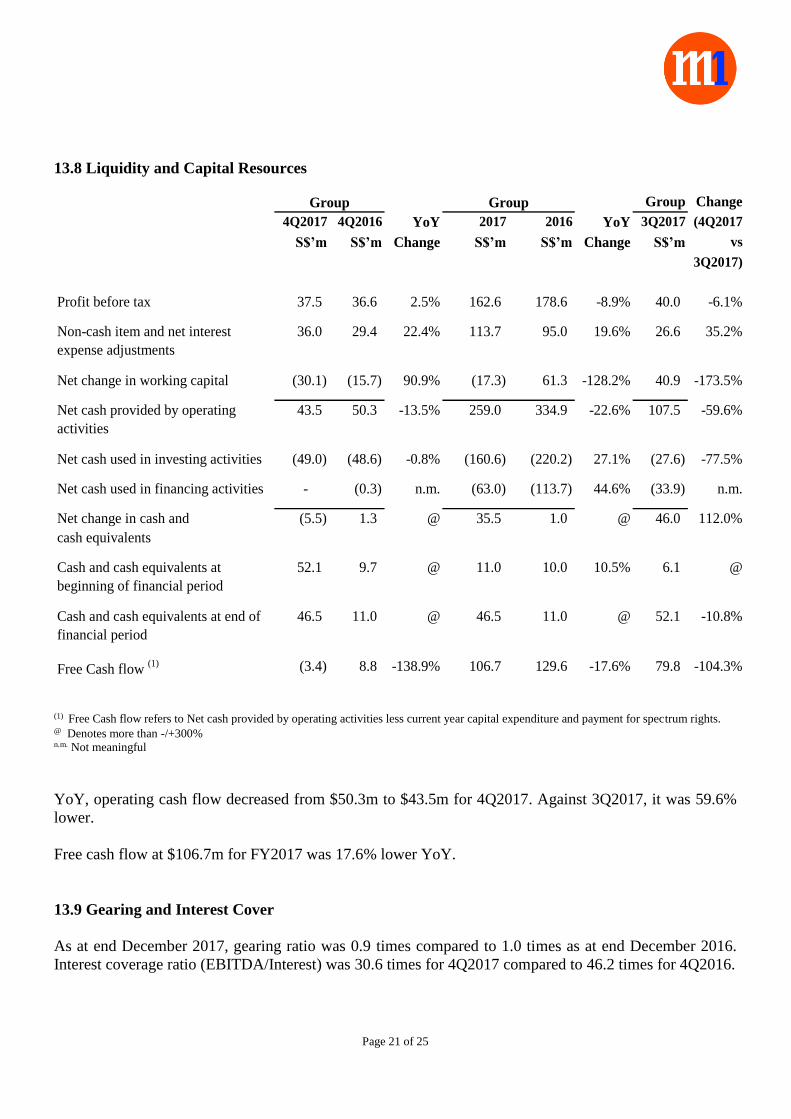
13.8 Liquidity and Capital Resources
Group Change
4Q2017 4Q2016 YoY 2017 2016 YoY 3Q2017 (4Q2017
S$’m S$’m Change S$’m S$’m Change S$’m vs
3Q2017)
Profit before tax 37.5 36.6 2.5% 162.6 178.6 -8.9% 40.0 -6.1%
Non-cash item and net interest
expense adjustments
36.0 29.4 22.4% 113.7 95.0 19.6% 26.6 35.2%
Net change in working capital (30.1) (15.7) 90.9% (17.3) 61.3 -128.2% 40.9 -173.5%
Net cash provided by operating
activities
43.5 50.3 -13.5% 259.0 334.9 -22.6% 107.5 -59.6%
Net cash used in investing activities (49.0) (48.6) -0.8% (160.6) (220.2) 27.1% (27.6) -77.5%
Net cash used in financing activities - (0.3) n.m. (63.0) (113.7) 44.6% (33.9) n.m.
Net change in cash and (5.5) 1.3 @ 35.5 1.0 @ 46.0 112.0%
cash equivalents
Cash and cash equivalents at
beginning of financial period
52.1 9.7 @ 11.0 10.0 10.5% 6.1 @
Cash and cash equivalents at end of
financial period
46.5 11.0 @ 46.5 11.0 @ 52.1 -10.8%
Free Cash flow (1) (3.4) 8.8 -138.9% 106.7 129.6 -17.6% 79.8 -104.3%
GroupGroup
(1) Free Cash flow refers to Net cash provided by operating activities less current year capital expenditure and payment for spectrum rights. @ Denotes more than -/+300% n.m. Not meaningful
YoY, operating cash flow decreased from $50.3m to $43.5m for 4Q2017. Against 3Q2017, it was 59.6%
lower.
Free cash flow at $106.7m for FY2017 was 17.6% lower YoY.
13.9 Gearing and Interest Cover
As at end December 2017, gearing ratio was 0.9 times compared to 1.0 times as at end December 2016.
Interest coverage ratio (EBITDA/Interest) was 30.6 times for 4Q2017 compared to 46.2 times for 4Q2016.
Page 22 of 25
13.10 Balance Sheet
Total non-current assets increased 4.0% from $919.2m as at 31 December 2016 to $956.0m as at 31
December 17 mainly due to the acquisition of spectrum rights.
Total current assets increased 37.7% from $227.4m as at 31 December 2016 to $313.0m as at 31
December 2017, mainly due to higher cash and cash equivalents, inventories and other receivable and
deposits balances.
Total current liabilities as at 31 December 2017 was $269.5m, 28.2% lower than $375.2m for 31
December 2016.
Against 31 December 2016, total equity as at 31 December 2017 was 6.3% higher at $428.9m.
14. VARIANCE FROM PROSPECT STATEMENT
Net profit after tax declined 2.5% year-on-year for fourth quarter and 11.5% year-on-year for full year
ended 31 December, 2017. This is in line with our previous outlook statement.
15. OUTLOOK
It is expected that competition will increase in 2018 with the anticipated entry of new mobile service
providers. We remain committed to improve our services and deliver superior customer experience to
attract and retain customers.
As we transform to a Smart Communications Provider, we progressively scale up our ICT capabilities and
portfolio of digital services to capture opportunities in IoT and Smart Nation. The digitalisation will
improve operational efficiency and enhance our customer touch-points, providing a seamless experience
for digital natives and tech-savvy segment.
Page 23 of 25
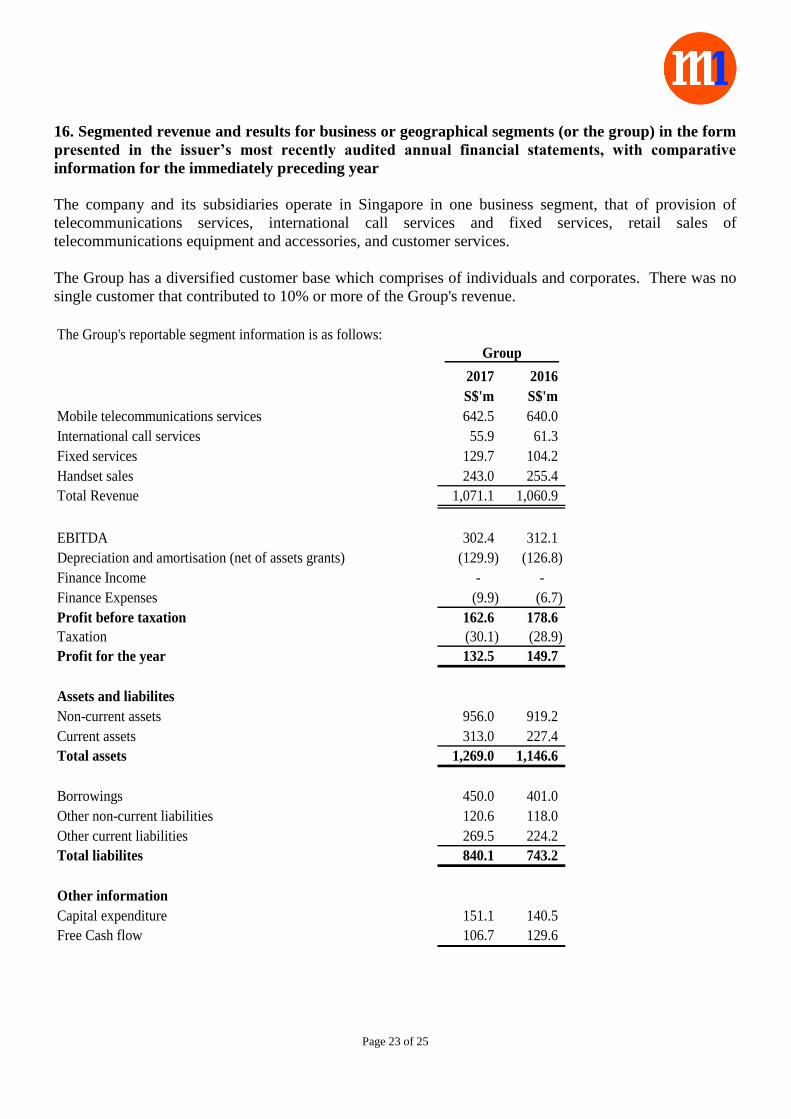
16. Segmented revenue and results for business or geographical segments (or the group) in the form
presented in the issuer’s most recently audited annual financial statements, with comparative
information for the immediately preceding year
The company and its subsidiaries operate in Singapore in one business segment, that of provision of
telecommunications services, international call services and fixed services, retail sales of
telecommunications equipment and accessories, and customer services.
The Group has a diversified customer base which comprises of individuals and corporates. There was no
single customer that contributed to 10% or more of the Group's revenue.
The Group's reportable segment information is as follows:
2017 2016
S$'m S$'m
Mobile telecommunications services 642.5 640.0
International call services 55.9 61.3
Fixed services 129.7 104.2
Handset sales 243.0 255.4
Total Revenue 1,071.1 1,060.9
EBITDA 302.4 312.1
Depreciation and amortisation (net of assets grants) (129.9) (126.8)
Finance Income - -
Finance Expenses (9.9) (6.7)
Profit before taxation 162.6 178.6
Taxation (30.1) (28.9)
Profit for the year 132.5 149.7
Assets and liabilites
Non-current assets 956.0 919.2
Current assets 313.0 227.4
Total assets 1,269.0 1,146.6
Borrowings 450.0 401.0
Other non-current liabilities 120.6 118.0
Other current liabilities 269.5 224.2
Total liabilites 840.1 743.2
Other information
Capital expenditure 151.1 140.5
Free Cash flow 106.7 129.6
Group
Page 24 of 25
17. In the review of performance, the factors leading to any material changes in contribution to
turnover and earnings by the business or geographical segments.
See comment above (16).
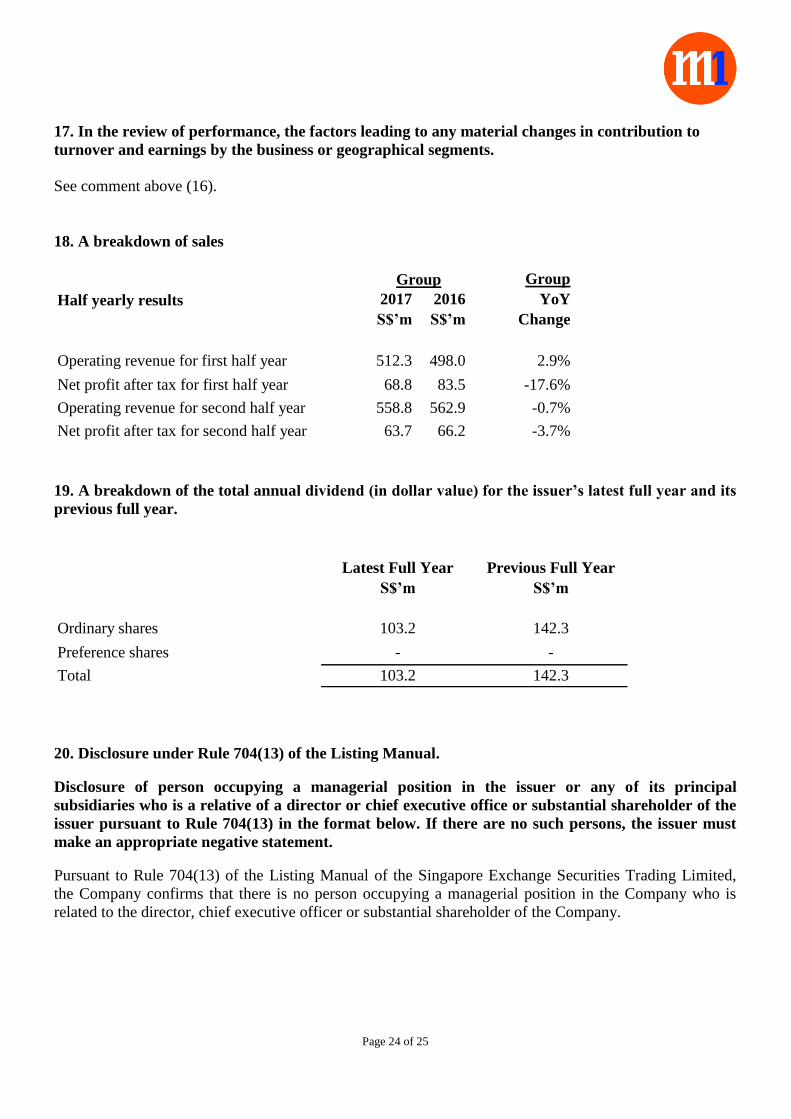
18. A breakdown of sales
Group
Half yearly results 2017 2016 YoY
S$’m S$’m Change
Operating revenue for first half year 512.3 498.0 2.9%
Net profit after tax for first half year 68.8 83.5 -17.6%
Operating revenue for second half year 558.8 562.9 -0.7%
Net profit after tax for second half year 63.7 66.2 -3.7%
Group
19. A breakdown of the total annual dividend (in dollar value) for the issuer’s latest full year and its
previous full year.
Latest Full Year Previous Full Year
S$’m S$’m
Ordinary shares 103.2 142.3
Preference shares - -
Total 103.2 142.3
20. Disclosure under Rule 704(13) of the Listing Manual.
Disclosure of person occupying a managerial position in the issuer or any of its principal
subsidiaries who is a relative of a director or chief executive office or substantial shareholder of the
issuer pursuant to Rule 704(13) in the format below. If there are no such persons, the issuer must
make an appropriate negative statement.
Pursuant to Rule 704(13) of the Listing Manual of the Singapore Exchange Securities Trading Limited,
the Company confirms that there is no person occupying a managerial position in the Company who is
related to the director, chief executive officer or substantial shareholder of the Company.
Page 25 of 25
21. CONFIRMATION THAT THE ISSUER HAS PROCURED UNDERTAKINGS FROM ALL
ITS DIRECTORS AND EXECUTIVE OFFICERS
The Company confirms that it has procured undertakings from all its directors and executive officers in
the format set out in Appendix 7.7 under Rule 720(1) of the Listing Manual.
BY ORDER OF THE BOARD
Karen Teo
Company Secretary
23 January 2018