Embed Size (px)
Citation preview

Full-Year 2016/17 ResultsStäfa, May 16, 2017
Lukas Braunschweiler | CEO, Hartwig Grevener | CFO, Thomas Bernhardsgrütter | IR
Disclaimer
This presentation contains forward-looking statements, which offer no guarantee with
regard to future performance. These statements are made on the basis of management’s
views and assumptions regarding future events and business performance at the time the
statements are made. They are subject to risks and uncertainties including, but not
confined to, future global economic conditions, exchange rates, legal provisions, market
conditions, activities by competitors and other factors outside Sonova’s control. Should one
or more of these risks or uncertainties materialize or should underlying assumptions prove
incorrect, actual outcomes may vary materially from those forecasted or expected. Each
forward-looking statement speaks only as of the date of the particular statement, and
Sonova undertakes no obligation to publicly update or revise any forward-looking
statements, except as required by law.
This presentation constitutes neither an offer to sell nor a solicitation to buy any securities.
This presentation does not constitute an offering prospectus within the meaning of Article
652a of the Swiss Code of Obligations nor a listing prospectus within the meaning of the
listing rules of SIX Swiss Exchange.
Page 2May 16, 2017
Agenda
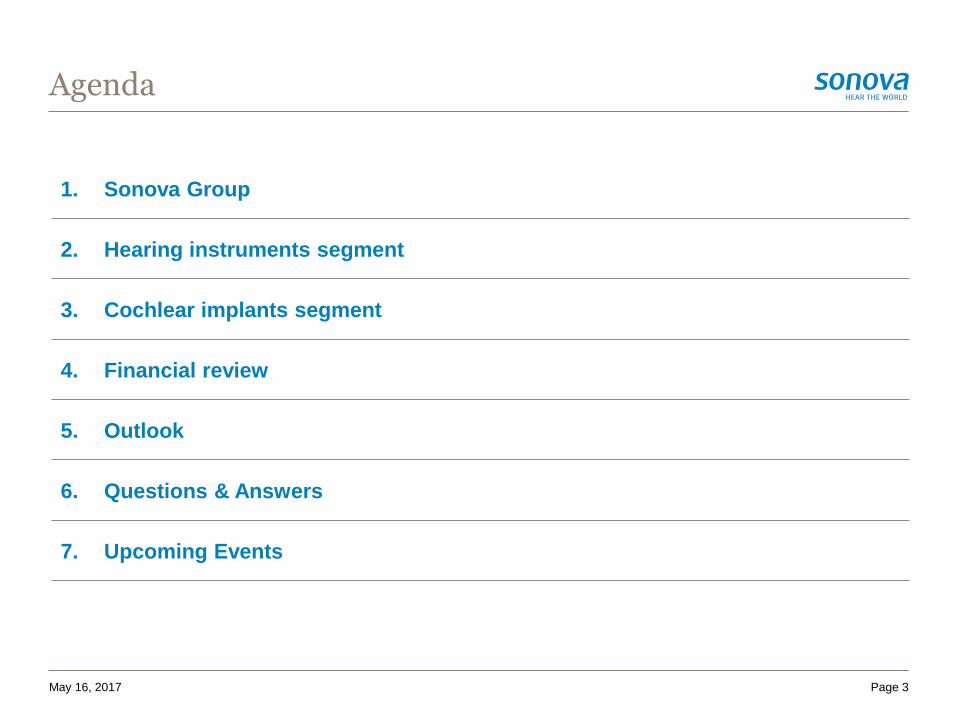
1. Sonova Group
2. Hearing instruments segment
3. Cochlear implants segment
4. Financial review
5. Outlook
6. Questions & Answers
7. Upcoming Events
Page 3May 16, 2017
1. Sonova Group
Seniors
Workers
Adults
Teens
Students
Babies
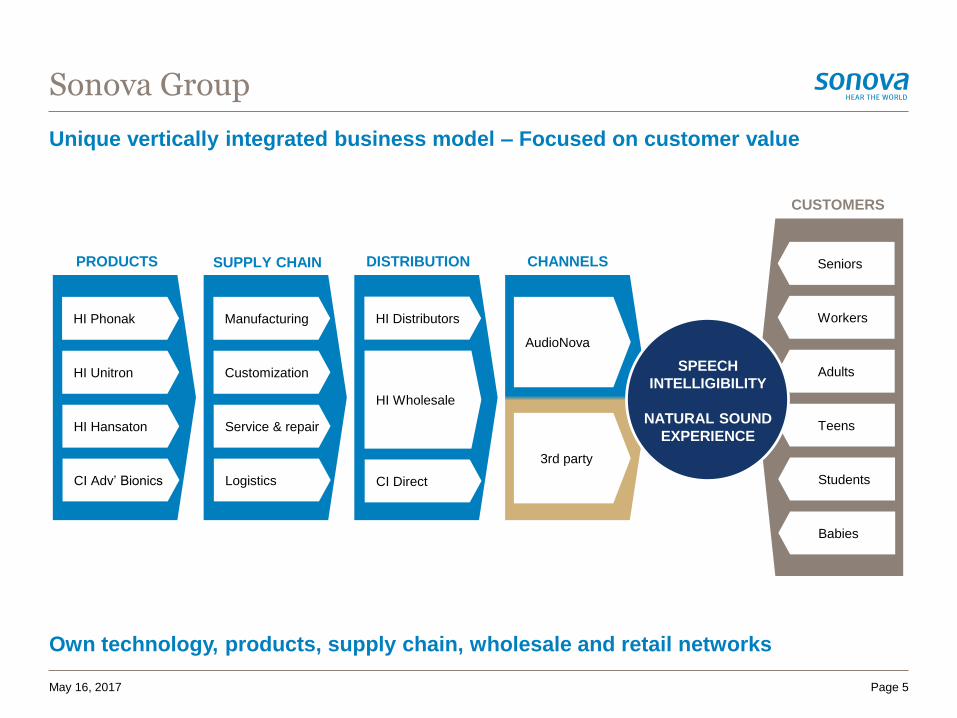
Unique vertically integrated business model – Focused on customer value
Sonova Group
Page 5May 16, 2017
DISTRIBUTIONSUPPLY CHAINPRODUCTS
HI Phonak
HI Unitron
HI Hansaton
CI Adv’ Bionics
3rd party
AudioNova
CHANNELS
Manufacturing
Customization
Service & repair
Logistics
HI Distributors
HI Wholesale
CI Direct
CUSTOMERS
SPEECH
INTELLIGIBILITY
NATURAL SOUND
EXPERIENCE
Own technology, products, supply chain, wholesale and retail networks
Sonova Group
May 16, 2017 Page 6
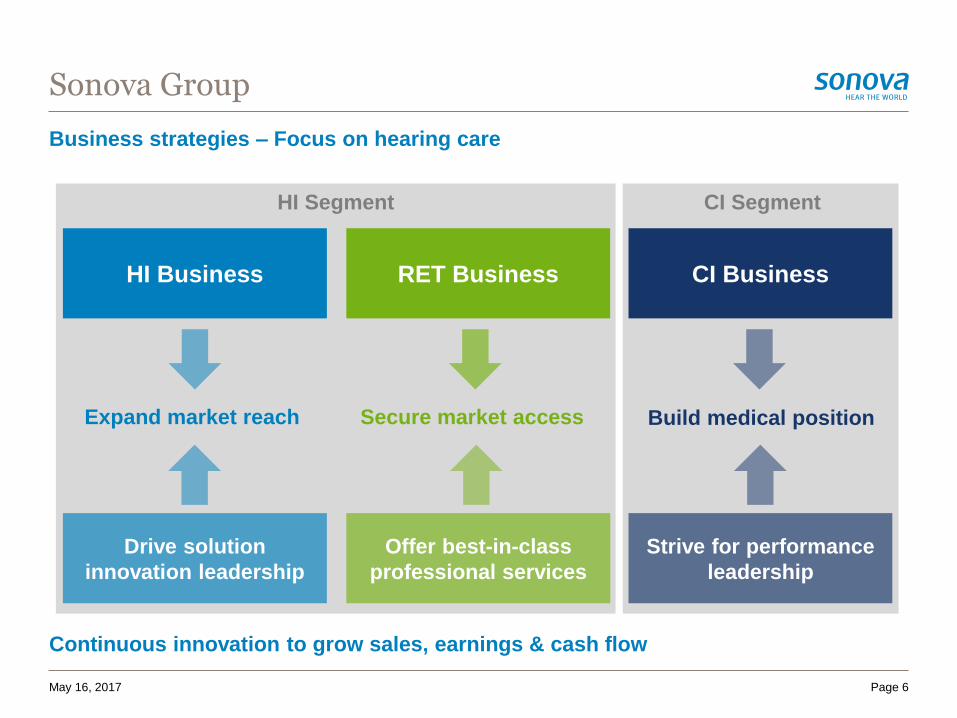
Business strategies – Focus on hearing care
Continuous innovation to grow sales, earnings & cash flow
RET BusinessHI Business CI Business
Secure market access Expand market reach Build medical position
Offer best-in-class
professional services
Drive solution
innovation leadership
Strive for performance
leadership
HI Segment CI Segment
– Sonova Group: Strong progress in HI – solid growth in CI
– Sales of CHF 2,395.7 million up 15.6% as reported in CHF and up by 15.3% in LC
– EBITA of CHF 481.4 million – margin of 20.1% (normalized for AudioNova one-time costs)
– Hearing instruments segment: Solid organic growth – AudioNova integration on track
– Sales of CHF 2,190.3 million up by 15.9% in LC – driven by organic growth and acquisitions
– Marked 2H organic acceleration in particular driven by Phonak Audéo™ B
– AudioNova net sales contribution of CHF 216.1 million for 7 months in FY 2016/17
– Integration on track – CHF 18.4 million one-time costs
– EBITA (normalized) of CHF 473.4 million – margin of 21.6%
– Cochlear implants segment: Strong acceleration in 2H – return to profitability
– Sales of 205.4 million, up 9.6% in LC – strong momentum from new products
– EBITA of CHF 8.0 million – year-on-year improvement driven by higher sales and cost control
– High cash conversion – very good cash flow – sound balance sheet
– Operating free cash flow at CHF 424.8 million – Strong cash conversion of 88% (OpFCF/EBITA)
– Equity ratio 54.2% post AudioNova acquisition
Summary FY 2016/17 – Substantial acceleration and strong fiscal year
Sonova Group
May 16, 2017 Page 7
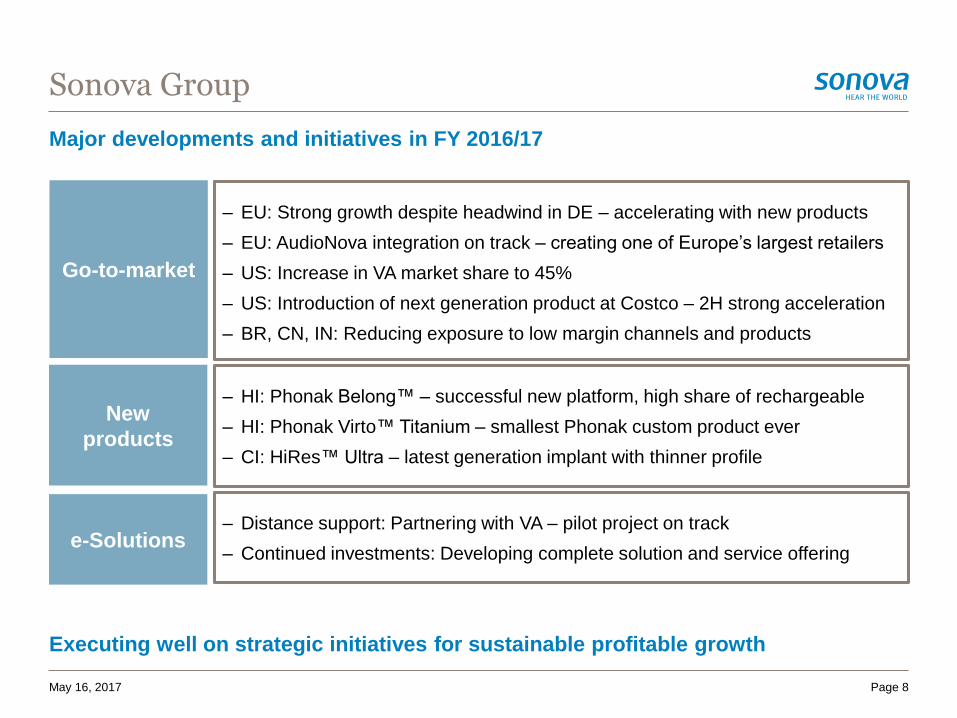
Major developments and initiatives in FY 2016/17
Sonova Group
May 16, 2017 Page 8
Go-to-market
– EU: Strong growth despite headwind in DE – accelerating with new products
– EU: AudioNova integration on track – creating one of Europe’s largest retailers
– US: Increase in VA market share to 45%
– US: Introduction of next generation product at Costco – 2H strong acceleration
– BR, CN, IN: Reducing exposure to low margin channels and products
New
products
– HI: Phonak Belong™ – successful new platform, high share of rechargeable
– HI: Phonak Virto™ Titanium – smallest Phonak custom product ever
– CI: HiRes™ Ultra – latest generation implant with thinner profile
e-Solutions– Distance support: Partnering with VA – pilot project on track
– Continued investments: Developing complete solution and service offering
Executing well on strategic initiatives for sustainable profitable growth
Sonova Group
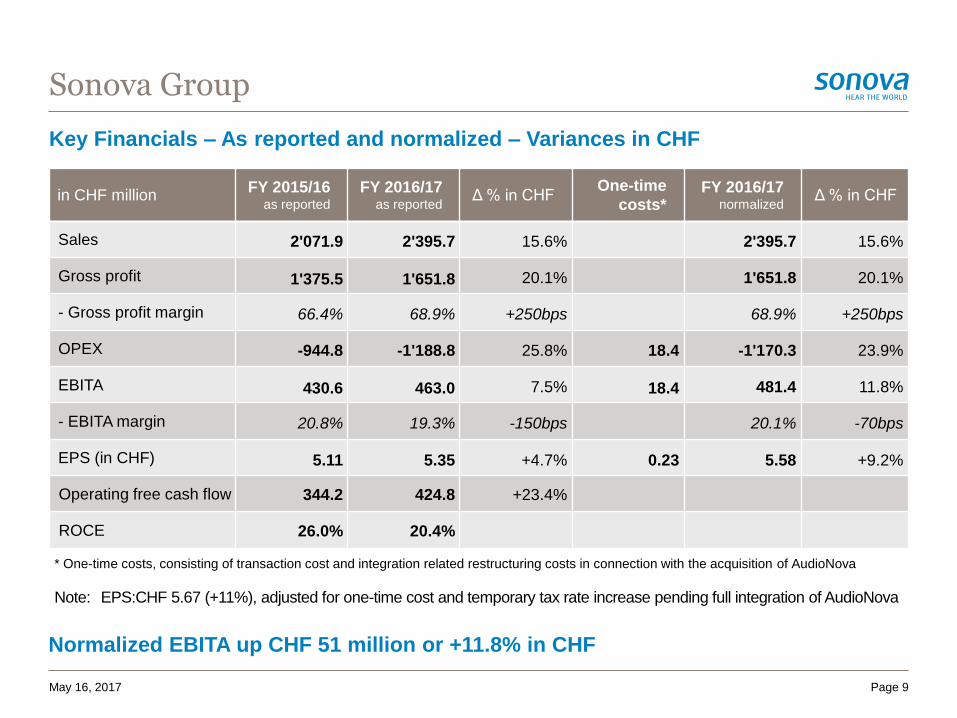
Key Financials – As reported and normalized – Variances in CHF
Normalized EBITA up CHF 51 million or +11.8% in CHF
Page 9May 16, 2017
* One-time costs, consisting of transaction cost and integration related restructuring costs in connection with the acquisition of AudioNova
Note: EPS:CHF 5.67 (+11%), adjusted for one-time cost and temporary tax rate increase pending full integration of AudioNova
in CHF millionFY 2015/16
as reported
FY 2016/17as reported
Δ % in CHF One-time
costs*FY 2016/17
normalizedΔ % in CHF
Sales 2'071.9 2'395.7 15.6% 2'395.7 15.6%
Gross profit 1'375.5 1'651.8 20.1% 1'651.8 20.1%
- Gross profit margin 66.4% 68.9% +250bps 68.9% +250bps
OPEX -944.8 -1'188.8 25.8% 18.4 -1'170.3 23.9%
EBITA 430.6 463.0 7.5% 18.4 481.4 11.8%
- EBITA margin 20.8% 19.3% -150bps 20.1% -70bps
EPS (in CHF) 5.11 5.35 +4.7% 0.23 5.58 +9.2%
Operating free cash flow 344.2 424.8 +23.4%
ROCE 26.0% 20.4%
Sonova Group
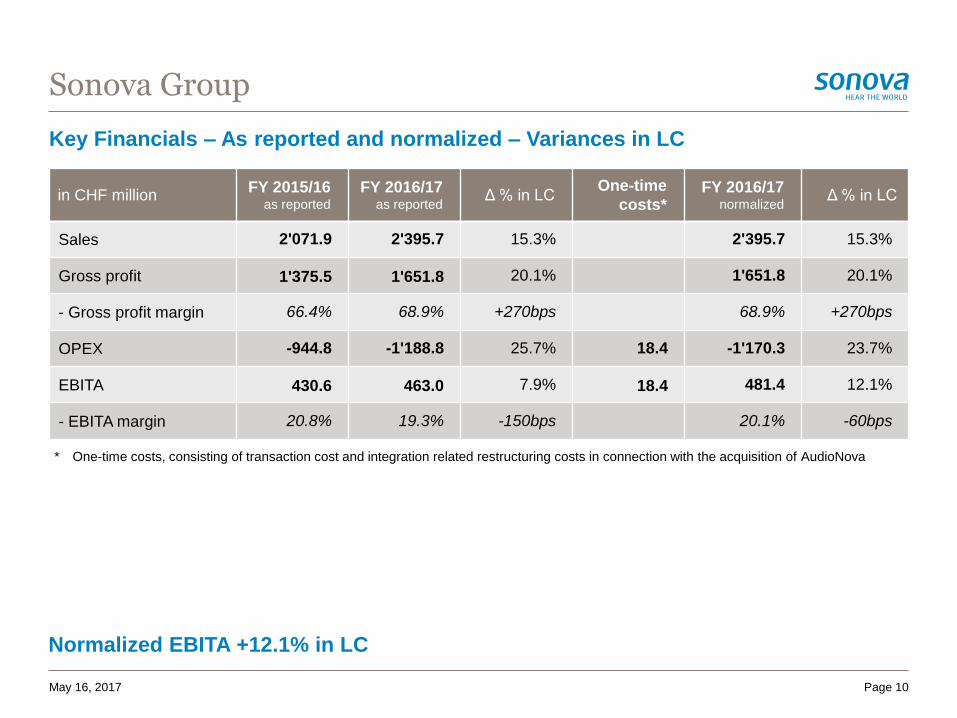
Key Financials – As reported and normalized – Variances in LC
Normalized EBITA +12.1% in LC
Page 10May 16, 2017
* One-time costs, consisting of transaction cost and integration related restructuring costs in connection with the acquisition of AudioNova
in CHF millionFY 2015/16
as reported
FY 2016/17as reported
Δ % in LCOne-time
costs*FY 2016/17
normalizedΔ % in LC
Sales 2'071.9 2'395.7 15.3% 2'395.7 15.3%
Gross profit 1'375.5 1'651.8 20.1% 1'651.8 20.1%
- Gross profit margin 66.4% 68.9% +270bps 68.9% +270bps
OPEX -944.8 -1'188.8 25.7% 18.4 -1'170.3 23.7%
EBITA 430.6 463.0 7.9% 18.4 481.4 12.1%
- EBITA margin 20.8% 19.3% -150bps 20.1% -60bps
Sonova Group
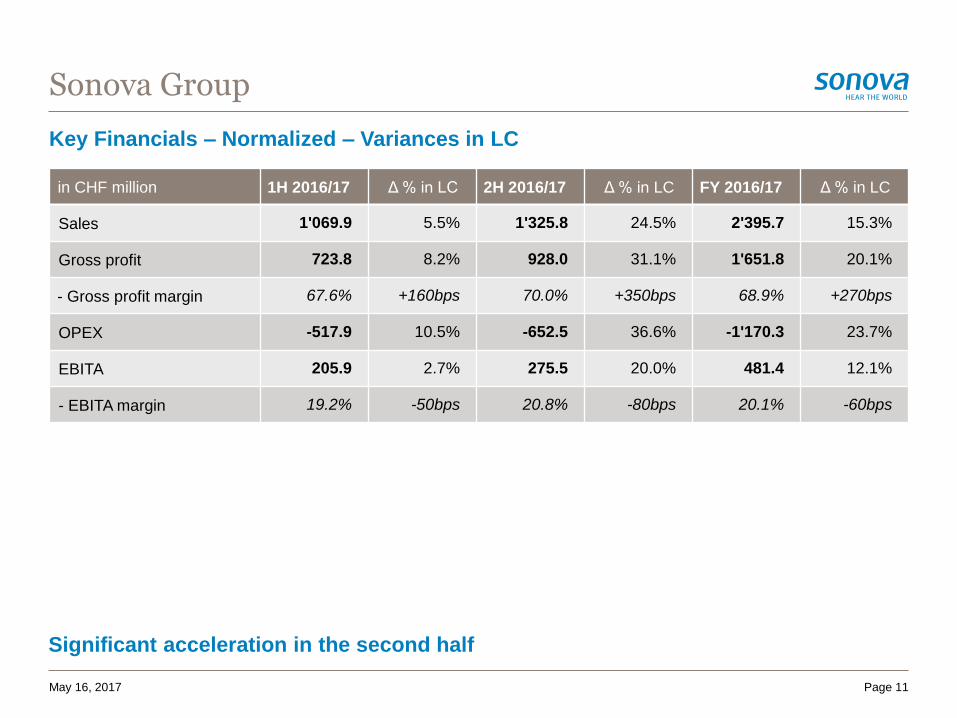
Key Financials – Normalized – Variances in LC
Significant acceleration in the second half
Page 11May 16, 2017
in CHF million 1H 2016/17 Δ % in LC 2H 2016/17 Δ % in LC FY 2016/17 Δ % in LC
Sales 1'069.9 5.5% 1'325.8 24.5% 2'395.7 15.3%
Gross profit 723.8 8.2% 928.0 31.1% 1'651.8 20.1%
- Gross profit margin 67.6% +160bps 70.0% +350bps 68.9% +270bps
OPEX -517.9 10.5% -652.5 36.6% -1'170.3 23.7%
EBITA 205.9 2.7% 275.5 20.0% 481.4 12.1%
- EBITA margin 19.2% -50bps 20.8% -80bps 20.1% -60bps
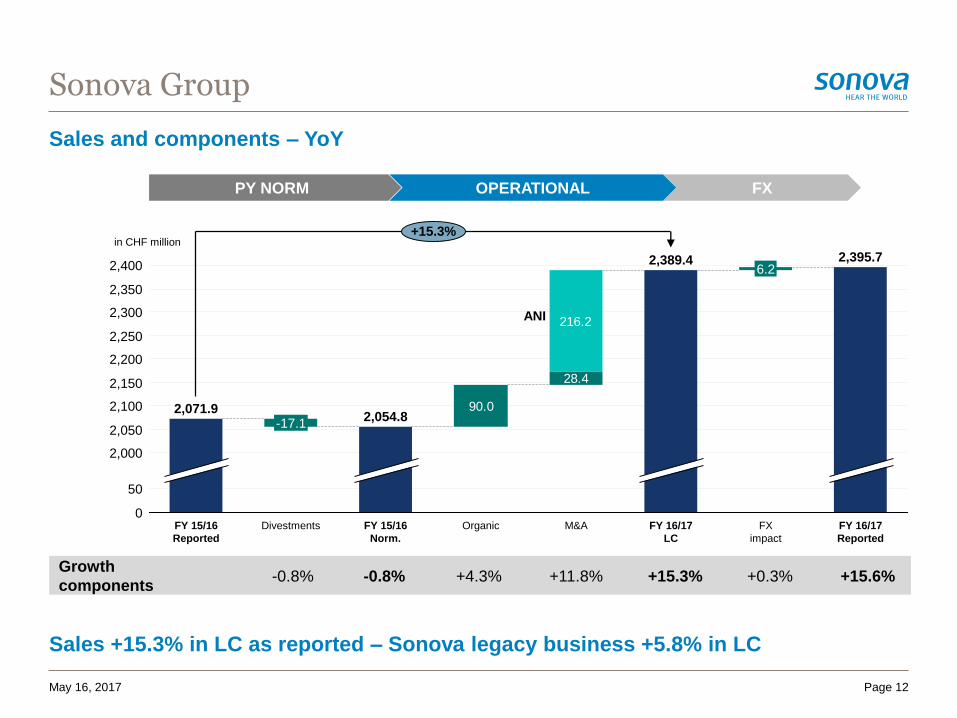
Sales and components – YoY
Sonova Group
Page 12
28.4
90.0
216.2
2,350
2,400
2,250
50
2,100
2,050
2,300
2,150
2,200
2,000
0FY 16/17
Reported
+15.3%
FX
impact
6.2
FY 16/17
LC
2,389.4
M&A
2,395.7
FY 15/16
Norm.
2,054.8
Divestments
-17.1
FY 15/16
Reported
2,071.9
Organic
Growth
components-0.8% +0.3% +15.6%+15.3%
FX
Sales +15.3% in LC as reported – Sonova legacy business +5.8% in LC
in CHF million
+4.3%
ANI
+11.8%-0.8%
PY NORM OPERATIONAL
May 16, 2017
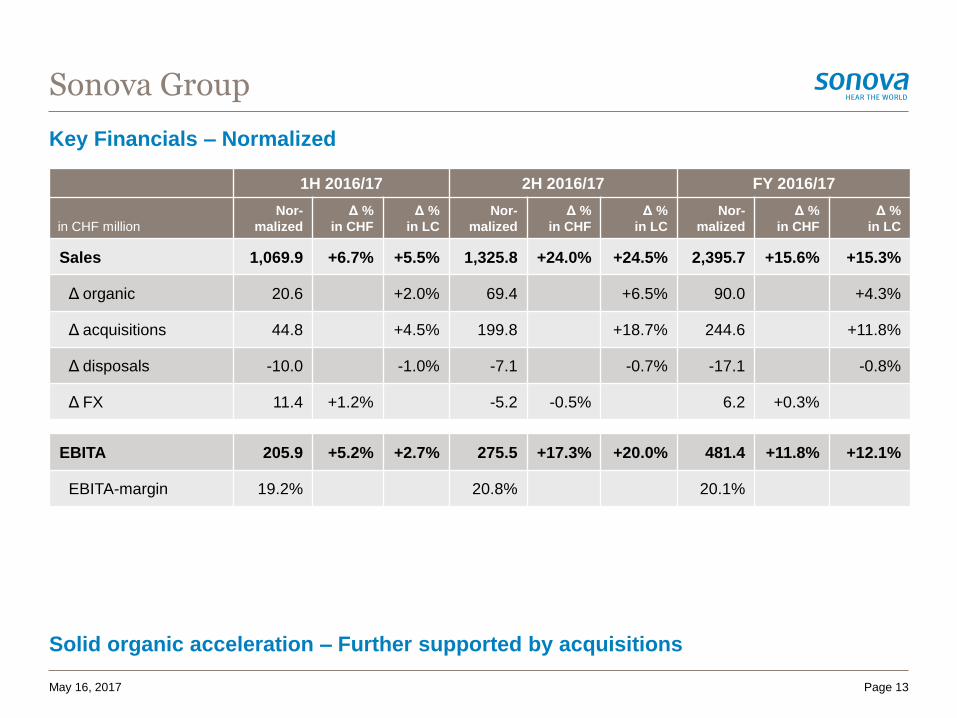
Key Financials – Normalized
Solid organic acceleration – Further supported by acquisitions
Sonova Group
Page 13May 16, 2017
1H 2016/17 2H 2016/17 FY 2016/17
in CHF million
Nor-
malized
Δ %
in CHF
Δ %
in LC
Nor-
malized
Δ %
in CHF
Δ %
in LC
Nor-
malized
Δ %
in CHF
Δ %
in LC
Sales 1,069.9 +6.7% +5.5% 1,325.8 +24.0% +24.5% 2,395.7 +15.6% +15.3%
Δ organic 20.6 +2.0% 69.4 +6.5% 90.0 +4.3%
Δ acquisitions 44.8 +4.5% 199.8 +18.7% 244.6 +11.8%
Δ disposals -10.0 -1.0% -7.1 -0.7% -17.1 -0.8%
Δ FX 11.4 +1.2% -5.2 -0.5% 6.2 +0.3%
EBITA 205.9 +5.2% +2.7% 275.5 +17.3% +20.0% 481.4 +11.8% +12.1%
EBITA-margin 19.2% 20.8% 20.1%
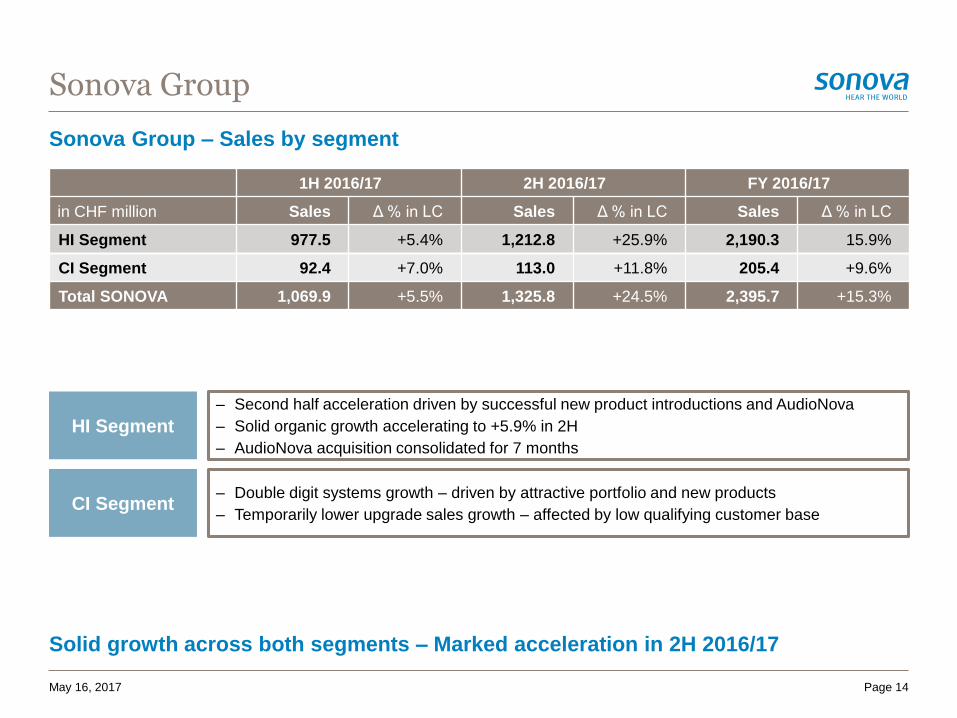
Sonova Group – Sales by segment
Solid growth across both segments – Marked acceleration in 2H 2016/17
Sonova Group
Page 14
HI Segment
– Second half acceleration driven by successful new product introductions and AudioNova
– Solid organic growth accelerating to +5.9% in 2H
– AudioNova acquisition consolidated for 7 months
CI Segment– Double digit systems growth – driven by attractive portfolio and new products
– Temporarily lower upgrade sales growth – affected by low qualifying customer base
May 16, 2017
1H 2016/17 2H 2016/17 FY 2016/17
in CHF million Sales Δ % in LC Sales Δ % in LC Sales Δ % in LC
HI Segment 977.5 +5.4% 1,212.8 +25.9% 2,190.3 15.9%
CI Segment 92.4 +7.0% 113.0 +11.8% 205.4 +9.6%
Total SONOVA 1,069.9 +5.5% 1,325.8 +24.5% 2,395.7 +15.3%
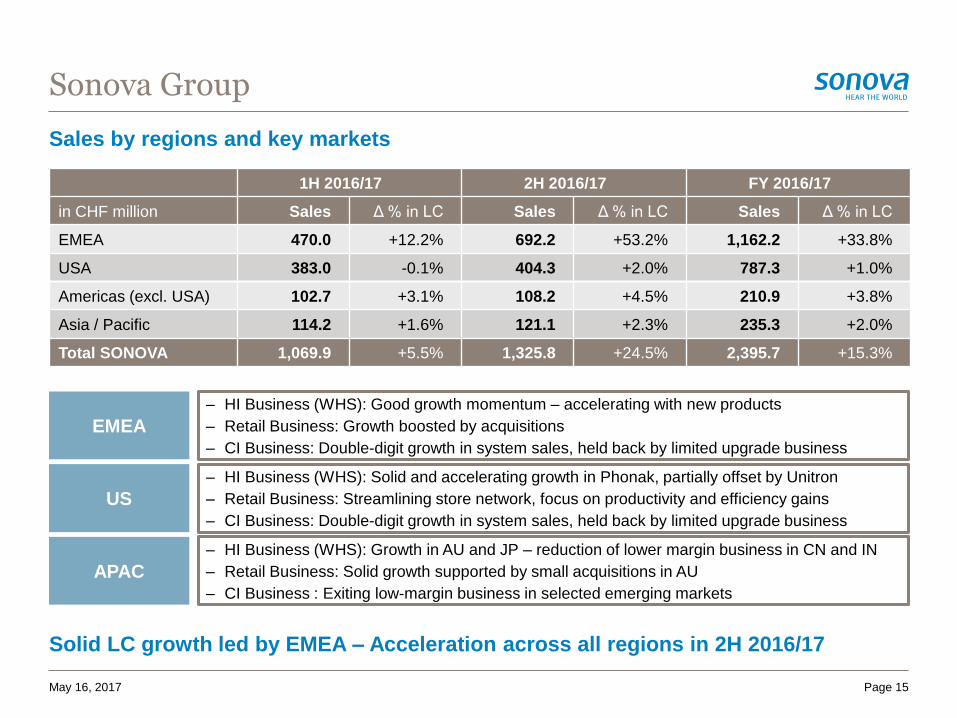
Sales by regions and key markets
Solid LC growth led by EMEA – Acceleration across all regions in 2H 2016/17
Sonova Group
Page 15
EMEA
– HI Business (WHS): Good growth momentum – accelerating with new products
– Retail Business: Growth boosted by acquisitions
– CI Business: Double-digit growth in system sales, held back by limited upgrade business
US
– HI Business (WHS): Solid and accelerating growth in Phonak, partially offset by Unitron
– Retail Business: Streamlining store network, focus on productivity and efficiency gains
– CI Business: Double-digit growth in system sales, held back by limited upgrade business
APAC
– HI Business (WHS): Growth in AU and JP – reduction of lower margin business in CN and IN
– Retail Business: Solid growth supported by small acquisitions in AU
– CI Business : Exiting low-margin business in selected emerging markets
May 16, 2017
1H 2016/17 2H 2016/17 FY 2016/17
in CHF million Sales Δ % in LC Sales Δ % in LC Sales Δ % in LC
EMEA 470.0 +12.2% 692.2 +53.2% 1,162.2 +33.8%
USA 383.0 -0.1% 404.3 +2.0% 787.3 +1.0%
Americas (excl. USA) 102.7 +3.1% 108.2 +4.5% 210.9 +3.8%
Asia / Pacific 114.2 +1.6% 121.1 +2.3% 235.3 +2.0%
Total SONOVA 1,069.9 +5.5% 1,325.8 +24.5% 2,395.7 +15.3%
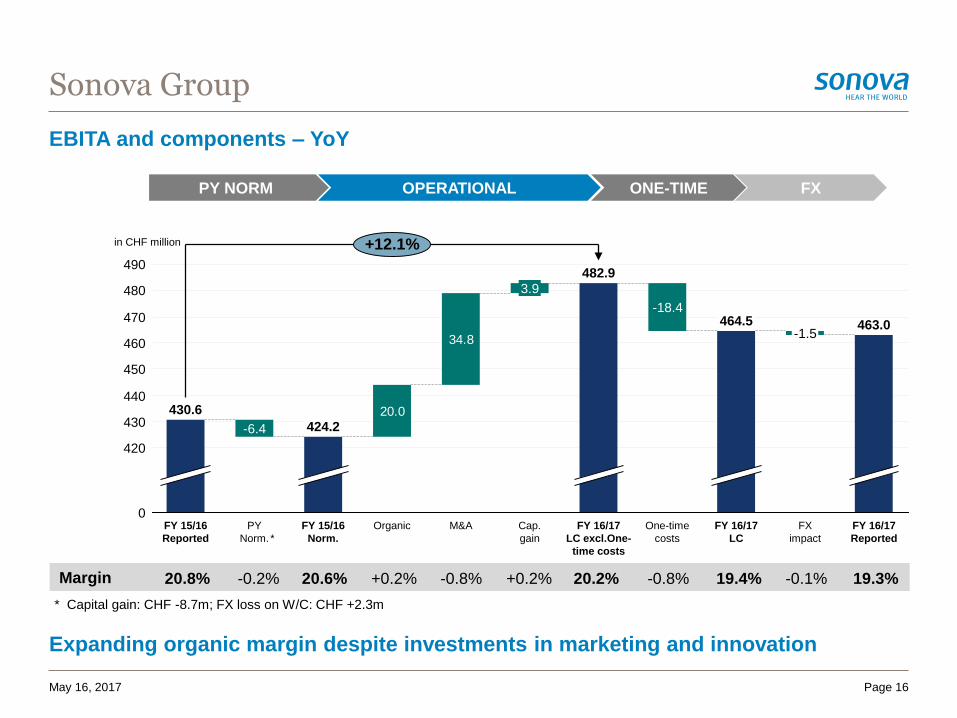
EBITA and components – YoY
Sonova Group
34.8
20.0
490
480
470
460
450
440
430
420
0
+12.1%
FY 16/17
Reported
463.0
FX
impact
-1.5
FY 16/17
LC
464.5
One-time
costs
-18.4
FY 16/17
LC excl.One-
time costs
482.9
Cap.
gain
3.9
M&AOrganicFY 15/16
Norm.
424.2
PY
Norm.
-6.4
FY 15/16
Reported
430.6
Margin 20.8% 19.3%
in CHF million
-0.1%-0.2% 20.6%
Page 16
OPERATIONAL FXPY NORM
20.2%-0.8%+0.2%
ONE-TIME
19.4%-0.8%
*
* Capital gain: CHF -8.7m; FX loss on W/C: CHF +2.3m
+0.2%
May 16, 2017
Expanding organic margin despite investments in marketing and innovation
2. Hearing Instruments Segment
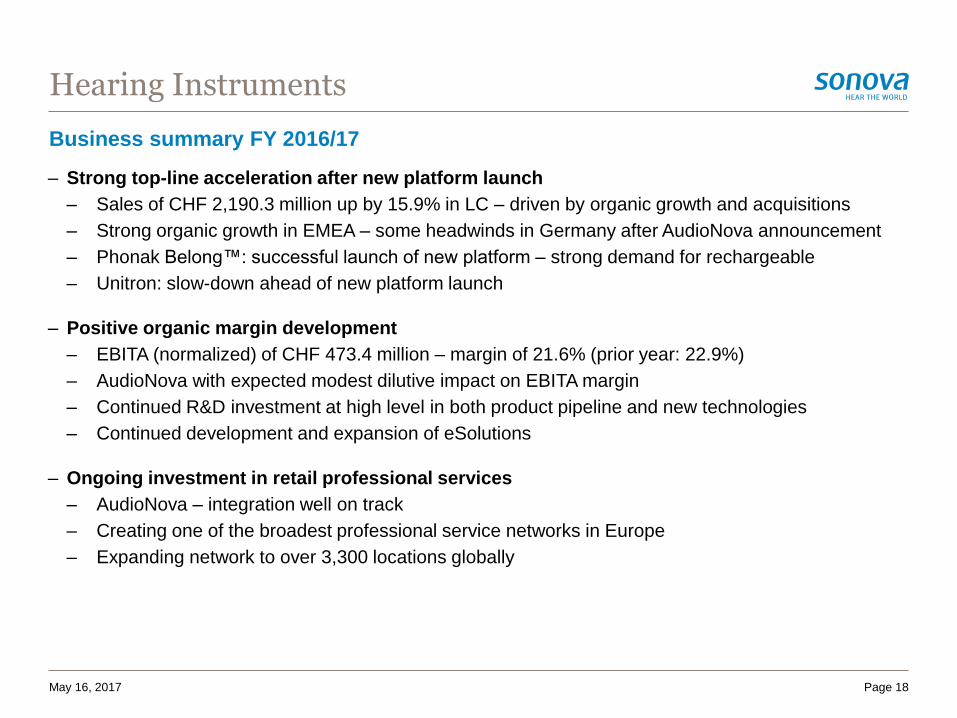
– Strong top-line acceleration after new platform launch
– Sales of CHF 2,190.3 million up by 15.9% in LC – driven by organic growth and acquisitions
– Strong organic growth in EMEA – some headwinds in Germany after AudioNova announcement
– Phonak Belong™: successful launch of new platform – strong demand for rechargeable
– Unitron: slow-down ahead of new platform launch
– Positive organic margin development
– EBITA (normalized) of CHF 473.4 million – margin of 21.6% (prior year: 22.9%)
– AudioNova with expected modest dilutive impact on EBITA margin
– Continued R&D investment at high level in both product pipeline and new technologies
– Continued development and expansion of eSolutions
– Ongoing investment in retail professional services
– AudioNova – integration well on track
– Creating one of the broadest professional service networks in Europe
– Expanding network to over 3,300 locations globally
Business summary FY 2016/17
Hearing Instruments
May 16, 2017 Page 18
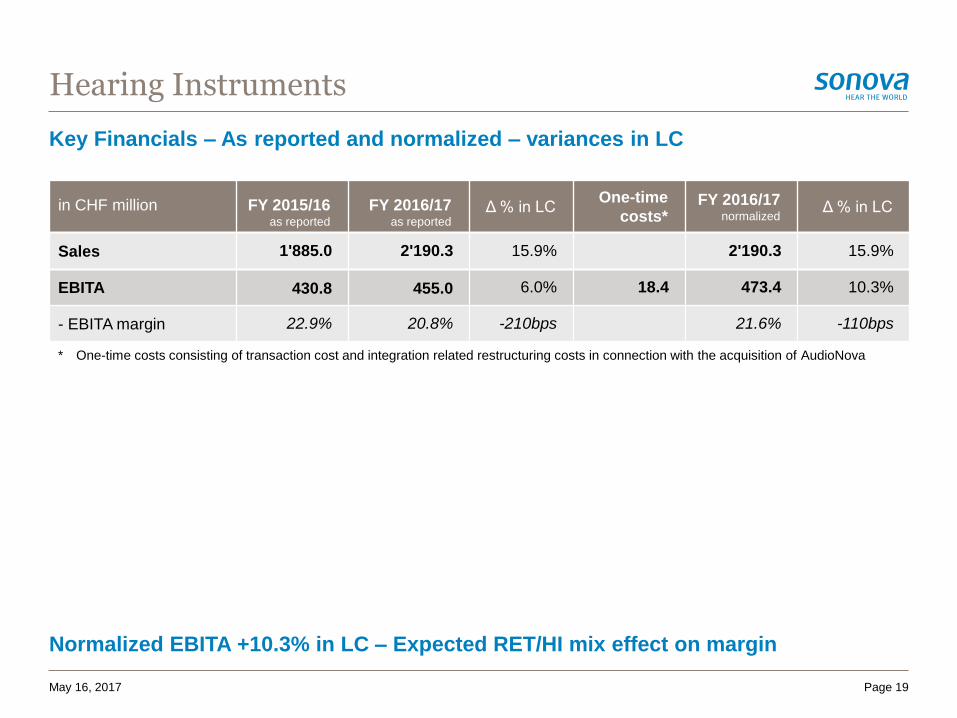
Key Financials – As reported and normalized – variances in LC
Normalized EBITA +10.3% in LC – Expected RET/HI mix effect on margin
Hearing Instruments
in CHF million FY 2015/16as reported
FY 2016/17as reported
Δ % in LC One-time
costs*FY 2016/17
normalizedΔ % in LC
Sales 1'885.0 2'190.3 15.9% 2'190.3 15.9%
EBITA 430.8 455.0 6.0% 18.4 473.4 10.3%
- EBITA margin 22.9% 20.8% -210bps 21.6% -110bps
Page 19May 16, 2017
* One-time costs consisting of transaction cost and integration related restructuring costs in connection with the acquisition of AudioNova
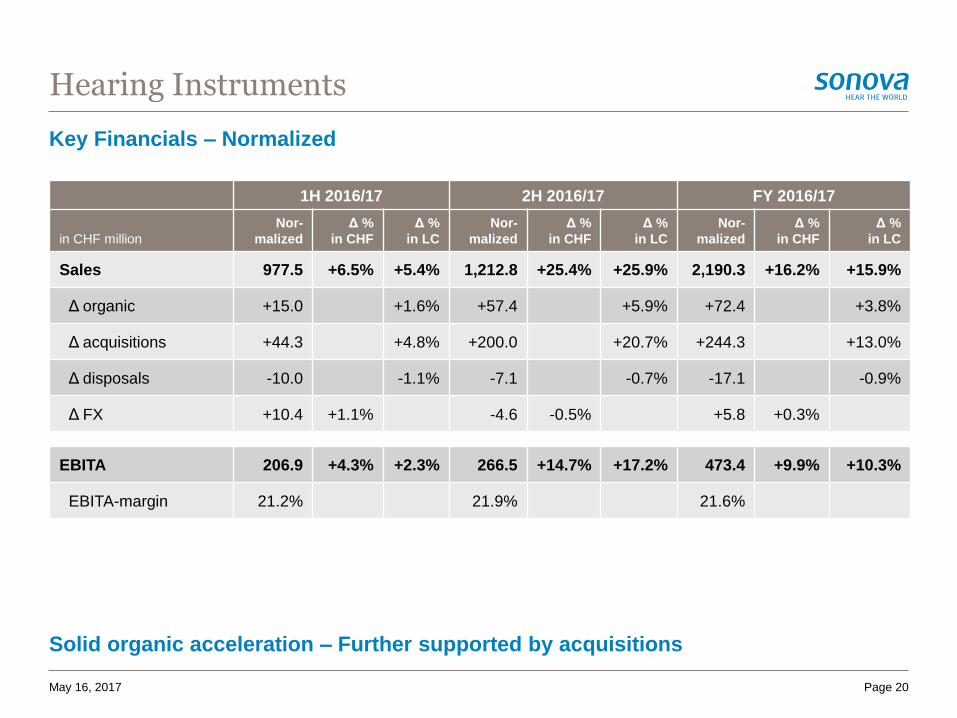
Key Financials – Normalized
Solid organic acceleration – Further supported by acquisitions
Hearing Instruments
Page 20May 16, 2017
1H 2016/17 2H 2016/17 FY 2016/17
in CHF million
Nor-
malized
Δ %
in CHF
Δ %
in LC
Nor-
malized
Δ %
in CHF
Δ %
in LC
Nor-
malized
Δ %
in CHF
Δ %
in LC
Sales 977.5 +6.5% +5.4% 1,212.8 +25.4% +25.9% 2,190.3 +16.2% +15.9%
Δ organic +15.0 +1.6% +57.4 +5.9% +72.4 +3.8%
Δ acquisitions +44.3 +4.8% +200.0 +20.7% +244.3 +13.0%
Δ disposals -10.0 -1.1% -7.1 -0.7% -17.1 -0.9%
Δ FX +10.4 +1.1% -4.6 -0.5% +5.8 +0.3%
EBITA 206.9 +4.3% +2.3% 266.5 +14.7% +17.2% 473.4 +9.9% +10.3%
EBITA-margin 21.2% 21.9% 21.6%
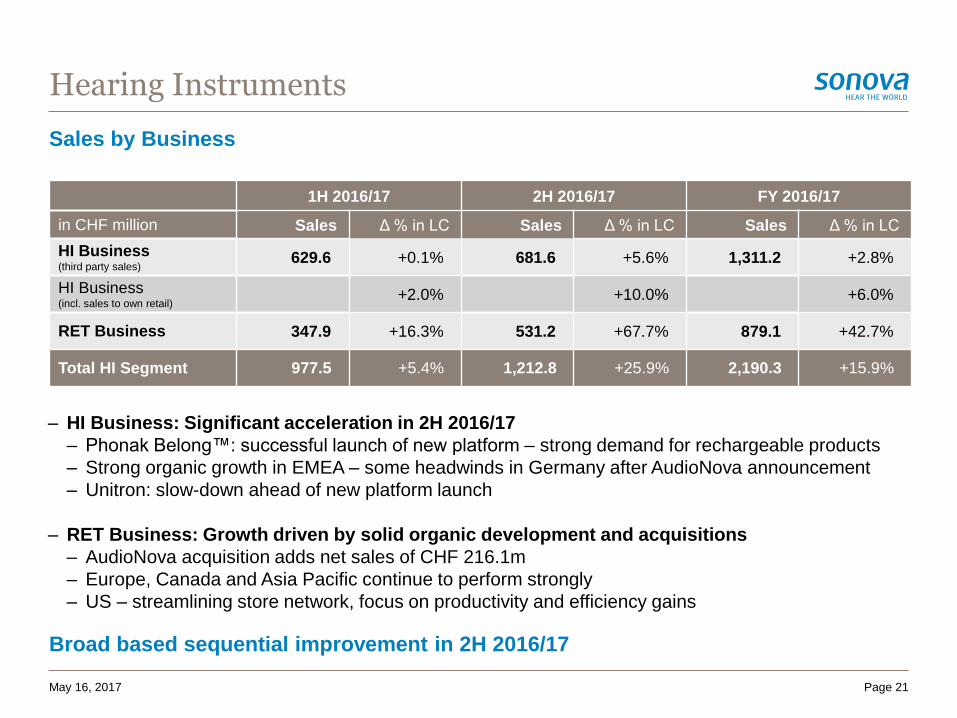
– HI Business: Significant acceleration in 2H 2016/17
– Phonak Belong™: successful launch of new platform – strong demand for rechargeable products
– Strong organic growth in EMEA – some headwinds in Germany after AudioNova announcement
– Unitron: slow-down ahead of new platform launch
– RET Business: Growth driven by solid organic development and acquisitions
– AudioNova acquisition adds net sales of CHF 216.1m
– Europe, Canada and Asia Pacific continue to perform strongly
– US – streamlining store network, focus on productivity and efficiency gains
Sales by Business
Broad based sequential improvement in 2H 2016/17
Hearing Instruments
May 16, 2017 Page 21
1H 2016/17 2H 2016/17 FY 2016/17
in CHF million Sales Δ % in LC Sales Δ % in LC Sales Δ % in LC
HI Business(third party sales)
629.6 +0.1% 681.6 +5.6% 1,311.2 +2.8%
HI Business (incl. sales to own retail)
+2.0% +10.0% +6.0%
RET Business 347.9 +16.3% 531.2 +67.7% 879.1 +42.7%
Total HI Segment 977.5 +5.4% 1,212.8 +25.9% 2,190.3 +15.9%
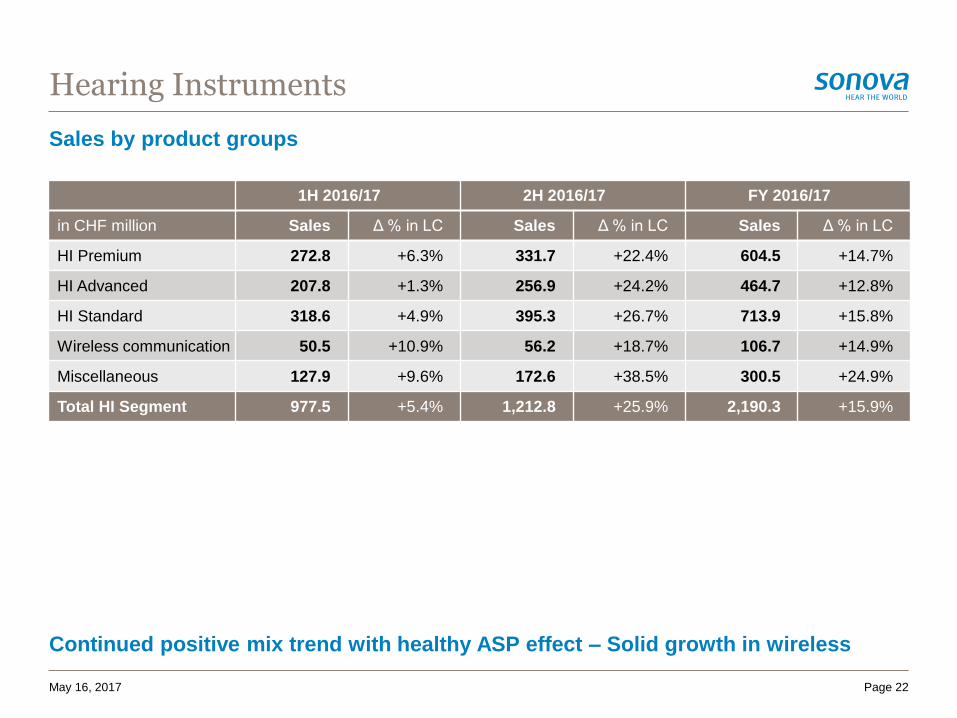
Sales by product groups
Continued positive mix trend with healthy ASP effect – Solid growth in wireless
Hearing Instruments
Page 22May 16, 2017
1H 2016/17 2H 2016/17 FY 2016/17
in CHF million Sales Δ % in LC Sales Δ % in LC Sales Δ % in LC
HI Premium 272.8 +6.3% 331.7 +22.4% 604.5 +14.7%
HI Advanced 207.8 +1.3% 256.9 +24.2% 464.7 +12.8%
HI Standard 318.6 +4.9% 395.3 +26.7% 713.9 +15.8%
Wireless communication 50.5 +10.9% 56.2 +18.7% 106.7 +14.9%
Miscellaneous 127.9 +9.6% 172.6 +38.5% 300.5 +24.9%
Total HI Segment 977.5 +5.4% 1,212.8 +25.9% 2,190.3 +15.9%

3. Cochlear Implants Segment
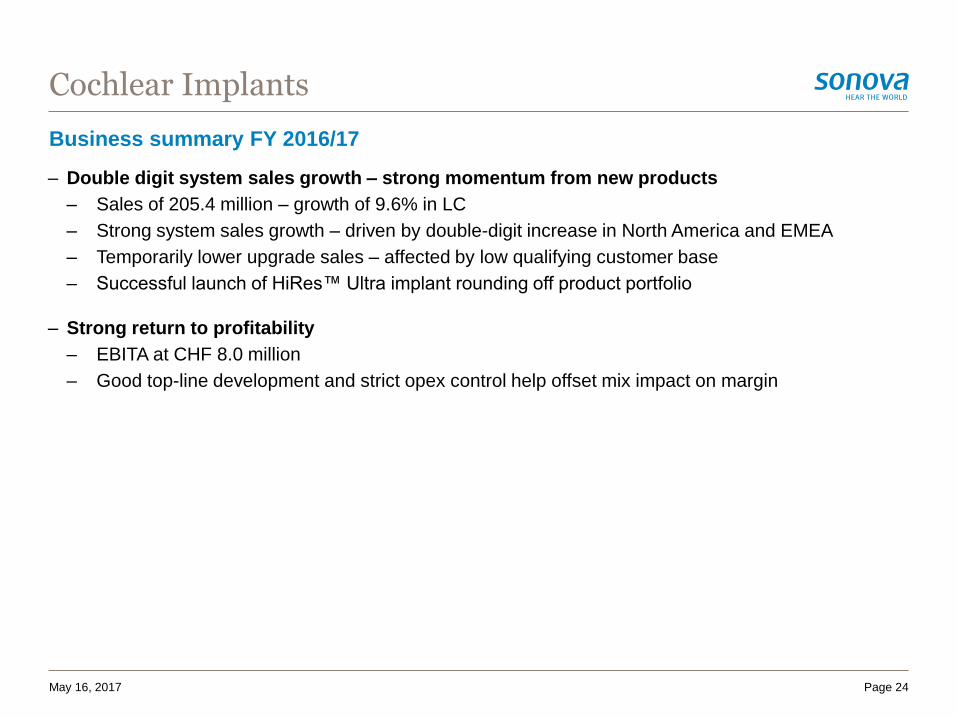
– Double digit system sales growth – strong momentum from new products
– Sales of 205.4 million – growth of 9.6% in LC
– Strong system sales growth – driven by double-digit increase in North America and EMEA
– Temporarily lower upgrade sales – affected by low qualifying customer base
– Successful launch of HiRes™ Ultra implant rounding off product portfolio
– Strong return to profitability
– EBITA at CHF 8.0 million
– Good top-line development and strict opex control help offset mix impact on margin
Business summary FY 2016/17
Cochlear Implants
Page 24May 16, 2017
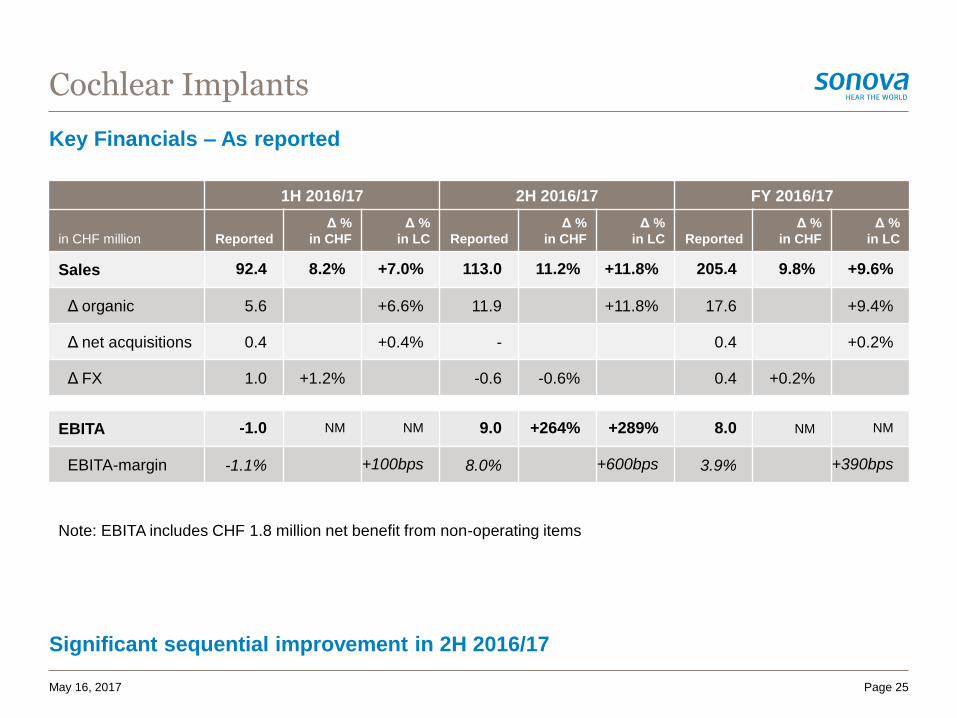
Key Financials – As reported
Significant sequential improvement in 2H 2016/17
Cochlear Implants
Page 25May 16, 2017
Note: EBITA includes CHF 1.8 million net benefit from non-operating items
1H 2016/17 2H 2016/17 FY 2016/17
in CHF million Reported
Δ %
in CHF
Δ %
in LC Reported
Δ %
in CHF
Δ %
in LC Reported
Δ %
in CHF
Δ %
in LC
Sales 92.4 8.2% +7.0% 113.0 11.2% +11.8% 205.4 9.8% +9.6%
Δ organic 5.6 +6.6% 11.9 +11.8% 17.6 +9.4%
Δ net acquisitions 0.4 +0.4% - 0.4 +0.2%
Δ FX 1.0 +1.2% -0.6 -0.6% 0.4 +0.2%
EBITA -1.0 NM NM 9.0 +264% +289% 8.0 NM NM
EBITA-margin -1.1% +100bps 8.0% +600bps 3.9% +390bps
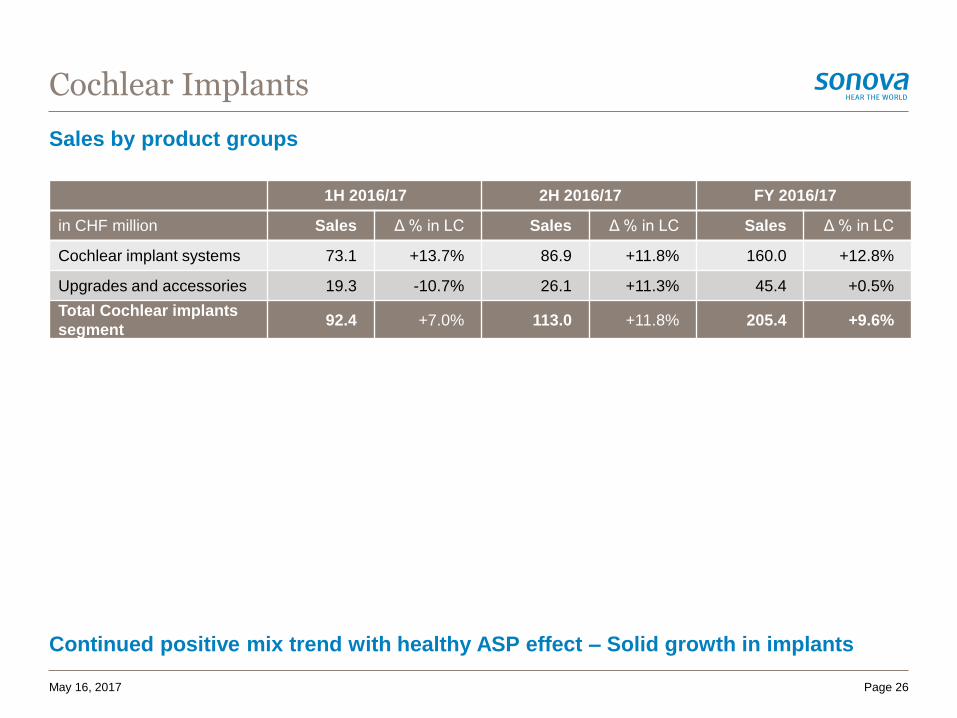
Sales by product groups
Continued positive mix trend with healthy ASP effect – Solid growth in implants
Cochlear Implants
Page 26May 16, 2017
1H 2016/17 2H 2016/17 FY 2016/17
in CHF million Sales Δ % in LC Sales Δ % in LC Sales Δ % in LC
Cochlear implant systems 73.1 +13.7% 86.9 +11.8% 160.0 +12.8%
Upgrades and accessories 19.3 -10.7% 26.1 +11.3% 45.4 +0.5%
Total Cochlear implants
segment92.4 +7.0% 113.0 +11.8% 205.4 +9.6%
4. Financial Review 2016/17
– Sales of CHF 2,395.7 million – driven by organic growth and acquisitions
– Gross Profit of CHF 1,651.8 million or 68.9% of sales
– Reported EBITA margin of 19.3%
– Continued investment in innovation – gross R&D spending of CHF 159.4 million or 6.7% of sales
– Increase of sales and marketing cost ratio by 320bps to 34% – driven by retail acquisitions
– CHF 18.4 million one-time costs consisting of transaction cost and integration related restructuring
costs in connection with the acquisition of AudioNova
– Normalized basic EPS of CHF 5.58 – up 9.2% vs. prior year
– Operating free cash flow at 424.8 million – up 23.4% vs. prior year
– Cash outflow for acquisitions (gross of debt acquired) at CHF 966.1 million
– CHF 880 million bridge facility refinanced through bond issuance in October 2016
– Solid balance sheet with equity ratio of 54.2% – increase in capital employed to CHF 2.5 billion
Sonova Group – Financial highlights
Financial review 2016/17
Page 28May 16, 2017
Financial review 2016/17
Sonova Group – Key Financials – As reported and normalized – variances in CHF
Normalized EBITA +11.8% as reported in CHF
Page 29May 16, 2017
in CHF millionFY 2015/16
as reported
FY 2016/17as reported
Δ % in CHF One-time
costs*FY 2016/17
normalizedΔ % in CHF
Sales 2'071.9 2'395.7 15.6% 2'395.7 15.6%
Gross profit 1'375.5 1'651.8 20.1% 1'651.8 20.1%
- Gross profit margin 66.4% 68.9% +250bps 68.9% +250bps
OPEX -944.8 -1'188.8 25.8% 18.4 -1'170.3 23.9%
EBITA 430.6 463.0 7.5% 18.4 481.4 11.8%
- EBITA margin 20.8% 19.3% -150bps 20.1% -70bps
EPS (in CHF) 5.11 5.35 +4.7% 0.23 5.58 +9.2%
Operating free cash flow 344.2 424.8 +23.4%
ROCE 26.0% 20.4%
* One-time costs, consisting of transaction cost and integration related restructuring costs in connection with the acquisition of AudioNova
Note: EPS:CHF 5.67 (+11%), adjusted for one-time cost and temporary tax rate increase pending full integration of AudioNova
Sonova Group – Operating expenses
Continued investment in innovation and marketing – Expansion in sales & distribution
Financial review 2016/17
Page 30May 16, 2017
in CHF million FY 2015/16 FY 2016/17 Δ % in CHF Δ % in LC Comments
Research & Development- in % of sales
-130.36.3%
-137.15.7%
+5.3% +5.0% Continued investment in next
generation platform – ratio change
driven by larger share of retail
Sales & Marketing- in % of sales
-638.230.8%
-811.033.9%
+27.1% +26.9% Driven by AudioNova acquisition
thus resulting in higher share of
retail
General & Administration- in % of sales
-194.29.4%
-228.59.5%
+17.6% +17.3% Driven by AudioNova acquisition
thus resulting in higher share of
retail
Other income and
expenses
17.9 6.3 -64.8% -64.8% Lower capital gains vs prior year
Total OPEX normalized*- in % of sales
-944.845.6%
-1,170.348.9%
+23.9% +23.7%
Total OPEX reported- in % of sales
-944.845.6%
-1,188.849.6%
+25.8% +25.7%
* Excludes one-time costs of CHF 18.4 million, consisting of transaction cost and integration related restructuring costs in connection with the
acquisition of AudioNova
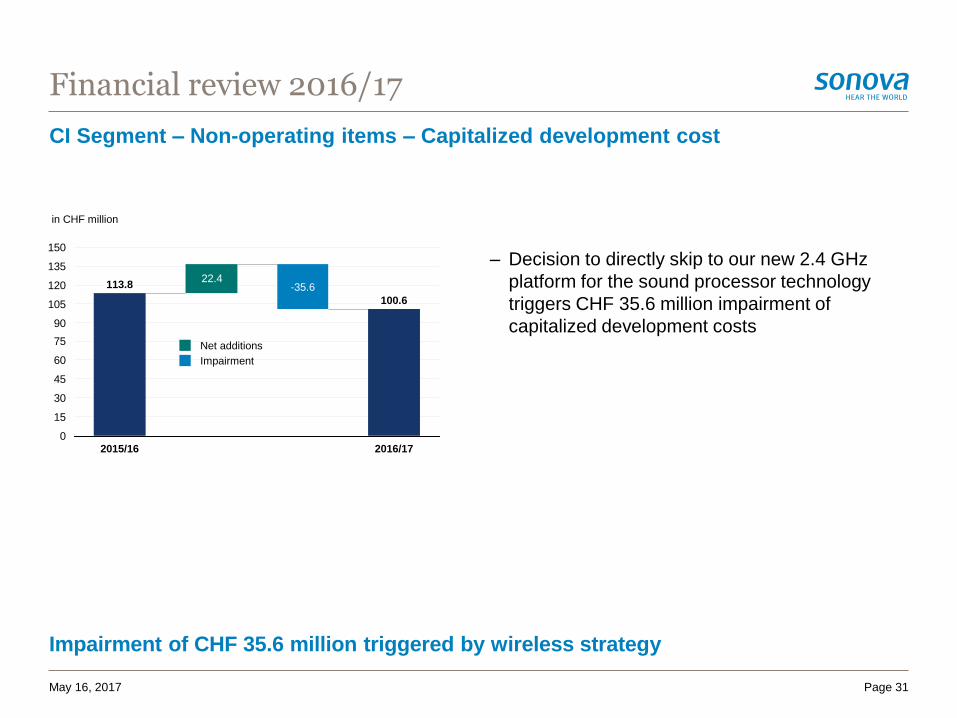
CI Segment – Non-operating items – Capitalized development cost
Impairment of CHF 35.6 million triggered by wireless strategy
Financial review 2016/17
22.4
0
15
30
45
60
75
90
105
120
135
150
2016/17
113.8
100.6
-35.6
2015/16
in CHF million
Net additions
Impairment
May 16, 2017 Page 31
– Decision to directly skip to our new 2.4 GHz
platform for the sound processor technology
triggers CHF 35.6 million impairment of
capitalized development costs
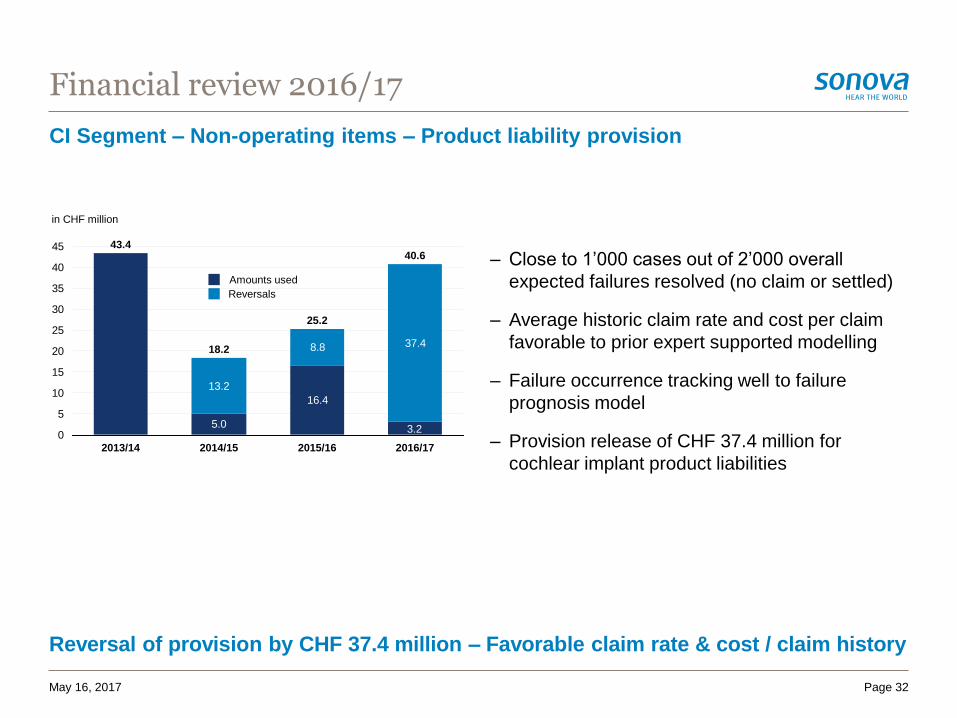
CI Segment – Non-operating items – Product liability provision
Reversal of provision by CHF 37.4 million – Favorable claim rate & cost / claim history
Financial review 2016/17
May 16, 2017 Page 32
– Close to 1’000 cases out of 2’000 overall
expected failures resolved (no claim or settled)
– Average historic claim rate and cost per claim
favorable to prior expert supported modelling
– Failure occurrence tracking well to failure
prognosis model
– Provision release of CHF 37.4 million for
cochlear implant product liabilities
Amounts used
Reversals
5.0
16.4
13.2
8.8 37.4
3.20
5
10
15
20
25
30
35
40
45
2016/17
18.2
2014/152013/14
43.440.6
25.2
2015/16
in CHF million
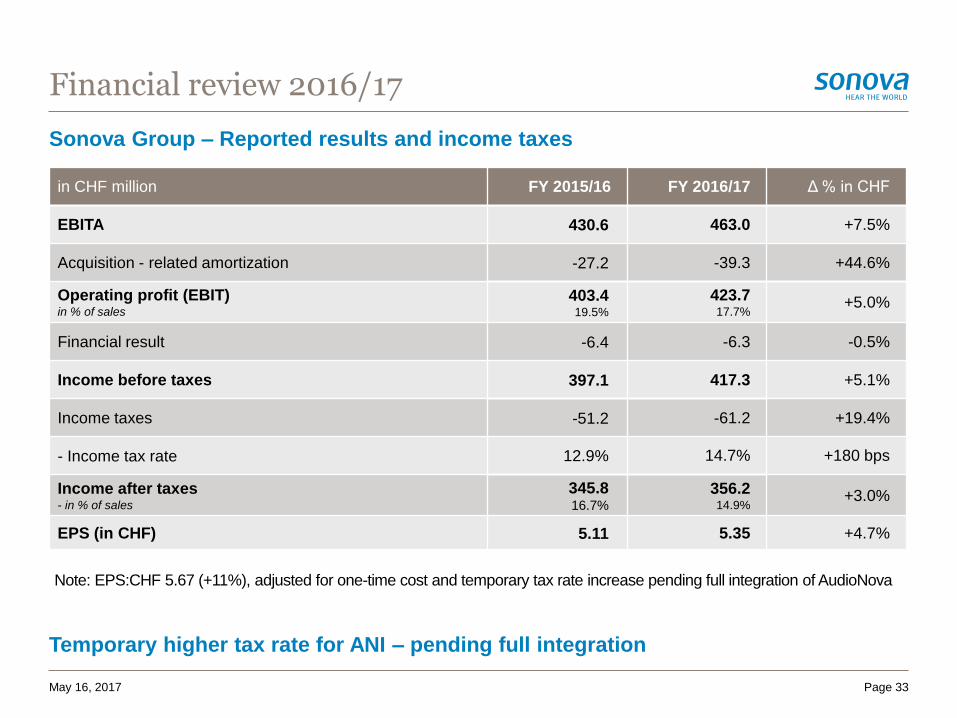
Sonova Group – Reported results and income taxes
Financial review 2016/17
Page 33
Temporary higher tax rate for ANI – pending full integration
May 16, 2017
in CHF million FY 2015/16 FY 2016/17 Δ % in CHF
EBITA 430.6 463.0 +7.5%
Acquisition - related amortization -27.2 -39.3 +44.6%
Operating profit (EBIT)in % of sales
403.419.5%
423.717.7%
+5.0%
Financial result -6.4 -6.3 -0.5%
Income before taxes 397.1 417.3 +5.1%
Income taxes -51.2 -61.2 +19.4%
- Income tax rate 12.9% 14.7% +180 bps
Income after taxes- in % of sales
345.816.7%
356.214.9%
+3.0%
EPS (in CHF) 5.11 5.35 +4.7%
Note: EPS:CHF 5.67 (+11%), adjusted for one-time cost and temporary tax rate increase pending full integration of AudioNova
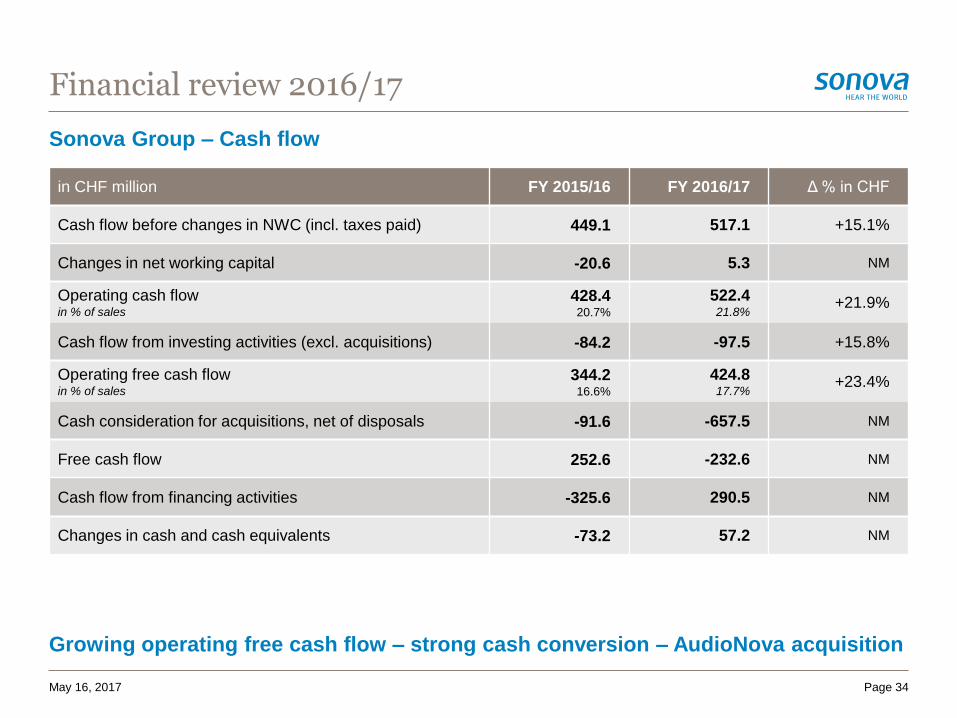
Sonova Group – Cash flow
Financial review 2016/17
Page 34
Growing operating free cash flow – strong cash conversion – AudioNova acquisition
May 16, 2017
in CHF million FY 2015/16 FY 2016/17 Δ % in CHF
Cash flow before changes in NWC (incl. taxes paid) 449.1 517.1 +15.1%
Changes in net working capital -20.6 5.3 NM
Operating cash flowin % of sales
428.420.7%
522.421.8%
+21.9%
Cash flow from investing activities (excl. acquisitions) -84.2 -97.5 +15.8%
Operating free cash flowin % of sales
344.216.6%
424.817.7%
+23.4%
Cash consideration for acquisitions, net of disposals -91.6 -657.5 NM
Free cash flow 252.6 -232.6 NM
Cash flow from financing activities -325.6 290.5 NM
Changes in cash and cash equivalents -73.2 57.2 NM
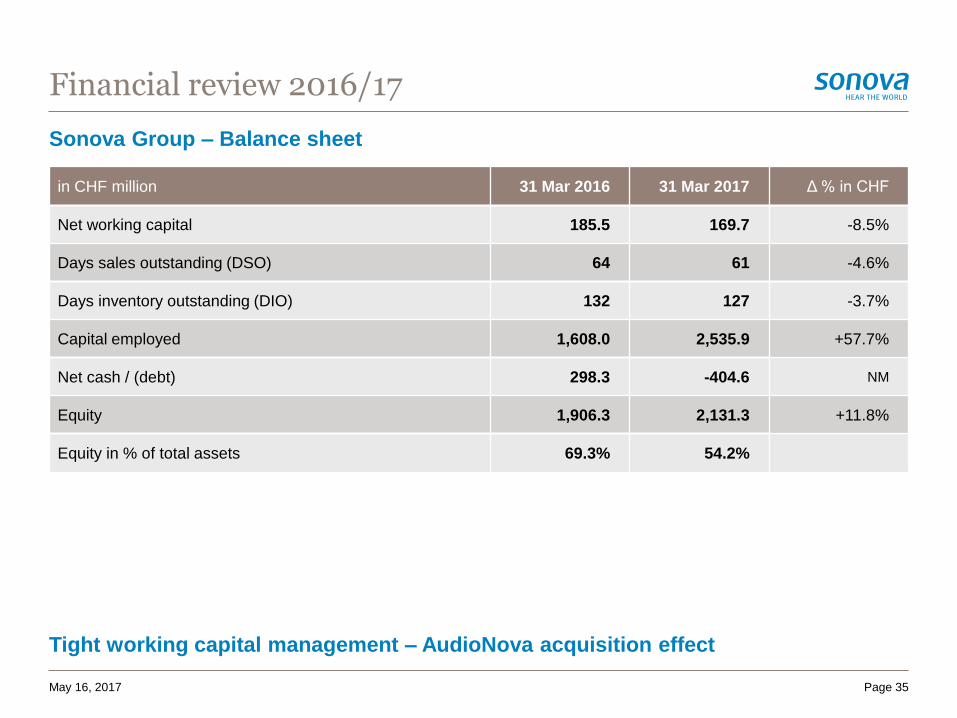
Sonova Group – Balance sheet
Financial review 2016/17
Page 35
Tight working capital management – AudioNova acquisition effect
May 16, 2017
in CHF million 31 Mar 2016 31 Mar 2017 Δ % in CHF
Net working capital 185.5 169.7 -8.5%
Days sales outstanding (DSO) 64 61 -4.6%
Days inventory outstanding (DIO) 132 127 -3.7%
Capital employed 1,608.0 2,535.9 +57.7%
Net cash / (debt) 298.3 -404.6 NM
Equity 1,906.3 2,131.3 +11.8%
Equity in % of total assets 69.3% 54.2%

5. Outlook 2017/18
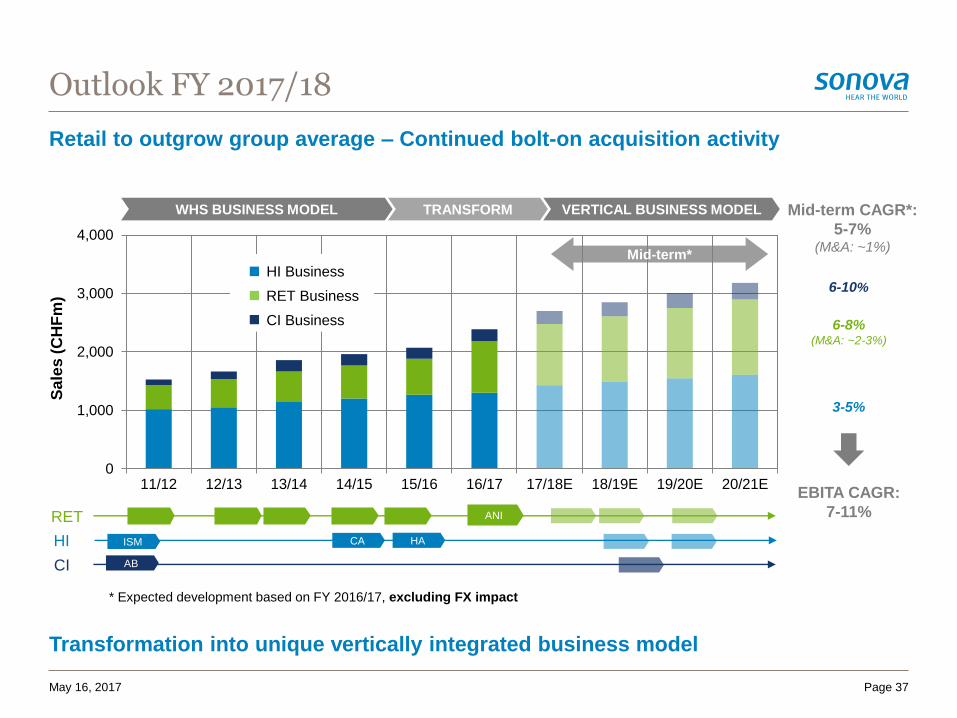
Retail to outgrow group average – Continued bolt-on acquisition activity
Transformation into unique vertically integrated business model
0
1,000
2,000
3,000
4,000
11/12 12/13 13/14 14/15 15/16 16/17 17/18E 18/19E 19/20E 20/21E
WHS BUSINESS MODEL TRANSFORM VERTICAL BUSINESS MODEL
Sa
les
(C
HF
m)
HI
RET ANI
CI AB
CA HAISM
Mid-term CAGR*:
5-7%(M&A: ~1%)
6-10%
6-8%(M&A: ~2-3%)
3-5%
EBITA CAGR:
7-11%
Mid-term*
Page 37
RET Business
HI Business
CI Business
May 16, 2017
Outlook FY 2017/18
* Expected development based on FY 2016/17, excluding FX impact
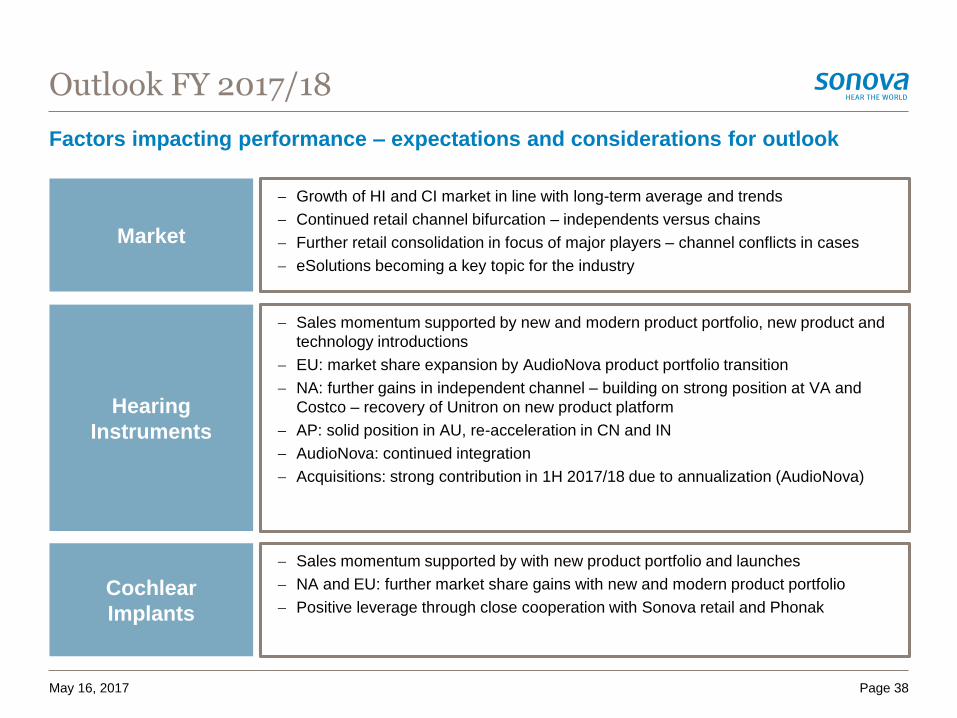
Outlook FY 2017/18
Factors impacting performance – expectations and considerations for outlook
May 16, 2017 Page 38
Market
Hearing
Instruments
Cochlear
Implants
Growth of HI and CI market in line with long-term average and trends
Continued retail channel bifurcation – independents versus chains
Further retail consolidation in focus of major players – channel conflicts in cases
eSolutions becoming a key topic for the industry
Sales momentum supported by new and modern product portfolio, new product and
technology introductions
EU: market share expansion by AudioNova product portfolio transition
NA: further gains in independent channel – building on strong position at VA and
Costco – recovery of Unitron on new product platform
AP: solid position in AU, re-acceleration in CN and IN
AudioNova: continued integration
Acquisitions: strong contribution in 1H 2017/18 due to annualization (AudioNova)
Sales momentum supported by with new product portfolio and launches
NA and EU: further market share gains with new and modern product portfolio
Positive leverage through close cooperation with Sonova retail and Phonak
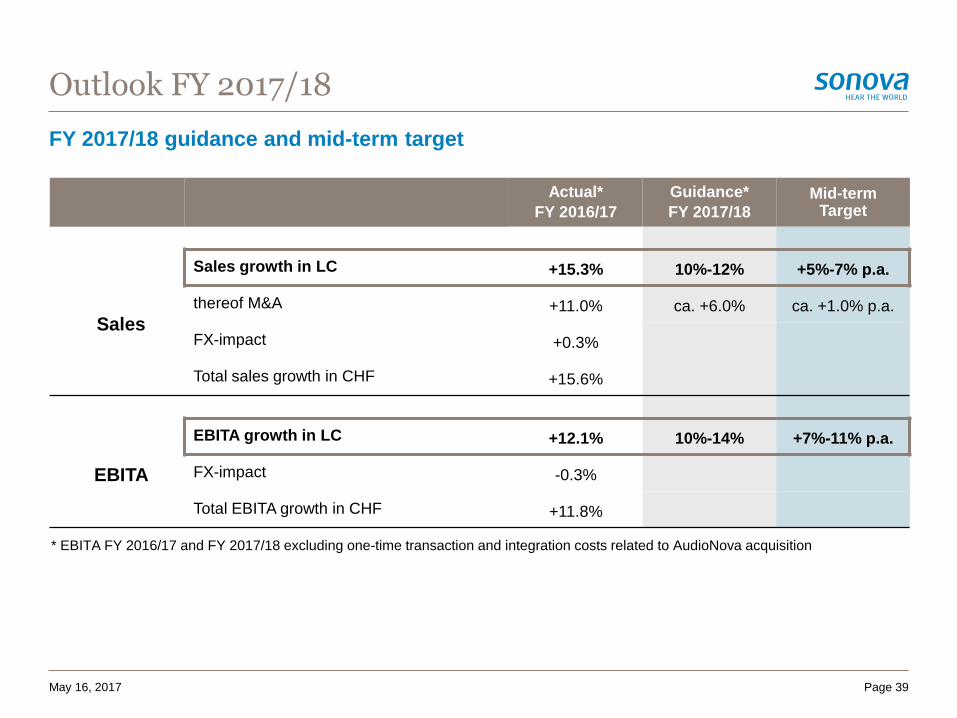
FY 2017/18 guidance and mid-term target
Outlook FY 2017/18
Page 39
* EBITA FY 2016/17 and FY 2017/18 excluding one-time transaction and integration costs related to AudioNova acquisition
May 16, 2017
Actual*
FY 2016/17
Guidance*
FY 2017/18Mid-term
Target
Sales
Sales growth in LC +15.3% 10%-12% +5%-7% p.a.
thereof M&A +11.0% ca. +6.0% ca. +1.0% p.a.
FX-impact +0.3%
Total sales growth in CHF +15.6%
EBITA
EBITA growth in LC +12.1% 10%-14% +7%-11% p.a.
FX-impact -0.3%
Total EBITA growth in CHF +11.8%
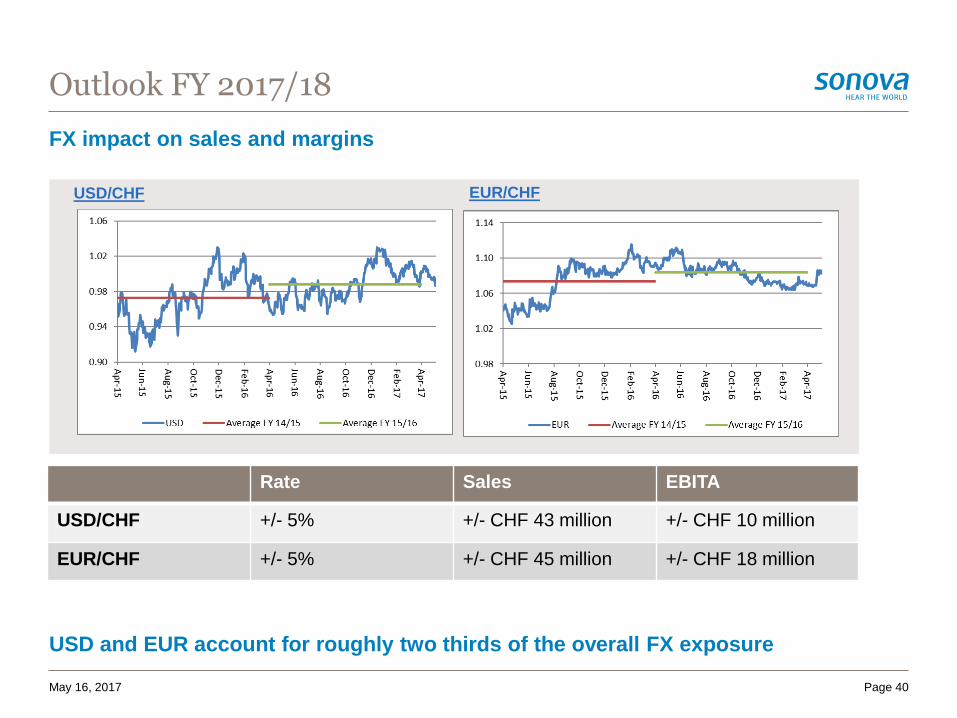
FX impact on sales and margins
USD and EUR account for roughly two thirds of the overall FX exposure
Outlook FY 2017/18
USD/CHF EUR/CHF
Rate Sales EBITA
USD/CHF +/- 5% +/- CHF 43 million +/- CHF 10 million
EUR/CHF +/- 5% +/- CHF 45 million +/- CHF 18 million
Page 40May 16, 2017
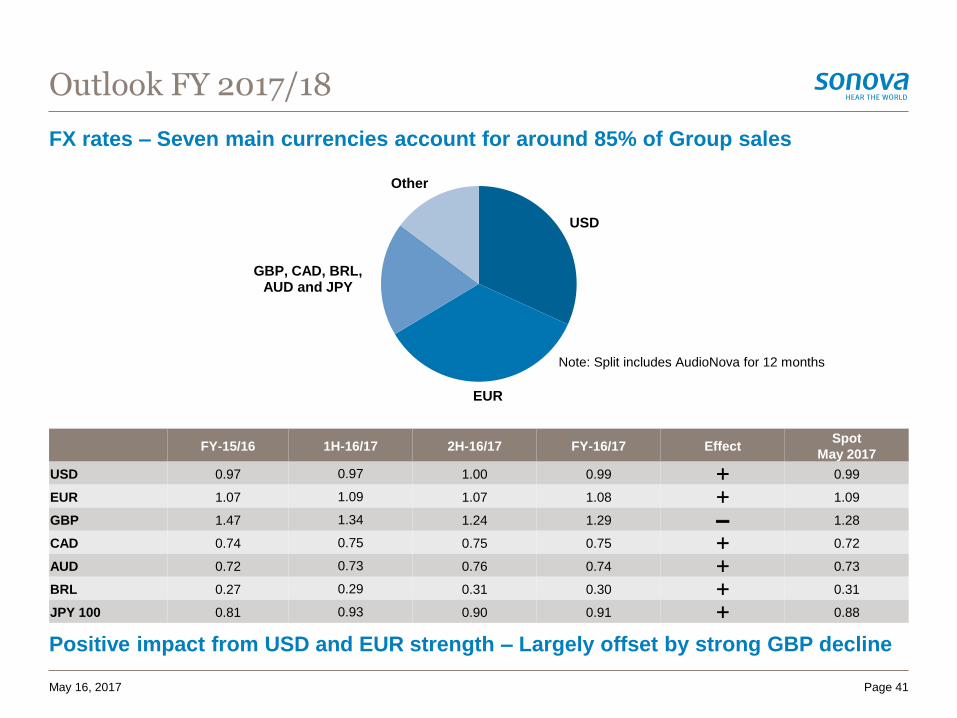
FX rates – Seven main currencies account for around 85% of Group sales
Positive impact from USD and EUR strength – Largely offset by strong GBP decline
Outlook FY 2017/18
Page 41May 16, 2017
USD
EUR
GBP, CAD, BRL, AUD and JPY
Other
Note: Split includes AudioNova for 12 months
FY-15/16 1H-16/17 2H-16/17 FY-16/17 EffectSpot
May 2017
USD 0.97 0.97 1.00 0.99 0.99
EUR 1.07 1.09 1.07 1.08 1.09
GBP 1.47 1.34 1.24 1.29 – 1.28
CAD 0.74 0.75 0.75 0.75 0.72
AUD 0.72 0.73 0.76 0.74 0.73
BRL 0.27 0.29 0.31 0.30 0.31
JPY 100 0.81 0.93 0.90 0.91 0.88

6. Questions & Answers

7. Upcoming Events
Important dates
Upcoming events
17-26 May 2017 Roadshow Full-Year Results 2016/17
13 Jun 2017 Annual General Meeting
17 Oct 2017 6. Sonova Investor & Analyst Day
13 Nov 2017 Publication & Call Half-Year Results 2017/18
May 16, 2017 Page 44
Thomas Bernhardsgrütter
Director Investor Relations
Phone +41 58 928 33 44
Mobile +41 79 618 28 07
Email [email protected]
Corinne Hofmann
Investor Relations Associate
Phone +41 58 928 33 22
Email [email protected]
Investor Relations
Contacts
Michael Isaac
Head of Media Relations
Phone +41 58 928 33 24
Mobile +41 79 420 29 56
Email [email protected]
Patrick Lehn
Corporate Communications Manager
Phone +41 58 928 33 23
Mobile +41 79 410 82 84
Email [email protected]
Media Relations
Page 45May 16, 2017