Embed Size (px)
Citation preview

1
Full Year 2013 Financial Results
23 January 2014
2
Scope of Briefing
Address by Chief Executive Officer
Group Financial Highlights
Business Review & Outlook
3
Address by
Chief Executive Officer
4
Clarity of Focus
Staying on multi-business strategy
Building on strong foundations:
Commitment to quality execution
Raising productivity & efficiencies
Investing in people & technology innovation
Ensuring financial discipline
Maintaining a strong balance sheet

5
Gradual Global Recovery
Broad-based recovery in the US
Patchy recovery in Europe
China expected to grow at a modest pace

6
Performance Highlights
FY 2013 net profit was S$1.4b
ROE was 14.9%
FY 2013 EVA was S$939m
Total distribution of 49.5 cts per share
The financials exclude revaluation, major impairment and divestments.
7
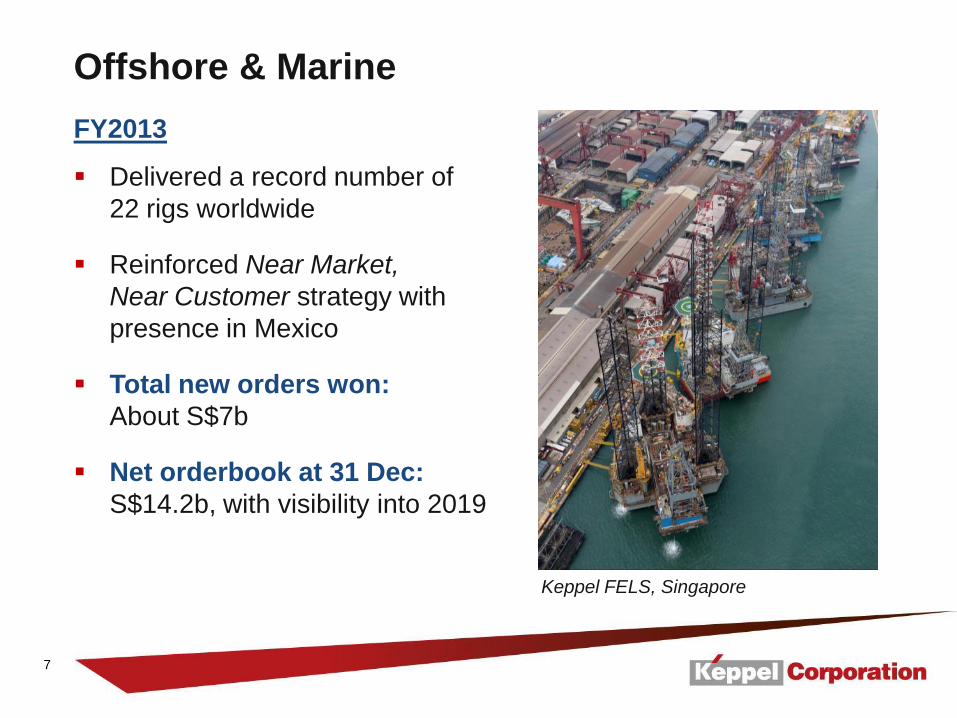
Offshore & Marine
FY2013
Delivered a record number of
22 rigs worldwide
Reinforced Near Market,
Near Customer strategy with
presence in Mexico
Total new orders won:
About S$7b
Net orderbook at 31 Dec:
S$14.2b, with visibility into 2019
Keppel FELS, Singapore
8
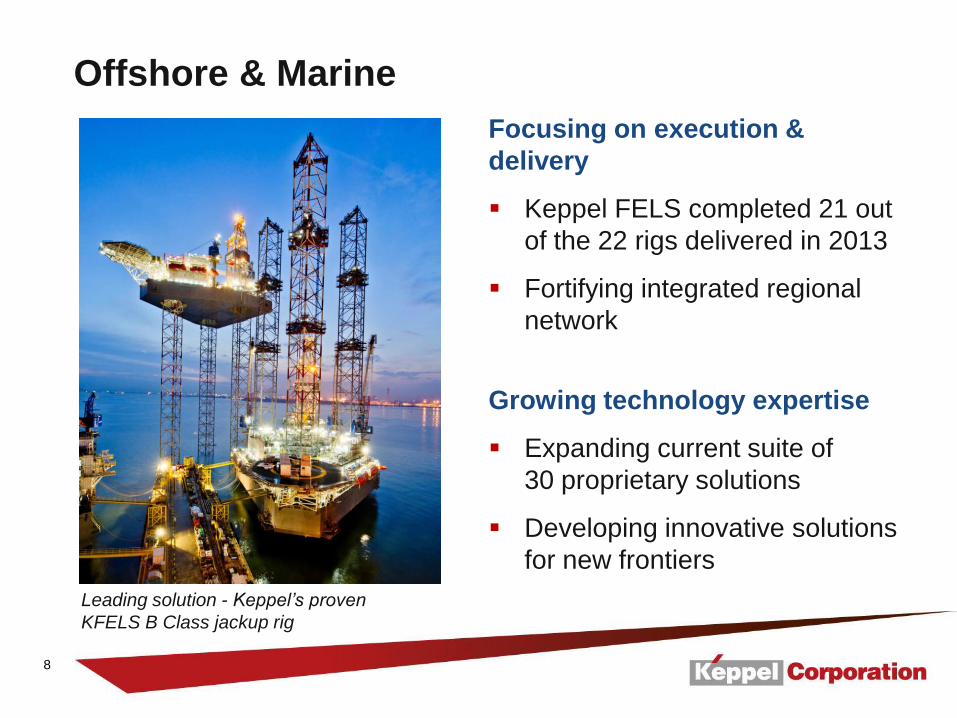
Offshore & Marine
Focusing on execution &
delivery
Keppel FELS completed 21 out
of the 22 rigs delivered in 2013
Fortifying integrated regional
network
Growing technology expertise
Expanding current suite of
30 proprietary solutions
Developing innovative solutions
for new frontiers
Leading solution - Keppel’s proven
KFELS B Class jackup rig
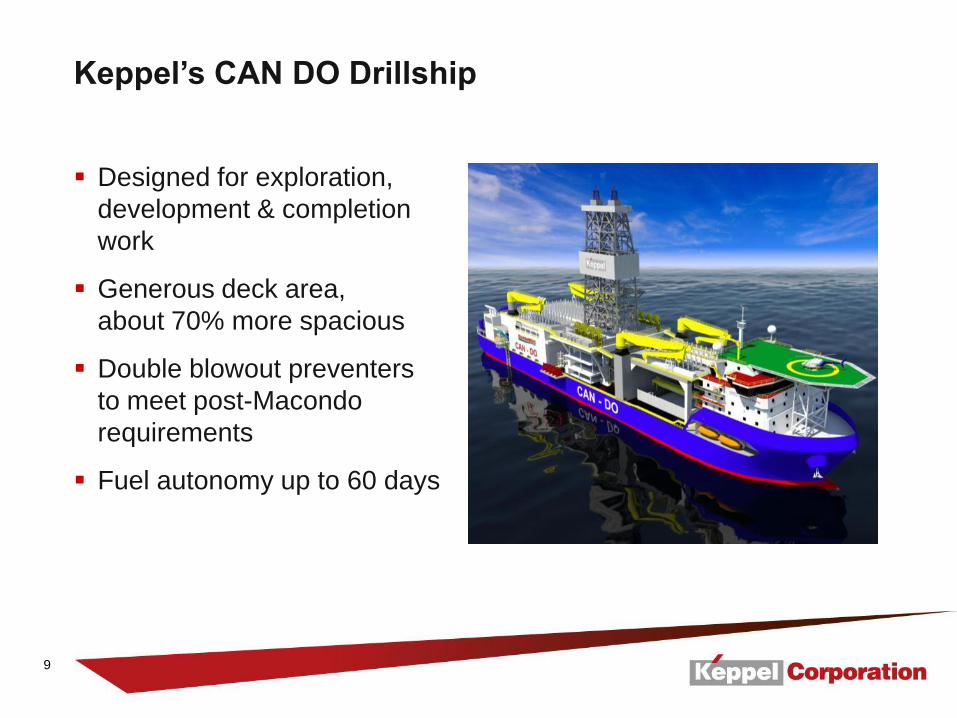
9
Designed for exploration,
development & completion
work
Generous deck area,
about 70% more spacious
Double blowout preventers
to meet post-Macondo
requirements
Fuel autonomy up to 60 days
Keppel’s CAN DO Drillship
10
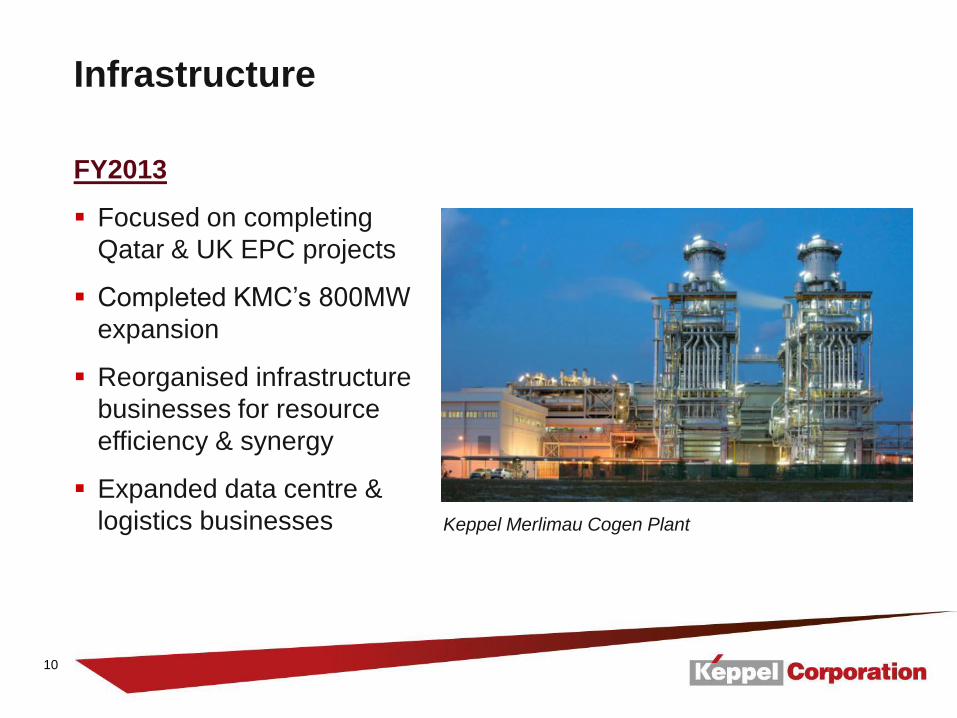
Infrastructure
FY2013
Focused on completing
Qatar & UK EPC projects
Completed KMC’s 800MW
expansion
Reorganised infrastructure
businesses for resource
efficiency & synergy
Expanded data centre &
logistics businesses
Keppel Merlimau Cogen Plant
11
Infrastructure
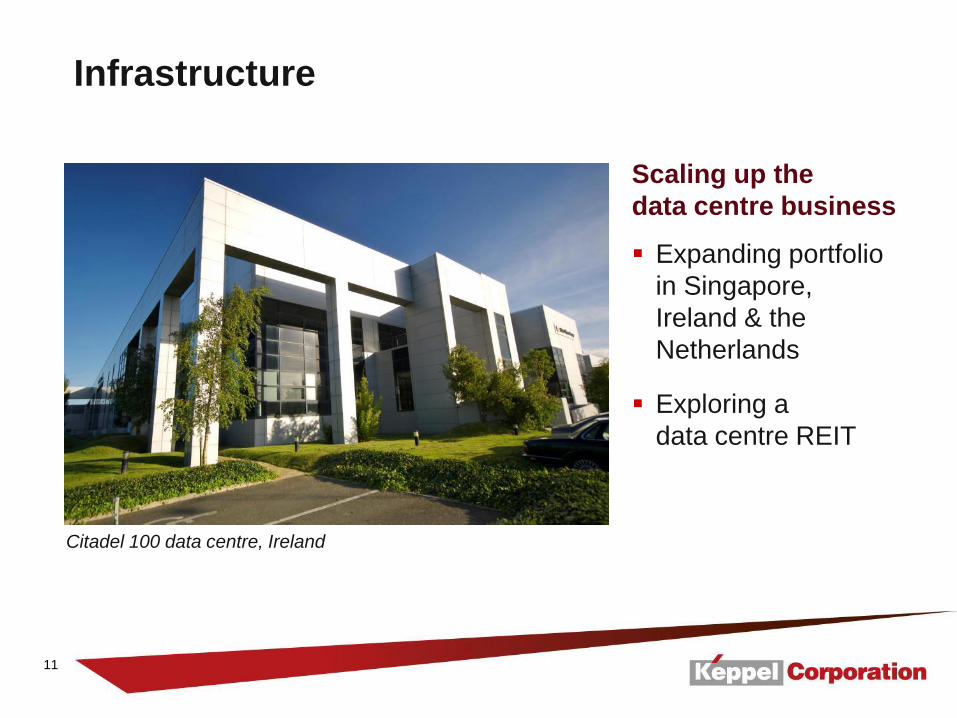
Scaling up the
data centre business
Expanding portfolio
in Singapore,
Ireland & the
Netherlands
Exploring a
data centre REIT
Citadel 100 data centre, Ireland

12
Infrastructure
Expanding logistics network in China
Acquired an integrated port logistics facility in Sanshui, Foshan
Logistics hubs in Anhui, Jilin and Tianjin to be operational in 2015
Sino-Singapore Jilin Food Zone
International Logistics Park
Tianjin Eco-City Integrated Distribution Hub
Sanshui Port, Foshan
Wuhu Sanshan Port, Wuhu
Keppel Wanjiang International Coldchain
Logistics Park, Anhui
Lanshi Port, Foshan
Under construction:
Operational:
Nanhai Distribution Centre, Foshan
13
Property
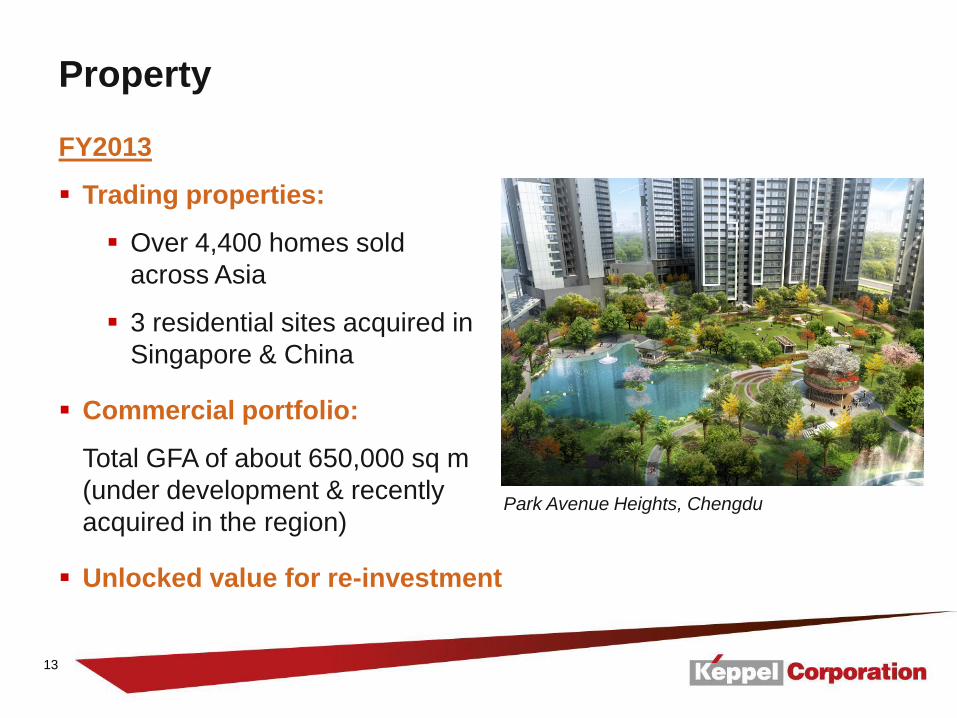
FY2013
Trading properties:
Over 4,400 homes sold
across Asia
3 residential sites acquired in
Singapore & China
Commercial portfolio:
Total GFA of about 650,000 sq m
(under development & recently
acquired in the region)
Unlocked value for re-investment
Park Avenue Heights, Chengdu
14
Property
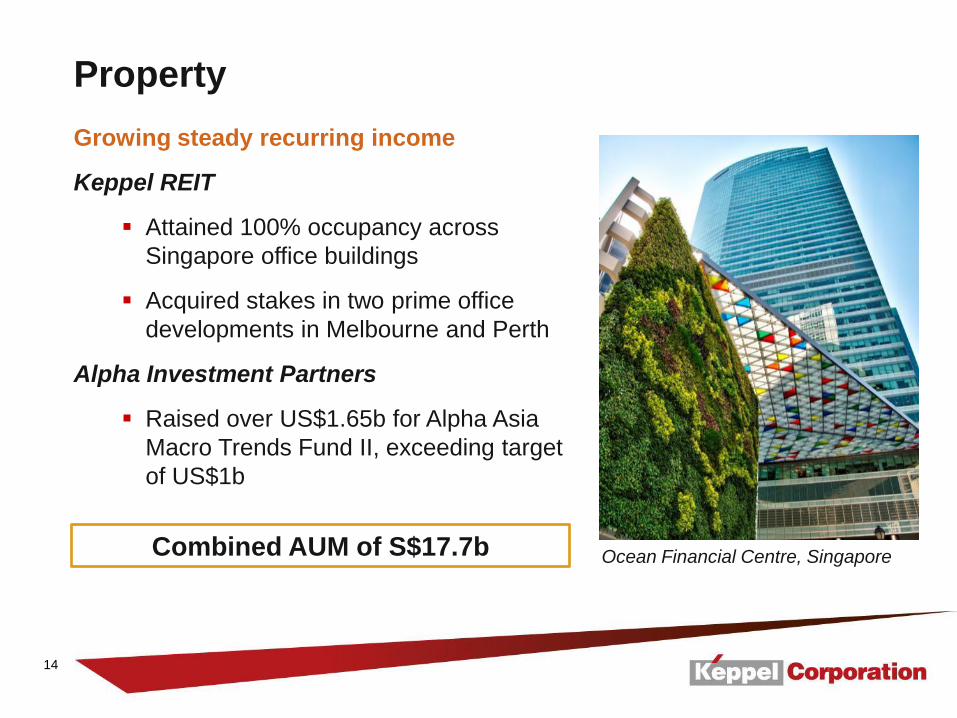
Combined AUM of S$17.7b
Growing steady recurring income
Keppel REIT
Attained 100% occupancy across
Singapore office buildings
Acquired stakes in two prime office
developments in Melbourne and Perth
Alpha Investment Partners
Raised over US$1.65b for Alpha Asia
Macro Trends Fund II, exceeding target
of US$1b
Ocean Financial Centre, Singapore
15
Configured for growth and
value creation through
innovation and discipline.
16
Group Financial
Highlights
17
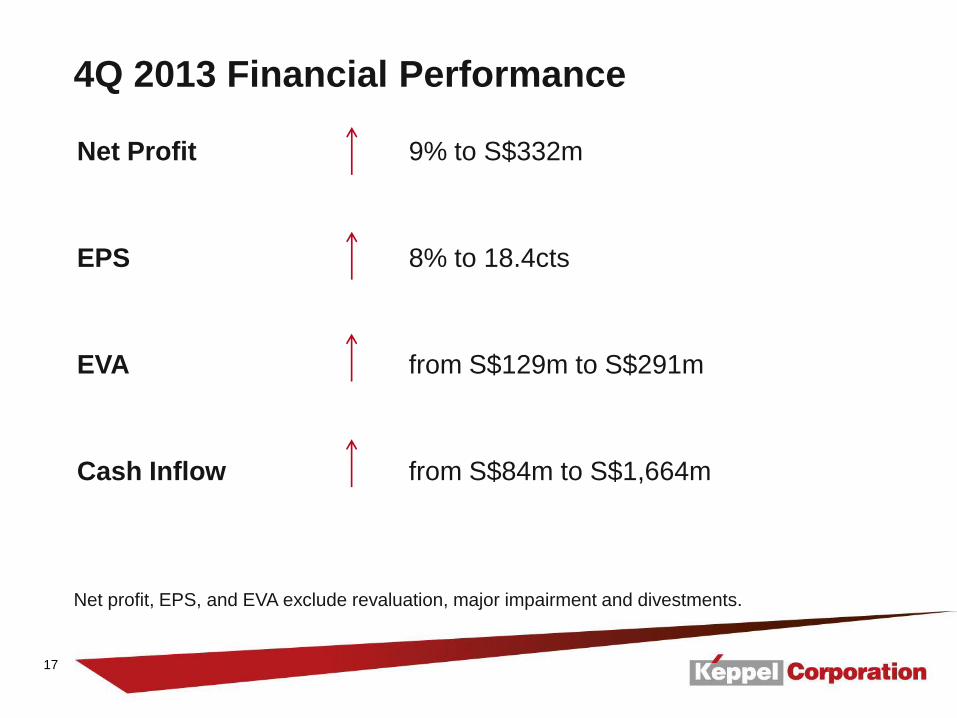
4Q 2013 Financial Performance
Net profit, EPS, and EVA exclude revaluation, major impairment and divestments.
Net Profit 9% to S$332m
EPS 8% to 18.4cts
EVA from S$129m to S$291m
Cash Inflow from S$84m to S$1,664m

18
4Q 2013 Financial Highlights
S$m
4Q 2013
4Q 2012
% Change
Revenue 3,598 2,999 20
EBITDA 538 482 12
Operating Profit 474 425 12
Profit Before Tax 566 539 5
Net Profit 332 305 9
EPS (cents) 18.4 17.0 8
The financials exclude revaluation, major impairment and divestments.

19
4Q 2013 Revenue by Segments
S$m
4Q 2013
%
4Q 2012
%
% Change
Offshore & Marine 2,071 58 1,712 57 21
Infrastructure 975 27 715 24 36
Property 538 15 559 19 (4)
Investments 14 - 13 - 8
Total 3,598 100 2,999 100 20

20
4Q 2013 Pre-tax Profit by Segments
The financials exclude revaluation, major impairment and divestments.
S$m
4Q 2013
%
4Q 2012
%
% Change
Offshore & Marine 333 59 241 45 38
Infrastructure (99) (18) (61) (12) 62
Property 311 55 327 61 (5)
Investments 21 4 32 6 (34)
Total 566 100 539 100 5

21
4Q 2013 Net Profit by Segments
The financials exclude revaluation, major impairment and divestments.
S$m
4Q 2013
%
4Q 2012
%
% Change
Offshore & Marine 270 81 212 70 27
Infrastructure (111) (33) (72) (24) 54
Property 156 47 153 50 2
Investments 17 5 12 4 42
Total 332 100 305 100 9
22
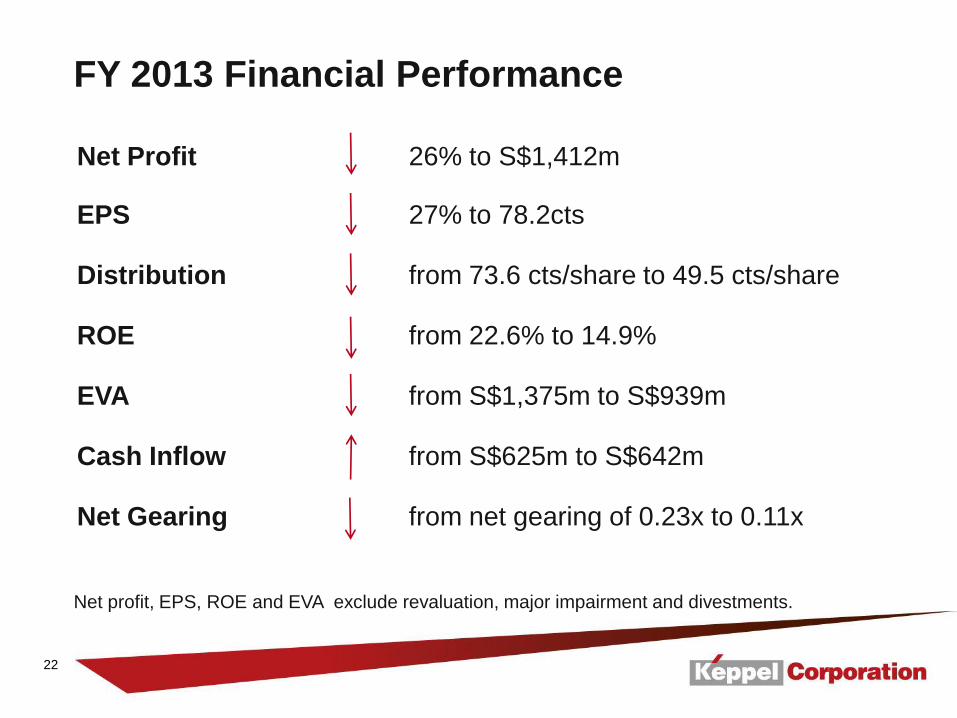
FY 2013 Financial Performance
Net profit, EPS, ROE and EVA exclude revaluation, major impairment and divestments.
Net Profit 26% to S$1,412m
EPS 27% to 78.2cts
Distribution from 73.6 cts/share to 49.5 cts/share
ROE from 22.6% to 14.9%
EVA from S$1,375m to S$939m
Cash Inflow from S$625m to S$642m
Net Gearing from net gearing of 0.23x to 0.11x
23
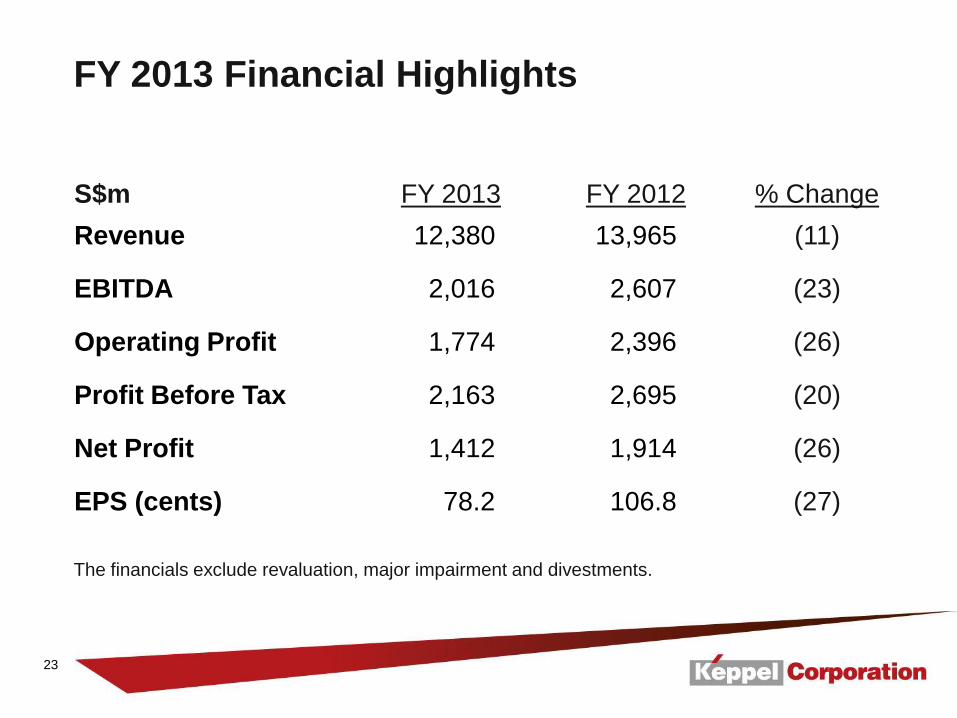
FY 2013 Financial Highlights
S$m
FY 2013
FY 2012
% Change
Revenue 12,380 13,965 (11)
EBITDA 2,016 2,607 (23)
Operating Profit 1,774 2,396 (26)
Profit Before Tax 2,163 2,695 (20)
Net Profit 1,412 1,914 (26)
EPS (cents) 78.2 106.8 (27)
The financials exclude revaluation, major impairment and divestments.

24
FY 2013 Revenue by Segments
S$m
FY 2013
%
FY 2012
%
% Change
Offshore & Marine 7,126 58 7,963 57 (11)
Infrastructure 3,459 28 2,832 20 22
Property 1,768 14 3,018 22 (41)
Investments 27 - 152 1 (82)
Total 12,380 100 13,965 100 (11)
25
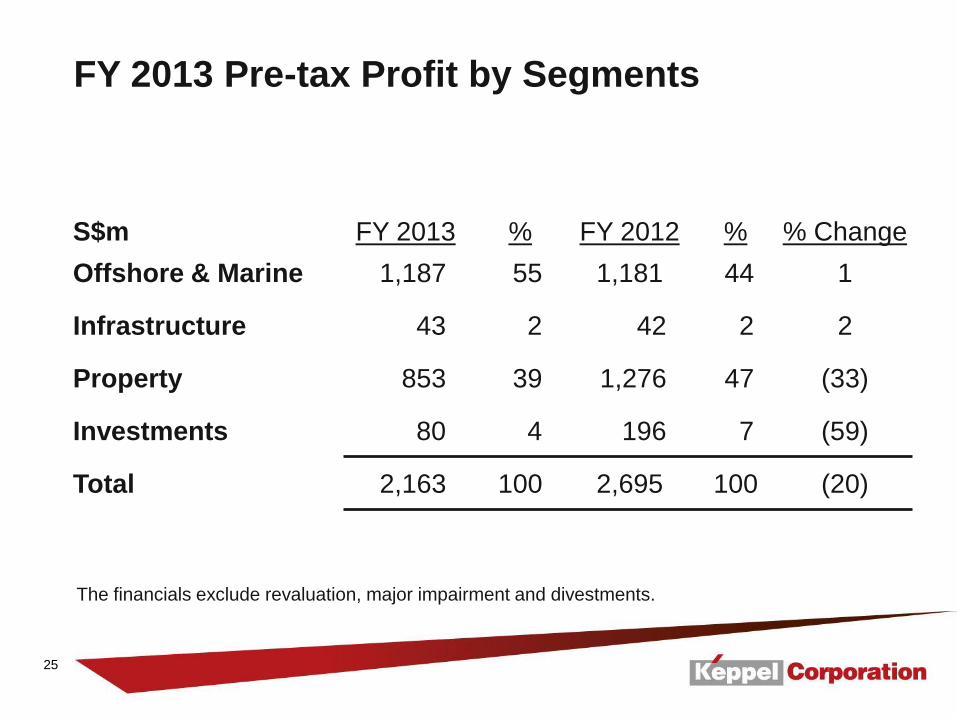
FY 2013 Pre-tax Profit by Segments
The financials exclude revaluation, major impairment and divestments.
S$m
FY 2013
%
FY 2012
%
% Change
Offshore & Marine 1,187 55 1,181 44 1
Infrastructure 43 2 42 2 2
Property 853 39 1,276 47 (33)
Investments 80 4 196 7 (59)
Total 2,163 100 2,695 100 (20)
26
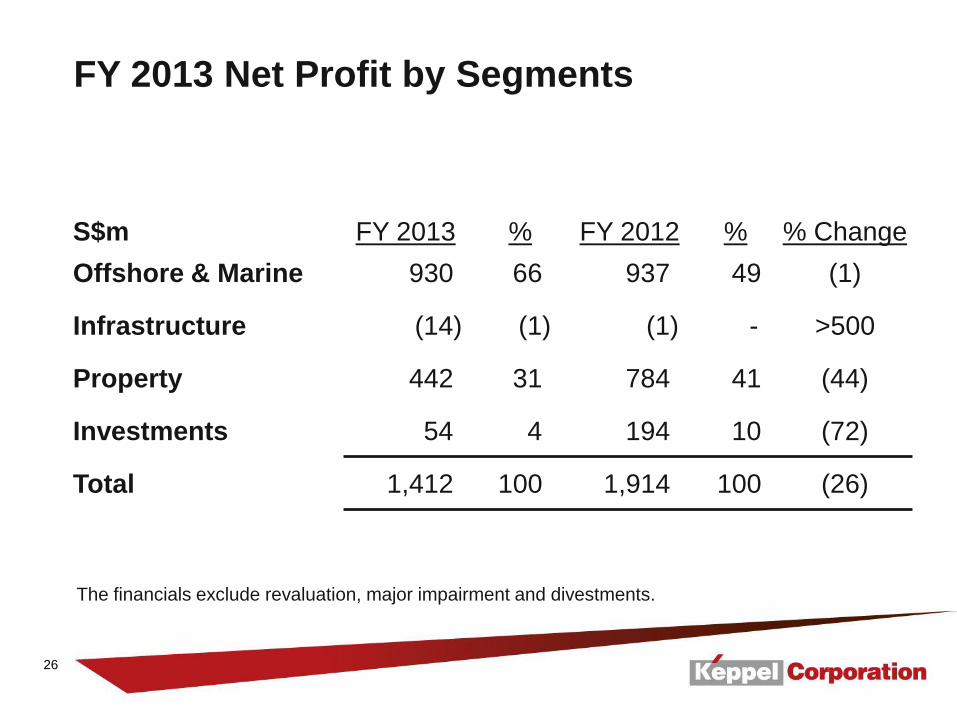
FY 2013 Net Profit by Segments
The financials exclude revaluation, major impairment and divestments.
S$m
FY 2013
%
FY 2012
%
% Change
Offshore & Marine 930 66 937 49 (1)
Infrastructure (14) (1) (1) - >500
Property 442 31 784 41 (44)
Investments 54 4 194 10 (72)
Total 1,412 100 1,914 100 (26)
27
14.5 15.5 17.0 17.6
41.9
18.4
16.6 17.4 20.0 21.6
29.1
19.1
15.6 16.9 17.3
22.8
18.8
22.3
15.0 18.1
20.0
21.8
17.0
18.4
EPS (Cents)
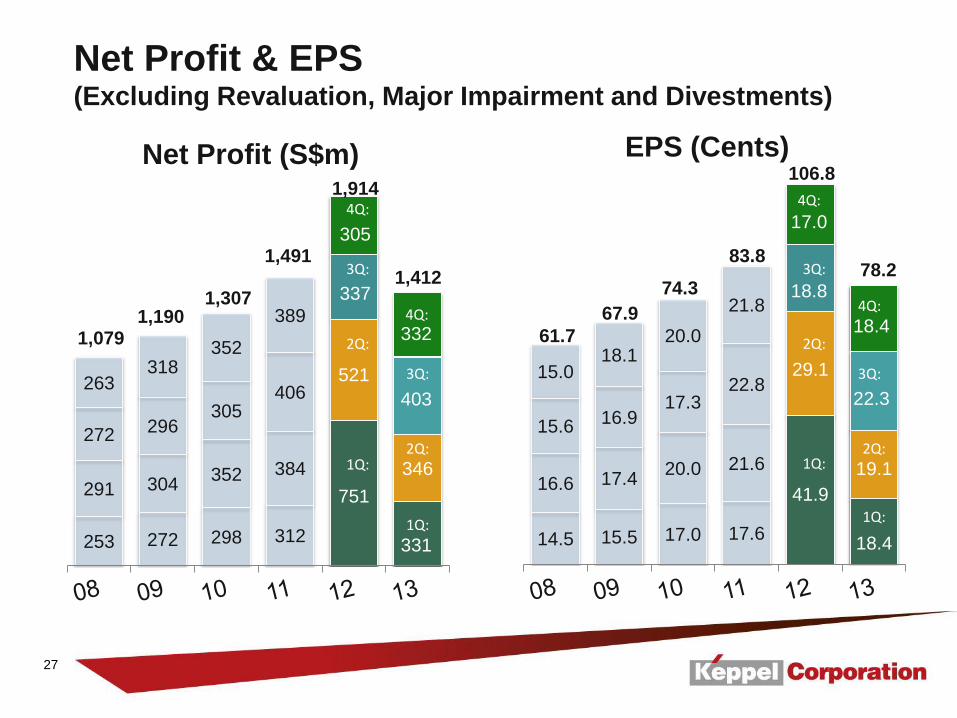
Net Profit & EPS (Excluding Revaluation, Major Impairment and Divestments)
61.7
67.9
74.3
83.8
106.8
253 272 298 312
751
331
291 304 352 384
521
346
272 296 305
406
337
403 263
318 352
389
305
332
Net Profit (S$m)
1Q:
1,079 1,190
1,307
1,491
1,914 4Q:
3Q:
2Q:
1Q:
4Q:
3Q:
2Q:
1Q:
1Q:
2Q:
1,412
2Q:
78.2
3Q: 3Q:
4Q: 4Q:

28
253 272 298 312
751
357
291
726
352 384
521
347
272
296
305 406
346
457 266
246
636
844
619
685
Net Profit (S$m)
Net Profit & EPS (Including Revaluation, Major Impairment and Divestments)
14.5 15.5 17.0 17.6
41.9
19.8
16.6
41.5
20.0 21.6
29.1
19.2
15.6
16.9
17.3 22.8
19.3
25.3 15.2
14.0
36.1
47.4
34.5
38.0
EPS (Cents)
3Q:
4Q:
61.9
87.9 90.4
109.4
124.8
1,082
1,540 1,591
1,946
2,237
4Q:
3Q:
2Q:
1Q:
1Q:
4Q:
3Q:
2Q:
1Q:
1Q:
2Q: 2Q:
1,846 102.3
3Q:
4Q:

29
21.8% 22.5% 20.8% 20.8%
22.6%
14.9%
2008 2009 2010 2011 2012 2013
ROE & Dividend
12.7 13.6 14.5 17.0 18.0
10.0
31.8
34.6 38.2
43.0 45.0 40.0
Interim Dividend Full-Year Dividend ROE
Plus
Dividend in specie ~20.9cts/share
Plus
Dividend in specie ~28.6cts/share
ROE excludes revaluation, major impairment and divestments.
Dividend in specie ~9.5cts/share
Plus
30
FY 2013
S$m
FY 2012
S$m
Operating profit 1,774 2,396
Depreciation & other non-cash items 144 244
1,918 2,640
Working capital changes (733) (1,448)
Interest & tax paid (560) (186)
Net cash from operating activities 625 1,006
Investments & capex (489) (574)
Divestments & dividend income 506 193
Net cash from/ (used in) investing activities 17 (381)
Cash inflow 642 625
Dividend paid (843) (1,001)
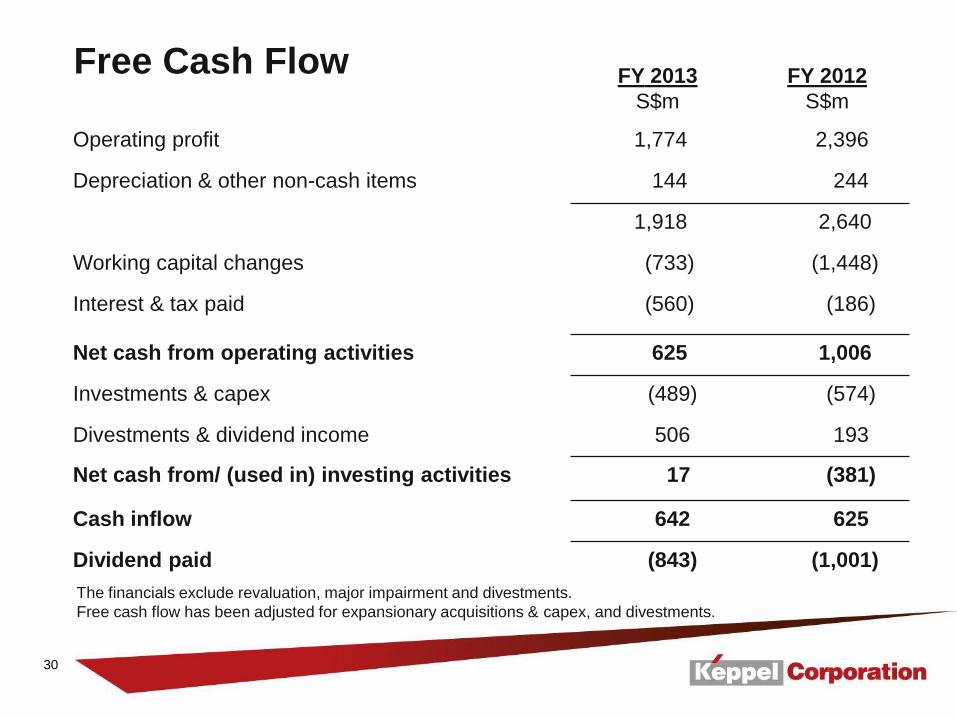
The financials exclude revaluation, major impairment and divestments.
Free cash flow has been adjusted for expansionary acquisitions & capex, and divestments.
Free Cash Flow

31
Business Review &
Outlook
32
Offshore & Marine
Source: Exxonmobil
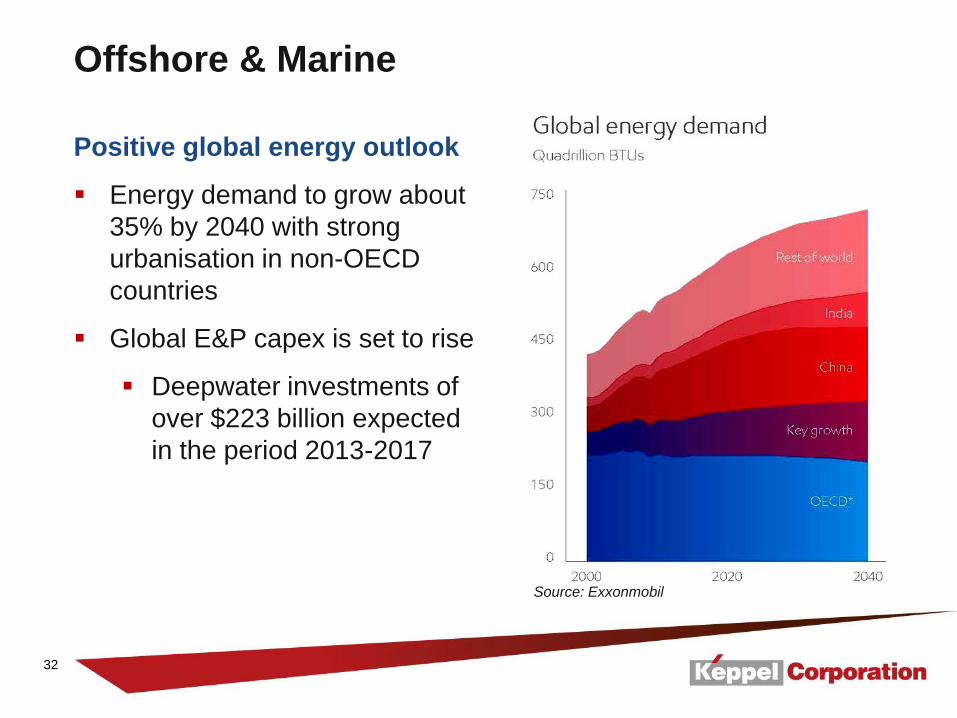
Positive global energy outlook
Energy demand to grow about
35% by 2040 with strong
urbanisation in non-OECD
countries
Global E&P capex is set to rise
Deepwater investments of
over $223 billion expected
in the period 2013-2017
33
Offshore & Marine
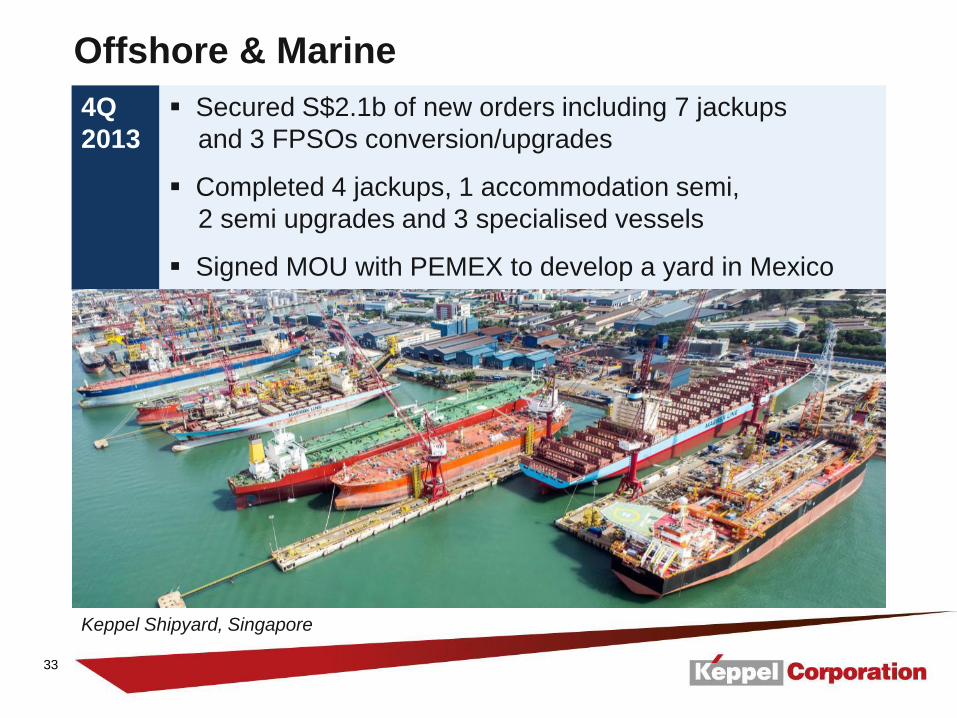
4Q
2013
Secured S$2.1b of new orders including 7 jackups
and 3 FPSOs conversion/upgrades
Completed 4 jackups, 1 accommodation semi,
2 semi upgrades and 3 specialised vessels
Signed MOU with PEMEX to develop a yard in Mexico
Keppel Shipyard, Singapore
34
Infrastructure
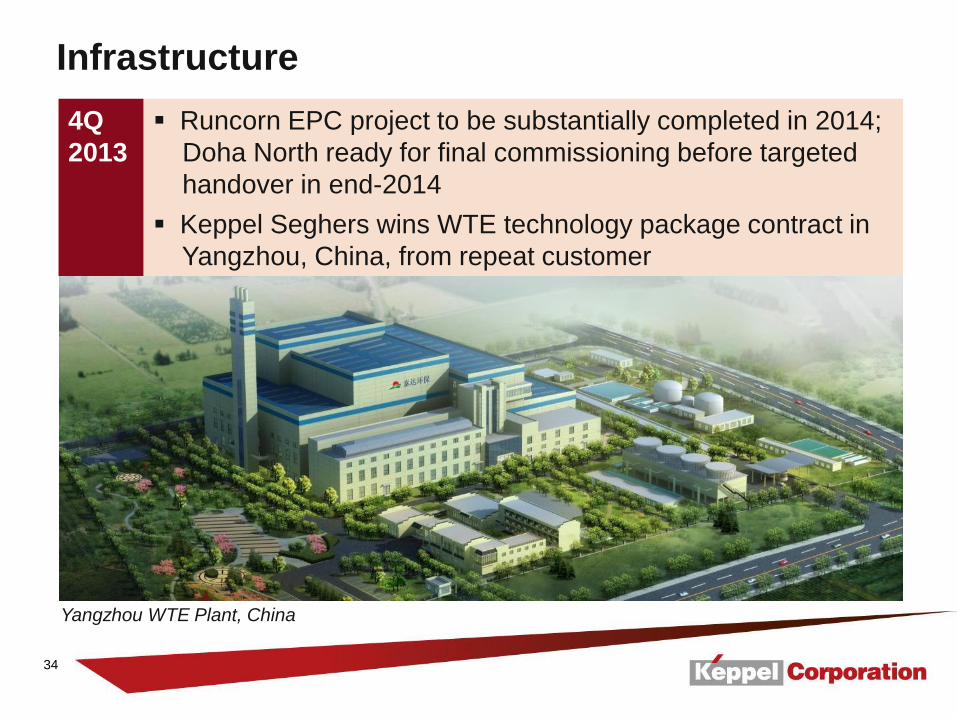
4Q
2013
Runcorn EPC project to be substantially completed in 2014;
Doha North ready for final commissioning before targeted
handover in end-2014
Keppel Seghers wins WTE technology package contract in
Yangzhou, China, from repeat customer
Yangzhou WTE Plant, China

35
Property
4Q
2013
Sold over 900 homes in Asia
Improved office occupancy: MBFC Tower 3 is 95% full
Acquired a 10.4-ha residential site in Tianjin Eco-City
Corals at Keppel Bay, Singapore
36
Q&A FY 2013 Results

37
Additional Information The financials exclude revaluation, major impairment and divestments.
38
38
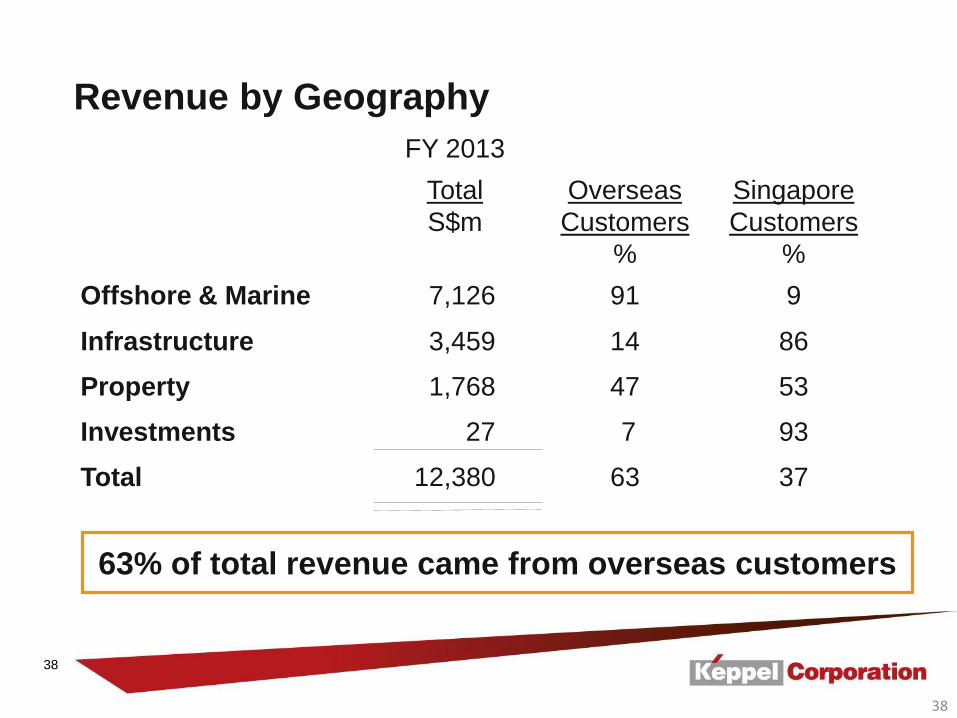
FY 2013
Total
S$m
Overseas
Customers
%
Singapore
Customers
%
Offshore & Marine 7,126 91 9
Infrastructure 3,459 14 86
Property 1,768 47 53
Investments 27 7 93
Total 12,380 63 37
Revenue by Geography
63% of total revenue came from overseas customers

39
39
S$m
FY 2013
%
FY 2012
%
% Change
Offshore & Marine 1,181 59 1,211 47 (3)
Infrastructure 120 6 84 3 43
Property 690 34 1,178 45 (41)
Investments 25 1 134 5 (81)
Total 2,016 100 2,607 100 (23)
EBITDA by Segments

40
40
S$m
31 Dec 2013
31 Dec 2012
Shareholders’ Funds 9,701 9,246
Capital Employed 13,689 13,578
Net Debt 1,535 3,153
Net Gearing Ratio 0.11x 0.23x
ROE 14.9% 22.6%
Capital/Gearing/ROE

41
OFFSHORE & MARINE
42
42
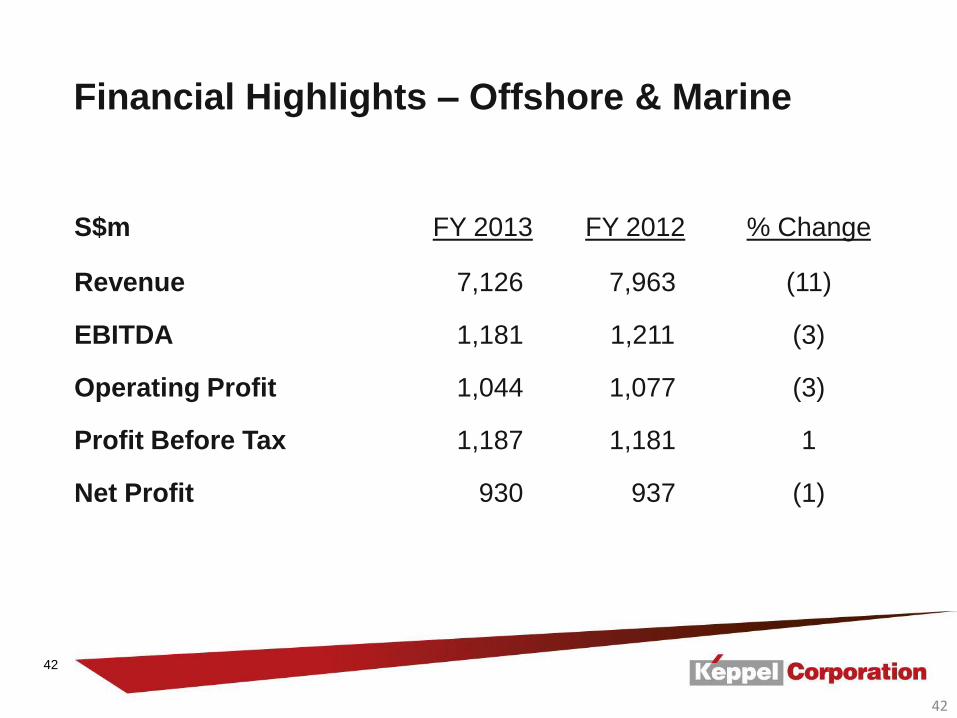
S$m FY 2013 FY 2012 % Change
Revenue 7,126 7,963 (11)
EBITDA 1,181 1,211 (3)
Operating Profit 1,044 1,077 (3)
Profit Before Tax 1,187 1,181 1
Net Profit 930 937 (1)
Financial Highlights – Offshore & Marine
43
43
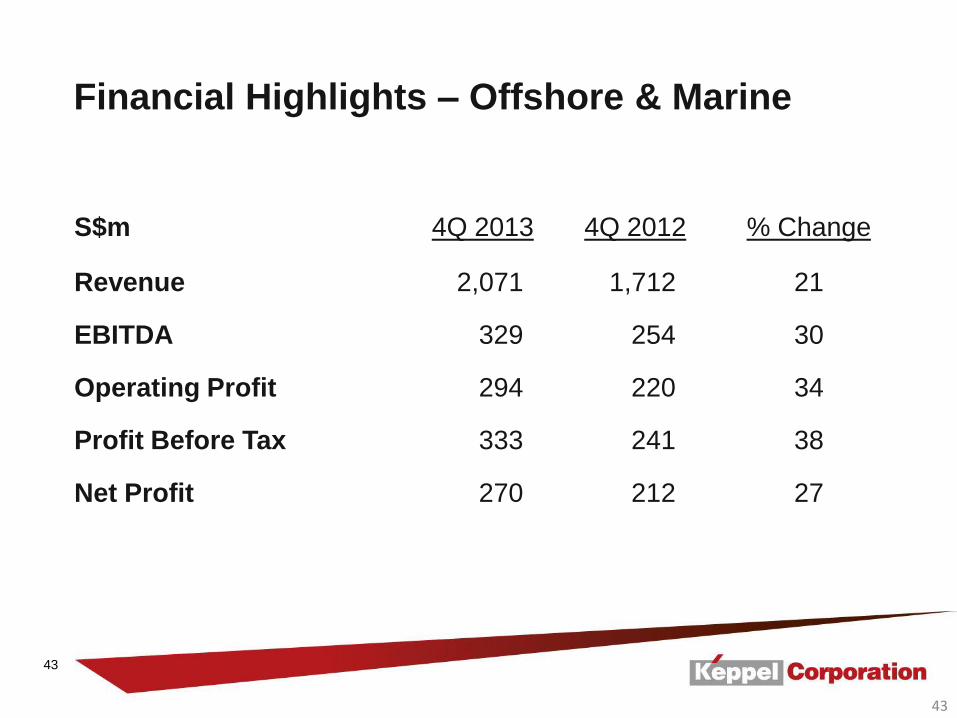
S$m 4Q 2013 4Q 2012 % Change
Revenue 2,071 1,712 21
EBITDA 329 254 30
Operating Profit 294 220 34
Profit Before Tax 333 241 38
Net Profit 270 212 27
Financial Highlights – Offshore & Marine

44
S$2.1 billion contracts secured in 4Q 2013:
7 Jackups, 3 FPSO Conversion/Upgrades, 1 FSO Turret Fabrication,
1 Accommodation Semi Repair, 2 Submersible Barges and
1 Crane Vessel Repair
Major contract completions in 4Q 2013:
4 Jackups, 1 Accommodation Semi, 2 Semi Upgrades,
1 Diving Support Vessel, 1 Bulk Carrier and 1 Tug
44
Offshore & Marine Review
45
45
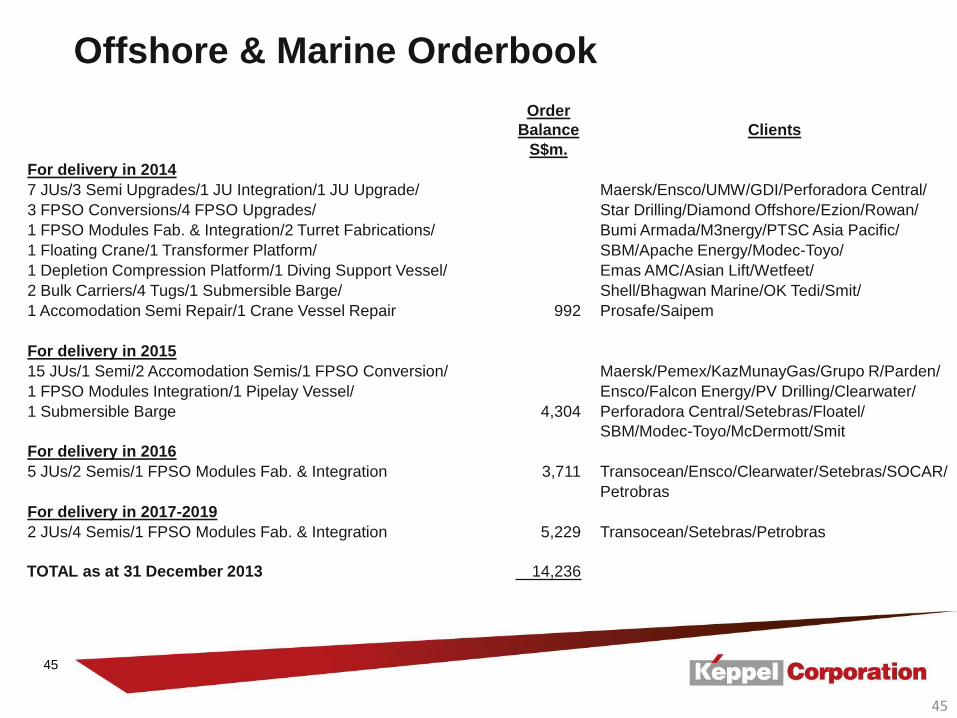
Offshore & Marine Orderbook
Order
Balance Clients
S$m.
For delivery in 2014
7 JUs/3 Semi Upgrades/1 JU Integration/1 JU Upgrade/ Maersk/Ensco/UMW/GDI/Perforadora Central/
3 FPSO Conversions/4 FPSO Upgrades/ Star Drilling/Diamond Offshore/Ezion/Rowan/
1 FPSO Modules Fab. & Integration/2 Turret Fabrications/ Bumi Armada/M3nergy/PTSC Asia Pacific/
1 Floating Crane/1 Transformer Platform/ SBM/Apache Energy/Modec-Toyo/
1 Depletion Compression Platform/1 Diving Support Vessel/ Emas AMC/Asian Lift/Wetfeet/
2 Bulk Carriers/4 Tugs/1 Submersible Barge/ Shell/Bhagwan Marine/OK Tedi/Smit/
1 Accomodation Semi Repair/1 Crane Vessel Repair 992 Prosafe/Saipem
For delivery in 2015
15 JUs/1 Semi/2 Accomodation Semis/1 FPSO Conversion/ Maersk/Pemex/KazMunayGas/Grupo R/Parden/
1 FPSO Modules Integration/1 Pipelay Vessel/ Ensco/Falcon Energy/PV Drilling/Clearwater/
1 Submersible Barge 4,304 Perforadora Central/Setebras/Floatel/
SBM/Modec-Toyo/McDermott/Smit
For delivery in 2016
5 JUs/2 Semis/1 FPSO Modules Fab. & Integration 3,711 Transocean/Ensco/Clearwater/Setebras/SOCAR/
Petrobras
For delivery in 2017-2019
2 JUs/4 Semis/1 FPSO Modules Fab. & Integration 5,229 Transocean/Setebras/Petrobras
TOTAL as at 31 December 2013 14,236

46
INFRASTRUCTURE
47
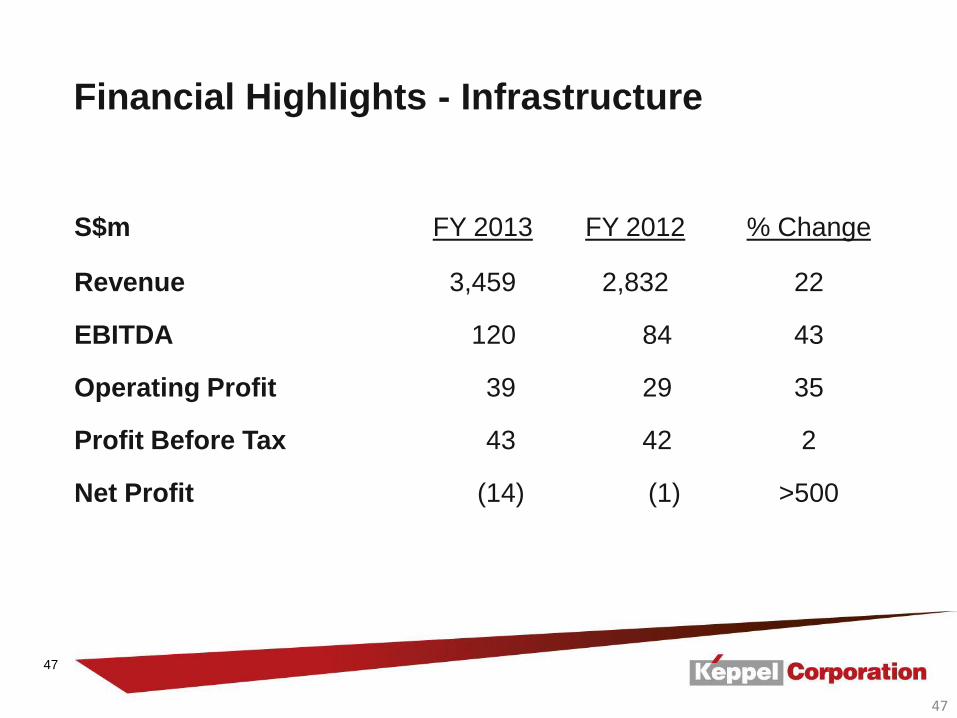
47
Financial Highlights - Infrastructure
S$m FY 2013 FY 2012 % Change
Revenue 3,459 2,832 22
EBITDA 120 84 43
Operating Profit 39 29 35
Profit Before Tax 43 42 2
Net Profit (14) (1) >500
48
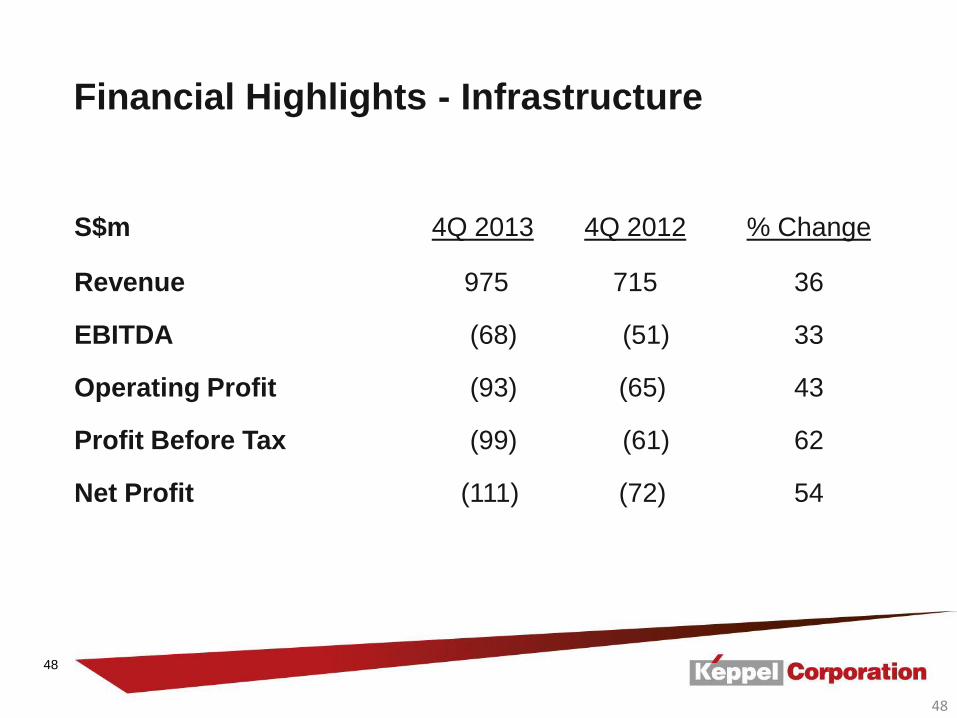
48
Financial Highlights - Infrastructure
S$m 4Q 2013 4Q 2012 % Change
Revenue 975 715 36
EBITDA (68) (51) 33
Operating Profit (93) (65) 43
Profit Before Tax (99) (61) 62
Net Profit (111) (72) 54

49
PROPERTY

50
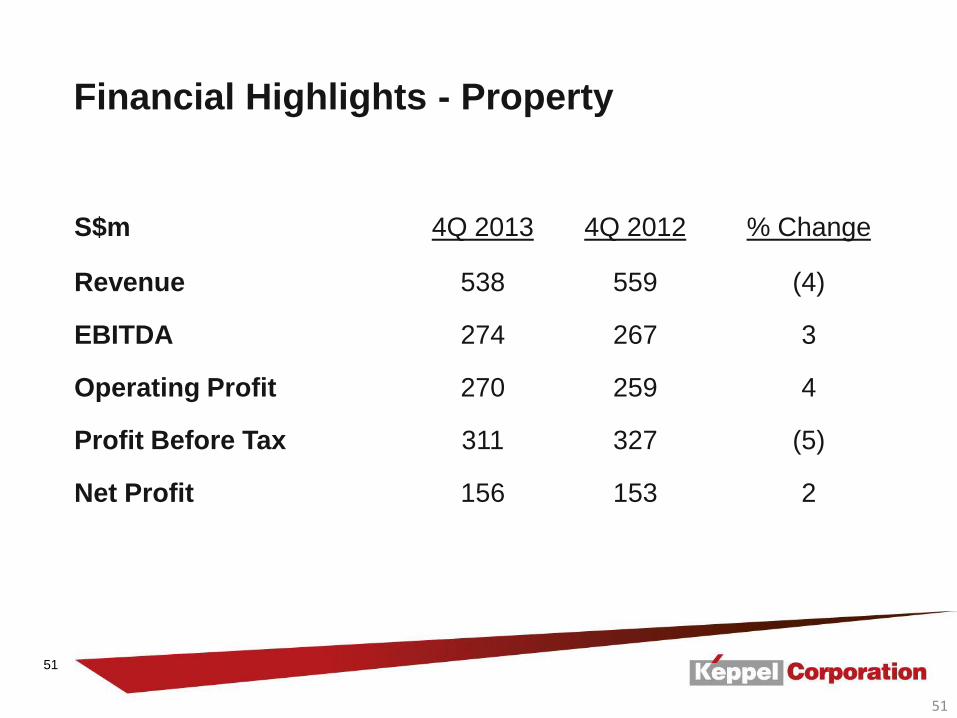
50
Financial Highlights - Property
S$m FY 2013 FY 2012 % Change
Revenue 1,768 3,018 (41)
EBITDA 690 1,178 (41)
Operating Profit 666 1,157 (42)
Profit Before Tax 853 1,276 (33)
Net Profit 442 784 (44)
51
51
Financial Highlights - Property
S$m 4Q 2013 4Q 2012 % Change
Revenue 538 559 (4)
EBITDA 274 267 3
Operating Profit 270 259 4
Profit Before Tax 311 327 (5)
Net Profit 156 153 2

52
INVESTMENTS

53
53
S$m FY 2013 FY 2012 % Change
Revenue 27 152 (82)
EBITDA 25 134 (81)
Operating Profit 25 133 (81)
Profit Before Tax 80 196 (59)
Net Profit 54 194 (72)
Financial Highlights - Investments

54
54
S$m 4Q 2013 4Q 2012 % Change
Revenue 14 13 8
EBITDA 3 12 (75)
Operating Profit 3 11 (73)
Profit Before Tax 21 32 (34)
Net Profit 17 12 42
Financial Highlights - Investments
55
This release may contain forward-looking statements which are subject
to risks and uncertainties that could cause actual results to differ
materially from such statements. Such risks and uncertainties include
industry and economic conditions, competition, and legal, governmental
and regulatory changes. The forward-looking statements reflect the
current views of Management on future trends and developments.

1
ADDRESS BY KEPPEL CORPORATION LIMITED’S ACTING CHIEF FINANCIAL OFFICER, PAUL TAN
AT THE FULL YEAR 2013 RESULTS PRESENTATION
THURSDAY, 23 JANUARY 2014
1. Group Financial Highlights (Slide 16) 1.1 4Q 2013 Financial Performance (Slide 17)
Thank you, Chin Hua. A very good evening to all of you. The Group had a good quarter. Net profit for the fourth quarter of 2013 was $332 million, an improvement of 9% compared to the same period last year. Earnings per share for the quarter rose by 8% to 18.4 cents while EVA was at $291 million.
Cash inflow for the quarter was a robust $1.6 billion due to higher cash flow generated from operations mainly from our Offshore & Marine division.
1.2 4Q 2013 Financial Highlights (Slide 18)
For the fourth quarter, all key line items registered improvement from the same period last year, driven largely by higher revenue and margins at the Offshore & Marine division, despite higher losses in the Infrastructure division.
1.3 4Q 2013 Revenue by Segments (Slide 19)
Overall revenue rose by 20% in the fourth quarter, led mainly by the revenue growth in the Offshore & Marine and Infrastructure divisions.
Offshore & Marine’s increase in revenue was largely attributed to new jobs in the year and deliveries in the fourth quarter. Infrastructure registered a 36% improvement in fourth quarter’s revenue, driven largely by the higher contracted load for the expanded Keppel Merlimau Cogen plant.
2
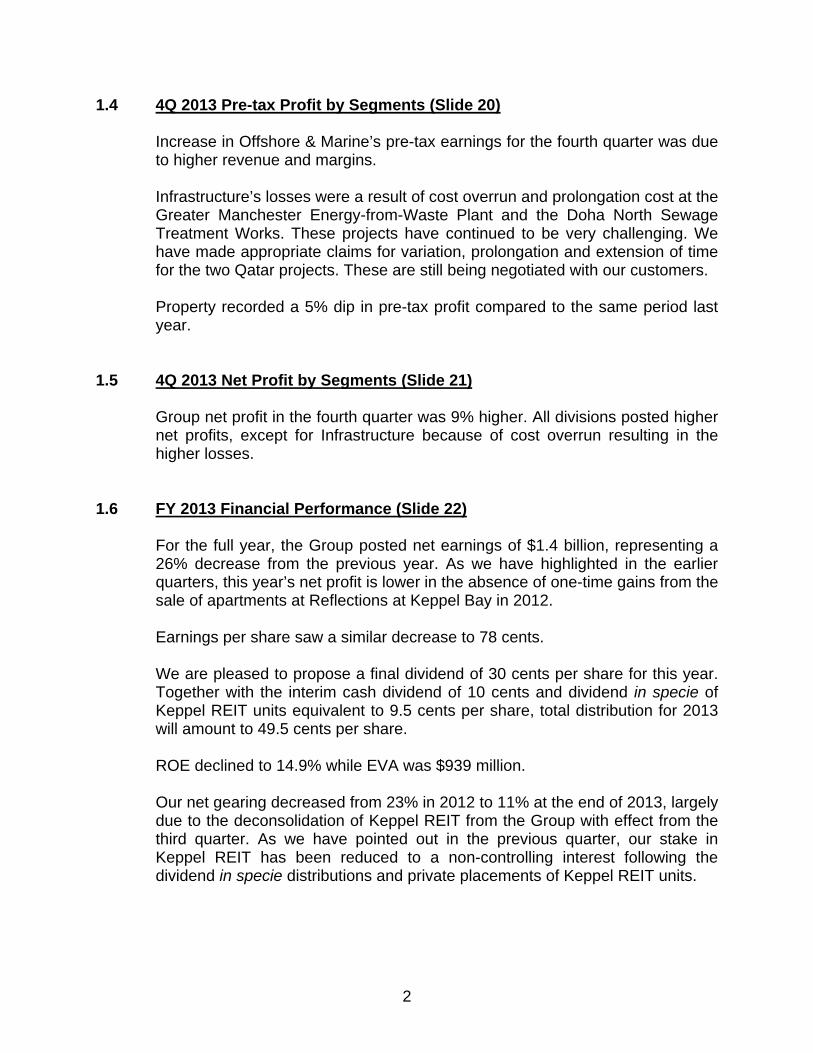
1.4 4Q 2013 Pre-tax Profit by Segments (Slide 20)
Increase in Offshore & Marine’s pre-tax earnings for the fourth quarter was due to higher revenue and margins.
Infrastructure’s losses were a result of cost overrun and prolongation cost at the Greater Manchester Energy-from-Waste Plant and the Doha North Sewage Treatment Works. These projects have continued to be very challenging. We have made appropriate claims for variation, prolongation and extension of time for the two Qatar projects. These are still being negotiated with our customers. Property recorded a 5% dip in pre-tax profit compared to the same period last year.
1.5 4Q 2013 Net Profit by Segments (Slide 21)
Group net profit in the fourth quarter was 9% higher. All divisions posted higher net profits, except for Infrastructure because of cost overrun resulting in the higher losses.
1.6 FY 2013 Financial Performance (Slide 22)
For the full year, the Group posted net earnings of $1.4 billion, representing a 26% decrease from the previous year. As we have highlighted in the earlier quarters, this year’s net profit is lower in the absence of one-time gains from the sale of apartments at Reflections at Keppel Bay in 2012. Earnings per share saw a similar decrease to 78 cents. We are pleased to propose a final dividend of 30 cents per share for this year. Together with the interim cash dividend of 10 cents and dividend in specie of Keppel REIT units equivalent to 9.5 cents per share, total distribution for 2013 will amount to 49.5 cents per share.
ROE declined to 14.9% while EVA was $939 million.
Our net gearing decreased from 23% in 2012 to 11% at the end of 2013, largely due to the deconsolidation of Keppel REIT from the Group with effect from the third quarter. As we have pointed out in the previous quarter, our stake in Keppel REIT has been reduced to a non-controlling interest following the dividend in specie distributions and private placements of Keppel REIT units.
3
1.7 FY 2013 Financial Highlights (Slide 23)
All key line items for the full year decreased compared to 2012, mainly because of lower revenue from the Offshore & Marine and Property divisions. The decline in profit is mainly due to lower earnings from the Property Division. The previous year also benefitted from a substantial gain on sale of equity investments.
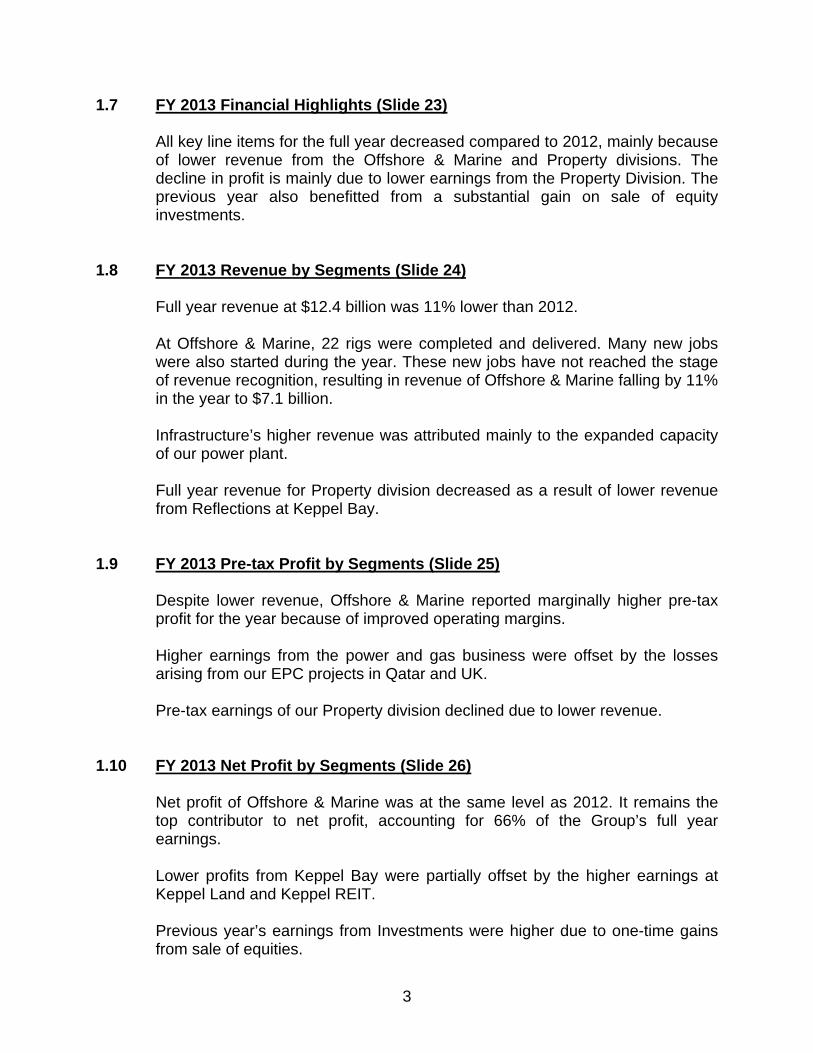
1.8 FY 2013 Revenue by Segments (Slide 24)
Full year revenue at $12.4 billion was 11% lower than 2012. At Offshore & Marine, 22 rigs were completed and delivered. Many new jobs were also started during the year. These new jobs have not reached the stage of revenue recognition, resulting in revenue of Offshore & Marine falling by 11% in the year to $7.1 billion. Infrastructure’s higher revenue was attributed mainly to the expanded capacity of our power plant. Full year revenue for Property division decreased as a result of lower revenue from Reflections at Keppel Bay.
1.9 FY 2013 Pre-tax Profit by Segments (Slide 25)
Despite lower revenue, Offshore & Marine reported marginally higher pre-tax profit for the year because of improved operating margins. Higher earnings from the power and gas business were offset by the losses arising from our EPC projects in Qatar and UK. Pre-tax earnings of our Property division declined due to lower revenue.
1.10 FY 2013 Net Profit by Segments (Slide 26)
Net profit of Offshore & Marine was at the same level as 2012. It remains the top contributor to net profit, accounting for 66% of the Group’s full year earnings. Lower profits from Keppel Bay were partially offset by the higher earnings at Keppel Land and Keppel REIT.
Previous year’s earnings from Investments were higher due to one-time gains from sale of equities.
4
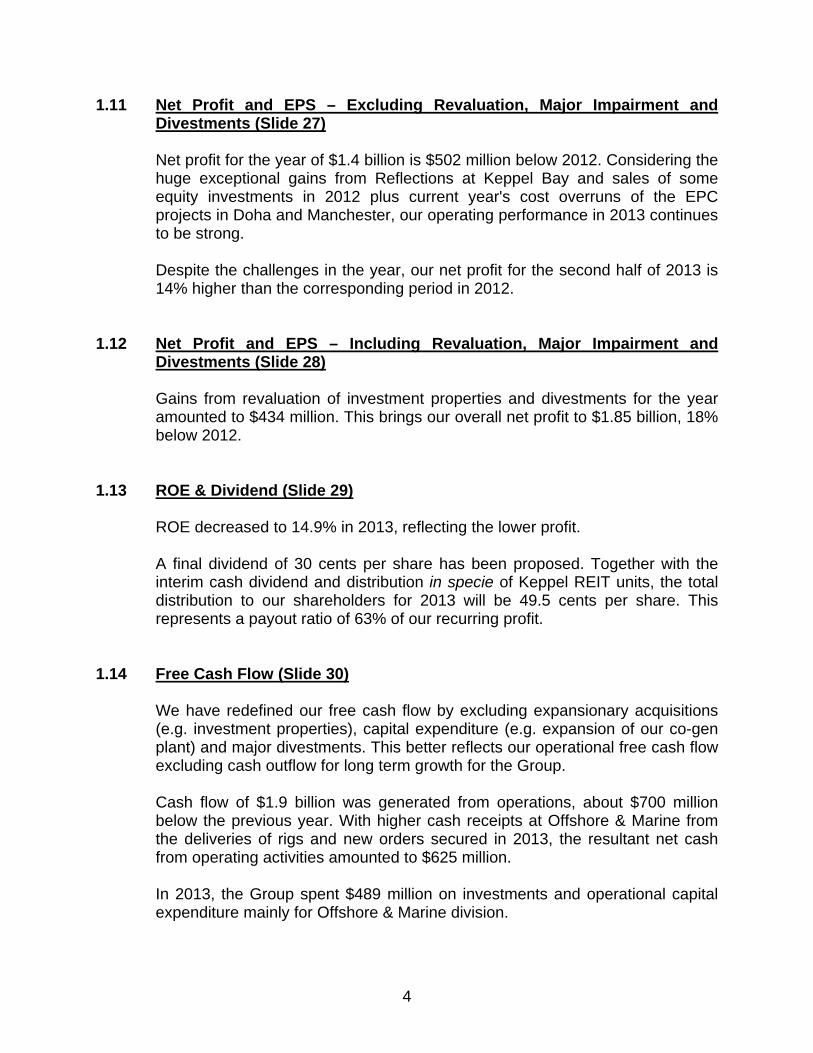
1.11 Net Profit and EPS – Excluding Revaluation, Major Impairment and Divestments (Slide 27) Net profit for the year of $1.4 billion is $502 million below 2012. Considering the huge exceptional gains from Reflections at Keppel Bay and sales of some equity investments in 2012 plus current year's cost overruns of the EPC projects in Doha and Manchester, our operating performance in 2013 continues to be strong. Despite the challenges in the year, our net profit for the second half of 2013 is 14% higher than the corresponding period in 2012.
1.12 Net Profit and EPS – Including Revaluation, Major Impairment and Divestments (Slide 28)
Gains from revaluation of investment properties and divestments for the year amounted to $434 million. This brings our overall net profit to $1.85 billion, 18% below 2012.
1.13 ROE & Dividend (Slide 29)
ROE decreased to 14.9% in 2013, reflecting the lower profit.
A final dividend of 30 cents per share has been proposed. Together with the interim cash dividend and distribution in specie of Keppel REIT units, the total distribution to our shareholders for 2013 will be 49.5 cents per share. This represents a payout ratio of 63% of our recurring profit.
1.14 Free Cash Flow (Slide 30)
We have redefined our free cash flow by excluding expansionary acquisitions (e.g. investment properties), capital expenditure (e.g. expansion of our co-gen plant) and major divestments. This better reflects our operational free cash flow excluding cash outflow for long term growth for the Group. Cash flow of $1.9 billion was generated from operations, about $700 million below the previous year. With higher cash receipts at Offshore & Marine from the deliveries of rigs and new orders secured in 2013, the resultant net cash from operating activities amounted to $625 million. In 2013, the Group spent $489 million on investments and operational capital expenditure mainly for Offshore & Marine division.
5
After taking into account dividend income and divestment proceeds of $506 million, net cash from investing activities was $17 million. The resultant cash inflow was $642 million for the year, which is at the same level as 2012.
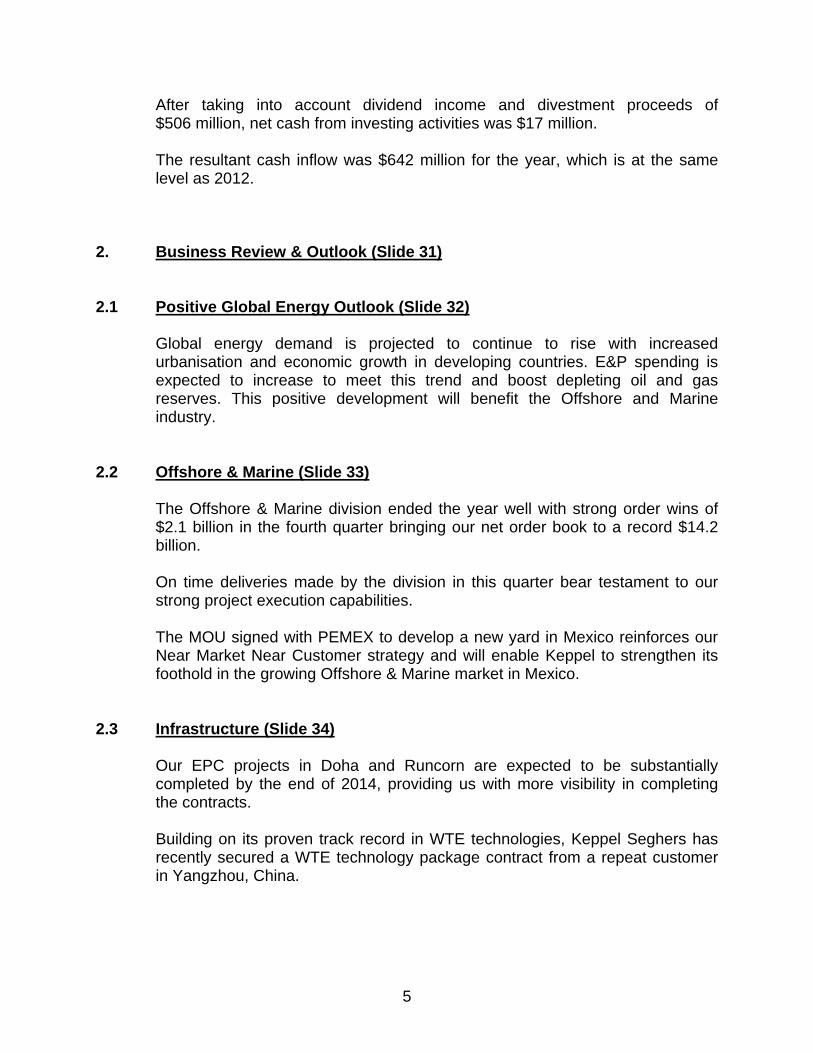
2. Business Review & Outlook (Slide 31) 2.1 Positive Global Energy Outlook (Slide 32)
Global energy demand is projected to continue to rise with increased urbanisation and economic growth in developing countries. E&P spending is expected to increase to meet this trend and boost depleting oil and gas reserves. This positive development will benefit the Offshore and Marine industry.
2.2 Offshore & Marine (Slide 33)
The Offshore & Marine division ended the year well with strong order wins of $2.1 billion in the fourth quarter bringing our net order book to a record $14.2 billion.
On time deliveries made by the division in this quarter bear testament to our strong project execution capabilities.
The MOU signed with PEMEX to develop a new yard in Mexico reinforces our Near Market Near Customer strategy and will enable Keppel to strengthen its foothold in the growing Offshore & Marine market in Mexico.
2.3 Infrastructure (Slide 34)
Our EPC projects in Doha and Runcorn are expected to be substantially completed by the end of 2014, providing us with more visibility in completing the contracts. Building on its proven track record in WTE technologies, Keppel Seghers has recently secured a WTE technology package contract from a repeat customer in Yangzhou, China.
6
2.4 Property (Slide 35)
We have sold more than 900 homes in our key markets in Asia this quarter, primarily from our developments in China. On the commercial front, MBFC Tower 3 is 95% committed while Ocean Financial Centre has achieved full occupancy. We have also completed the divestment of our share in Jakarta Garden City realising a net gain of approximately $149 million. We continue to build up our portfolio of quality developments in China with the addition of a prime residential site in Tianjin Eco-City this quarter. About 350 landed homes are expected to be built on this site, which will be launched progressively from the second half of 2014. As we look ahead to a new year, we are mindful of the challenges. In Offshore & Marine, we will have to fend off the competition, execute well and innovate to stay ahead. In Infrastructure, we remained focused on completing the EPC contracts within the costs to complete and projected timeline, and returning the division to profitability. In Property, we have to seek out opportunities and capture value despite market cooling measures.
We are committed to achieving all these and more to sustain growth for the Group.
Thank you.