Embed Size (px)
Citation preview
Full wwPDB X-ray Structure Validation Report iO
Apr 15, 2018 � 01:34 PM EDT
PDB ID : 6BG1Title : Caspase-3 Mutant - D9A,D28A,S150E
Authors : Thomas, M.E.; Grinshpon, R.; Swartz, P.D.; Clark, A.C.Deposited on : 2017-10-27Resolution : 1.88 Å(reported)
This is a Full wwPDB X-ray Structure Validation Report for a publicly released PDB entry.
We welcome your comments at [email protected] user guide is available at
https://www.wwpdb.org/validation/2017/XrayValidationReportHelpwith speci�c help available everywhere you see the iO symbol.
The following versions of software and data (see references iO) were used in the production of this report:
MolProbity : 4.02b-467Xtriage (Phenix) : 1.13
EDS : rb-20031021Percentile statistics : 20171227.v01 (using entries in the PDB archive December 27th 2017)
Refmac : 5.8.0158CCP4 : 7.0 (Gargrove)
Ideal geometry (proteins) : Engh & Huber (2001)Ideal geometry (DNA, RNA) : Parkinson et al. (1996)
Validation Pipeline (wwPDB-VP) : rb-20031021
Page 2 Full wwPDB X-ray Structure Validation Report 6BG1
1 Overall quality at a glance iO
The following experimental techniques were used to determine the structure:X-RAY DIFFRACTION
The reported resolution of this entry is 1.88 Å.
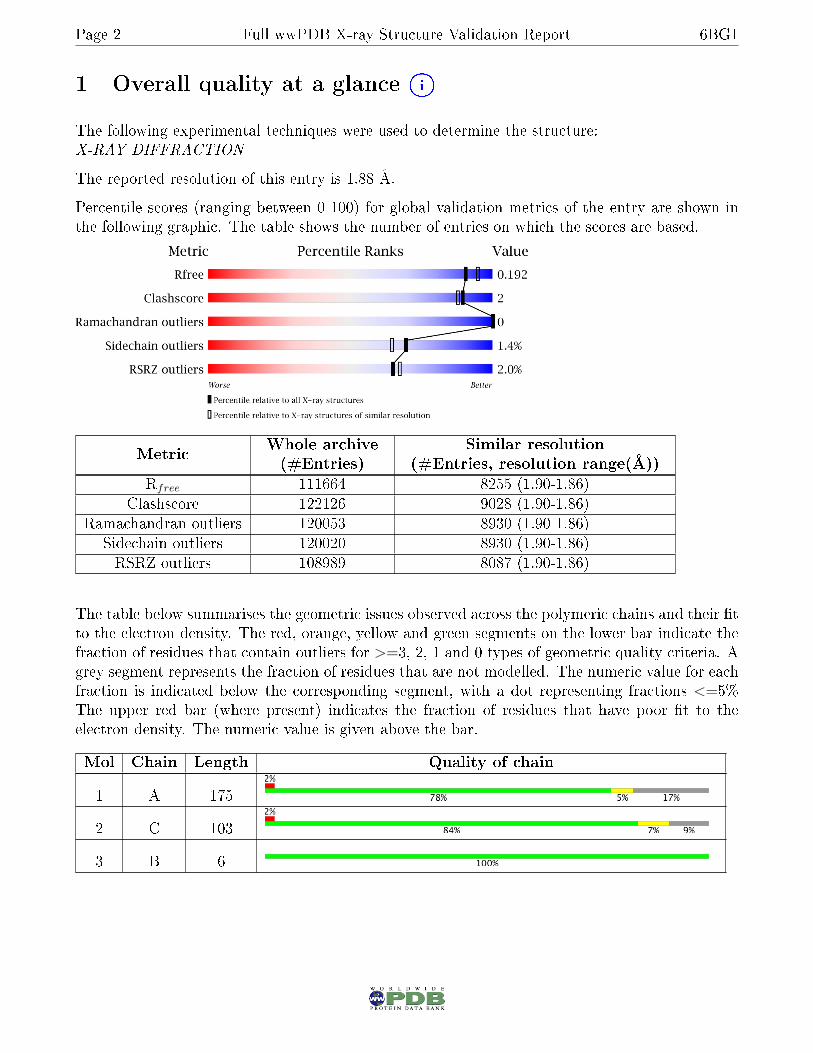
Percentile scores (ranging between 0-100) for global validation metrics of the entry are shown inthe following graphic. The table shows the number of entries on which the scores are based.
MetricWhole archive(#Entries)
Similar resolution(#Entries, resolution range(Å))
Rfree 111664 8255 (1.90-1.86)Clashscore 122126 9028 (1.90-1.86)
Ramachandran outliers 120053 8930 (1.90-1.86)Sidechain outliers 120020 8930 (1.90-1.86)RSRZ outliers 108989 8087 (1.90-1.86)
The table below summarises the geometric issues observed across the polymeric chains and their �tto the electron density. The red, orange, yellow and green segments on the lower bar indicate thefraction of residues that contain outliers for >=3, 2, 1 and 0 types of geometric quality criteria. Agrey segment represents the fraction of residues that are not modelled. The numeric value for eachfraction is indicated below the corresponding segment, with a dot representing fractions <=5%The upper red bar (where present) indicates the fraction of residues that have poor �t to theelectron density. The numeric value is given above the bar.
Mol Chain Length Quality of chain
1 A 175
2 C 103
3 B 6
Page 3 Full wwPDB X-ray Structure Validation Report 6BG1
2 Entry composition iO
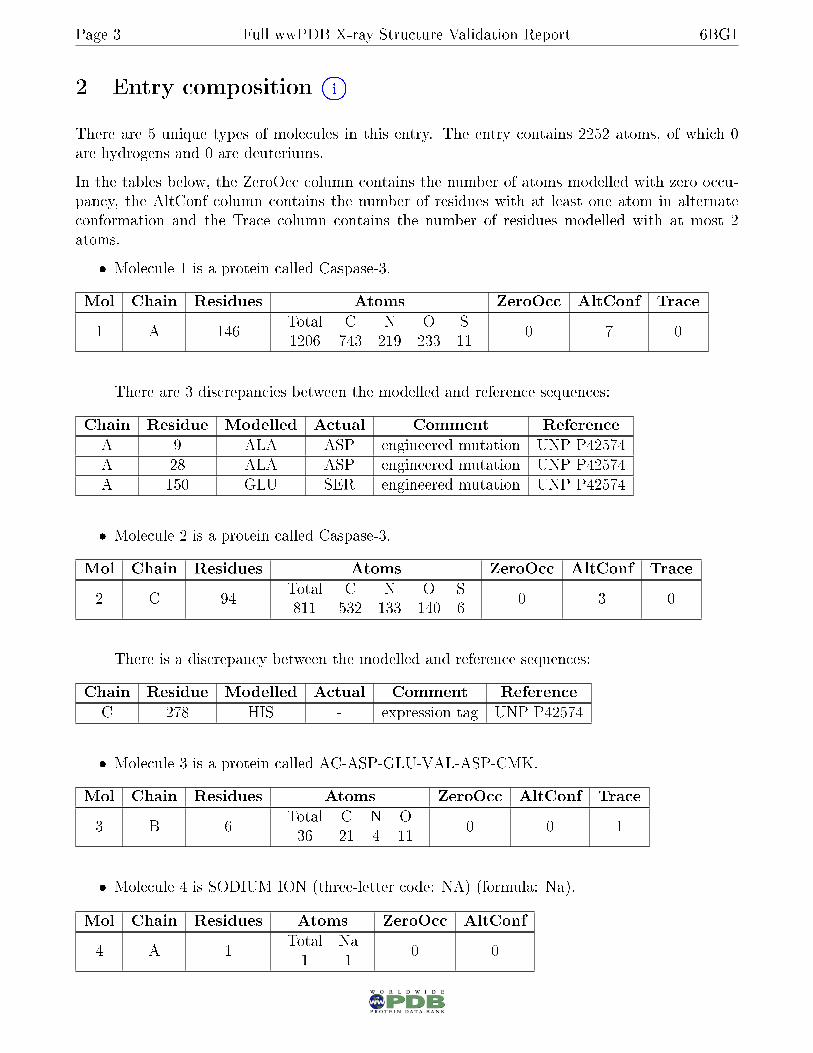
There are 5 unique types of molecules in this entry. The entry contains 2252 atoms, of which 0are hydrogens and 0 are deuteriums.
In the tables below, the ZeroOcc column contains the number of atoms modelled with zero occu-pancy, the AltConf column contains the number of residues with at least one atom in alternateconformation and the Trace column contains the number of residues modelled with at most 2atoms.
� Molecule 1 is a protein called Caspase-3.
Mol Chain Residues Atoms ZeroOcc AltConf Trace
1 A 146Total C N O S1206 743 219 233 11
0 7 0
There are 3 discrepancies between the modelled and reference sequences:
Chain Residue Modelled Actual Comment ReferenceA 9 ALA ASP engineered mutation UNP P42574A 28 ALA ASP engineered mutation UNP P42574A 150 GLU SER engineered mutation UNP P42574
� Molecule 2 is a protein called Caspase-3.
Mol Chain Residues Atoms ZeroOcc AltConf Trace
2 C 94Total C N O S811 532 133 140 6
0 3 0
There is a discrepancy between the modelled and reference sequences:
Chain Residue Modelled Actual Comment ReferenceC 278 HIS - expression tag UNP P42574
� Molecule 3 is a protein called AC-ASP-GLU-VAL-ASP-CMK.
Mol Chain Residues Atoms ZeroOcc AltConf Trace
3 B 6Total C N O36 21 4 11
0 0 1
� Molecule 4 is SODIUM ION (three-letter code: NA) (formula: Na).
Mol Chain Residues Atoms ZeroOcc AltConf
4 A 1Total Na1 1
0 0
Page 4 Full wwPDB X-ray Structure Validation Report 6BG1
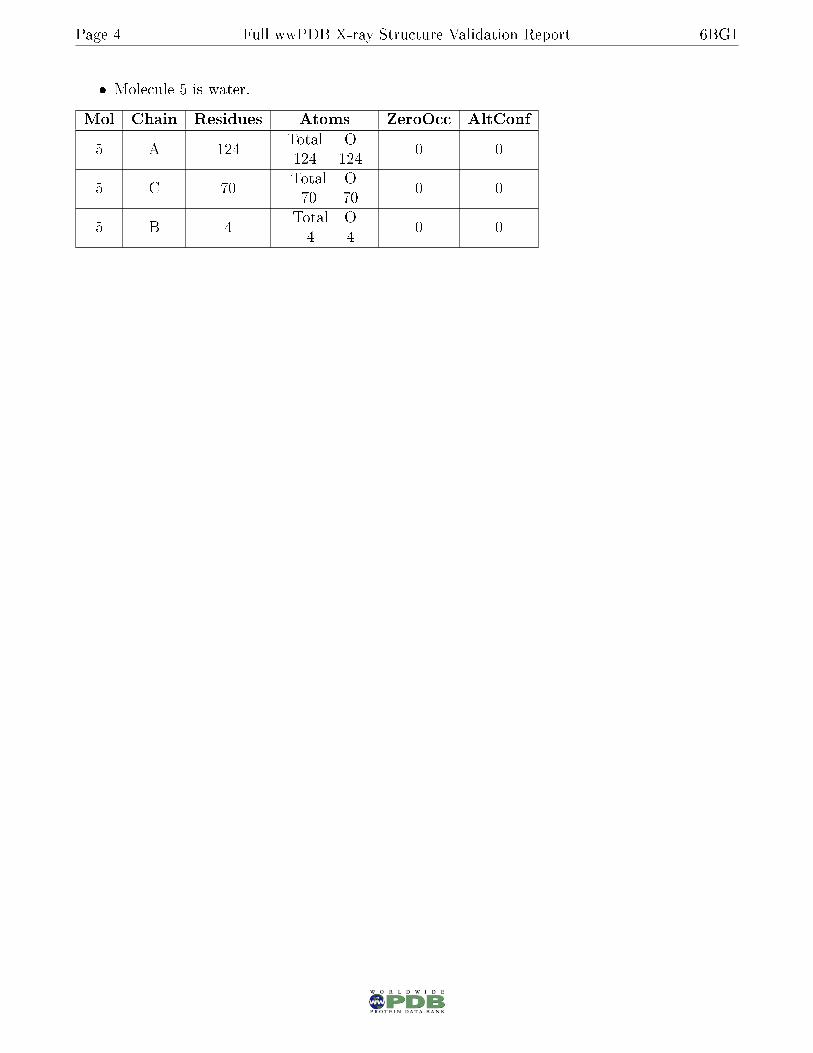
� Molecule 5 is water.
Mol Chain Residues Atoms ZeroOcc AltConf
5 A 124Total O124 124
0 0
5 C 70Total O70 70
0 0
5 B 4Total O4 4
0 0
Page 5 Full wwPDB X-ray Structure Validation Report 6BG1
3 Residue-property plots iO
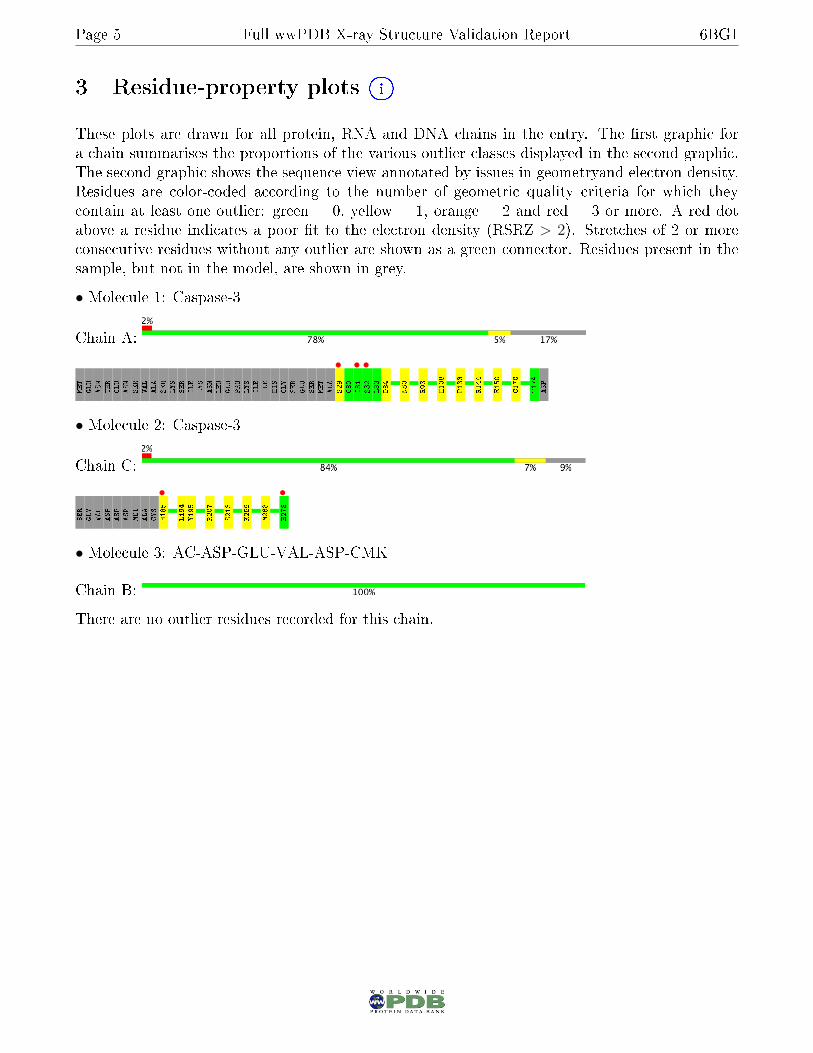
These plots are drawn for all protein, RNA and DNA chains in the entry. The �rst graphic fora chain summarises the proportions of the various outlier classes displayed in the second graphic.The second graphic shows the sequence view annotated by issues in geometryand electron density.Residues are color-coded according to the number of geometric quality criteria for which theycontain at least one outlier: green = 0, yellow = 1, orange = 2 and red = 3 or more. A red dotabove a residue indicates a poor �t to the electron density (RSRZ > 2). Stretches of 2 or moreconsecutive residues without any outlier are shown as a green connector. Residues present in thesample, but not in the model, are shown in grey.
• Molecule 1: Caspase-3
Chain A:
MET
GLU
ASN
THR
GLU
ASN
SER
VAL
ALA
SER
LYS
SER
ILE
LYS
ASN
LEU
GLU
PRO
LYS
ILE
ILE
HIS
GLY
SER
GLU
SER
MET
ALA
S29•
G30
I31•
S32•
L33
D34
N80
R93
H108
P133
R144
E150
C170
T174
ASP
• Molecule 2: Caspase-3
Chain C:
SER
GLY
VAL
ASP
ASP
ASP
MET
ALA
CYS
H185•
L194
Y195
R207
S213
K259
M268
H278•
• Molecule 3: AC-ASP-GLU-VAL-ASP-CMK
Chain B:
There are no outlier residues recorded for this chain.
Page 6 Full wwPDB X-ray Structure Validation Report 6BG1
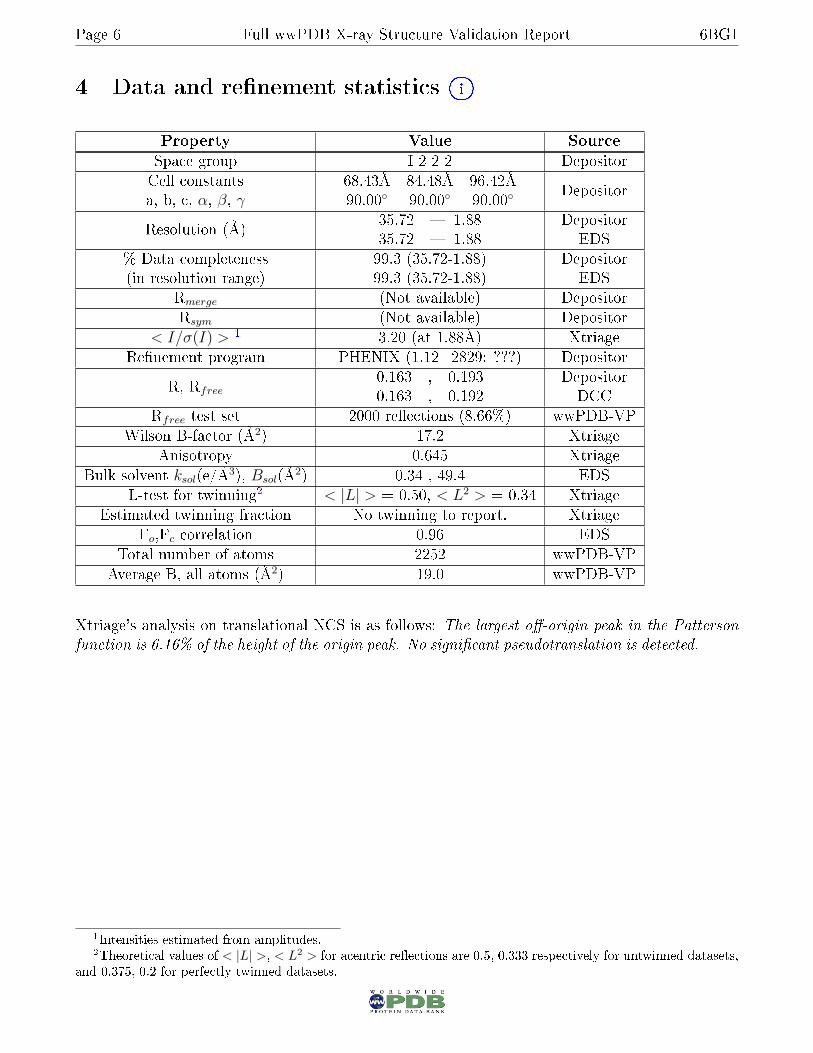
4 Data and re�nement statistics iO
Property Value SourceSpace group I 2 2 2 DepositorCell constantsa, b, c, α, β, γ
68.43Å 84.48Å 96.42Å90.00◦ 90.00◦ 90.00◦
Depositor
Resolution (Å)35.72 � 1.8835.72 � 1.88
DepositorEDS
% Data completeness(in resolution range)
99.3 (35.72-1.88)99.3 (35.72-1.88)
DepositorEDS
Rmerge (Not available) DepositorRsym (Not available) Depositor
< I/σ(I) > 1 3.20 (at 1.88Å) XtriageRe�nement program PHENIX (1.12_2829: ???) Depositor
R, Rfree0.163 , 0.1930.163 , 0.192
DepositorDCC
Rfree test set 2000 re�ections (8.66%) wwPDB-VPWilson B-factor (Å2) 17.2 Xtriage
Anisotropy 0.645 XtriageBulk solvent ksol(e/Å3), Bsol(Å2) 0.34 , 49.4 EDS
L-test for twinning2 < |L| > = 0.50, < L2 > = 0.34 XtriageEstimated twinning fraction No twinning to report. Xtriage
Fo,Fc correlation 0.96 EDSTotal number of atoms 2252 wwPDB-VP
Average B, all atoms (Å2) 19.0 wwPDB-VP
Xtriage's analysis on translational NCS is as follows: The largest o�-origin peak in the Patterson
function is 6.16% of the height of the origin peak. No signi�cant pseudotranslation is detected.
1Intensities estimated from amplitudes.2Theoretical values of < |L| >, < L2 > for acentric re�ections are 0.5, 0.333 respectively for untwinned datasets,
and 0.375, 0.2 for perfectly twinned datasets.
Page 7 Full wwPDB X-ray Structure Validation Report 6BG1
5 Model quality iO
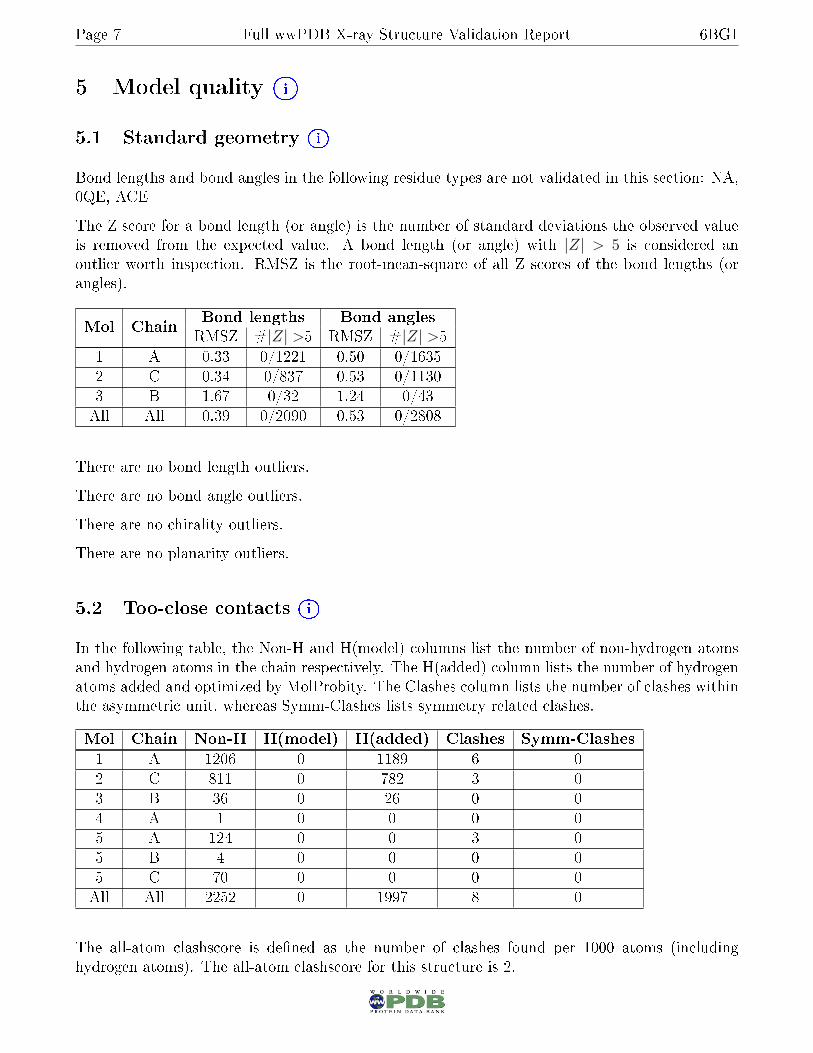
5.1 Standard geometry iO
Bond lengths and bond angles in the following residue types are not validated in this section: NA,0QE, ACE
The Z score for a bond length (or angle) is the number of standard deviations the observed valueis removed from the expected value. A bond length (or angle) with |Z| > 5 is considered anoutlier worth inspection. RMSZ is the root-mean-square of all Z scores of the bond lengths (orangles).
Mol ChainBond lengths Bond anglesRMSZ #|Z| >5 RMSZ #|Z| >5
1 A 0.33 0/1221 0.50 0/16352 C 0.34 0/837 0.53 0/11303 B 1.67 0/32 1.24 0/43All All 0.39 0/2090 0.53 0/2808
There are no bond length outliers.
There are no bond angle outliers.
There are no chirality outliers.
There are no planarity outliers.
5.2 Too-close contacts iO
In the following table, the Non-H and H(model) columns list the number of non-hydrogen atomsand hydrogen atoms in the chain respectively. The H(added) column lists the number of hydrogenatoms added and optimized by MolProbity. The Clashes column lists the number of clashes withinthe asymmetric unit, whereas Symm-Clashes lists symmetry related clashes.
Mol Chain Non-H H(model) H(added) Clashes Symm-Clashes1 A 1206 0 1189 6 02 C 811 0 782 3 03 B 36 0 26 0 04 A 1 0 0 0 05 A 124 0 0 3 05 B 4 0 0 0 05 C 70 0 0 0 0All All 2252 0 1997 8 0
The all-atom clashscore is de�ned as the number of clashes found per 1000 atoms (includinghydrogen atoms). The all-atom clashscore for this structure is 2.
Page 8 Full wwPDB X-ray Structure Validation Report 6BG1
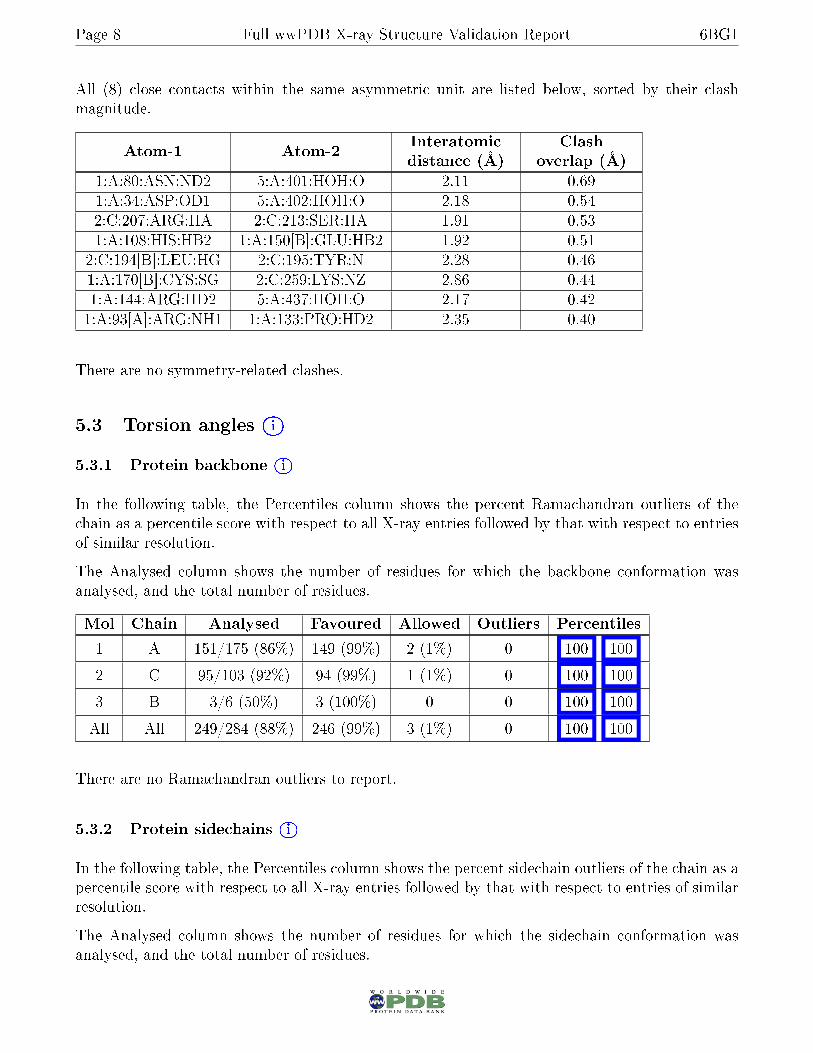
All (8) close contacts within the same asymmetric unit are listed below, sorted by their clashmagnitude.
Atom-1 Atom-2Interatomicdistance (Å)
Clashoverlap (Å)
1:A:80:ASN:ND2 5:A:401:HOH:O 2.11 0.691:A:34:ASP:OD1 5:A:402:HOH:O 2.18 0.542:C:207:ARG:HA 2:C:213:SER:HA 1.91 0.531:A:108:HIS:HB2 1:A:150[B]:GLU:HB2 1.92 0.51
2:C:194[B]:LEU:HG 2:C:195:TYR:N 2.28 0.461:A:170[B]:CYS:SG 2:C:259:LYS:NZ 2.86 0.441:A:144:ARG:HD2 5:A:437:HOH:O 2.17 0.421:A:93[A]:ARG:NH1 1:A:133:PRO:HD2 2.35 0.40
There are no symmetry-related clashes.
5.3 Torsion angles iO
5.3.1 Protein backbone iO
In the following table, the Percentiles column shows the percent Ramachandran outliers of thechain as a percentile score with respect to all X-ray entries followed by that with respect to entriesof similar resolution.
The Analysed column shows the number of residues for which the backbone conformation wasanalysed, and the total number of residues.
Mol Chain Analysed Favoured Allowed Outliers Percentiles
1 A 151/175 (86%) 149 (99%) 2 (1%) 0 100 100
2 C 95/103 (92%) 94 (99%) 1 (1%) 0 100 100
3 B 3/6 (50%) 3 (100%) 0 0 100 100
All All 249/284 (88%) 246 (99%) 3 (1%) 0 100 100
There are no Ramachandran outliers to report.
5.3.2 Protein sidechains iO
In the following table, the Percentiles column shows the percent sidechain outliers of the chain as apercentile score with respect to all X-ray entries followed by that with respect to entries of similarresolution.
The Analysed column shows the number of residues for which the sidechain conformation wasanalysed, and the total number of residues.
Page 9 Full wwPDB X-ray Structure Validation Report 6BG1
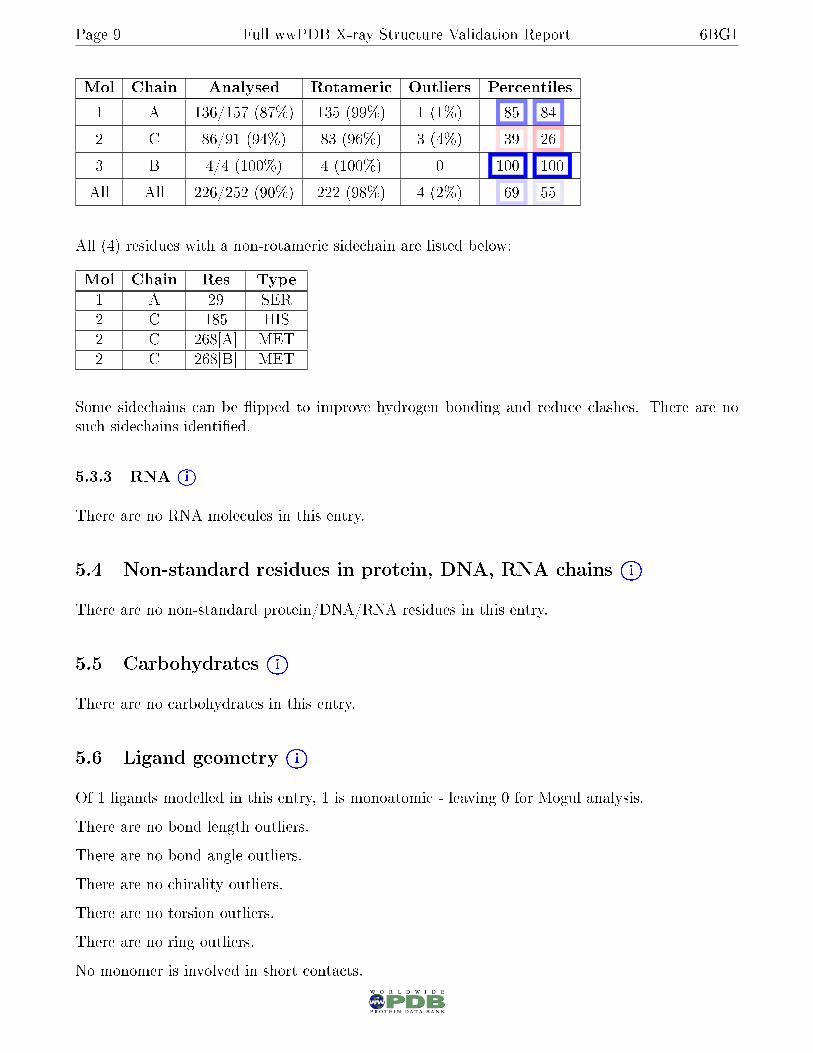
Mol Chain Analysed Rotameric Outliers Percentiles
1 A 136/157 (87%) 135 (99%) 1 (1%) 85 84
2 C 86/91 (94%) 83 (96%) 3 (4%) 39 26
3 B 4/4 (100%) 4 (100%) 0 100 100
All All 226/252 (90%) 222 (98%) 4 (2%) 69 55
All (4) residues with a non-rotameric sidechain are listed below:
Mol Chain Res Type1 A 29 SER2 C 185 HIS2 C 268[A] MET2 C 268[B] MET
Some sidechains can be �ipped to improve hydrogen bonding and reduce clashes. There are nosuch sidechains identi�ed.
5.3.3 RNA iO
There are no RNA molecules in this entry.
5.4 Non-standard residues in protein, DNA, RNA chains iO
There are no non-standard protein/DNA/RNA residues in this entry.
5.5 Carbohydrates iO
There are no carbohydrates in this entry.
5.6 Ligand geometry iO
Of 1 ligands modelled in this entry, 1 is monoatomic - leaving 0 for Mogul analysis.
There are no bond length outliers.
There are no bond angle outliers.
There are no chirality outliers.
There are no torsion outliers.
There are no ring outliers.
No monomer is involved in short contacts.
Page 10 Full wwPDB X-ray Structure Validation Report 6BG1
5.7 Other polymers iO
There are no such residues in this entry.
5.8 Polymer linkage issues iO
There are no chain breaks in this entry.
Page 11 Full wwPDB X-ray Structure Validation Report 6BG1
6 Fit of model and data iO
6.1 Protein, DNA and RNA chains iO
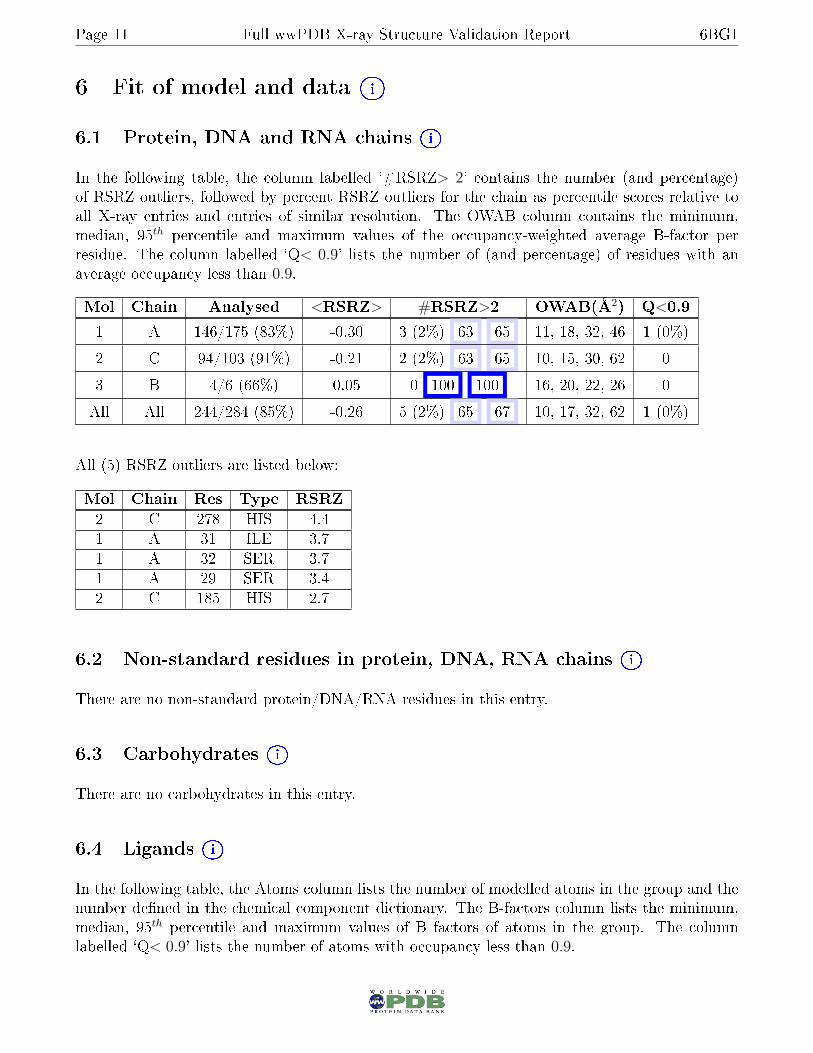
In the following table, the column labelled `#RSRZ> 2' contains the number (and percentage)of RSRZ outliers, followed by percent RSRZ outliers for the chain as percentile scores relative toall X-ray entries and entries of similar resolution. The OWAB column contains the minimum,median, 95th percentile and maximum values of the occupancy-weighted average B-factor perresidue. The column labelled `Q< 0.9' lists the number of (and percentage) of residues with anaverage occupancy less than 0.9.
Mol Chain Analysed <RSRZ> #RSRZ>2 OWAB(Å2) Q<0.9
1 A 146/175 (83%) -0.30 3 (2%) 63 65 11, 18, 32, 46 1 (0%)
2 C 94/103 (91%) -0.21 2 (2%) 63 65 10, 15, 30, 62 0
3 B 4/6 (66%) 0.05 0 100 100 16, 20, 22, 26 0
All All 244/284 (85%) -0.26 5 (2%) 65 67 10, 17, 32, 62 1 (0%)
All (5) RSRZ outliers are listed below:
Mol Chain Res Type RSRZ2 C 278 HIS 4.41 A 31 ILE 3.71 A 32 SER 3.71 A 29 SER 3.42 C 185 HIS 2.7
6.2 Non-standard residues in protein, DNA, RNA chains iO
There are no non-standard protein/DNA/RNA residues in this entry.
6.3 Carbohydrates iO
There are no carbohydrates in this entry.
6.4 Ligands iO
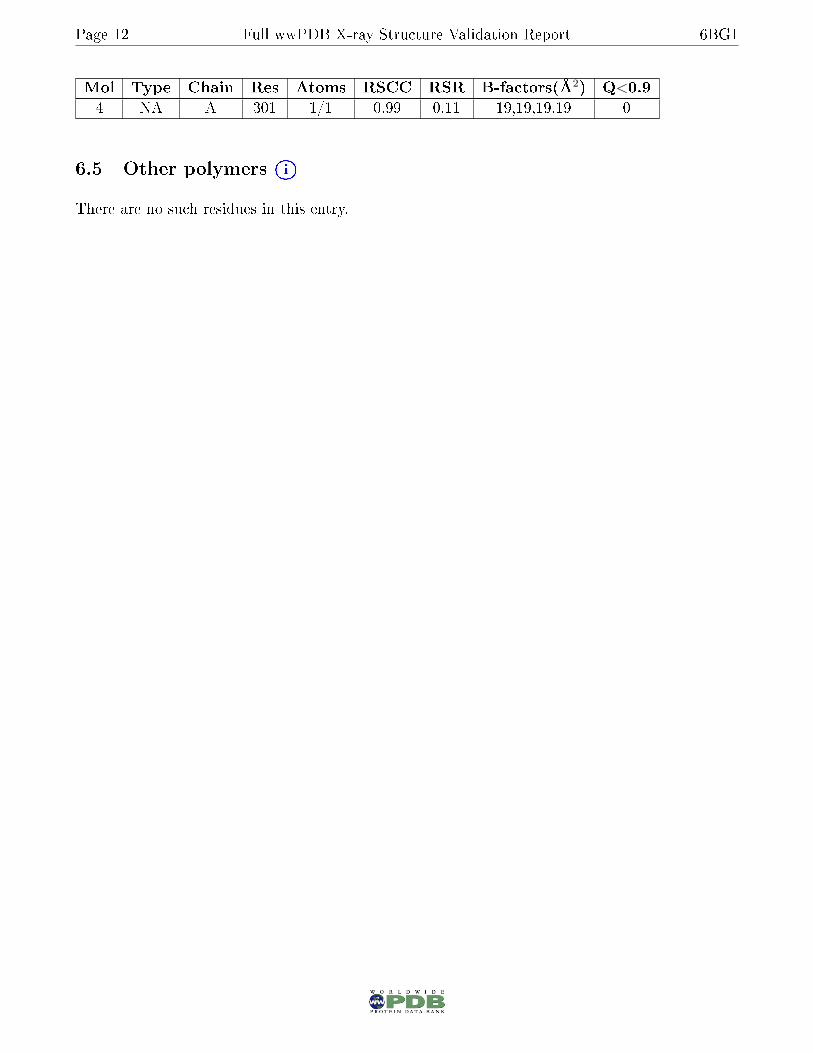
In the following table, the Atoms column lists the number of modelled atoms in the group and thenumber de�ned in the chemical component dictionary. The B-factors column lists the minimum,median, 95th percentile and maximum values of B factors of atoms in the group. The columnlabelled `Q< 0.9' lists the number of atoms with occupancy less than 0.9.
Page 12 Full wwPDB X-ray Structure Validation Report 6BG1
Mol Type Chain Res Atoms RSCC RSR B-factors(Å2) Q<0.94 NA A 301 1/1 0.99 0.11 19,19,19,19 0
6.5 Other polymers iO
There are no such residues in this entry.