Embed Size (px)
Citation preview

Full wwPDB NMR Structure Validation Report i○
Feb 21, 2018 – 12:20 am GMT
PDB ID : 6EVQTitle : solution NMR structure of EB1 C terminus (191-260) with a small molecule
bound into the SxIP binding siteAuthors : Barsukov, I.L.; Almeida, T.B.
Deposited on : 2017-11-02
This is a Full wwPDB NMR Structure Validation Report for a publicly released PDB entry.
We welcome your comments at [email protected] user guide is available at
https://www.wwpdb.org/validation/2017/NMRValidationReportHelpwith specific help available everywhere you see the i○ symbol.
The following versions of software and data (see references i○) were used in the production of this report:
Cyrange : Kirchner and Güntert (2011)NmrClust : Kelley et al. (1996)
MolProbity : 4.02b-467Mogul : 1.7.3 (157068), CSD as539be (2018)
Percentile statistics : 20171227.v01 (using entries in the PDB archive December 27th 2017)RCI : v_1n_11_5_13_A (Berjanski et al., 2005)
PANAV : Wang et al. (2010)ShiftChecker : trunk30686
Ideal geometry (proteins) : Engh & Huber (2001)Ideal geometry (DNA, RNA) : Parkinson et al. (1996)
Validation Pipeline (wwPDB-VP) : trunk30686

Page 2 Full wwPDB NMR Structure Validation Report 6EVQ
1 Overall quality at a glance i○
The following experimental techniques were used to determine the structure:SOLUTION NMR
The overall completeness of chemical shifts assignment is 36%.
Percentile scores (ranging between 0-100) for global validation metrics of the entry are shown inthe following graphic. The table shows the number of entries on which the scores are based.
Metric Whole archive(#Entries)
NMR archive(#Entries)
Clashscore 136279 12091Ramachandran outliers 132675 10835
Sidechain outliers 132484 10811
The table below summarises the geometric issues observed across the polymeric chains and theirfit to the experimental data. The red, orange, yellow and green segments indicate the fractionof residues that contain outliers for >=3, 2, 1 and 0 types of geometric quality criteria. A cyansegment indicates the fraction of residues that are not part of the well-defined cores, and a grey seg-ment represents the fraction of residues that are not modelled. The numeric value for each fractionis indicated below the corresponding segment, with a dot representing fractions <=5%
Mol Chain Length Quality of chain
1 A 70
1 B 70
Page 3 Full wwPDB NMR Structure Validation Report 6EVQ
2 Ensemble composition and analysis i○
This entry contains 20 models. Model 11 is the overall representative, medoid model (most similarto other models). The authors have identified model 1 as representative, based on the followingcriterion: closest to the average.
The following residues are included in the computation of the global validation metrics.
Well-defined (core) protein residuesWell-defined core Residue range (total) Backbone RMSD (Å) Medoid model
1 A:192-A:249, B:192-B:249(116)
0.21 11
Ill-defined regions of proteins are excluded from the global statistics.
Ligands and non-protein polymers are included in the analysis.
The models can be grouped into 3 clusters. No single-model clusters were found.
Cluster number Models1 1, 5, 6, 9, 11, 13, 14, 16, 19, 202 4, 7, 8, 10, 12, 17, 183 2, 3, 15

Page 4 Full wwPDB NMR Structure Validation Report 6EVQ
3 Entry composition i○
There are 2 unique types of molecules in this entry. The entry contains 2314 atoms, of which 1140are hydrogens and 0 are deuteriums.
• Molecule 1 is a protein called Microtubule-associated protein RP/EB family member 1.
Mol Chain Residues Atoms Trace
1 A 70 Total C H N O S1116 355 551 90 118 2 0
1 B 70 Total C H N O S1116 355 551 90 118 2 0
• Molecule 2 is (2 {R})-2-[(1-cyclopentyl-1,2,3,4-tetrazol-5-yl)sulfanyl]- {N}-(furan-2-ylmethyl)propanamide (three-letter code: C05) (formula: C14H19N5O2S).
Mol Chain Residues Atoms
2 A 1 Total C H N O S41 14 19 5 2 1
2 B 1 Total C H N O S41 14 19 5 2 1
Page 5 Full wwPDB NMR Structure Validation Report 6EVQ
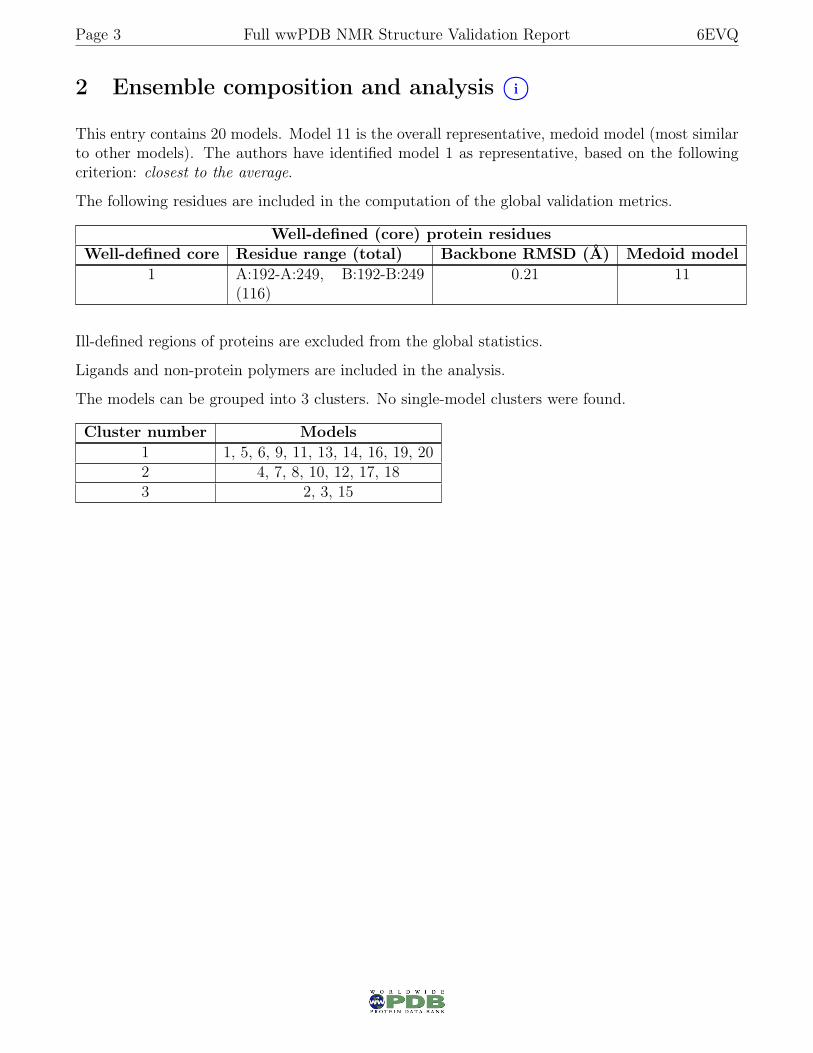
4 Residue-property plots i○
4.1 Average score per residue in the NMR ensemble
These plots are provided for all protein, RNA and DNA chains in the entry. The first graphic is thesame as shown in the summary in section 1 of this report. The second graphic shows the sequencewhere residues are colour-coded according to the number of geometric quality criteria for whichthey contain at least one outlier: green = 0, yellow = 1, orange = 2 and red = 3 or more. Stretchesof 2 or more consecutive residues without any outliers are shown as green connectors. Residueswhich are classified as ill-defined in the NMR ensemble, are shown in cyan with an underlinecolour-coded according to the previous scheme. Residues which were present in the experimentalsample, but not modelled in the final structure are shown in grey.
• Molecule 1: Microtubule-associated protein RP/EB family member 1
Chain A:
D191
E192
A193
L196
M197
K201
K204
L205
D209
L210
E211
K212
E213
R214
D215
F216
Y217
F218
G219
K220
L221
R222
N223
I224
E225
L226
V238
L239
I242
V243
D244
I245
L246
D250
E251
G252
F253
V254
I255
P256
D257
E258
G259
G260
• Molecule 1: Microtubule-associated protein RP/EB family member 1
Chain B:
D191
E192
A193
L196
M197
K201
K204
L205
D209
L210
E211
K212
E213
R214
D215
F216
Y217
F218
G219
K220
L221
R222
N223
I224
E225
L226
V238
L239
I242
V243
D244
I245
L246
D250
E251
G252
F253
V254
I255
P256
D257
E258
G259
G260
4.2 Scores per residue for each member of the ensemble
Colouring as in section 4.1 above.
4.2.1 Score per residue for model 1
• Molecule 1: Microtubule-associated protein RP/EB family member 1
Chain A:
D191
E192
A193
L196
M197
Q198
Q199
L203
D209
K212
E213
R214
D215
F216
Y217
F218
L221
R222
N223
I224
E225
L226
V238
L239
Q240
R241
I242
L246
D250
E251
G252
F253
V254
I255
P256
D257
E258
G259
G260
• Molecule 1: Microtubule-associated protein RP/EB family member 1
Chain B:
D191
E192
A193
L196
M197
Q198
Q199
L203
D209
K212
E213
R214
D215
F216
Y217
F218
L221
R222
N223
I224
E225
L226
V238
L239
Q240
R241
I242
L246
D250
E251
G252
F253
V254
I255
P256
D257
E258
G259
G260

Page 6 Full wwPDB NMR Structure Validation Report 6EVQ
4.2.2 Score per residue for model 2
• Molecule 1: Microtubule-associated protein RP/EB family member 1
Chain A:
D191
E192
A193
L196
M197
K201
L205
D209
L210
E211
K212
E213
R214
D215
F216
Y217
F218
G219
K220
L221
R222
N223
I224
E225
L226
Q229
D236
P237
V238
L239
I242
I245
L246
D250
E251
G252
F253
V254
I255
P256
D257
E258
G259
G260
• Molecule 1: Microtubule-associated protein RP/EB family member 1
Chain B:
D191
E192
A193
L196
M197
K201
L205
D209
L210
E211
K212
E213
R214
D215
F216
Y217
F218
G219
K220
L221
R222
N223
I224
E225
L226
Q229
D236
P237
V238
L239
I242
I245
L246
D250
E251
G252
F253
V254
I255
P256
D257
E258
G259
G260
4.2.3 Score per residue for model 3
• Molecule 1: Microtubule-associated protein RP/EB family member 1
Chain A:
D191
E192
A193
L196
M197
K201
K204
L205
K212
E213
R214
D215
F216
Y217
F218
G219
K220
L221
R222
N223
I224
E225
L226
I227
C228
Q229
E230
V238
L239
Q240
R241
I242
V243
D244
I245
L246
D250
E251
G252
F253
V254
I255
P256
D257
E258
G259
G260
• Molecule 1: Microtubule-associated protein RP/EB family member 1
Chain B:
D191
E192
A193
L196
M197
K201
K204
L205
K212
E213
R214
D215
F216
Y217
F218
G219
K220
L221
R222
N223
I224
E225
L226
E230
V238
L239
Q240
R241
I242
V243
D244
I245
L246
D250
E251
G252
F253
V254
I255
P256
D257
E258
G259
G260
4.2.4 Score per residue for model 4
• Molecule 1: Microtubule-associated protein RP/EB family member 1
Chain A:
D191
E192
A193
L196
M197
K201
L205
T206
V207
E211
R214
D215
F216
Y217
F218
G219
K220
L221
R222
N223
I224
E225
L226
I227
C228
D236
P237
V238
L239
I242
V243
D244
I245
L246
D250
E251
G252
F253
V254
I255
P256
D257
E258
G259
G260
• Molecule 1: Microtubule-associated protein RP/EB family member 1
Chain B:
D191
E192
A193
L196
M197
K201
L205
T206
V207
E211
R214
Y217
F218
L221
R222
N223
I224
E225
L226
I227
C228
D236
P237
V238
L239
I242
V243
D244
I245
L246
D250
E251
G252
F253
V254
I255
P256
D257
E258
G259
G260

Page 7 Full wwPDB NMR Structure Validation Report 6EVQ
4.2.5 Score per residue for model 5
• Molecule 1: Microtubule-associated protein RP/EB family member 1
Chain A:
D191
E192
A193
L196
M197
K201
L205
D209
L210
E211
K212
E213
R214
Y217
F218
G219
K220
L221
R222
N223
I224
E225
L226
V238
L239
I242
V243
D244
I245
L246
D250
E251
G252
F253
V254
I255
P256
D257
E258
G259
G260
• Molecule 1: Microtubule-associated protein RP/EB family member 1
Chain B:
D191
E192
A193
L196
M197
K201
L205
D209
L210
E211
K212
E213
R214
Y217
F218
L221
R222
N223
I224
E225
L226
V238
L239
I242
V243
D244
I245
L246
D250
E251
G252
F253
V254
I255
P256
D257
E258
G259
G260
4.2.6 Score per residue for model 6
• Molecule 1: Microtubule-associated protein RP/EB family member 1
Chain A:
D191
E192
A193
A194
E195
L196
M197
Q198
Q199
L203
V207
L210
E211
Y217
K220
L221
R222
N223
I224
E225
L226
V238
L239
Q240
R241
I242
V243
D244
I245
L246
D250
E251
G252
F253
V254
I255
P256
D257
E258
G259
G260
• Molecule 1: Microtubule-associated protein RP/EB family member 1
Chain B:
D191
E192
A193
A194
E195
L196
M197
Q198
Q199
L203
V207
L210
E211
Y217
K220
L221
R222
N223
I224
E225
L226
V238
L239
Q240
R241
I242
V243
D244
I245
L246
D250
E251
G252
F253
V254
I255
P256
D257
E258
G259
G260
4.2.7 Score per residue for model 7
• Molecule 1: Microtubule-associated protein RP/EB family member 1
Chain A:
D191
E192
A193
M197
K201
K204
L205
D209
L210
E211
K212
E213
R214
Y217
F218
G219
K220
L221
R222
N223
I224
E225
L226
E230
V238
L239
Q240
R241
I242
V243
D244
I245
L246
D250
E251
G252
F253
V254
I255
P256
D257
E258
G259
G260
• Molecule 1: Microtubule-associated protein RP/EB family member 1
Chain B:
D191
E192
A193
M197
K201
K204
L205
D209
L210
E211
K212
E213
R214
Y217
F218
G219
K220
L221
R222
N223
I224
E225
L226
E230
V238
L239
Q240
R241
I242
V243
D244
I245
L246
D250
E251
G252
F253
V254
I255
P256
D257
E258
G259
G260

Page 8 Full wwPDB NMR Structure Validation Report 6EVQ
4.2.8 Score per residue for model 8
• Molecule 1: Microtubule-associated protein RP/EB family member 1
Chain A:
D191
E192
A193
L196
M197
K201
K204
L205
L210
E211
K212
E213
R214
D215
F216
Y217
F218
L221
R222
N223
I224
E225
L226
V238
L239
I242
I245
L246
D250
E251
G252
F253
V254
I255
P256
D257
E258
G259
G260
• Molecule 1: Microtubule-associated protein RP/EB family member 1
Chain B:
D191
E192
A193
L196
M197
K201
K204
L205
L210
E211
K212
E213
R214
D215
F216
Y217
F218
L221
R222
N223
I224
E225
L226
V238
L239
I242
I245
L246
D250
E251
G252
F253
V254
I255
P256
D257
E258
G259
G260
4.2.9 Score per residue for model 9
• Molecule 1: Microtubule-associated protein RP/EB family member 1
Chain A:
D191
E192
A193
L196
M197
K201
V202
L203
K204
L205
K212
E213
R214
D215
F216
Y217
F218
G219
K220
L221
R222
N223
I224
E225
L226
I227
C228
V238
L239
I242
V243
D244
I245
L246
D250
E251
G252
F253
V254
I255
P256
D257
E258
G259
G260
• Molecule 1: Microtubule-associated protein RP/EB family member 1
Chain B:
D191
E192
A193
L196
M197
K201
V202
L203
K204
L205
K212
E213
R214
D215
F216
Y217
F218
G219
K220
L221
R222
N223
I224
E225
L226
I227
C228
V238
L239
I242
V243
D244
I245
L246
D250
E251
G252
F253
V254
I255
P256
D257
E258
G259
G260
4.2.10 Score per residue for model 10
• Molecule 1: Microtubule-associated protein RP/EB family member 1
Chain A:
D191
E192
A193
M197
Q198
Q199
V200
K201
V202
L203
K204
L205
D209
L210
E211
K212
E213
R214
D215
F216
Y217
F218
L221
R222
N223
I224
E225
L226
V238
L239
I242
I245
L246
D250
E251
G252
F253
V254
I255
P256
D257
E258
G259
G260
• Molecule 1: Microtubule-associated protein RP/EB family member 1
Chain B:
D191
E192
A193
M197
Q198
Q199
V200
K201
V202
L203
K204
L205
D209
L210
E211
K212
E213
R214
D215
F216
Y217
F218
L221
R222
N223
I224
E225
L226
V238
L239
I242
I245
L246
D250
E251
G252
F253
V254
I255
P256
D257
E258
G259
G260

Page 9 Full wwPDB NMR Structure Validation Report 6EVQ
4.2.11 Score per residue for model 11 (medoid)
• Molecule 1: Microtubule-associated protein RP/EB family member 1
Chain A:
D191
E192
A193
L196
M197
K201
L205
L210
R214
D215
F216
Y217
F218
G219
K220
L221
R222
N223
I224
E225
L226
D236
P237
V238
L239
I242
V243
D244
I245
L246
D250
E251
G252
F253
V254
I255
P256
D257
E258
G259
G260
• Molecule 1: Microtubule-associated protein RP/EB family member 1
Chain B:
D191
E192
A193
L196
M197
K201
L205
L210
R214
D215
F216
Y217
F218
G219
K220
L221
R222
N223
I224
E225
L226
D236
P237
V238
L239
I242
V243
D244
I245
L246
D250
E251
G252
F253
V254
I255
P256
D257
E258
G259
G260
4.2.12 Score per residue for model 12
• Molecule 1: Microtubule-associated protein RP/EB family member 1
Chain A:
D191
E192
A193
L196
M197
Q198
Q199
V200
K201
V202
L203
K204
V207
E208
D209
L210
E211
K212
E213
R214
D215
F216
Y217
F218
L221
R222
N223
I224
E225
L226
V238
L239
Q240
R241
I242
I245
L246
D250
E251
G252
F253
V254
I255
P256
D257
E258
G259
G260
• Molecule 1: Microtubule-associated protein RP/EB family member 1
Chain B:
D191
E192
A193
L196
M197
Q198
Q199
V200
K201
V202
L203
K204
V207
E208
D209
L210
E211
K212
E213
R214
D215
F216
Y217
F218
L221
R222
N223
I224
E225
L226
V238
L239
Q240
R241
I242
V243
D244
I245
L246
D250
E251
G252
F253
V254
I255
P256
D257
E258
G259
G260
4.2.13 Score per residue for model 13
• Molecule 1: Microtubule-associated protein RP/EB family member 1
Chain A:
D191
E192
A193
L196
M197
K201
K204
L205
R214
Y217
F218
L221
R222
N223
I224
E225
L226
I227
C228
V238
L239
Q240
R241
I242
I245
L246
D250
E251
G252
F253
V254
I255
P256
D257
E258
G259
G260
• Molecule 1: Microtubule-associated protein RP/EB family member 1
Chain B:
D191
E192
A193
L196
M197
K201
K204
L205
R214
Y217
F218
L221
R222
N223
I224
E225
L226
I227
C228
V238
L239
Q240
R241
I242
I245
L246
D250
E251
G252
F253
V254
I255
P256
D257
E258
G259
G260

Page 10 Full wwPDB NMR Structure Validation Report 6EVQ
4.2.14 Score per residue for model 14
• Molecule 1: Microtubule-associated protein RP/EB family member 1
Chain A:
D191
E192
A193
A194
E195
L196
M197
K201
K204
L205
D209
L210
E211
K212
E213
R214
D215
F216
Y217
F218
G219
K220
L221
R222
N223
I224
E225
L226
V238
L239
I242
V243
D244
I245
L246
D250
E251
G252
F253
V254
I255
P256
D257
E258
G259
G260
• Molecule 1: Microtubule-associated protein RP/EB family member 1
Chain B:
D191
E192
A193
A194
E195
L196
M197
K201
K204
L205
D209
L210
E211
K212
E213
R214
D215
F216
Y217
F218
G219
K220
L221
R222
N223
I224
E225
L226
V238
L239
I242
V243
D244
I245
L246
D250
E251
G252
F253
V254
I255
P256
D257
E258
G259
G260
4.2.15 Score per residue for model 15
• Molecule 1: Microtubule-associated protein RP/EB family member 1
Chain A:
D191
E192
A193
A194
E195
L196
M197
K201
K204
L205
D209
K212
E213
R214
D215
F216
Y217
F218
G219
K220
L221
R222
N223
I224
E225
L226
I227
C228
V238
L239
I242
V243
D244
I245
L246
D250
E251
G252
F253
V254
I255
P256
D257
E258
G259
G260
• Molecule 1: Microtubule-associated protein RP/EB family member 1
Chain B:
D191
E192
A193
A194
E195
L196
M197
K201
K204
L205
D209
K212
E213
R214
D215
F216
Y217
F218
G219
K220
L221
R222
N223
I224
E225
L226
I227
C228
V238
L239
I242
V243
D244
I245
L246
D250
E251
G252
F253
V254
I255
P256
D257
E258
G259
G260
4.2.16 Score per residue for model 16
• Molecule 1: Microtubule-associated protein RP/EB family member 1
Chain A:
D191
E192
A193
L196
M197
Q198
Q199
V200
K201
K204
L205
T206
V207
R214
D215
F216
Y217
F218
G219
K220
L221
R222
N223
I224
E225
L226
V238
L239
I242
V243
D244
I245
L246
D250
E251
G252
F253
V254
I255
P256
D257
E258
G259
G260
• Molecule 1: Microtubule-associated protein RP/EB family member 1
Chain B:
D191
E192
A193
L196
M197
Q198
Q199
V200
K201
K204
L205
T206
V207
K212
E213
R214
D215
F216
Y217
F218
G219
K220
L221
R222
N223
I224
E225
L226
V238
L239
I242
V243
D244
I245
L246
D250
E251
G252
F253
V254
I255
P256
D257
E258
G259
G260

Page 11 Full wwPDB NMR Structure Validation Report 6EVQ
4.2.17 Score per residue for model 17
• Molecule 1: Microtubule-associated protein RP/EB family member 1
Chain A:
D191
E192
A193
L196
M197
K201
K204
L205
D209
L210
E213
R214
Y217
F218
G219
K220
L221
R222
N223
I224
E225
L226
I227
V238
L239
I242
V243
D244
I245
L246
D250
E251
G252
F253
V254
I255
P256
D257
E258
G259
G260
• Molecule 1: Microtubule-associated protein RP/EB family member 1
Chain B:
D191
E192
A193
L196
M197
K201
K204
L205
D209
L210
E213
R214
Y217
F218
G219
K220
L221
R222
N223
I224
E225
L226
I227
V238
L239
Q240
R241
I242
V243
D244
I245
L246
D250
E251
G252
F253
V254
I255
P256
D257
E258
G259
G260
4.2.18 Score per residue for model 18
• Molecule 1: Microtubule-associated protein RP/EB family member 1
Chain A:
D191
E192
A193
L196
M197
K201
K204
L205
T206
V207
E208
D209
L210
E211
K212
E213
R214
Y217
F218
G219
K220
L221
R222
N223
I224
E225
L226
I227
C228
V238
L239
I242
V243
D244
I245
L246
D250
E251
G252
F253
V254
I255
P256
D257
E258
G259
G260
• Molecule 1: Microtubule-associated protein RP/EB family member 1
Chain B:
D191
E192
A193
L196
M197
K201
K204
L205
T206
V207
E208
D209
L210
E211
K212
E213
R214
Y217
F218
G219
K220
L221
R222
N223
I224
E225
L226
I227
C228
V238
L239
I242
V243
D244
I245
L246
D250
E251
G252
F253
V254
I255
P256
D257
E258
G259
G260
4.2.19 Score per residue for model 19
• Molecule 1: Microtubule-associated protein RP/EB family member 1
Chain A:
D191
E192
A193
M197
E208
D209
L210
E211
K212
E213
R214
D215
F216
Y217
F218
L221
R222
N223
I224
E225
L226
V238
L239
I242
V243
D244
I245
L246
D250
E251
G252
F253
V254
I255
P256
D257
E258
G259
G260
• Molecule 1: Microtubule-associated protein RP/EB family member 1
Chain B:
D191
E192
A193
L196
M197
E208
D209
L210
E211
K212
E213
R214
D215
F216
Y217
F218
L221
R222
N223
I224
E225
L226
V238
L239
I242
V243
D244
I245
L246
D250
E251
G252
F253
V254
I255
P256
D257
E258
G259
G260

Page 12 Full wwPDB NMR Structure Validation Report 6EVQ
4.2.20 Score per residue for model 20
• Molecule 1: Microtubule-associated protein RP/EB family member 1
Chain A:
D191
E192
A193
L196
M197
K201
V202
L203
D209
L210
E211
K212
E213
R214
Y217
F218
L221
R222
N223
I224
E225
L226
N235
V238
L239
Q240
R241
I242
I245
L246
D250
E251
G252
F253
V254
I255
P256
D257
E258
G259
G260
• Molecule 1: Microtubule-associated protein RP/EB family member 1
Chain B:
D191
E192
A193
L196
M197
K201
V202
L203
D209
L210
E211
K212
E213
R214
Y217
F218
L221
R222
N223
I224
E225
L226
N235
V238
L239
Q240
R241
I242
I245
L246
D250
E251
G252
F253
V254
I255
P256
D257
E258
G259
G260

Page 13 Full wwPDB NMR Structure Validation Report 6EVQ
5 Refinement protocol and experimental data overview i○
The models were refined using the following method: simulated annealing.
Of the 20 calculated structures, 20 were deposited, based on the following criterion: all calculatedstructures submitted.
The following table shows the software used for structure solution, optimisation and refinement.
Software name Classification VersionCNS refinementARIA structure calculation
The following table shows chemical shift validation statistics as aggregates over all chemical shiftfiles. Detailed validation can be found in section 7 of this report.
Chemical shift file(s) 6evq_cs.strNumber of chemical shift lists 2Total number of shifts 1456Number of shifts mapped to atoms 1456Number of unparsed shifts 0Number of shifts with mapping errors 0Number of shifts with mapping warnings 0Assignment completeness (well-defined parts) 36%
No validations of the models with respect to experimental NMR restraints is performed at thistime.
Page 14 Full wwPDB NMR Structure Validation Report 6EVQ
6 Model quality i○
6.1 Standard geometry i○
Bond lengths and bond angles in the following residue types are not validated in this section:C05
There are no covalent bond-length or bond-angle outliers.
There are no bond-length outliers.
There are no bond-angle outliers.
There are no chirality outliers.
There are no planarity outliers.
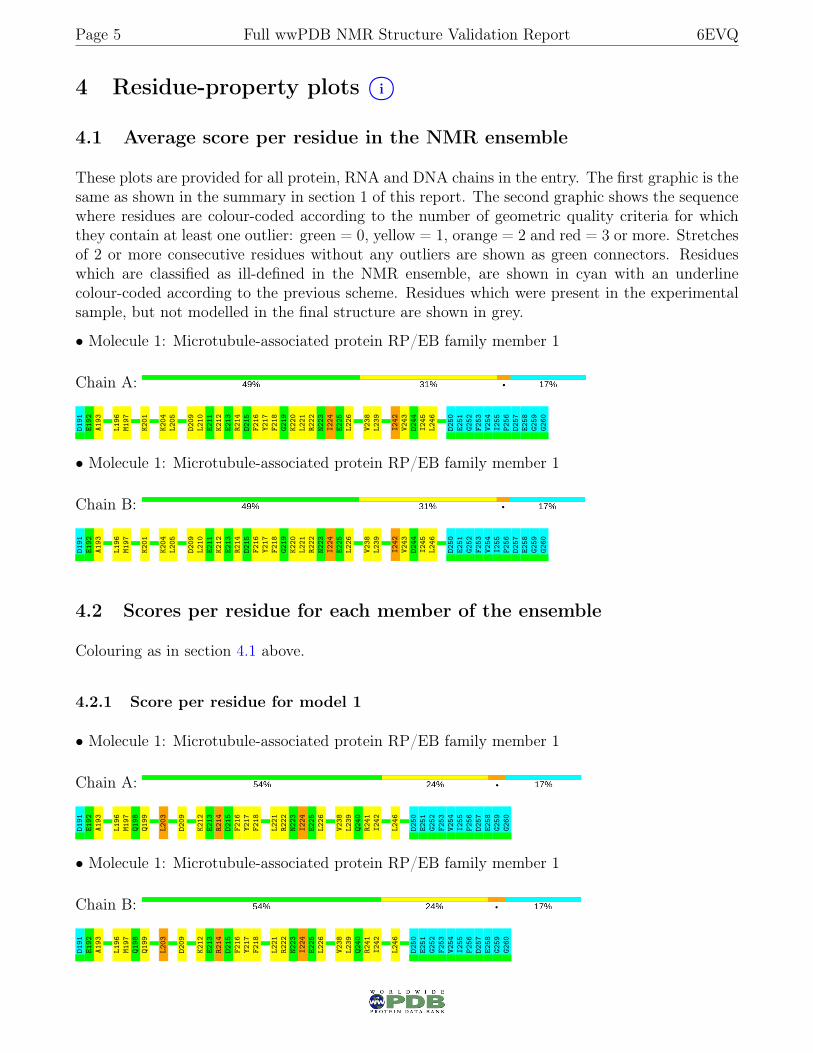
6.2 Too-close contacts i○
In the following table, the Non-H and H(model) columns list the number of non-hydrogen atomsand hydrogen atoms in each chain respectively. The H(added) column lists the number of hydrogenatoms added and optimized by MolProbity. The Clashes column lists the number of clashesaveraged over the ensemble.
Mol Chain Non-H H(model) H(added) Clashes1 A 477 480 480 19±21 B 477 480 480 19±22 A 22 19 0 0±02 B 22 19 0 0±0All All 19960 19960 19200 738
The all-atom clashscore is defined as the number of clashes found per 1000 atoms (includinghydrogen atoms). The all-atom clashscore for this structure is 19.
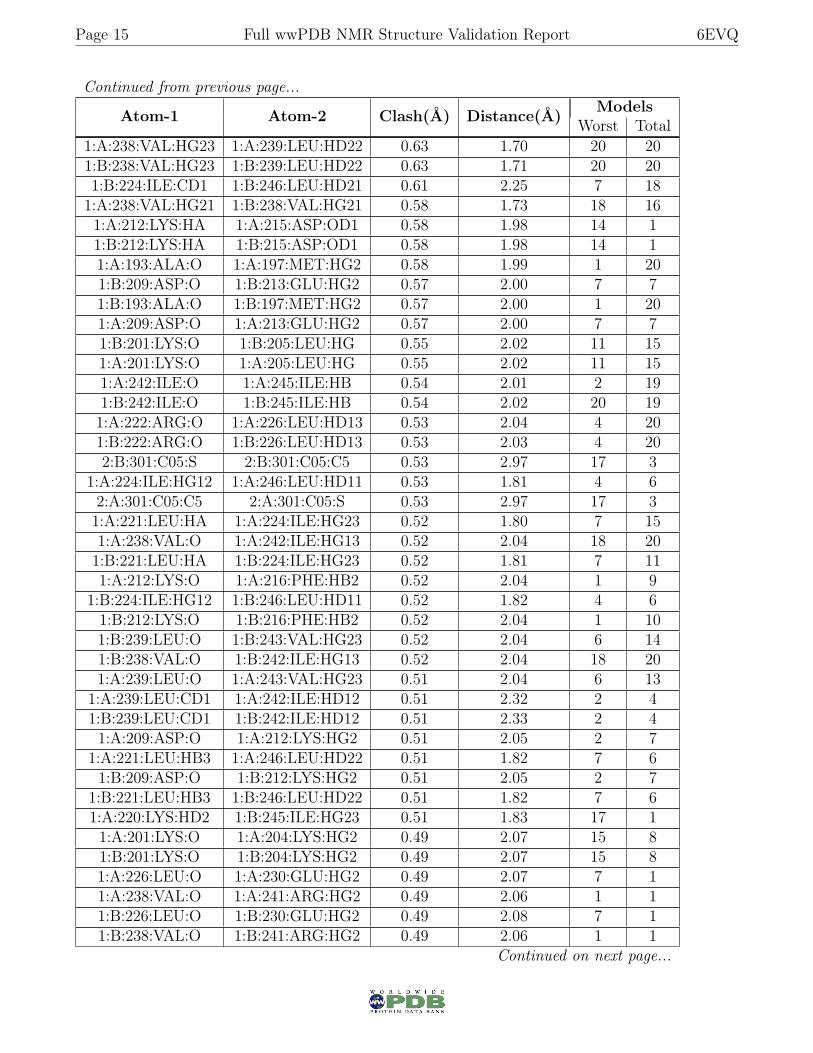
All unique clashes are listed below, sorted by their clash magnitude.
Atom-1 Atom-2 Clash(Å) Distance(Å) ModelsWorst Total
1:A:224:ILE:HD13 1:A:246:LEU:HD21 0.76 1.56 17 201:B:224:ILE:HD13 1:B:246:LEU:HD21 0.75 1.57 17 201:A:239:LEU:HD13 1:A:242:ILE:HD12 0.74 1.60 9 201:B:239:LEU:HD13 1:B:242:ILE:HD12 0.73 1.61 9 201:A:217:TYR:O 1:A:221:LEU:HD22 0.65 1.91 11 201:B:217:TYR:O 1:B:221:LEU:HD22 0.65 1.92 11 201:B:214:ARG:O 1:B:218:PHE:HB2 0.64 1.93 18 191:A:224:ILE:CD1 1:A:246:LEU:HD21 0.63 2.23 7 191:A:214:ARG:O 1:A:218:PHE:HB2 0.63 1.93 18 19
Continued on next page...
Page 15 Full wwPDB NMR Structure Validation Report 6EVQ
Continued from previous page...
Atom-1 Atom-2 Clash(Å) Distance(Å) ModelsWorst Total
1:A:238:VAL:HG23 1:A:239:LEU:HD22 0.63 1.70 20 201:B:238:VAL:HG23 1:B:239:LEU:HD22 0.63 1.71 20 201:B:224:ILE:CD1 1:B:246:LEU:HD21 0.61 2.25 7 181:A:238:VAL:HG21 1:B:238:VAL:HG21 0.58 1.73 18 161:A:212:LYS:HA 1:A:215:ASP:OD1 0.58 1.98 14 11:B:212:LYS:HA 1:B:215:ASP:OD1 0.58 1.98 14 11:A:193:ALA:O 1:A:197:MET:HG2 0.58 1.99 1 201:B:209:ASP:O 1:B:213:GLU:HG2 0.57 2.00 7 71:B:193:ALA:O 1:B:197:MET:HG2 0.57 2.00 1 201:A:209:ASP:O 1:A:213:GLU:HG2 0.57 2.00 7 71:B:201:LYS:O 1:B:205:LEU:HG 0.55 2.02 11 151:A:201:LYS:O 1:A:205:LEU:HG 0.55 2.02 11 151:A:242:ILE:O 1:A:245:ILE:HB 0.54 2.01 2 191:B:242:ILE:O 1:B:245:ILE:HB 0.54 2.02 20 191:A:222:ARG:O 1:A:226:LEU:HD13 0.53 2.04 4 201:B:222:ARG:O 1:B:226:LEU:HD13 0.53 2.03 4 202:B:301:C05:S 2:B:301:C05:C5 0.53 2.97 17 3
1:A:224:ILE:HG12 1:A:246:LEU:HD11 0.53 1.81 4 62:A:301:C05:C5 2:A:301:C05:S 0.53 2.97 17 31:A:221:LEU:HA 1:A:224:ILE:HG23 0.52 1.80 7 151:A:238:VAL:O 1:A:242:ILE:HG13 0.52 2.04 18 201:B:221:LEU:HA 1:B:224:ILE:HG23 0.52 1.81 7 111:A:212:LYS:O 1:A:216:PHE:HB2 0.52 2.04 1 9
1:B:224:ILE:HG12 1:B:246:LEU:HD11 0.52 1.82 4 61:B:212:LYS:O 1:B:216:PHE:HB2 0.52 2.04 1 101:B:239:LEU:O 1:B:243:VAL:HG23 0.52 2.04 6 141:B:238:VAL:O 1:B:242:ILE:HG13 0.52 2.04 18 201:A:239:LEU:O 1:A:243:VAL:HG23 0.51 2.04 6 13
1:A:239:LEU:CD1 1:A:242:ILE:HD12 0.51 2.32 2 41:B:239:LEU:CD1 1:B:242:ILE:HD12 0.51 2.33 2 41:A:209:ASP:O 1:A:212:LYS:HG2 0.51 2.05 2 7
1:A:221:LEU:HB3 1:A:246:LEU:HD22 0.51 1.82 7 61:B:209:ASP:O 1:B:212:LYS:HG2 0.51 2.05 2 7
1:B:221:LEU:HB3 1:B:246:LEU:HD22 0.51 1.82 7 61:A:220:LYS:HD2 1:B:245:ILE:HG23 0.51 1.83 17 11:A:201:LYS:O 1:A:204:LYS:HG2 0.49 2.07 15 81:B:201:LYS:O 1:B:204:LYS:HG2 0.49 2.07 15 81:A:226:LEU:O 1:A:230:GLU:HG2 0.49 2.07 7 11:A:238:VAL:O 1:A:241:ARG:HG2 0.49 2.06 1 11:B:226:LEU:O 1:B:230:GLU:HG2 0.49 2.08 7 11:B:238:VAL:O 1:B:241:ARG:HG2 0.49 2.06 1 1
Continued on next page...

Page 16 Full wwPDB NMR Structure Validation Report 6EVQ
Continued from previous page...
Atom-1 Atom-2 Clash(Å) Distance(Å) ModelsWorst Total
1:A:217:TYR:O 1:A:220:LYS:HB2 0.48 2.08 9 101:A:236:ASP:HB3 1:A:238:VAL:HG22 0.48 1.86 2 31:A:239:LEU:HD13 1:A:242:ILE:CD1 0.48 2.35 2 151:A:226:LEU:O 1:A:230:GLU:HG3 0.48 2.09 3 1
1:B:236:ASP:HB3 1:B:238:VAL:HG22 0.48 1.86 2 31:B:239:LEU:HD13 1:B:242:ILE:CD1 0.48 2.35 2 151:B:217:TYR:O 1:B:220:LYS:HB2 0.47 2.09 9 91:B:226:LEU:O 1:B:230:GLU:HG3 0.47 2.10 3 11:B:228:CYS:SG 1:B:239:LEU:HB3 0.47 2.50 9 21:B:199:GLN:O 1:B:203:LEU:HB2 0.47 2.10 1 4
1:A:210:LEU:HB3 1:B:210:LEU:HB3 0.47 1.86 18 111:A:228:CYS:SG 1:A:239:LEU:HB3 0.47 2.50 9 22:B:301:C05:C5 2:B:301:C05:S 0.47 3.03 5 22:A:301:C05:S 2:A:301:C05:C5 0.47 3.03 5 21:A:199:GLN:O 1:A:203:LEU:HB2 0.46 2.10 1 4
1:A:245:ILE:HG23 1:B:220:LYS:HD2 0.46 1.87 17 11:A:207:VAL:O 1:A:211:GLU:HG3 0.46 2.09 12 31:A:216:PHE:O 1:A:220:LYS:HG2 0.46 2.11 11 31:B:207:VAL:O 1:B:211:GLU:HG3 0.46 2.10 12 31:B:216:PHE:O 1:B:220:LYS:HG2 0.46 2.11 11 2
1:A:208:GLU:HG3 1:A:209:ASP:N 0.45 2.27 19 11:B:208:GLU:HG3 1:B:209:ASP:N 0.45 2.27 19 11:A:192:GLU:O 1:A:195:GLU:HG2 0.44 2.12 15 11:B:241:ARG:HA 1:B:244:ASP:OD2 0.44 2.13 6 11:B:192:GLU:O 1:B:195:GLU:HG2 0.44 2.13 15 11:A:241:ARG:HA 1:A:244:ASP:OD2 0.43 2.14 6 11:A:208:GLU:O 1:A:212:LYS:HG2 0.43 2.13 18 11:A:228:CYS:HA 1:A:239:LEU:HG 0.43 1.90 4 41:B:208:GLU:O 1:B:212:LYS:HG2 0.43 2.13 18 11:B:216:PHE:O 1:B:220:LYS:HD3 0.43 2.14 14 11:A:216:PHE:O 1:A:220:LYS:HD3 0.43 2.14 14 1
1:A:224:ILE:HD11 1:A:242:ILE:HG22 0.43 1.90 16 21:B:228:CYS:HA 1:B:239:LEU:HG 0.42 1.91 13 31:A:221:LEU:HA 1:A:224:ILE:CG2 0.42 2.43 17 31:B:221:LEU:HA 1:B:224:ILE:CG2 0.42 2.43 17 31:B:224:ILE:HD11 1:B:242:ILE:HG22 0.42 1.90 16 21:A:204:LYS:O 1:A:207:VAL:HB 0.42 2.15 12 3
1:A:227:ILE:HG12 1:B:241:ARG:NH2 0.42 2.29 17 11:A:220:LYS:HG3 1:B:245:ILE:HG23 0.42 1.92 15 11:B:192:GLU:O 1:B:196:LEU:HD12 0.41 2.15 15 11:A:192:GLU:O 1:A:196:LEU:HD12 0.41 2.15 15 1
Continued on next page...

Page 17 Full wwPDB NMR Structure Validation Report 6EVQ
Continued from previous page...
Atom-1 Atom-2 Clash(Å) Distance(Å) ModelsWorst Total
1:B:204:LYS:O 1:B:207:VAL:HB 0.41 2.16 12 31:A:223:ASN:O 1:A:227:ILE:HG13 0.41 2.15 9 11:B:223:ASN:O 1:B:227:ILE:HG13 0.41 2.15 9 21:A:197:MET:SD 1:B:196:LEU:HD21 0.41 2.55 19 11:B:221:LEU:O 1:B:224:ILE:HG23 0.40 2.16 15 1
6.3 Torsion angles i○
6.3.1 Protein backbone i○
In the following table, the Percentiles column shows the percent Ramachandran outliers of the chainas a percentile score with respect to all PDB entries followed by that with respect to all NMRentries. The Analysed column shows the number of residues for which the backbone conformationwas analysed and the total number of residues.
Mol Chain Analysed Favoured Allowed Outliers Percentiles
1 A 58/70 (83%) 56±1 (97±1%) 2±1 (3±1%) 0±0 (0±0%) 100 100
1 B 58/70 (83%) 56±1 (97±1%) 2±1 (3±1%) 0±0 (0±0%) 100 100
All All 2320/2800 (83%) 2255 (97%) 65 (3%) 0 (0%) 100 100
There are no Ramachandran outliers.
6.3.2 Protein sidechains i○
In the following table, the Percentiles column shows the percent sidechain outliers of the chainas a percentile score with respect to all PDB entries followed by that with respect to all NMRentries. The Analysed column shows the number of residues for which the sidechain conformationwas analysed and the total number of residues.
Mol Chain Analysed Rotameric Outliers Percentiles
1 A 53/62 (85%) 49±2 (92±3%) 4±2 (8±3%) 18 64
1 B 53/62 (85%) 49±2 (92±3%) 4±2 (8±3%) 17 64
All All 2120/2480 (85%) 1951 (92%) 169 (8%) 17 64
All 35 unique residues with a non-rotameric sidechain are listed below. They are sorted by thefrequency of occurrence in the ensemble.

Page 18 Full wwPDB NMR Structure Validation Report 6EVQ
Mol Chain Res Type Models (Total)1 A 224 ILE 201 B 224 ILE 201 B 196 LEU 171 A 196 LEU 171 B 242 ILE 131 A 242 ILE 131 B 240 GLN 61 A 240 GLN 61 A 210 LEU 61 B 210 LEU 61 A 201 LYS 51 B 201 LYS 51 A 203 LEU 31 A 214 ARG 31 A 223 ASN 31 B 223 ASN 31 B 203 LEU 31 B 214 ARG 31 A 244 ASP 11 B 235 ASN 11 A 229 GLN 11 A 204 LYS 11 A 215 ASP 11 A 235 ASN 11 B 204 LYS 11 B 199 GLN 11 A 218 PHE 11 B 229 GLN 11 B 215 ASP 11 A 195 GLU 11 B 195 GLU 11 B 221 LEU 11 A 199 GLN 11 B 244 ASP 11 B 218 PHE 1
6.3.3 RNA i○
There are no RNA molecules in this entry.
Page 19 Full wwPDB NMR Structure Validation Report 6EVQ
6.4 Non-standard residues in protein, DNA, RNA chains i○
There are no non-standard protein/DNA/RNA residues in this entry.
6.5 Carbohydrates i○
There are no carbohydrates in this entry.
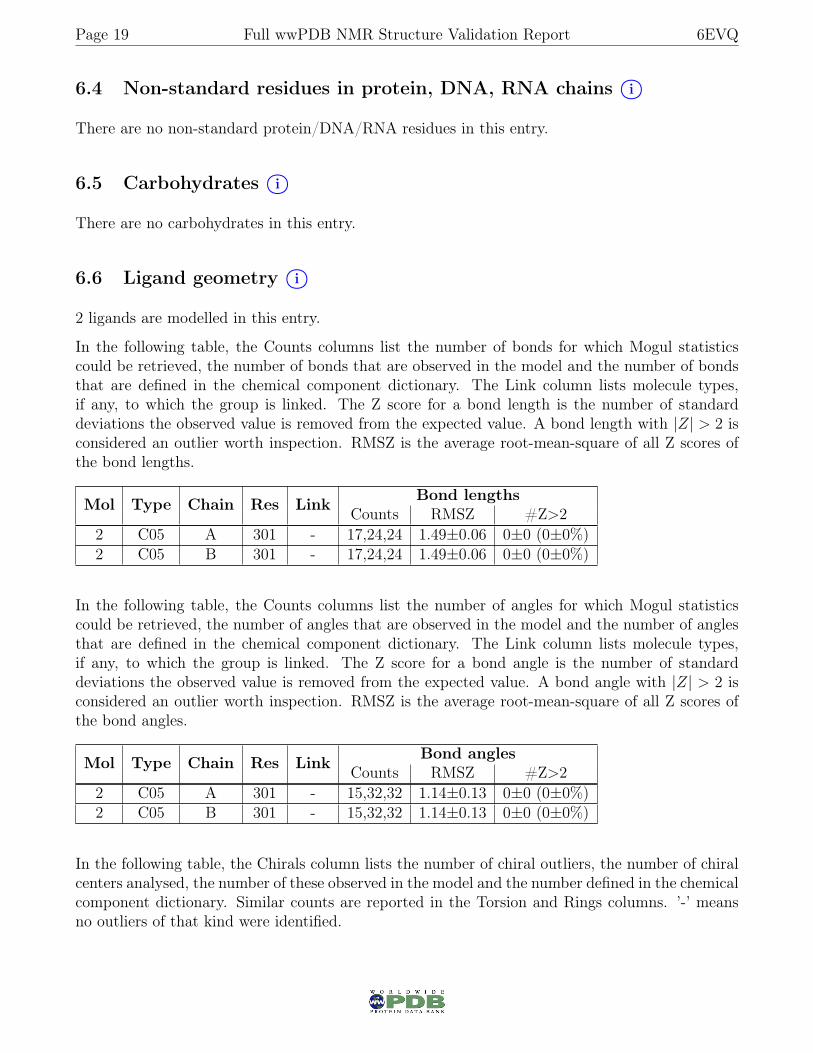
6.6 Ligand geometry i○
2 ligands are modelled in this entry.
In the following table, the Counts columns list the number of bonds for which Mogul statisticscould be retrieved, the number of bonds that are observed in the model and the number of bondsthat are defined in the chemical component dictionary. The Link column lists molecule types,if any, to which the group is linked. The Z score for a bond length is the number of standarddeviations the observed value is removed from the expected value. A bond length with |Z| > 2 isconsidered an outlier worth inspection. RMSZ is the average root-mean-square of all Z scores ofthe bond lengths.
Mol Type Chain Res Link Bond lengthsCounts RMSZ #Z>2
2 C05 A 301 - 17,24,24 1.49±0.06 0±0 (0±0%)2 C05 B 301 - 17,24,24 1.49±0.06 0±0 (0±0%)
In the following table, the Counts columns list the number of angles for which Mogul statisticscould be retrieved, the number of angles that are observed in the model and the number of anglesthat are defined in the chemical component dictionary. The Link column lists molecule types,if any, to which the group is linked. The Z score for a bond angle is the number of standarddeviations the observed value is removed from the expected value. A bond angle with |Z| > 2 isconsidered an outlier worth inspection. RMSZ is the average root-mean-square of all Z scores ofthe bond angles.
Mol Type Chain Res Link Bond anglesCounts RMSZ #Z>2
2 C05 A 301 - 15,32,32 1.14±0.13 0±0 (0±0%)2 C05 B 301 - 15,32,32 1.14±0.13 0±0 (0±0%)
In the following table, the Chirals column lists the number of chiral outliers, the number of chiralcenters analysed, the number of these observed in the model and the number defined in the chemicalcomponent dictionary. Similar counts are reported in the Torsion and Rings columns. ’-’ meansno outliers of that kind were identified.

Page 20 Full wwPDB NMR Structure Validation Report 6EVQ
Mol Type Chain Res Link Chirals Torsions Rings2 C05 A 301 - - 0±0,9,24,24 0±0,3,3,32 C05 B 301 - - 0±0,9,24,24 0±0,3,3,3
There are no bond-length outliers.
There are no bond-angle outliers.
There are no chirality outliers.
There are no torsion outliers.
There are no ring outliers.
6.7 Other polymers i○
There are no such molecules in this entry.
6.8 Polymer linkage issues i○
There are no chain breaks in this entry.
Page 21 Full wwPDB NMR Structure Validation Report 6EVQ
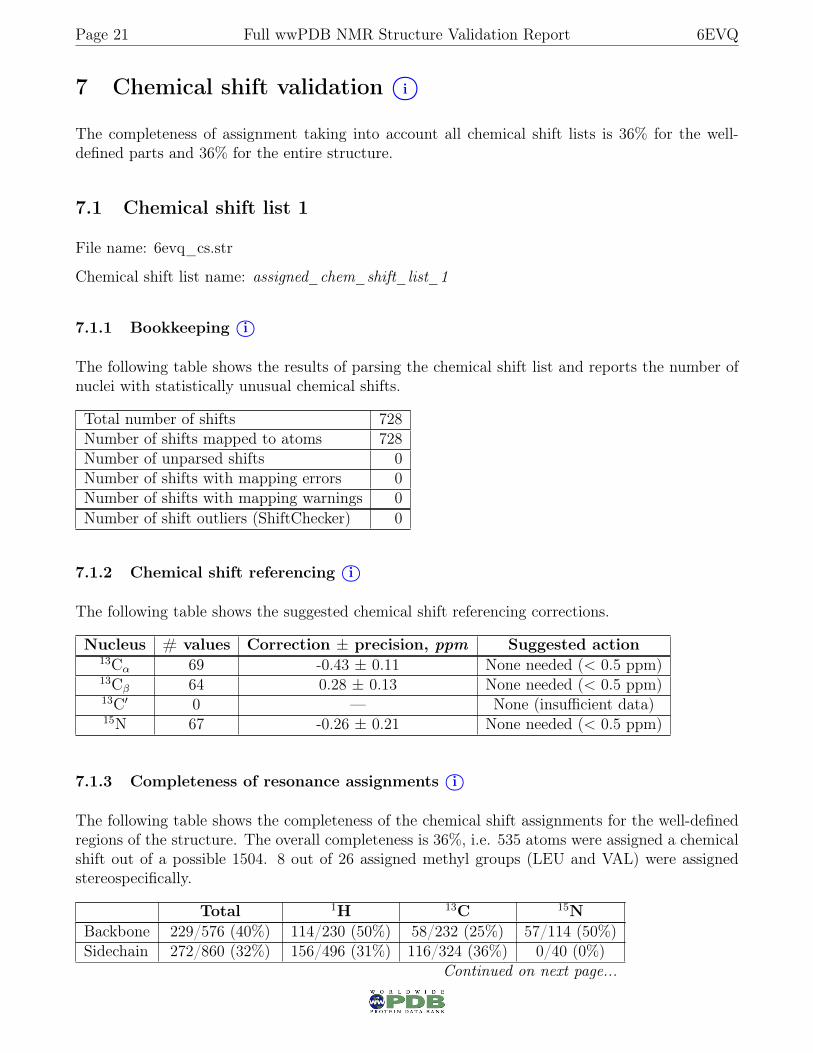
7 Chemical shift validation i○
The completeness of assignment taking into account all chemical shift lists is 36% for the well-defined parts and 36% for the entire structure.
7.1 Chemical shift list 1
File name: 6evq_cs.str
Chemical shift list name: assigned_chem_shift_list_1
7.1.1 Bookkeeping i○
The following table shows the results of parsing the chemical shift list and reports the number ofnuclei with statistically unusual chemical shifts.
Total number of shifts 728Number of shifts mapped to atoms 728Number of unparsed shifts 0Number of shifts with mapping errors 0Number of shifts with mapping warnings 0Number of shift outliers (ShiftChecker) 0
7.1.2 Chemical shift referencing i○
The following table shows the suggested chemical shift referencing corrections.
Nucleus # values Correction ± precision, ppm Suggested action13Cα 69 -0.43 ± 0.11 None needed (< 0.5 ppm)13Cβ 64 0.28 ± 0.13 None needed (< 0.5 ppm)13C′ 0 — None (insufficient data)15N 67 -0.26 ± 0.21 None needed (< 0.5 ppm)
7.1.3 Completeness of resonance assignments i○
The following table shows the completeness of the chemical shift assignments for the well-definedregions of the structure. The overall completeness is 36%, i.e. 535 atoms were assigned a chemicalshift out of a possible 1504. 8 out of 26 assigned methyl groups (LEU and VAL) were assignedstereospecifically.
Total 1H 13C 15NBackbone 229/576 (40%) 114/230 (50%) 58/232 (25%) 57/114 (50%)Sidechain 272/860 (32%) 156/496 (31%) 116/324 (36%) 0/40 (0%)
Continued on next page...

Page 22 Full wwPDB NMR Structure Validation Report 6EVQ
Continued from previous page...Total 1H 13C 15N
Aromatic 34/68 (50%) 18/36 (50%) 16/32 (50%) 0/0 (—%)Overall 535/1504 (36%) 288/762 (38%) 190/588 (32%) 57/154 (37%)
The following table shows the completeness of the chemical shift assignments for the full structure.The overall completeness is 36%, i.e. 631 atoms were assigned a chemical shift out of a possible1744. 9 out of 28 assigned methyl groups (LEU and VAL) were assigned stereospecifically.
Total 1H 13C 15NBackbone 269/692 (39%) 133/276 (48%) 69/280 (25%) 67/136 (49%)Sidechain 319/966 (33%) 185/556 (33%) 134/370 (36%) 0/40 (0%)Aromatic 43/86 (50%) 23/46 (50%) 20/40 (50%) 0/0 (—%)Overall 631/1744 (36%) 341/878 (39%) 223/690 (32%) 67/176 (38%)
7.1.4 Statistically unusual chemical shifts i○
There are no statistically unusual chemical shifts.
7.1.5 Random Coil Index (RCI) plots i○
The image below reports random coil index values for the protein chains in the structure. Theheight of each bar gives a probability of a given residue to be disordered, as predicted fromthe available chemical shifts and the amino acid sequence. A value above 0.2 is an indicationof significant predicted disorder. The colour of the bar shows whether the residue is in the well-defined core (black) or in the ill-defined residue ranges (cyan), as described in section 2 on ensemblecomposition.
Random coil index (RCI) for chain A:
7.2 Chemical shift list 2
File name: 6evq_cs.str

Page 23 Full wwPDB NMR Structure Validation Report 6EVQ
Chemical shift list name: assigned_chem_shift_list_1_2
7.2.1 Bookkeeping i○
The following table shows the results of parsing the chemical shift list and reports the number ofnuclei with statistically unusual chemical shifts.
Total number of shifts 728Number of shifts mapped to atoms 728Number of unparsed shifts 0Number of shifts with mapping errors 0Number of shifts with mapping warnings 0Number of shift outliers (ShiftChecker) 0
7.2.2 Chemical shift referencing i○
The following table shows the suggested chemical shift referencing corrections.
Nucleus # values Correction ± precision, ppm Suggested action13Cα 69 -0.43 ± 0.09 None needed (< 0.5 ppm)13Cβ 64 0.29 ± 0.09 None needed (< 0.5 ppm)13C′ 0 — None (insufficient data)15N 67 -0.26 ± 0.23 None needed (< 0.5 ppm)
7.2.3 Completeness of resonance assignments i○
The following table shows the completeness of the chemical shift assignments for the well-definedregions of the structure. The overall completeness is 36%, i.e. 535 atoms were assigned a chemicalshift out of a possible 1504. 8 out of 26 assigned methyl groups (LEU and VAL) were assignedstereospecifically.
Total 1H 13C 15NBackbone 229/576 (40%) 114/230 (50%) 58/232 (25%) 57/114 (50%)Sidechain 272/860 (32%) 156/496 (31%) 116/324 (36%) 0/40 (0%)Aromatic 34/68 (50%) 18/36 (50%) 16/32 (50%) 0/0 (—%)Overall 535/1504 (36%) 288/762 (38%) 190/588 (32%) 57/154 (37%)
The following table shows the completeness of the chemical shift assignments for the full structure.The overall completeness is 36%, i.e. 631 atoms were assigned a chemical shift out of a possible1744. 9 out of 28 assigned methyl groups (LEU and VAL) were assigned stereospecifically.
Total 1H 13C 15NBackbone 269/692 (39%) 133/276 (48%) 69/280 (25%) 67/136 (49%)
Continued on next page...

Page 24 Full wwPDB NMR Structure Validation Report 6EVQ
Continued from previous page...Total 1H 13C 15N
Sidechain 319/966 (33%) 185/556 (33%) 134/370 (36%) 0/40 (0%)Aromatic 43/86 (50%) 23/46 (50%) 20/40 (50%) 0/0 (—%)Overall 631/1744 (36%) 341/878 (39%) 223/690 (32%) 67/176 (38%)
7.2.4 Statistically unusual chemical shifts i○
There are no statistically unusual chemical shifts.
7.2.5 Random Coil Index (RCI) plots i○
The image below reports random coil index values for the protein chains in the structure. Theheight of each bar gives a probability of a given residue to be disordered, as predicted fromthe available chemical shifts and the amino acid sequence. A value above 0.2 is an indicationof significant predicted disorder. The colour of the bar shows whether the residue is in the well-defined core (black) or in the ill-defined residue ranges (cyan), as described in section 2 on ensemblecomposition.
Random coil index (RCI) for chain A: