Embed Size (px)
DESCRIPTION
Full Waveform Acoustic fws Logging Applications
Citation preview
Seismic Methods in
Mineral Exploration
GOT
Author Index
Section Contents
Explor97 Master Page
Explor97 Contents
OPrevious PaperPaper 61
Full Waveform Acoustic Logging Applications
in Mineral Exploration and Mining
Pflug, K.A.[1], Mwenifumbo, C.J.[1]., and Killeen, P.G.[1]
1. Geological Survey of Canada, Mineral Resources Division, Ottawa, Ontario, Canada
INTRODUCTION
Since 1993, the Geological Survey of Canada (GSC) has acquired fullwaveform acoustic logs to demonstrate applications of acoustic loggingto mining and mineral exploration. Boreholes logged were from miningareas across Canada, including Sudbury, Timmins, Val d’Or, Matagami,Chibougamau, Bathurst and Myra Falls. Full waveform acoustic probesrecord the complete acoustic signal from a transmitter on the probe attwo (or more) receivers located at different distances from the transmit-ter. By recording the full acoustic waveform, logs of the velocities andamplitudes of different arrivals (e.g., P-wave, S-wave, tube wave) can beextracted from the data. The complete waveform from a single receivercan also be displayed as a variable density log. Four examples show howthese data can be used in lithologic mapping, ore delineation, detectionand characterization of permeable zones and the interpretation of seis-mic reflection and tomography surveys.
LITHOLOGIC MAPPING:THE CORNER BAY DEPOSIT
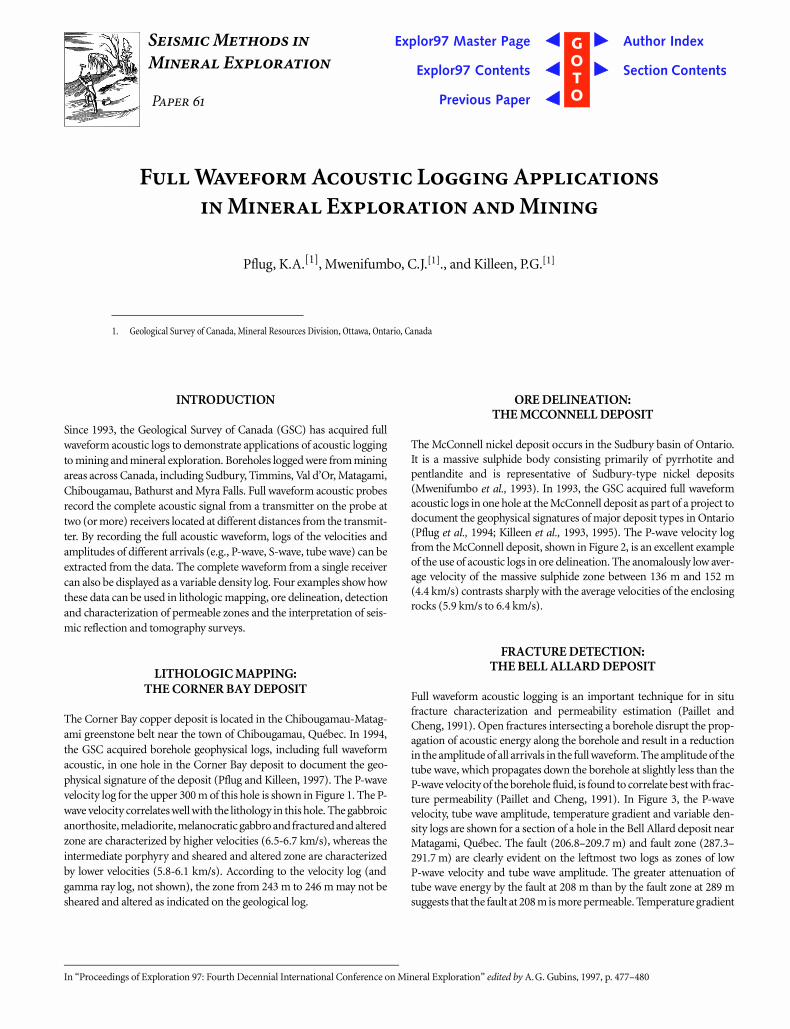
The Corner Bay copper deposit is located in the Chibougamau-Matag-ami greenstone belt near the town of Chibougamau, Québec. In 1994,the GSC acquired borehole geophysical logs, including full waveformacoustic, in one hole in the Corner Bay deposit to document the geo-physical signature of the deposit (Pflug and Killeen, 1997). The P-wavevelocity log for the upper 300 m of this hole is shown in Figure 1. The P-wave velocity correlates well with the lithology in this hole. The gabbroicanorthosite, meladiorite, melanocratic gabbro and fractured and alteredzone are characterized by higher velocities (6.5-6.7 km/s), whereas theintermediate porphyry and sheared and altered zone are characterizedby lower velocities (5.8-6.1 km/s). According to the velocity log (andgamma ray log, not shown), the zone from 243 m to 246 m may not besheared and altered as indicated on the geological log.
ORE DELINEATION:THE MCCONNELL DEPOSIT
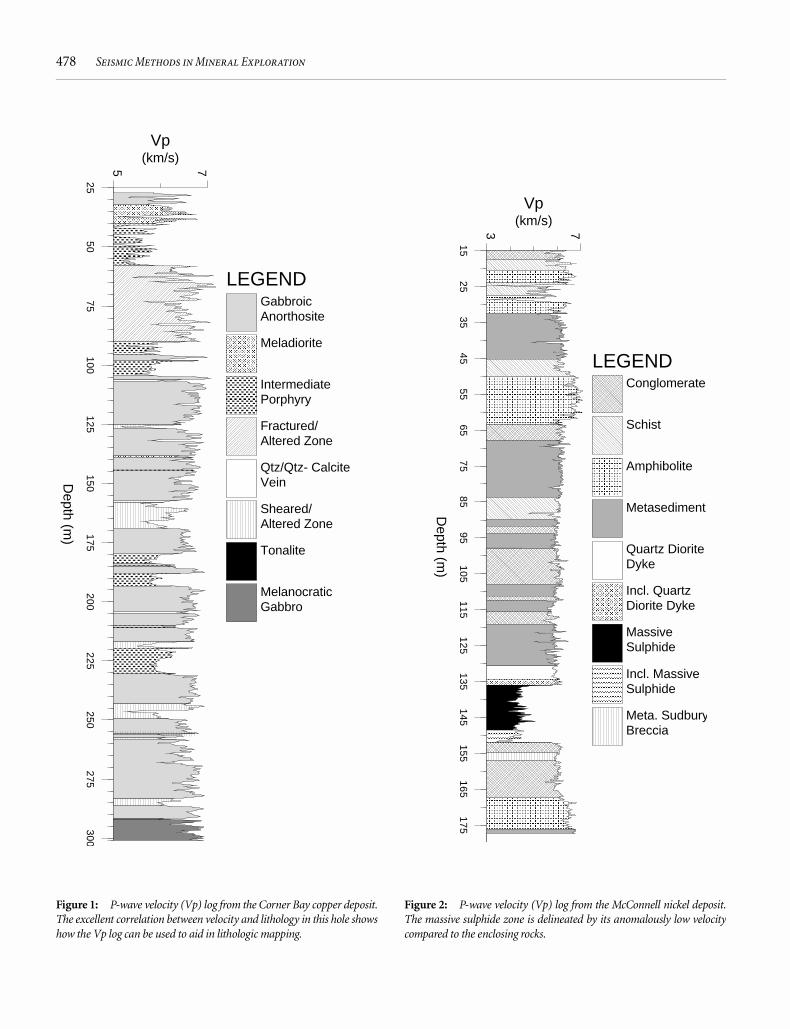
The McConnell nickel deposit occurs in the Sudbury basin of Ontario.It is a massive sulphide body consisting primarily of pyrrhotite andpentlandite and is representative of Sudbury-type nickel deposits(Mwenifumbo et al., 1993). In 1993, the GSC acquired full waveformacoustic logs in one hole at the McConnell deposit as part of a project todocument the geophysical signatures of major deposit types in Ontario(Pflug et al., 1994; Killeen et al., 1993, 1995). The P-wave velocity logfrom the McConnell deposit, shown in Figure 2, is an excellent exampleof the use of acoustic logs in ore delineation. The anomalously low aver-age velocity of the massive sulphide zone between 136 m and 152 m(4.4 km/s) contrasts sharply with the average velocities of the enclosingrocks (5.9 km/s to 6.4 km/s).
FRACTURE DETECTION:THE BELL ALLARD DEPOSIT
Full waveform acoustic logging is an important technique for in situfracture characterization and permeability estimation (Paillet andCheng, 1991). Open fractures intersecting a borehole disrupt the prop-agation of acoustic energy along the borehole and result in a reductionin the amplitude of all arrivals in the full waveform. The amplitude of thetube wave, which propagates down the borehole at slightly less than theP-wave velocity of the borehole fluid, is found to correlate best with frac-ture permeability (Paillet and Cheng, 1991). In Figure 3, the P-wavevelocity, tube wave amplitude, temperature gradient and variable den-sity logs are shown for a section of a hole in the Bell Allard deposit nearMatagami, Québec. The fault (206.8–209.7 m) and fault zone (287.3–291.7 m) are clearly evident on the leftmost two logs as zones of lowP-wave velocity and tube wave amplitude. The greater attenuation oftube wave energy by the fault at 208 m than by the fault zone at 289 msuggests that the fault at 208 m is more permeable. Temperature gradient
In “Proceedings of Exploration 97: Fourth Decennial International Conference on Mineral Exploration” edited by A.G. Gubins, 1997, p. 477–480
478 Seismic Methods in Mineral Exploration
1525
3545
5565
7585
95105
115125
135145
155165
175
Depth (m
)
AAAAAAAAAAAA
AAAAAAAAAAAA
AAAAAAAAAAAA
AAAAAAAAAAAA
AAAAAA
AAAAAAAAAAAAAAAA
AAAAAAAAAAAAAAAA
AAAAAAAAAAAAAAAA
AAAAAAAAAAAAAAAA
AAAA
AAAAAAAAAAAAAAAAAAAAAAAAAAAAAAAAAAAAAAAA
AAAAAAAAAAAAAAAAAAAAAAAAAAAAAAAAAAAAAAAA
AAAAAAAAAAAAAAAAAAAAAAAAAAAAAAAAAAAAAAAA
AAAAAAAAAAAAAAAAAAAAAAAAAAAAAAAAAAAAAAAA
AAAAAAAAAAAAAAAAAAAAAAAAAAAAAA
AAAAAAAA
AAAAAAAA
AAAAAAAA
AAAAAAAA
AAAAAAAAAAAA
AAAAAAAAAAAA
AAAAAAAAAAAA
AAA
AAAAAAAAAAAAAAAAAAAAAAAAAAAA
AAAAAAAAAAAAAAAAAAAAAAAAAAAA
AAAAAAAAAAAAAAAAAAAAAAAAAAAA
AAAAAAAAAAAAAAAAAAAAAAAAAAAA
AAAAAAAAAAAAAA
73
(km/s)Vp
LEGENDConglomerate
Schist
AAAAAAAAAAAAAAAAAAAAAAAAAAAAAAAA
AAAAAAAAAAAAAAAAAAAAAAAA
Amphibolite
Metasediment
Quartz Diorite Dyke
AAAAAAAAAAAAAAAAAAAAAAAAAAAAAAAA
AAAAAAAAAAAAAAAAAAAAAAAA
Incl. Quartz Diorite Dyke
Massive Sulphide
AAAAAAAAAAAAAAAAAAAAAAAAAAAAAAAAAAAA
AAAAAAAAAAAAAAAAAAAAAAAAAAA
Incl. Massive Sulphide
Meta. SudburyBreccia
2550
75100
125150
175200
225250
275300
Depth (m
)
AAAAAAAAAAAAAAAAAAAA
AAAAAAAAAAAAAAAAAAAA
AAAAAAAAAAAAAAAAAAAA
AAAAAAAAAAAAAAAAAAAA
AAAAA
AAAAAAAAAAAAAAAAAAAAAAAAAAAAAAAAAAAA
AAAAAAAAAAAAAAAAAAAAAAAAAAAAAAAAAAAA
AAAAAAAAAAAAAAAAAAAAAAAAAAAAAAAAAAAA
AAAAAAAAAAAAAAAA
AAAAAAAAAAAAAAAA
AAAAAAAAAAAAAAAA
AAAAAAAAAAAA
AAAAAAAAAAAAAAAA
AAAAAAAAAAAAAAAA
AAAAAAAAAAAAAAAA
AAAAAAAAAAAAAAAA
AAAA
AAAAAAAAAAAAAAAA
AAAAAAAAAAAAAAAA
AAAAAAAA
AAAAAAAA
AAAAAAAA
AA
AAAAAAAAAAAA
AAAAAAAAAAAA
AAAAAAAAAAAA
AAA
AAAAAAAAAAAA
AAAAAAAAAAAAAAAA
AAAAAAAAAAAAAAAA
AAAAAAAAAAAAAAAA
AAAAAAAA
AAAAAAAAAAAAAAAAAAAAAAAAAA
AAAAAAAAAAAAAAAAAAAAAAAA
AAAAAAAAAAAAAAAAAAAAAAAA
AAAAAAAAAAAAAAAAAAAAAAAA
AAAAAAAAAAAAAAAAAA
75
(km/s)Vp
LEGENDGabbroic Anorthosite
AAAAAAAAAAAAAAAAAAAAAAAAAAAAAAAA
AAAAAAAAAAAAAAAAAAAAAAAA
Meladiorite
AAAAAAAAAAAAAAAAAAAAAAAAAAAAAAAA
AAAAAAAAAAAAAAAAAAAAAAAA
Intermediate Porphyry
Fractured/ Altered Zone
Qtz/Qtz- Calcite Vein
Sheared/ Altered Zone
Tonalite
Melanocratic Gabbro
Figure 1: P-wave velocity (Vp) log from the Corner Bay copper deposit.The excellent correlation between velocity and lithology in this hole showshow the Vp log can be used to aid in lithologic mapping.
Figure 2: P-wave velocity (Vp) log from the McConnell nickel deposit.The massive sulphide zone is delineated by its anomalously low velocitycompared to the enclosing rocks.

Pflug, K.A. FULL WAVEFORM ACOUSTIC LOGGING APPLICATIONS 479
Tube WaveAmplitude
P S
200300
Depth (m
)
fault
fault zone
fracture zone
75
(km/s)Vp
100
0
Tube WaveAmplitude
200
(mK/m)TG
1120
100
Time (micro-sec)VDL
50150
250350
450550
650750
Depth (m
)
AAAAA
AAAAAAAAAAAAAAAAAAAAAAAAAAAAAAAAAAAAAAAAAAAAAAAAAAAAAAAAAAAAAAAAAAAAAAAAAAAAAAAAAAAAAAAAAAAAAAAAAAAAAAAAAAAAAAAAAAAAAAAAAAAAAAAAAAAAAAAAAAAAAAAAAAAAAAAAAAAAAAAAAAAAAAAAAAAAAAAAAAAAAAAAAAAAAAAAAAAAAAAAAAAAAAAAAAAAAAAAAAAAAAAAAAAAAAAAAAAAAAAAAAAAAAAAAAAAAAAAAAAAAAAAAAAAAAAAAAAAAAAAAAAAAAAAAAAAAAAAAAAAAAAAAAAAAAAAAAAAAAAAAAAAAAAAAAAAAAAAAAAAAAAAAAAAAAAAAAAAAAAAAAAAAAAAAAAAAAAAAAAAAAAAAAAAAAAAAAAAAAAAAAAAAAAAAAAAAAAAAAAAAAAAAAAAAAAAAAAAAAAAAAAAAAAAAAAAAAAAAAAAAAAAAAAAAAAAAAAAAAAAAAAAAAAAAAAAAAAAAAAAAAAAAAAAAAAAAAAAAAAAAAAAAAAAAAAAAAAAAAAAAAAAAAAAAAAAAAAAAAAAAAAAAAAAAAAAAAAAAAAAA
AAAAAAAAAAAAAAAA
AAAAAAAAAAAA
AAAAA
3.5
2.5 3
(g/cm³)Density
AAAAAA
AAAAAAAAAAAAAAAAAAAAAAAAAAAAAAAAAAAAAAAAAAAAAAAAAAAAAAAAAA
AAAA
AAAAAAAAAAAAAAAAAAAAAAAAAAAAAAAAAAAAAAAAAAAAAAAAAAAAAAAAAAAAAAAAAAAAAAAAAAAAAAAAAAAAAAAAAAAAAAAAAAA
AAAA
AAAAAAAAAAAAAAAAAAAAAAAAAAAAAAAAAAAAAAAAAAAAAAAAAAAAAAAAAAAAAAAAAAAAAAAAAAAAAAAAAAAAAAAAAAAAAAAAAAAAAA
AAAA
AAAAAAAAAAAAAAAAAAAAAAAAAAAAAAAAAAAAAAAAAAAAAAAAAAAAAAAAAAAAAAAAAAAAAAAAAAAAAAAAAAAAAAAAAAAAAAAAAAAAAAAAAA
AAAAAA
AAAAAAAAAAAAAAAAAAAAAAAAAAAAAAAAAAAAAAAAAAAAAAAAAAAAAAAAAAAAAAAAAAAAAAAAAAAAAAAAAAAAAAAAAAAAAAAAAAAAAAA
AAAA
AAAAAAAAAAAAAAAAAAAAAAAAAAAAAAAAAAAAAAAAAAAAAAAAAAAAAAAAAAAAAAAAAAAAAAAAAAAAAAAAAAAAAAAAAAAAAAAAAAAAAAAAAAAAAA
AAAAAA
AAAAAAAAAAAAAAAAAAAAAAAAAAAAAAAAAAAAAAAAAAAAAAAAAAAAAAAAAAAAAAAAAAAAAAAAAAAAAAAAAAAAAAAAAAAAAAAAAA
AAAA
AAAAAAAAAAAAAAAAAAAAAAAAAAAAAAAAAAAAAAAAAAAAAAAAAAAAAAAAAAAAAAAAAAAAAAAAAAAAAAAAAAAAAAAAAAAAAAAAA
AAAA
AAAAAAAAAAAAAAAAAAAAAAAAAAAAAAAAAAAAAAAAAAAAAAAAAAAAAAAAAAAAAAAAAAAAAAAAAAAAAAAAAAAAAAAAA
AAAAAA
AAAAAAA
AAAAAAAAAAAAAAAAAAAAAAAAAAAAAAAAAAAAAAAAAAAAAAAAAAAAAAAAAAAAAAAAAAAAAAAAAAAAAAAAAAAAAAAAAAAAAAAAAAAAAAAAAAAAAAAAAAAAAAAAAAAAAAAAAAAAAAAAAAAAAAAAAAAAAA
AAAAAAAA
AAAAAA
AAAAAAAAAAAAAAAAAAAAAAAAAAAAAAAAAAAAAAAAAAAAAAAAAAAAAAAAAAAAAAAAAAAAAAAAAAAAAAAAAAAAAAAAAAAAAAAAAAAAAAAAAAAAAAAAAAAAAAAAAAAAAAAAAAAAAAAAAAAAAAAAAAAAAAAAAAAAAAAAAAAAAAAAAAAAAAAAAA
AAAAAAAA
AAAAAA
AAAAAAAAAAAAAAAAAAAAAAAAAAAAAAAAAAAAAAAAAAAAAAAAAAAAAAAAAAAAAAAAAAAAAAAAAAAAAAAAAAAAAAAAAAAAAAAAAAAAAAAAAAAAAAAAAAAAAAAAAAAAAAAAAAAAAAAAAAAAAAAAAAAAAAAAAAAAAAAAAAAAAAAAAAA
AAAAAAAA
AAAAAA
AAAAAAAAAAAAAAAAAAAAAAAAAAAAAAAAAAAAAAAAAAAAAAAAAA
AAAAAAAAA
7.5
4.5 6
(km/s)Vp
AAAAAA
AAAAAAAAAAAAAAAAAAAAAAAAAAAAAAAAAAAAAAAAAAAAAAAAAAAAA
AA
AAAAAAAAAAAAAAAAAAAAAAAAAAAAAAAAAAAAAAAAAAAAAAAAAAAAAAAAAAAAAAAAAAAAAAAAAAAAAAAAAAAAAAAA
AA
AAAAAAAAAAAAAAAAAAAAAAAAAAAAAAAAAAAAAAAAAAAAAAAAAAAAAAAAAAAAAAAAAAAAAAAAAAAAAAAAAAAAAAAAA
AAAA
AAAAAAAAAAAAAAAAAAAAAAAAAAAAAAAAAAAAAAAAAAAAAAAAAAAAAAAAAAAAAAAAAAAAAAAAAAAAAAAAAAAAAAAAAAAAAA
AAAA
AAAAAAAAAAAAAAAAAAAAAAAAAAAAAAAAAAAAAAAAAAAAAAAAAAAAAAAAAAAAAAAAAAAAAAAAAAAAAAAAAAAAAAAAAA
AAAA
AAAAAAAAAAAAAAAAAAAAAAAAAAAAAAAAAAAAAAAAAAAAAAAAAAAAAAAAAAAAAAAAAAAAAAAAAAAAAAAAAAAAAAAAAAAAAAAAAAAAAAAAAA
AAAA
AAAAAAAAAAAAAAAAAAAAAAAAAAAAAAAAAAAAAAAAAAAAAAAAAAAAAAAAAAAAAAAAAAAAAAAAAAAAAAAAAAAAAAA
AA
AAAAAAAAAAAAAAAAAAAAAAAAAAAAAAAAAAAAAAAAAAAAAAAAAAAAAAAAAAAAAAAAAAAAAAAAAAAAAAAAAAAAA
AA
AAAAAAAAAAAAAAAAAAAAAAAAAAAAAAAAAAAAAAAAAAAAAAAAAAAAAAAAAAAAAAAAAAAAAAAAAAAAAAA
AAAA
AAAAAA
AAAAAAAAAAAAAAAA
AAAAAAAAAAAAAAAA
AAAAAAAAAAAAAAAA
AAAAAAAAA
2212 17
(km/s g/cm³)Impedance
LEGEND
AAAAAAAAAAAAAAAAAAAA
AAAAAAAAAAAAAAA
Gabbro
Basalt
Rhyolite Lapilli Tuff
AAAAAAAAAAAAAAAAAAAA
AAAAAAAAAAAAAAA
Quartz-Feldspar Porphyry
Graphitic Argillite/ Talc/Basalt
Semi-Massive to Massive Pyrite
Talc-Carb Rock
AAAAAAAAAAAAAAAAAAAA
AAAAAAAAAAAAAAA
Basaltic Komatiite/Mafic Dyke
Figure 4: Density, P-wave velocity (Vp) and acoustic impedance logs from the Kidd Creek copper-zinc mine. Acoustic impedance contrasts associatedwith changes in lithology indicate contacts that would cause seismic reflections. The pyrite-rich zone (505–515 m) would be visible using seismic reflectionmethods. (Note: The density in the pyrite-rich zone is slightly underestimated by the density log.)
Figure 3: P-wave velocity (Vp), tube wave amplitude, temperature gradient (TG) and variable density (VDL) logs from the Bell Allard zinc-copperdeposit. The VDL is a method of displaying the full acoustic waveform at a single receiver with different wave amplitudes represented by different shadesof gray. The approximate start of the P- and S-waves are indicated on the VDL. The tube wave amplitude is the root-mean-square of the waveform ampli-tude in the window indicated on the VDL. The fault and fault zone are evident on all four logs.

480 Seismic Methods in Mineral Exploration
anomalies associated with the fault and fault zone suggest water flow toor from the borehole at these depths, which further confirms that theseare permeable zones. The fracture zone from 296.9 m to 303.6 m appearsto be less permeable than the faults based on the tube wave amplitudeand variable density logs. The geological log indicates that this zone con-tains quartz- and calcite-filled fractures and small faults, thus reducingits permeability.
INTERPRETATION OF SEISMIC REFLECTIONAND TOMOGRAPHIC SURVEYS
Recent research (Salisbury et al., 1996; Milkereit et al., 1996; Eaton et al.,1996) has shown that seismic reflection techniques can be used to imagemassive sulphide mineral deposits. Interpretation of seismic reflectiondata requires a knowledge of the acoustic impedances (density × veloc-ity) of the rocks, which can be obtained, in situ, from density and acous-tic velocity logs. Seismic reflections occur when there is a change inacoustic impedance. In 1993, the GSC recorded density and P-wavevelocity logs (Figure 4) in a hole near the Kidd Creek mine, Timmins,Ontario, as part of a project to document the geophysical signatures ofmajor deposit types in Ontario (Killeen et al., 1993). Impedance con-trasts associated with changes in lithology can be seen on the acousticimpedance log (Figure 4) at several depths. In particular, the semi-mas-sive to massive pyrite between 505 m and 515 m has a higher impedancethan the rocks above and below it, which should make it visible with seis-mic techniques. The data shown in Figure 4 have been used by Eatonet al. (1996) to interpret vertical seismic profile data acquired in theKidd Creek mine area.
Acoustic velocity logs have also been used to help interpret seismictomography data. In 1994, the GSC acquired velocity logs in three holesat the Louvicourt mine, near Val d’Or, Québec, for Noranda TechnologyCentre (NTC). The P-wave velocity data were found to correlate withiron and pyrite content and this information was used to help interpretcross-hole seismic data acquired at the mine by NTC (McCreary andWänstedt, 1995).
ACKNOWLEDGEMENTS
The authors would like to thank the mining companies MSV ResourcesInc., Inco Ltd., Noranda Mining and Exploration Inc., Falconbridge Ltd.and Aur Louvicourt Inc. for permitting access to their holes, for provid-ing geological logs for correlation with the geophysical data and for per-mission to publish the results.
REFERENCES
Eaton, D., Guest, S., Milkereit, B., Bleeker, W., Crick, D., Schmitt, D. and Salis-bury, M., 1996, Seismic imaging of massive sulfide deposits: part III. Boreholeseismic imaging of near-vertical structures: Economic Geology, 91, 835-840.
Killeen, P.G., Elliott, B.E. and Mwenifumbo, C.J., 1993, Ore deposit signaturesand borehole geophysics test sites in Ontario: Proceedings of the 5th Interna-tional Symposium on Geophysics for Minerals, Geotechnical and Environ-mental Applications, paper G.
Killeen, P.G., Mwenifumbo, C.J. and Elliott, B.E., 1995, Mineral deposit signa-tures by borehole geophysics: Data from the borehole geophysics test site atthe McConnell nickel deposit (Garson Offset), Ontario, Geol. Survey of Can-ada, Open File 2811.
McCreary, R.G. and Wänstedt, S., 1995, Applications of multivariate statisticsand pattern recognition to geophysical logging at Noranda: Proceedings ofthe 6th International Symposium on Borehole Geophysics for Minerals, Geo-technical and Groundwater Applications, paper G.
Milkereit, B., Eaton, D., Wu, J., Perron, G., Salisbury, M., Berrer, E.K. and Morri-son, G., 1996, Seismic imaging of massive sulfide deposits: part II. Reflectionseismic profiling: Economic Geology, 91, 829-834.
Mwenifumbo, C.J., Killeen, P.G., Elliott, B.E. and Pflug, K.A.,1993, The boreholegeophysical signature of the McConnell nickel deposit, Sudbury area: Pro-ceedings of the 5th International Symposium on Geophysics for Minerals,Geotechnical and Environmental Applications, paper I.
Paillet, F.L. and Cheng, C.H., 1991, Acoustic Waves in Boreholes: CRC Press Inc.
Pflug, K.A., Killeen, P.G. and Mwenifumbo, C.J., 1994, Acoustic velocity loggingat the McConnell nickel deposit, Sudbury area, Ontario: preliminary in situmeasurements: Current Research 1994-C, Geol. Survey of Canada, 279-286.
Pflug, K.A. and Killeen, P.G., 1997, Borehole geophysical logs at the Corner Baycopper deposit, Chibougamau area, Québec: Geol. Survey of Canada, OpenFile 3388.
Salisbury, M., Milkereit, B. and Bleeker, W., 1996, Seismic imaging of massive sul-fide deposits: part I. Rock properties: Economic Geology, 91, 821-828.