Embed Size (px)
Citation preview

Full-Scale Up-Flo® Filter Field Verification Tests
Yezhao Cai1, Robert Pitt2, Noboru Togawa3, Kevin McGee4, Kwabena Osei5, and Robert Andoh6
1 MSCE Candidate, Department of Civil, Construction, and Environmental Engineering. The University of Alabama, Tuscaloosa, AL 35487-0205, USA; E-mail: [email protected] 2 Cudworth Professor, Department of Civil, Construction, and Environmental Engineering. The University of Alabama, Tuscaloosa, AL 35487-0205, USA; E-mail: [email protected] 3 Initial monitoring performed as part of Dr. Togawa’s Ph.D. research while at the University of Alabama. 4,5,6 Hydro International, 94 Hutchins Drive, Portland, ME 04102, USA; E-mails: [email protected], [email protected], [email protected] 46th Annual Stormwater and Urban Water Systems Modeling Conference
Toronto, Ontario, February 21-22, 2013

Presenter Introduction • Name: Yezhao Cai
• Present Affiliation: Department of
Civil, Construction and Environmental Engineering, The University of Alabama, Tuscaloosa, AL, USA.
• Education: 1) Bachelor of Engineering in
Environmental Engineering, July 2010. Zhongkai University of Agriculture and Engineering, Guangzhou, China.
2) Master of Science in Environmental Engineering, August 2013. The University of Alabama, Tuscaloosa, AL, USA.
• Current Position: Graduate Research Assistant under Dr. Robert E. Pitt, from January, 2012 to present, The University of Alabama, Tuscaloosa, AL, USA
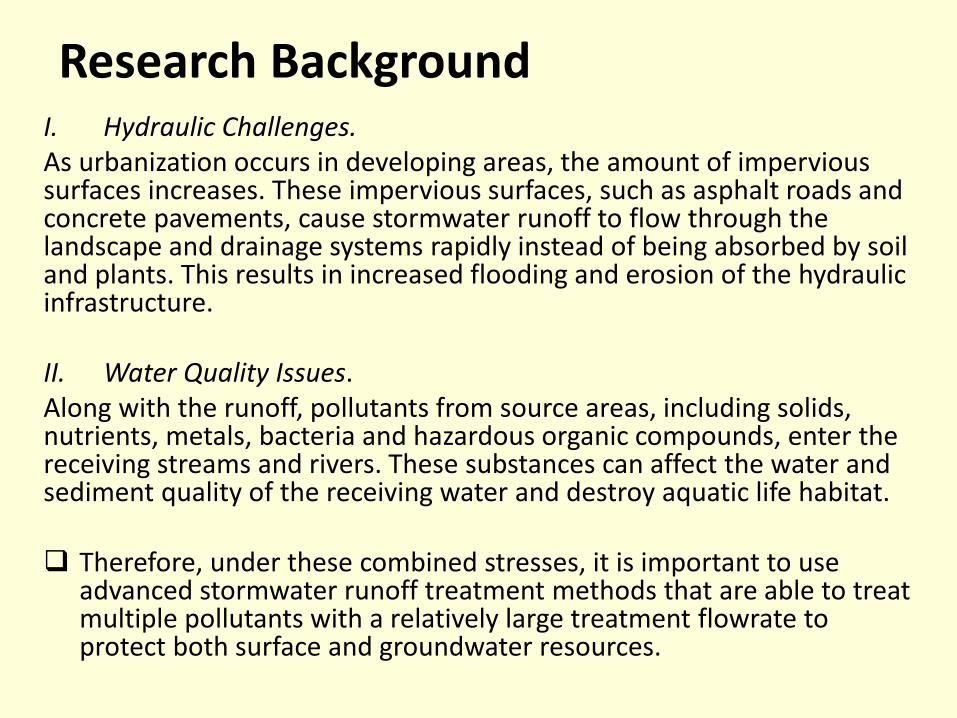
Research Background I. Hydraulic Challenges. As urbanization occurs in developing areas, the amount of impervious surfaces increases. These impervious surfaces, such as asphalt roads and concrete pavements, cause stormwater runoff to flow through the landscape and drainage systems rapidly instead of being absorbed by soil and plants. This results in increased flooding and erosion of the hydraulic infrastructure.
II. Water Quality Issues. Along with the runoff, pollutants from source areas, including solids, nutrients, metals, bacteria and hazardous organic compounds, enter the receiving streams and rivers. These substances can affect the water and sediment quality of the receiving water and destroy aquatic life habitat.
Therefore, under these combined stresses, it is important to use
advanced stormwater runoff treatment methods that are able to treat multiple pollutants with a relatively large treatment flowrate to protect both surface and groundwater resources.
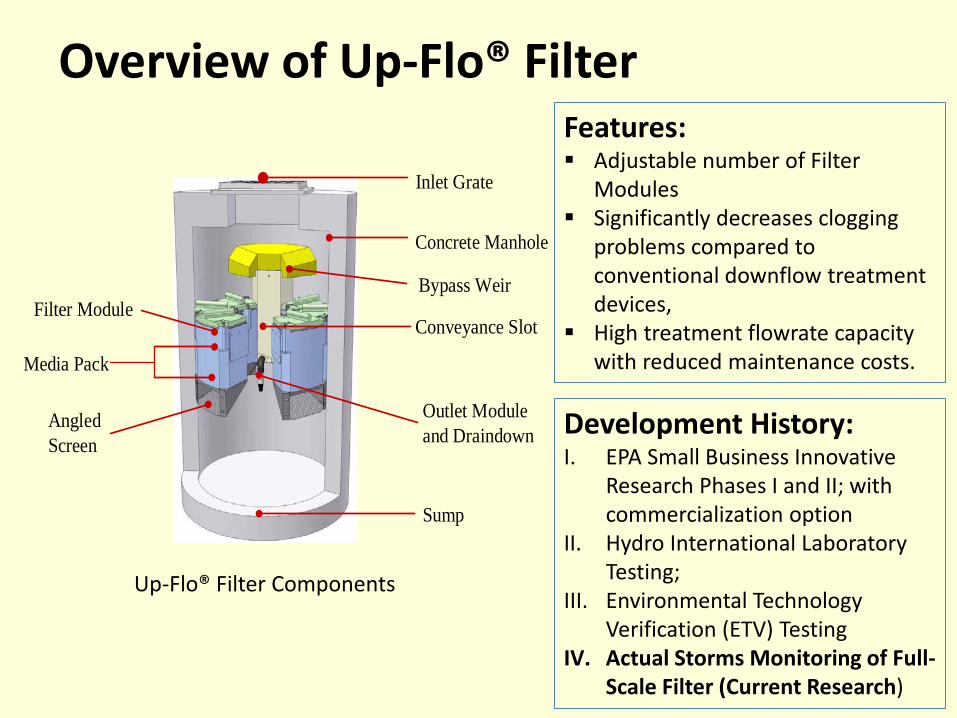
Overview of Up-Flo® Filter
Filter Module
Inlet Grate
Concrete Manhole
Bypass Weir
Outlet Module and Draindown
Angled Screen
Sump
Media Pack
Conveyance Slot
Up-Flo® Filter Components
Features: Adjustable number of Filter
Modules Significantly decreases clogging
problems compared to conventional downflow treatment devices,
High treatment flowrate capacity with reduced maintenance costs.
Development History: I. EPA Small Business Innovative
Research Phases I and II; with commercialization option
II. Hydro International Laboratory Testing;
III. Environmental Technology Verification (ETV) Testing
IV. Actual Storms Monitoring of Full-Scale Filter (Current Research)
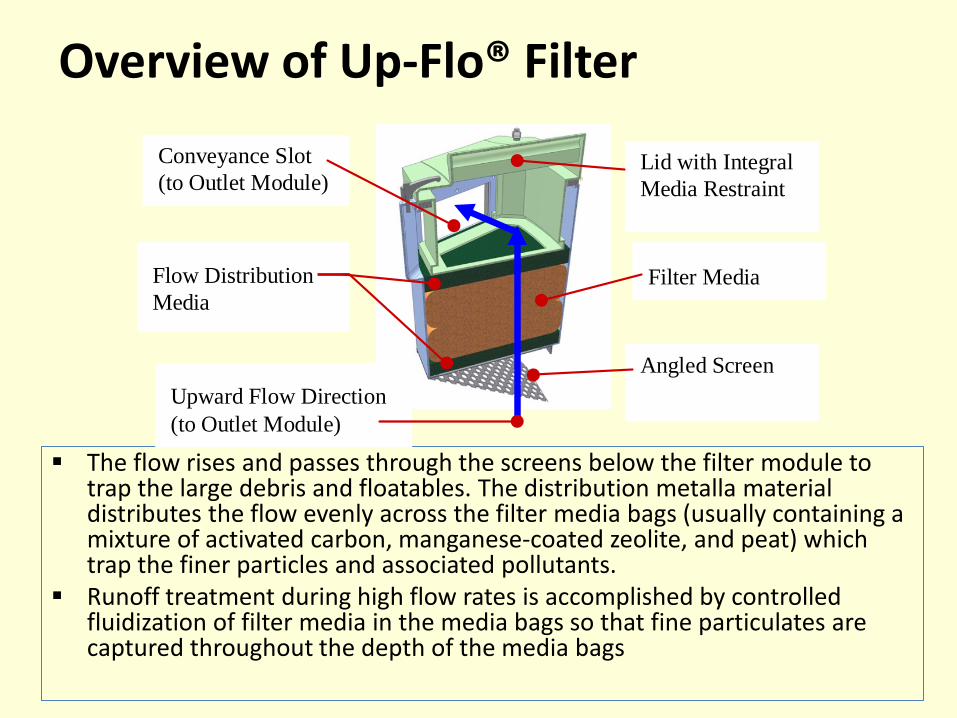
The flow rises and passes through the screens below the filter module to trap the large debris and floatables. The distribution metalla material distributes the flow evenly across the filter media bags (usually containing a mixture of activated carbon, manganese-coated zeolite, and peat) which trap the finer particles and associated pollutants.
Runoff treatment during high flow rates is accomplished by controlled fluidization of filter media in the media bags so that fine particulates are captured throughout the depth of the media bags
Overview of Up-Flo® Filter
Flow Distribution Media
Filter Media
Angled Screen
Lid with Integral Media Restraint
Conveyance Slot (to Outlet Module)
Upward Flow Direction (to Outlet Module)
Test Location And Landscape Profile
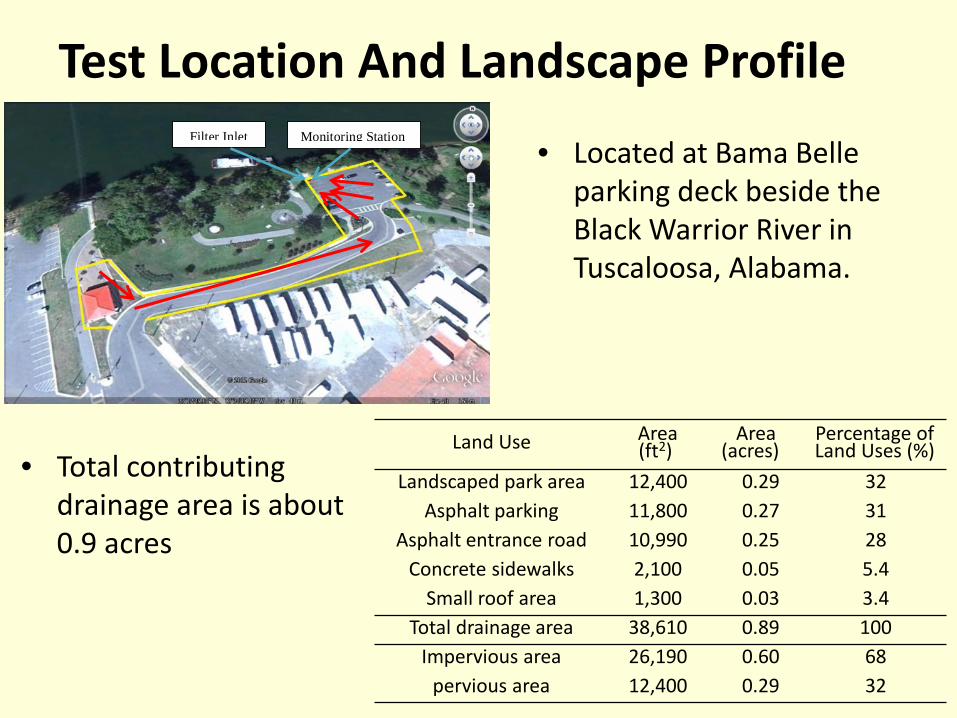
• Located at Bama Belle parking deck beside the Black Warrior River in Tuscaloosa, Alabama.
Filter Inlet Monitoring Station
• Total contributing drainage area is about 0.9 acres
Land Use Area (ft2)
Area (acres)
Percentage of Land Uses (%)
Landscaped park area 12,400 0.29 32 Asphalt parking 11,800 0.27 31
Asphalt entrance road 10,990 0.25 28 Concrete sidewalks 2,100 0.05 5.4
Small roof area 1,300 0.03 3.4 Total drainage area 38,610 0.89 100
Impervious area 26,190 0.60 68 pervious area 12,400 0.29 32
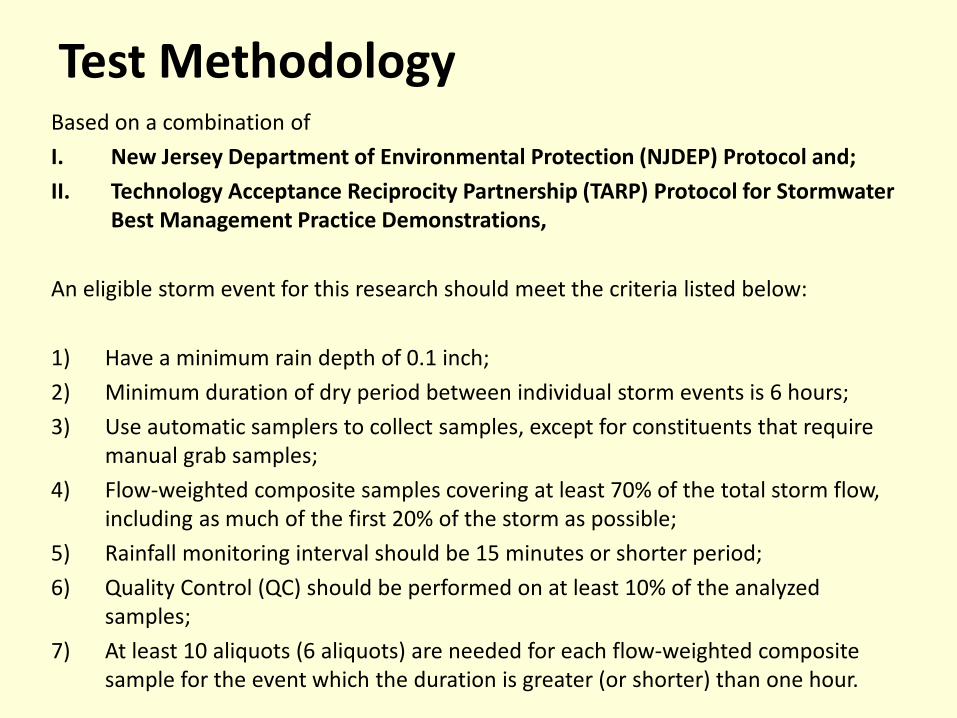
Based on a combination of I. New Jersey Department of Environmental Protection (NJDEP) Protocol and; II. Technology Acceptance Reciprocity Partnership (TARP) Protocol for Stormwater
Best Management Practice Demonstrations,
An eligible storm event for this research should meet the criteria listed below: 1) Have a minimum rain depth of 0.1 inch; 2) Minimum duration of dry period between individual storm events is 6 hours; 3) Use automatic samplers to collect samples, except for constituents that require
manual grab samples; 4) Flow-weighted composite samples covering at least 70% of the total storm flow,
including as much of the first 20% of the storm as possible; 5) Rainfall monitoring interval should be 15 minutes or shorter period; 6) Quality Control (QC) should be performed on at least 10% of the analyzed
samples; 7) At least 10 aliquots (6 aliquots) are needed for each flow-weighted composite
sample for the event which the duration is greater (or shorter) than one hour.
Test Methodology
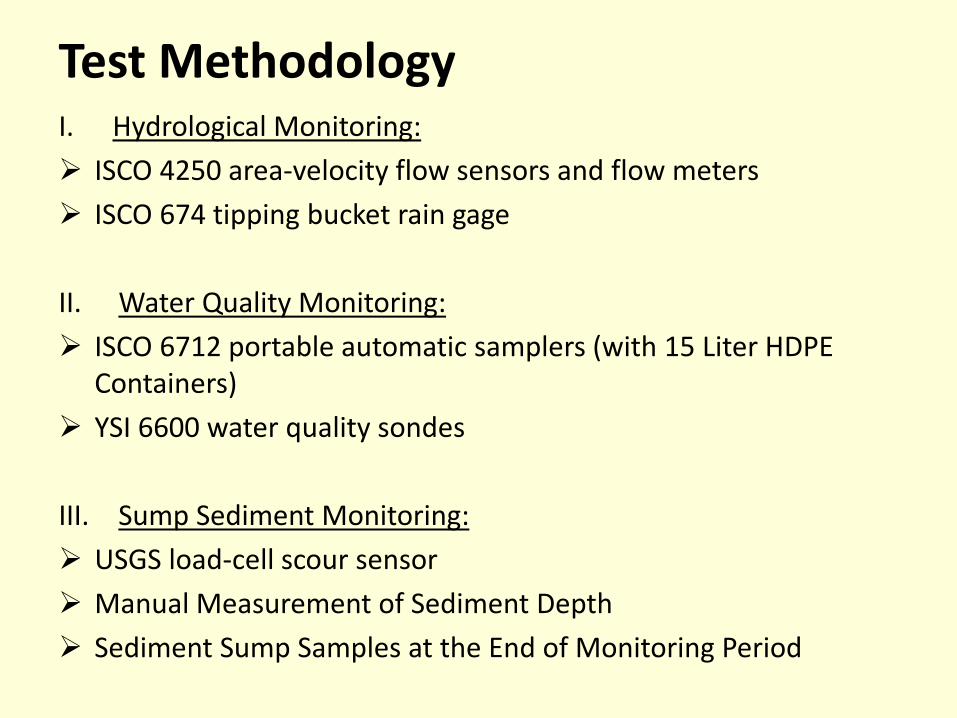
I. Hydrological Monitoring: ISCO 4250 area-velocity flow sensors and flow meters ISCO 674 tipping bucket rain gage
II. Water Quality Monitoring: ISCO 6712 portable automatic samplers (with 15 Liter HDPE
Containers) YSI 6600 water quality sondes III. Sump Sediment Monitoring: USGS load-cell scour sensor Manual Measurement of Sediment Depth Sediment Sump Samples at the End of Monitoring Period
Test Methodology
Test Methodology
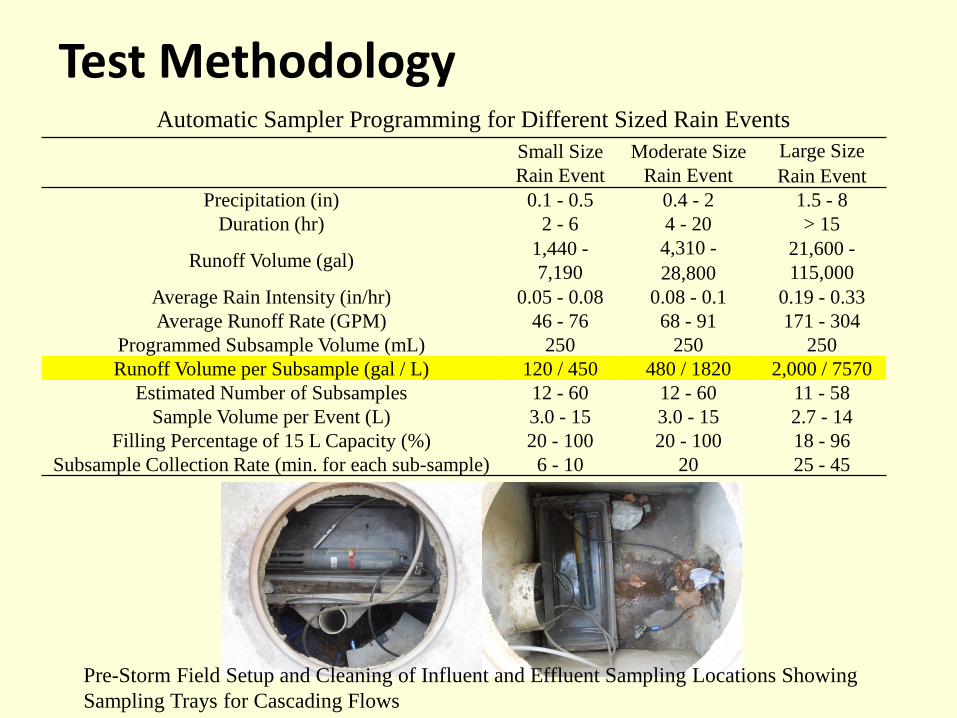
Small Size Rain Event
Moderate Size Rain Event
Large Size Rain Event
Precipitation (in) 0.1 - 0.5 0.4 - 2 1.5 - 8 Duration (hr) 2 - 6 4 - 20 > 15
Runoff Volume (gal) 1,440 - 7,190
4,310 - 28,800
21,600 - 115,000
Average Rain Intensity (in/hr) 0.05 - 0.08 0.08 - 0.1 0.19 - 0.33 Average Runoff Rate (GPM) 46 - 76 68 - 91 171 - 304
Programmed Subsample Volume (mL) 250 250 250 Runoff Volume per Subsample (gal / L) 120 / 450 480 / 1820 2,000 / 7570
Estimated Number of Subsamples 12 - 60 12 - 60 11 - 58 Sample Volume per Event (L) 3.0 - 15 3.0 - 15 2.7 - 14
Filling Percentage of 15 L Capacity (%) 20 - 100 20 - 100 18 - 96 Subsample Collection Rate (min. for each sub-sample) 6 - 10 20 25 - 45
Automatic Sampler Programming for Different Sized Rain Events
Pre-Storm Field Setup and Cleaning of Influent and Effluent Sampling Locations Showing Sampling Trays for Cascading Flows
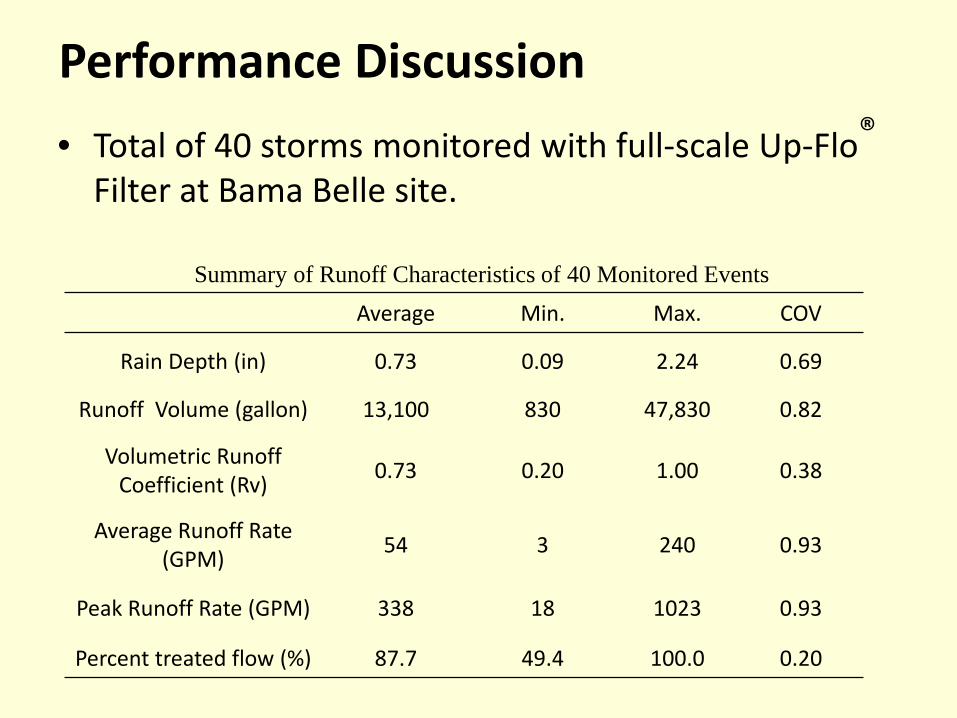
• Total of 40 storms monitored with full-scale Up-Flo® Filter at Bama Belle site.
Performance Discussion
Summary of Runoff Characteristics of 40 Monitored Events Average Min. Max. COV
Rain Depth (in) 0.73 0.09 2.24 0.69
Runoff Volume (gallon) 13,100 830 47,830 0.82
Volumetric Runoff Coefficient (Rv) 0.73 0.20 1.00 0.38
Average Runoff Rate (GPM) 54 3 240 0.93
Peak Runoff Rate (GPM) 338 18 1023 0.93
Percent treated flow (%) 87.7 49.4 100.0 0.20
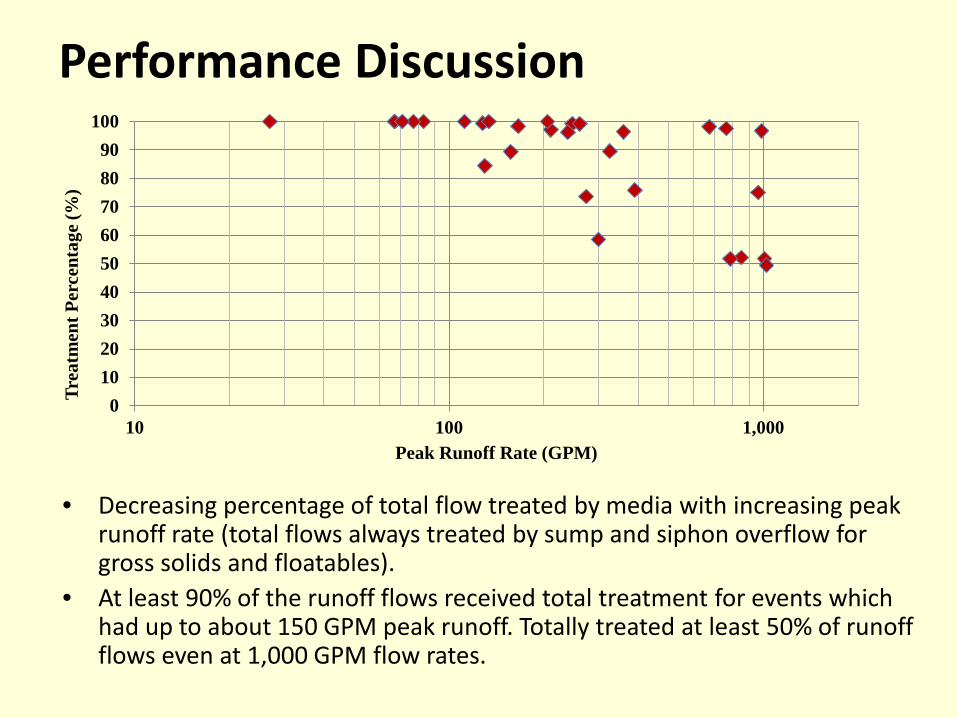
• Decreasing percentage of total flow treated by media with increasing peak runoff rate (total flows always treated by sump and siphon overflow for gross solids and floatables).
• At least 90% of the runoff flows received total treatment for events which had up to about 150 GPM peak runoff. Totally treated at least 50% of runoff flows even at 1,000 GPM flow rates.
Performance Discussion
0102030405060708090
100
10 100 1,000
Trea
tmen
t Per
cent
age
(%)
Peak Runoff Rate (GPM)
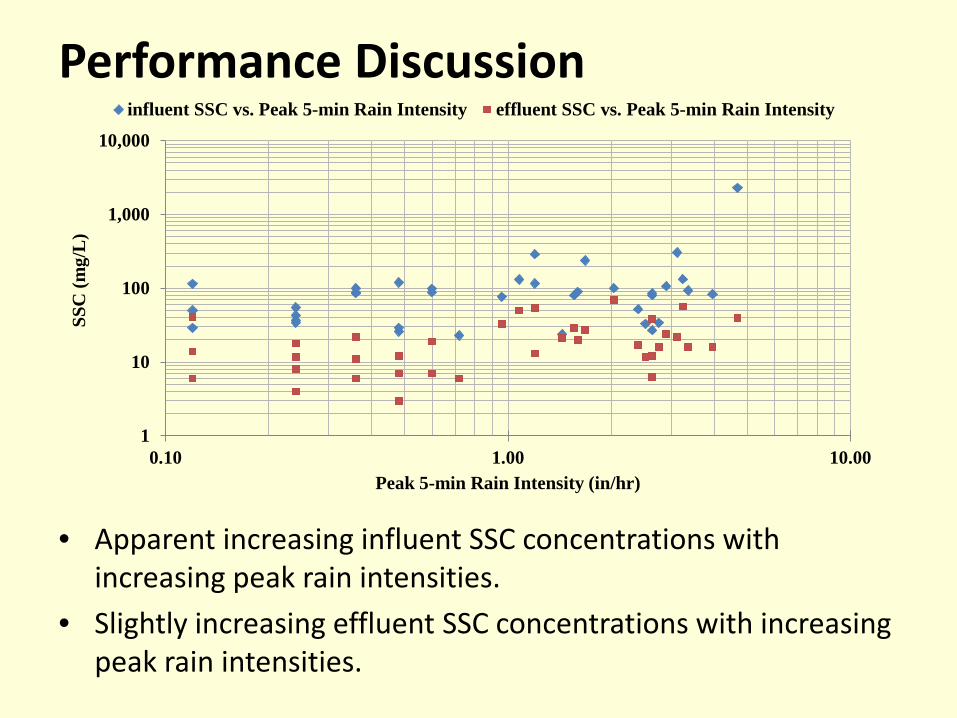
• Apparent increasing influent SSC concentrations with increasing peak rain intensities.
• Slightly increasing effluent SSC concentrations with increasing peak rain intensities.
Performance Discussion
1
10
100
1,000
10,000
0.10 1.00 10.00
SSC
(mg/
L)
Peak 5-min Rain Intensity (in/hr)
influent SSC vs. Peak 5-min Rain Intensity effluent SSC vs. Peak 5-min Rain Intensity
Performance Discussion
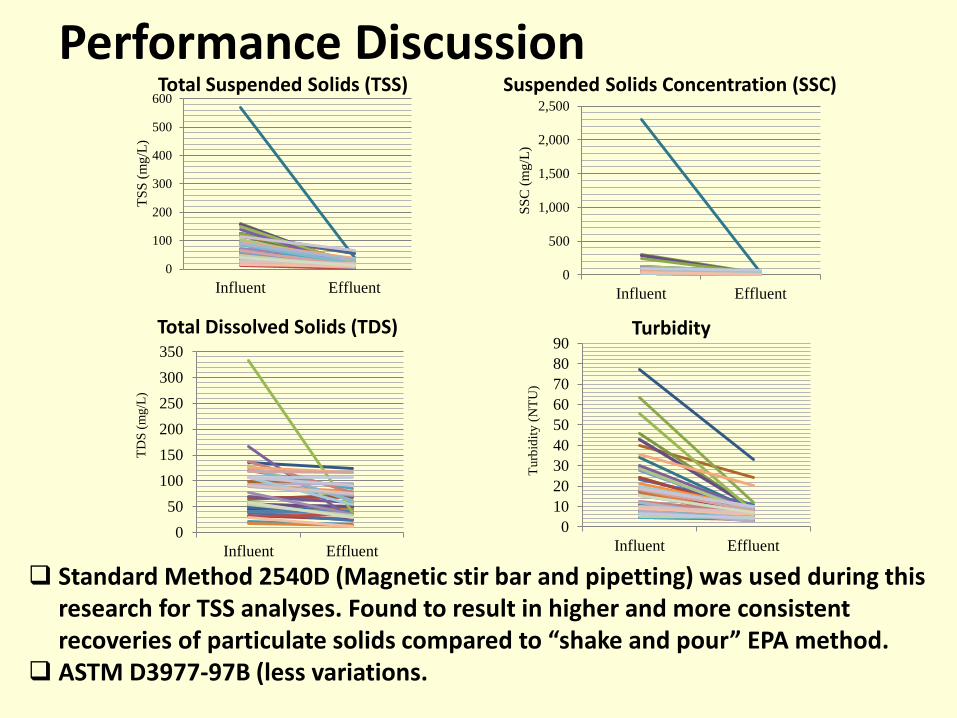
Standard Method 2540D (Magnetic stir bar and pipetting) was used during this research for TSS analyses. Found to result in higher and more consistent recoveries of particulate solids compared to “shake and pour” EPA method.
ASTM D3977-97B (less variations.
Total Suspended Solids (TSS) Suspended Solids Concentration (SSC)
Total Dissolved Solids (TDS) Turbidity
0
100
200
300
400
500
600
Influent Effluent
TSS
(mg/
L)
0
500
1,000
1,500
2,000
2,500
Influent Effluent
SSC
(mg/
L)
050
100150200250300350
Influent Effluent
TDS
(mg/
L)
0102030405060708090
Influent EffluentTu
rbid
ity (N
TU)
Performance Discussion
3.53.02.52.01.51.00.50.0
99
95
90
80
7060504030
20
10
5
1
SSC (Log(mg/L))
Perc
ent
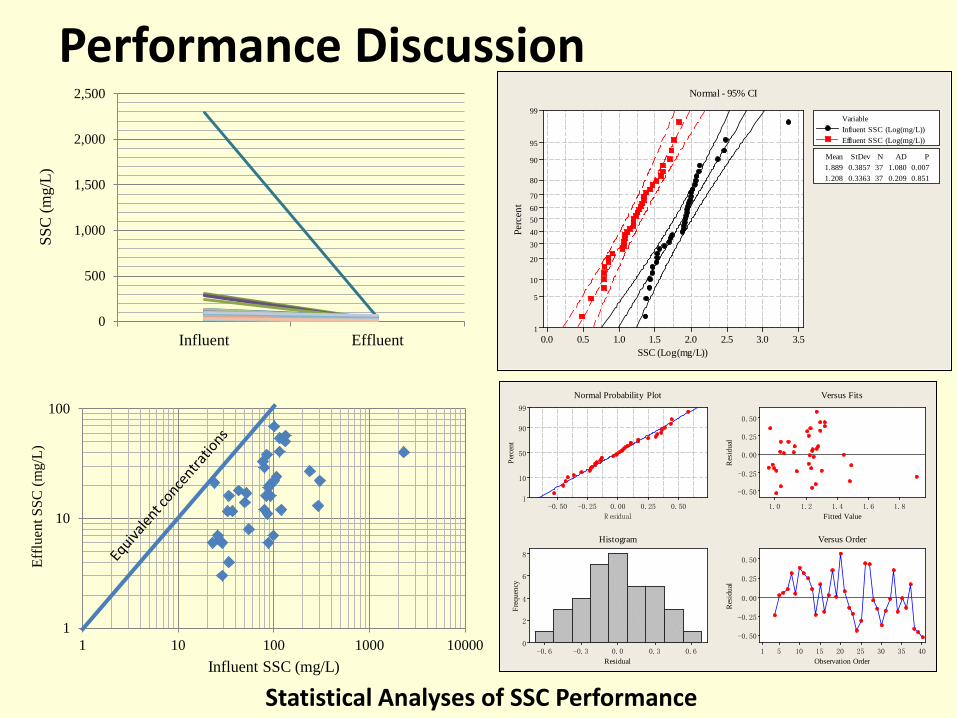
1.889 0.3857 37 1.080 0.0071.208 0.3363 37 0.209 0.851
Mean StDev N AD P
Influent SSC (Log(mg/L))Effluent SSC (Log(mg/L))
Variable
Normal - 95% CI
0.500.250.00-0.25-0.50
99
90
50
10
1
R esidualPe
rcen
t1.81.61.41.21.0
0.50
0.25
0.00
-0.25
-0.50
Fitted Value
Res
idua
l
0.60.30.0-0.3-0.6
8
6
4
2
0
Residual
Freq
uenc
y
4035302520151051
0.50
0.25
0.00
-0.25
-0.50
Observation Order
Res
idua
l
Normal Probability Plot Versus Fits
Histogram Versus Order
Statistical Analyses of SSC Performance
0
500
1,000
1,500
2,000
2,500
Influent Effluent
SSC
(mg/
L)
1
10
100
1 10 100 1000 10000
Efflu
ent S
SC (m
g/L)
Influent SSC (mg/L)
Average Mass Percentage (%)
Average solids concentration in the size
range (mg/L)
Average Percentage
Reduction by Concentration
Particle Size (µm) Influent Effluent Influent Effluent
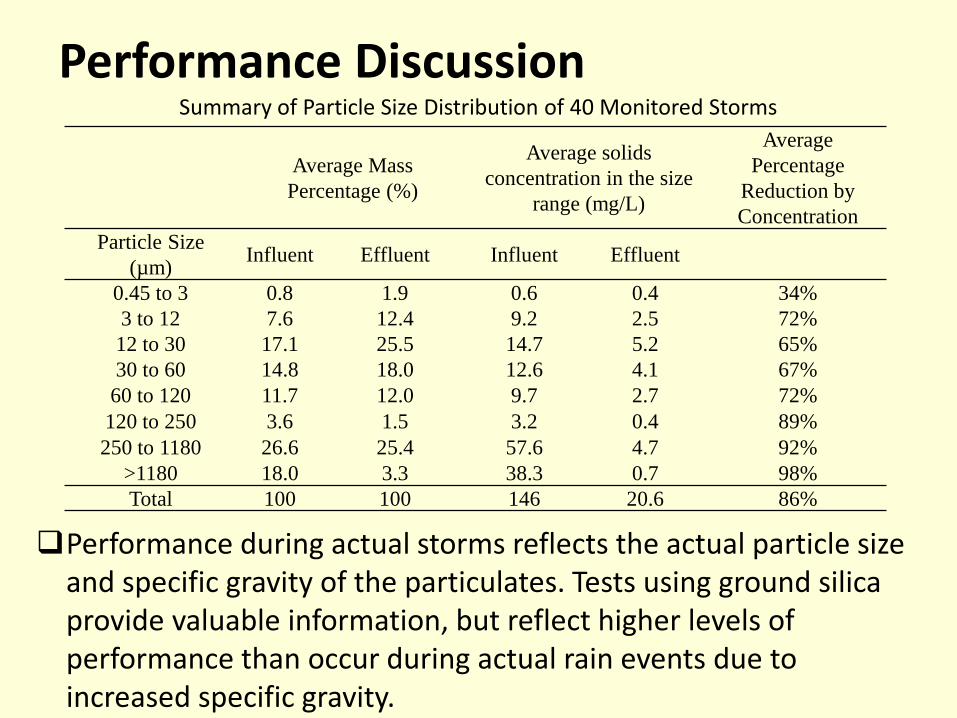
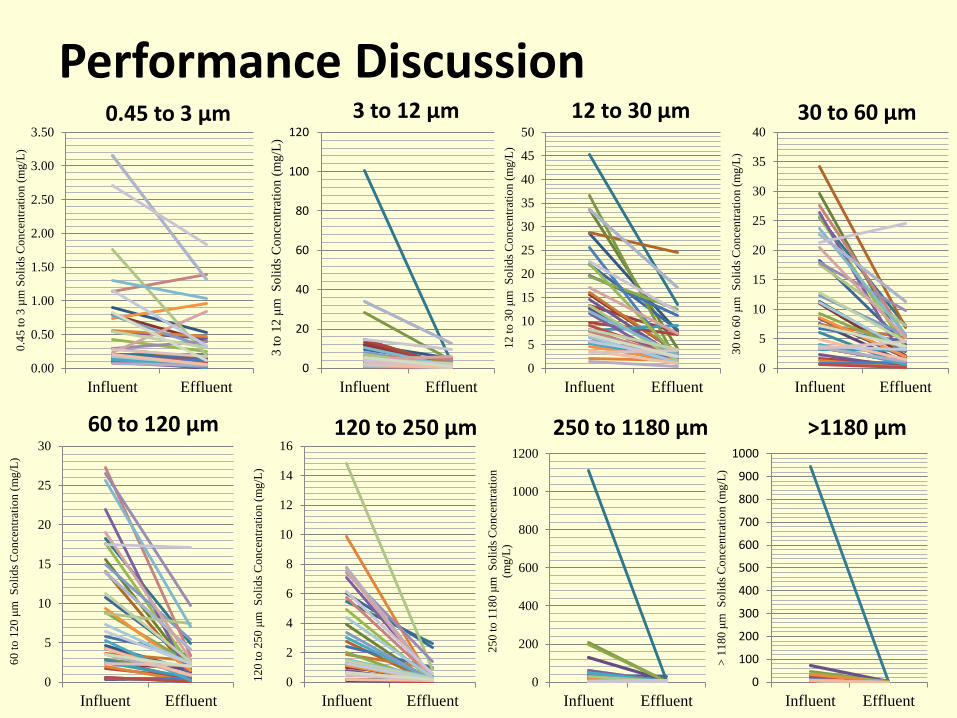
0.45 to 3 0.8 1.9 0.6 0.4 34% 3 to 12 7.6 12.4 9.2 2.5 72% 12 to 30 17.1 25.5 14.7 5.2 65% 30 to 60 14.8 18.0 12.6 4.1 67%
60 to 120 11.7 12.0 9.7 2.7 72% 120 to 250 3.6 1.5 3.2 0.4 89% 250 to 1180 26.6 25.4 57.6 4.7 92%
>1180 18.0 3.3 38.3 0.7 98% Total 100 100 146 20.6 86%
Performance Discussion Summary of Particle Size Distribution of 40 Monitored Storms
Performance during actual storms reflects the actual particle size and specific gravity of the particulates. Tests using ground silica provide valuable information, but reflect higher levels of performance than occur during actual rain events due to increased specific gravity.
Performance Discussion
0
0.1
0.2
0.3
0.4
0.5
0.6
0.7
0.8
0.9
1
0.1 1 10 100 1000 10000
Perc
enta
ge o
f Par
ticul
ate
Fine
r tha
n Pa
rticl
e Si
ze (%
)
Particle Size (micronmeter)
Influent Effluent
0
100
200
300
400
500
600
700
0.1 1 10 100 1000 10000
Mas
s loa
d fin
er th
an p
artic
le si
ze
(lbs)
Particle Size (micrometers)
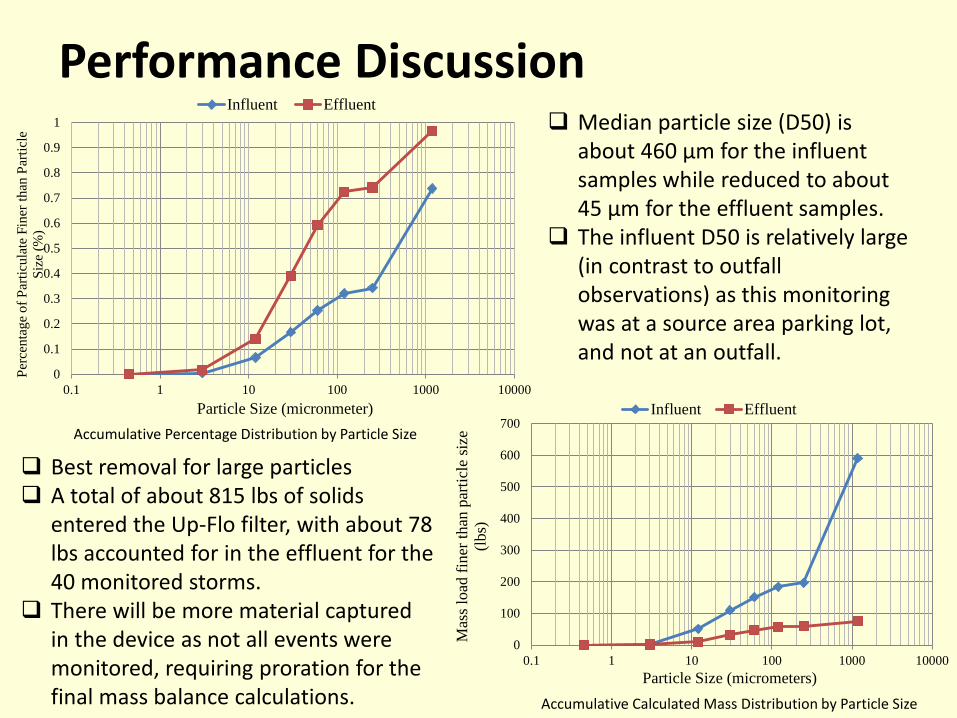
Influent EffluentAccumulative Percentage Distribution by Particle Size
Accumulative Calculated Mass Distribution by Particle Size
Median particle size (D50) is about 460 µm for the influent samples while reduced to about 45 µm for the effluent samples.
The influent D50 is relatively large (in contrast to outfall observations) as this monitoring was at a source area parking lot, and not at an outfall.
Best removal for large particles A total of about 815 lbs of solids
entered the Up-Flo filter, with about 78 lbs accounted for in the effluent for the 40 monitored storms.
There will be more material captured in the device as not all events were monitored, requiring proration for the final mass balance calculations.
Performance Discussion
0.00
0.50
1.00
1.50
2.00
2.50
3.00
3.50
Influent Effluent
0.45
to 3
µm
Sol
ids C
once
ntra
tion
(mg/
L)
0
20
40
60
80
100
120
Influent Effluent
3 to
12 μm
Sol
ids C
once
ntra
tion
(mg/
L)
0
5
10
15
20
25
30
35
40
45
50
Influent Effluent
12 to
30 μm
Sol
ids C
once
ntra
tion
(mg/
L)
0
5
10
15
20
25
30
35
40
Influent Effluent
30 to
60 μm
Sol
ids C
once
ntra
tion
(mg/
L)
0
5
10
15
20
25
30
Influent Effluent
60 to
120
μm
Sol
ids C
once
ntra
tion
(mg/
L)
0
2
4
6
8
10
12
14
16
Influent Effluent
120
to 2
50 μ
m S
olid
s Con
cent
ratio
n (m
g/L)
0
200
400
600
800
1000
1200
Influent Effluent
250
to 1
180 μm
Sol
ids C
once
ntra
tion
(mg/
L)
0
100
200
300
400
500
600
700
800
900
1000
Influent Effluent>
1180
μm
Sol
ids C
once
ntra
tion
(mg/
L)
3 to 12 µm 0.45 to 3 µm 30 to 60 µm 12 to 30 µm
120 to 250 µm 60 to 120 µm 250 to 1180 µm >1180 µm
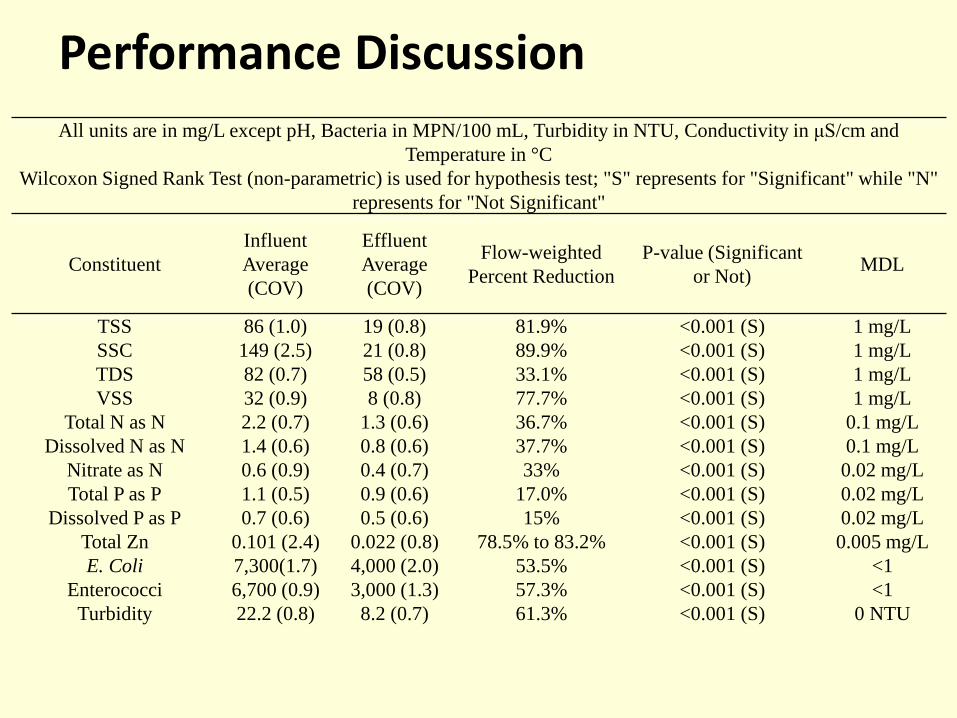
Performance Discussion All units are in mg/L except pH, Bacteria in MPN/100 mL, Turbidity in NTU, Conductivity in μS/cm and
Temperature in °C Wilcoxon Signed Rank Test (non-parametric) is used for hypothesis test; "S" represents for "Significant" while "N"
represents for "Not Significant"
Constituent Influent Average (COV)
Effluent Average (COV)
Flow-weighted Percent Reduction
P-value (Significant or Not) MDL
TSS 86 (1.0) 19 (0.8) 81.9% <0.001 (S) 1 mg/L SSC 149 (2.5) 21 (0.8) 89.9% <0.001 (S) 1 mg/L TDS 82 (0.7) 58 (0.5) 33.1% <0.001 (S) 1 mg/L VSS 32 (0.9) 8 (0.8) 77.7% <0.001 (S) 1 mg/L
Total N as N 2.2 (0.7) 1.3 (0.6) 36.7% <0.001 (S) 0.1 mg/L Dissolved N as N 1.4 (0.6) 0.8 (0.6) 37.7% <0.001 (S) 0.1 mg/L
Nitrate as N 0.6 (0.9) 0.4 (0.7) 33% <0.001 (S) 0.02 mg/L Total P as P 1.1 (0.5) 0.9 (0.6) 17.0% <0.001 (S) 0.02 mg/L
Dissolved P as P 0.7 (0.6) 0.5 (0.6) 15% <0.001 (S) 0.02 mg/L Total Zn 0.101 (2.4) 0.022 (0.8) 78.5% to 83.2% <0.001 (S) 0.005 mg/L E. Coli 7,300(1.7) 4,000 (2.0) 53.5% <0.001 (S) <1
Enterococci 6,700 (0.9) 3,000 (1.3) 57.3% <0.001 (S) <1 Turbidity 22.2 (0.8) 8.2 (0.7) 61.3% <0.001 (S) 0 NTU
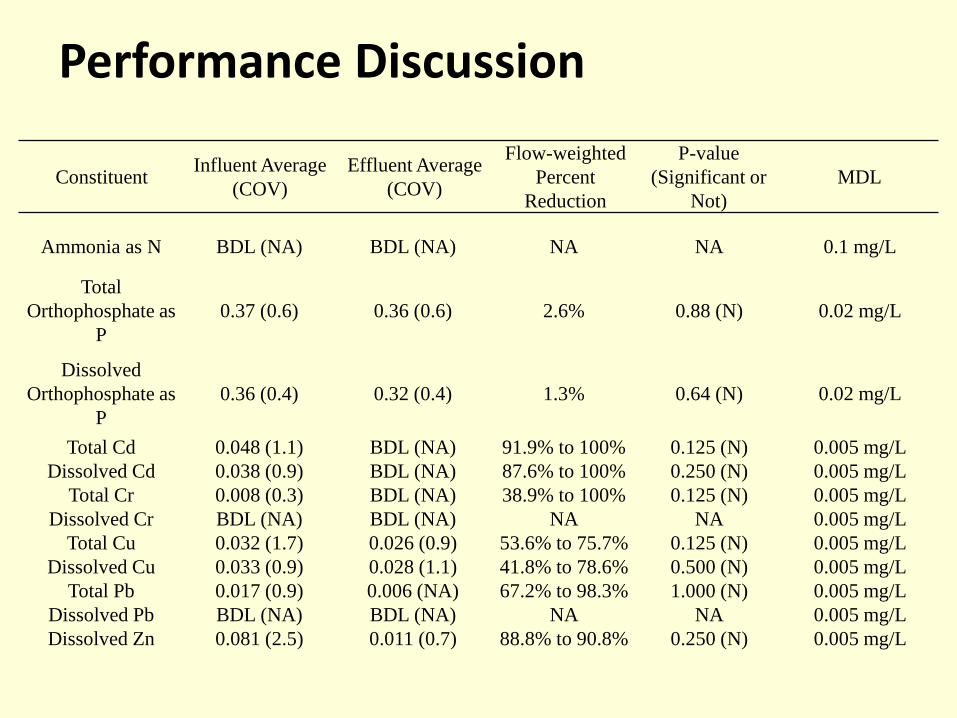
Performance Discussion
Constituent Influent Average (COV)
Effluent Average (COV)
Flow-weighted Percent
Reduction
P-value (Significant or
Not) MDL
Ammonia as N BDL (NA) BDL (NA) NA NA 0.1 mg/L
Total Orthophosphate as
P 0.37 (0.6) 0.36 (0.6) 2.6% 0.88 (N) 0.02 mg/L
Dissolved Orthophosphate as
P 0.36 (0.4) 0.32 (0.4) 1.3% 0.64 (N) 0.02 mg/L
Total Cd 0.048 (1.1) BDL (NA) 91.9% to 100% 0.125 (N) 0.005 mg/L Dissolved Cd 0.038 (0.9) BDL (NA) 87.6% to 100% 0.250 (N) 0.005 mg/L
Total Cr 0.008 (0.3) BDL (NA) 38.9% to 100% 0.125 (N) 0.005 mg/L Dissolved Cr BDL (NA) BDL (NA) NA NA 0.005 mg/L
Total Cu 0.032 (1.7) 0.026 (0.9) 53.6% to 75.7% 0.125 (N) 0.005 mg/L Dissolved Cu 0.033 (0.9) 0.028 (1.1) 41.8% to 78.6% 0.500 (N) 0.005 mg/L
Total Pb 0.017 (0.9) 0.006 (NA) 67.2% to 98.3% 1.000 (N) 0.005 mg/L Dissolved Pb BDL (NA) BDL (NA) NA NA 0.005 mg/L Dissolved Zn 0.081 (2.5) 0.011 (0.7) 88.8% to 90.8% 0.250 (N) 0.005 mg/L
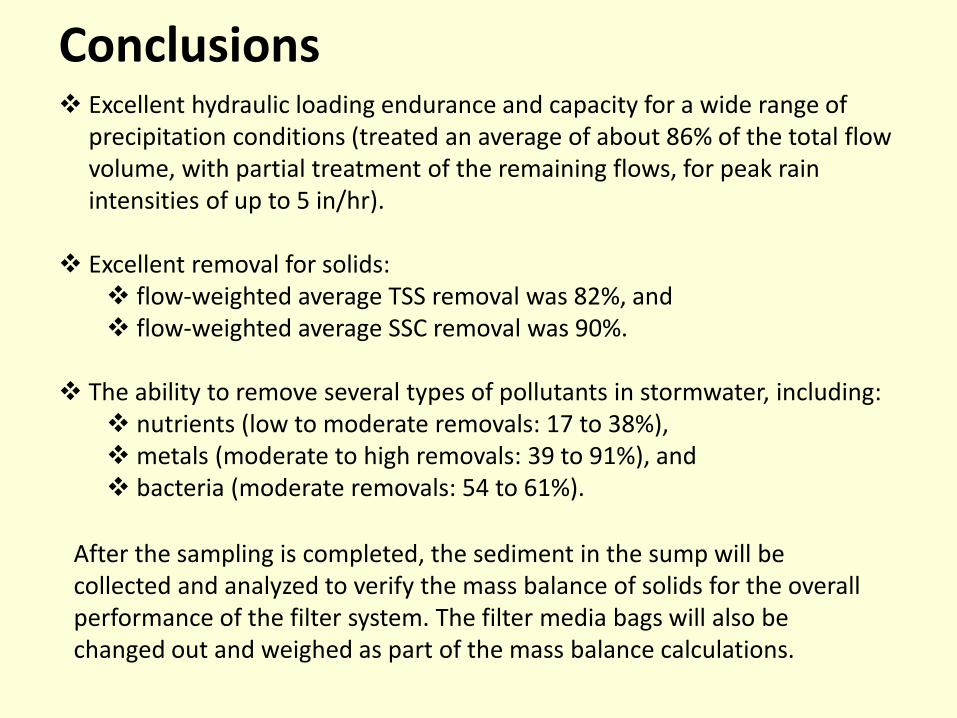
Conclusions Excellent hydraulic loading endurance and capacity for a wide range of
precipitation conditions (treated an average of about 86% of the total flow volume, with partial treatment of the remaining flows, for peak rain intensities of up to 5 in/hr).
Excellent removal for solids: flow-weighted average TSS removal was 82%, and flow-weighted average SSC removal was 90%.
The ability to remove several types of pollutants in stormwater, including:
nutrients (low to moderate removals: 17 to 38%), metals (moderate to high removals: 39 to 91%), and bacteria (moderate removals: 54 to 61%).
After the sampling is completed, the sediment in the sump will be collected and analyzed to verify the mass balance of solids for the overall performance of the filter system. The filter media bags will also be changed out and weighed as part of the mass balance calculations.
• Avila, H., R. Pitt. “Scour in stormwater catchbasin devices – experimental results form a physical model.” In: Stormwater and Urban Water Systems Modeling, ISBN-978-0-9808853-2-3, Monograph 17. (edited by W. James, E.A. McBean, R.E. Pitt and S.J. Wright). CHI. Guelph, Ontario, February 2009.
• Burton, A., and Pitt, R. (2001). Stormwater Effects Handbook: A Toolbox for Watershed Managers, Scientists, and Engineers: Lewis Publishers.
• Clark, S.E. and C.Y.S. Siu (2008). “Measuring solids concentration in stormwater runoff: Comparison of analytical methods.” Environmental Science and Technology. Vol. 42, No.2, pp 511–516.
• Clark, S.E. and R. Pitt (April 2008). “Comparison of stormwater solids analytical methods for performance evaluation of manufactured treatment devices.” Journal of Environmental Engineering, Vol. 134, No. 4, pp. 259-264.
• Clark, S.E., C.Y.S. Siu, R. Pitt, C.D. Roenning, and D.P. Tresse (Feb 2009). “Peristaltic pump auto samplers for solids measurement in stormwater runoff.” Water Environment Research, Vol. 81, No. 2, pp 192-200.
• Khambhammettu U., Pitt R., et al (2006). “Full-scale evaluation of the UpFloTM Filter - A catchbasin insert for the treatment of stormwater at critical source areas.” The Water Environment Federation’s Annual Technical Exhibition and Conference (WEFTEC), Dallas, Texas.
• Pitt, R.E., R. Field, M. Lalor, and M. Brown (1995). “Urban stormwater toxic pollutants: Assessment, sources, and treatability.” Water Environment Research 67 (3): 260-275.
• Togawa, N. (2011). Development and Testing of Protocols for Evaluating Emerging Technologies for The Treatment of Stormwater. Ph.D. Dissertation, The University of Alabama, Tuscaloosa.
Reference