Embed Size (px)
Citation preview
Missouri University of Science and Technology Missouri University of Science and Technology
Scholars' Mine Scholars' Mine
International Conference on Case Histories in Geotechnical Engineering
(2013) - Seventh International Conference on Case Histories in Geotechnical Engineering
02 May 2013, 2:00 pm - 3:30 pm
Full-Scale Load Testing of 57-Year Old Raymond Piles for Full-Scale Load Testing of 57-Year Old Raymond Piles for
Foundation Re-use Foundation Re-use
Vishnu Diyaljee GAEA Engineering Ltd., Canada
Follow this and additional works at: https://scholarsmine.mst.edu/icchge
Part of the Geotechnical Engineering Commons
Recommended Citation Recommended Citation Diyaljee, Vishnu, "Full-Scale Load Testing of 57-Year Old Raymond Piles for Foundation Re-use" (2013). International Conference on Case Histories in Geotechnical Engineering. 15. https://scholarsmine.mst.edu/icchge/7icchge/session02/15
This work is licensed under a Creative Commons Attribution-Noncommercial-No Derivative Works 4.0 License.
This Article - Conference proceedings is brought to you for free and open access by Scholars' Mine. It has been accepted for inclusion in International Conference on Case Histories in Geotechnical Engineering by an authorized administrator of Scholars' Mine. This work is protected by U. S. Copyright Law. Unauthorized use including reproduction for redistribution requires the permission of the copyright holder. For more information, please contact [email protected].
Paper No. 2.01 1
FULL-SCALE LOAD TESTING OF 57-YEAR OLD RAYMOND PILES FOR
FOUNDATION RE-USE
Vishnu Diyaljee, P.Eng, Ph.D, F.ASCE Managing Director, GAEA Engineering Ltd
33 Ashby Field Road, Brampton, Ontario
Canada, L6X 0R4
ABSTRACT
The proposed reconstruction of a demolished coke battery superstructure of a steel mill to a level higher than originally constructed in
1952 required the evaluation of the geotechnical resistance and settlement characteristics of its existing foundation piles. Except for
design drawings showing the layout of the substructure elements and the borehole logs, there were neither as-built drawings nor any
records available about the design and construction of the piles. A total of nine (9) axial compressive load tests were initially
undertaken. Two (2) 19 ft long piles were initially tested under the pusher tracks, and a further seven (7) piles of varying lengths under
the foundation of the coke batteries. These piles were assumed to have been installed into hard clay till underlying the site. The load
tests showed that the mandrel driven outer steel casing and concrete in-filled piles could accommodate a load of 90 tons with minimal
settlement. Cylindrical cores of the pile concrete taken following the load testing provided compressive strengths varying from 46 to
as much as 62 MPa. This case study provides details of the excavation and dewatering issues, load test set-up, and the difficulties
encountered in assessing and testing old foundations for re-use in a confined underground environment. It is hoped that this case
study and its findings will encourage the proper assessment and evaluation of existing foundations as this could result in considerable
savings in superstructure revitalization, emphasize the need to maintain design and construction records, and to instrument and
monitor important foundations for long term reuse.
INTRODUCTION
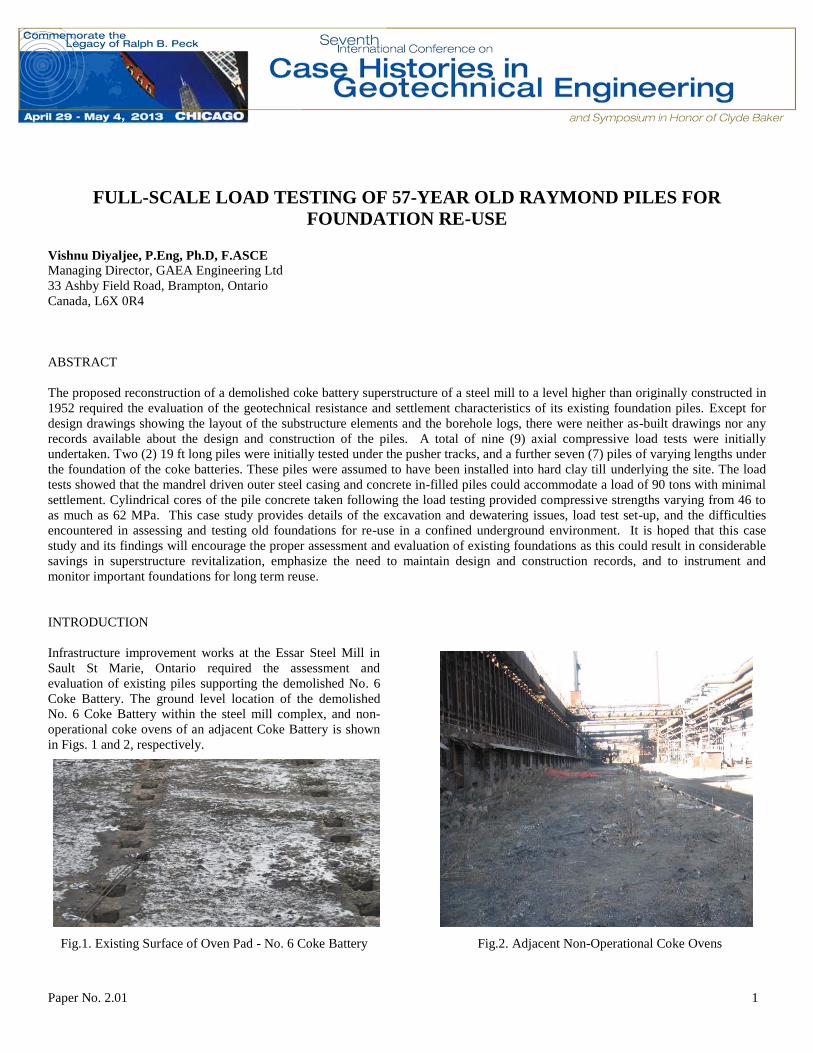
Infrastructure improvement works at the Essar Steel Mill in
Sault St Marie, Ontario required the assessment and
evaluation of existing piles supporting the demolished No. 6
Coke Battery. The ground level location of the demolished
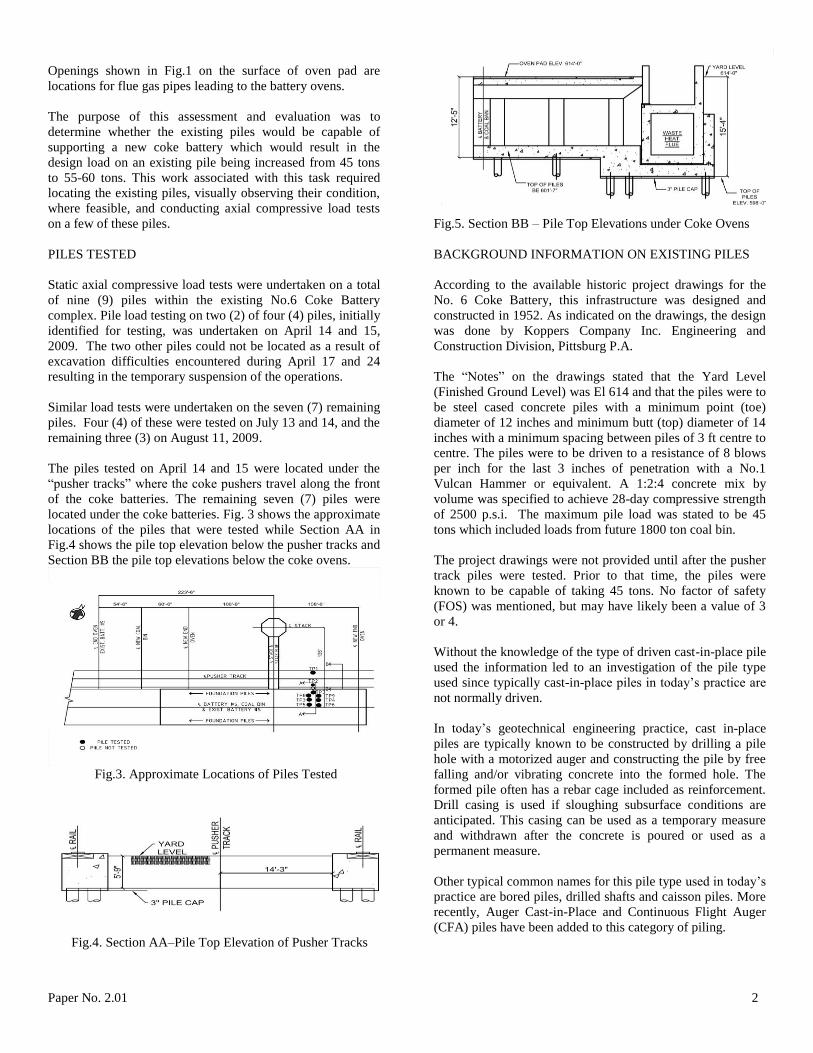
No. 6 Coke Battery within the steel mill complex, and non-
operational coke ovens of an adjacent Coke Battery is shown
in Figs. 1 and 2, respectively.
Fig.1. Existing Surface of Oven Pad - No. 6 Coke Battery
Fig.2. Adjacent Non-Operational Coke Ovens
Paper No. 2.01 2
Openings shown in Fig.1 on the surface of oven pad are
locations for flue gas pipes leading to the battery ovens.
The purpose of this assessment and evaluation was to
determine whether the existing piles would be capable of
supporting a new coke battery which would result in the
design load on an existing pile being increased from 45 tons
to 55-60 tons. This work associated with this task required
locating the existing piles, visually observing their condition,
where feasible, and conducting axial compressive load tests
on a few of these piles.
PILES TESTED
Static axial compressive load tests were undertaken on a total
of nine (9) piles within the existing No.6 Coke Battery
complex. Pile load testing on two (2) of four (4) piles, initially
identified for testing, was undertaken on April 14 and 15,
2009. The two other piles could not be located as a result of
excavation difficulties encountered during April 17 and 24
resulting in the temporary suspension of the operations.
Similar load tests were undertaken on the seven (7) remaining
piles. Four (4) of these were tested on July 13 and 14, and the
remaining three (3) on August 11, 2009.
The piles tested on April 14 and 15 were located under the
“pusher tracks” where the coke pushers travel along the front
of the coke batteries. The remaining seven (7) piles were
located under the coke batteries. Fig. 3 shows the approximate
locations of the piles that were tested while Section AA in
Fig.4 shows the pile top elevation below the pusher tracks and
Section BB the pile top elevations below the coke ovens.
Fig.3. Approximate Locations of Piles Tested
Fig.4. Section AA–Pile Top Elevation of Pusher Tracks
Fig.5. Section BB – Pile Top Elevations under Coke Ovens
BACKGROUND INFORMATION ON EXISTING PILES
According to the available historic project drawings for the
No. 6 Coke Battery, this infrastructure was designed and
constructed in 1952. As indicated on the drawings, the design
was done by Koppers Company Inc. Engineering and
Construction Division, Pittsburg P.A.
The “Notes” on the drawings stated that the Yard Level
(Finished Ground Level) was El 614 and that the piles were to
be steel cased concrete piles with a minimum point (toe)
diameter of 12 inches and minimum butt (top) diameter of 14
inches with a minimum spacing between piles of 3 ft centre to
centre. The piles were to be driven to a resistance of 8 blows
per inch for the last 3 inches of penetration with a No.1
Vulcan Hammer or equivalent. A 1:2:4 concrete mix by
volume was specified to achieve 28-day compressive strength
of 2500 p.s.i. The maximum pile load was stated to be 45
tons which included loads from future 1800 ton coal bin.
The project drawings were not provided until after the pusher
track piles were tested. Prior to that time, the piles were
known to be capable of taking 45 tons. No factor of safety
(FOS) was mentioned, but may have likely been a value of 3
or 4.
Without the knowledge of the type of driven cast-in-place pile
used the information led to an investigation of the pile type
used since typically cast-in-place piles in today’s practice are
not normally driven.
In today’s geotechnical engineering practice, cast in-place
piles are typically known to be constructed by drilling a pile
hole with a motorized auger and constructing the pile by free
falling and/or vibrating concrete into the formed hole. The
formed pile often has a rebar cage included as reinforcement.
Drill casing is used if sloughing subsurface conditions are
anticipated. This casing can be used as a temporary measure
and withdrawn after the concrete is poured or used as a
permanent measure.
Other typical common names for this pile type used in today’s
practice are bored piles, drilled shafts and caisson piles. More
recently, Auger Cast-in-Place and Continuous Flight Auger
(CFA) piles have been added to this category of piling.
Paper No. 2.01 3
From a review of the information and the literature on piling,
the pile that was used appeared to be a “driven and cast-in-
place” pile which can be constructed by driving a steel tube or
precast concrete shell which remains in the ground or with the
steel tube or precast concrete shell withdrawn (Tomlinson,
1986; Seeyle 1960).
After further review of the literature, it was believed that the
pile type used was the Raymond Constant section pile.
However, on-site opinions on the pile type anticipated before
any excavation was undertaken varied from pile construction
with an outer steel shell being driven and withdrawn, to pile
construction with the steel shell being left in place.
INFORMATION ON SUBSURFACE CONDITIONS
Subsurface conditions relevant to the No.6 Coke Battery site
were provided by two (2) boreholes logs, borehole (BH) 293
and BH 295 as indicated on Fig.1. These were shown on the
drawing sheet titled “Ovens Battery Foundations Piling Bid
Sheet For 45 ton Piles”. The borehole logs were illustrated as
plots of Standard Penetration Resistance (SPT) values versus
depth and with stratigraphic descriptions with elevation and
depth. Borehole 295 was the most relevant as this was in close
proximity of the piles tested.
In general, in the case of BH 295 the stratigraphic profile
consisted of 14ft of black slag overlying red sandy till
whereas in BH 293 the thickness of black slag was 11 ft with
a 4 ft layer of grey brown sand and grey brown sand and silt
between the bottom of the slag and underlying red sandy till.
As noted from the borehole logs, both boreholes were
terminated in the red sandy till at an average depth of about
21 ft below the ground level. The ground level at the borehole
locations at the time of the investigation showed a difference
of about 2ft between BH 293 (El 611) and BH 295 (El 609)
with the higher ground at BH 293 location.
The SPT blow count in the slag layer averaged about 10 in
BH 293 and 20 in BH 295 signifying the layer to be in a loose
to compact state. The SPT blow counts recorded at the end of
each borehole (El 589.6 in BH 293) and (El 586.7 in BH 295)
varied from 16 in BH 293 to 10 in BH 295. At the end of each
borehole a dynamic cone penetration test was undertaken
which showed increasing blow counts from 20 in BH 293 to
greater than 100 blows per foot at El 585 a depth of 5 ft below
the bottom of the borehole, and from 10 to greater than 100 at
El 582 in BH 295.
Based on the low blow counts at the bottom of the borehole it
is conceivable that the outer shell casing was driven into the
red sandy till to a depth of at least 21 ft below the existing
ground at the time of pile installation in 1952.
Groundwater level was recorded at 3‘ 9“ below ground level
in BH 295 and at 5’7” below ground at the BH 293 location.
In relation to elevations the groundwater was the same level
in the two boreholes.
PROJECT INITIATION AND SAFETY MEETING
A project initiation meeting was held on April 7, 2009 at the
Algoma Energy Co-Generation Site Office located within the
Essar Algoma Steel Mill complex. At this meeting, the
number of piles to be tested was discussed and locations
tentatively identified.
There was some discussion on the difficulties that may be
encountered in locating the piles since there was an
understanding that the ground water levels were high within
the site. It was agreed that the field work would commence
following the meeting since the backhoe had been mobilized
on site.
This meeting was followed by a safety orientation meeting
since this was mandatory before any work could start on site.
Prior to the start of the safety orientation there was some
further discussion with the Safety Officer who advised that it
would be difficult to excavate and find the piles at the
locations that were initially intended. It was suggested and
agreed upon that piles along the north side of the pusher track
would be better to attempt to locate and test.
FIELDWORK FOR PILE No.1 UNDER PUSHER TRACK
A field review was undertaken following the safety meeting
and the location for excavating for the first pile identified on
the ground. The backhoe excavator was moved to site on
April 7 but no work was started as intended since utility
clearances were incomplete until around the end of the
scheduled working day for the Contractor. Excavation was
rescheduled to start on April 8.
The excavation process was slow as ground water was
encountered around 3ft below the existing ground as had been
advised. In order to be able to dig deeper and counteract the
backfill sloughing a sump pump had to be used continuously
as the excavation progressed. After a few hours of excavating
and searching for the pile location, the pile was finally
located.
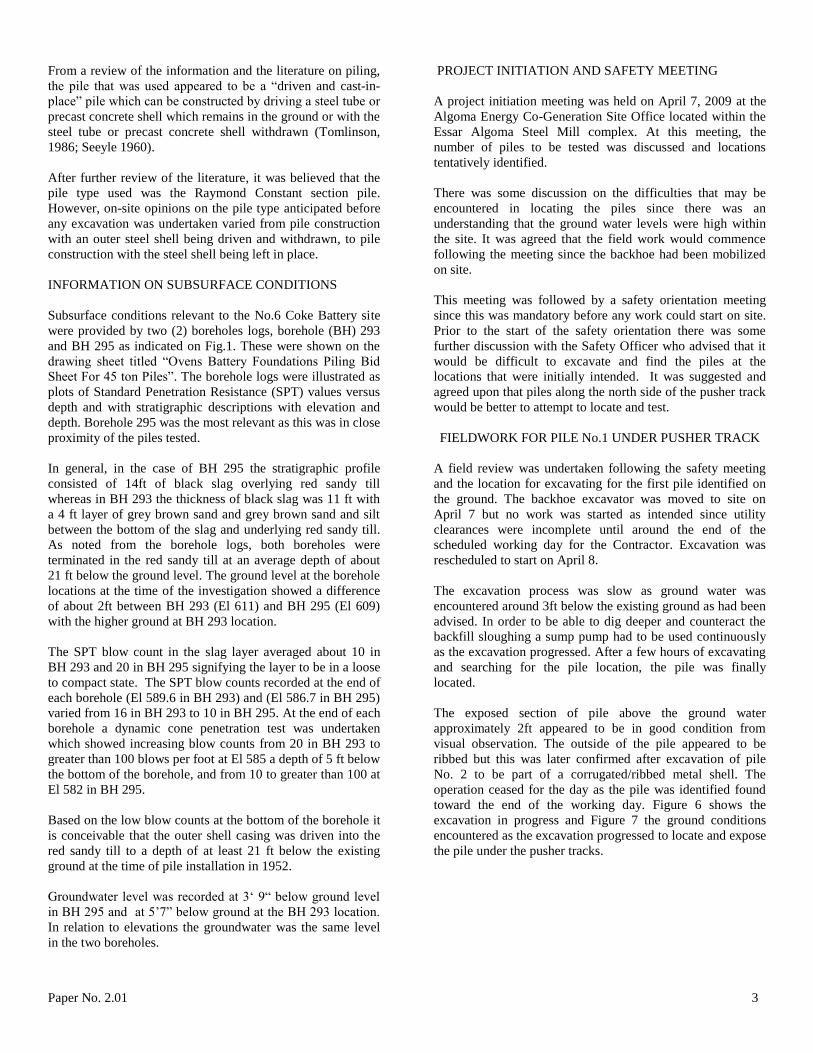
The exposed section of pile above the ground water
approximately 2ft appeared to be in good condition from
visual observation. The outside of the pile appeared to be
ribbed but this was later confirmed after excavation of pile
No. 2 to be part of a corrugated/ribbed metal shell. The
operation ceased for the day as the pile was identified found
toward the end of the working day. Figure 6 shows the
excavation in progress and Figure 7 the ground conditions
encountered as the excavation progressed to locate and expose
the pile under the pusher tracks.
Paper No. 2.01 4
Fig.3. Excavation to Expose Pile
Fig.6. Excavation to Expose Pile under Pusher Track
Fig.7. Located Pile under North Side of Pusher Track
PILE LOAD TEST – PILE No 1
Preparation for the pile load testing was discussed with the
excavation contractor and it was agreed that on site available
steel plates will be used to provide the dead load reaction.
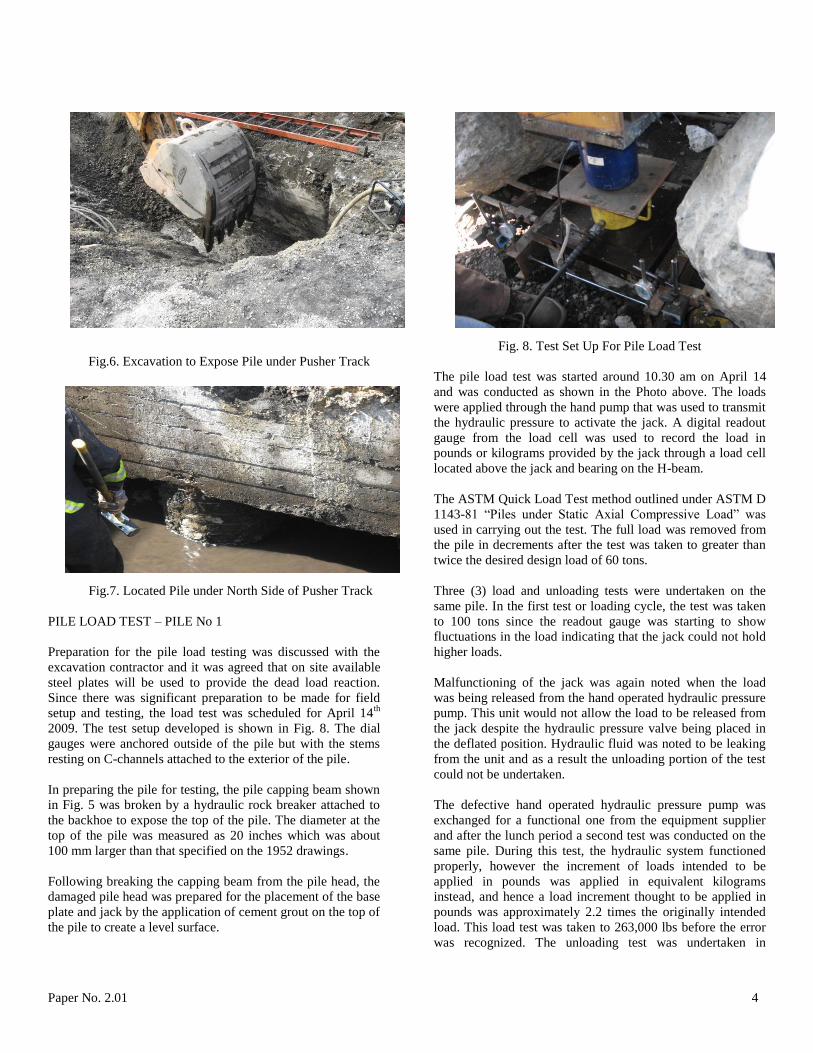
Since there was significant preparation to be made for field
setup and testing, the load test was scheduled for April 14th
2009. The test setup developed is shown in Fig. 8. The dial
gauges were anchored outside of the pile but with the stems
resting on C-channels attached to the exterior of the pile.
In preparing the pile for testing, the pile capping beam shown
in Fig. 5 was broken by a hydraulic rock breaker attached to
the backhoe to expose the top of the pile. The diameter at the
top of the pile was measured as 20 inches which was about
100 mm larger than that specified on the 1952 drawings.
Following breaking the capping beam from the pile head, the
damaged pile head was prepared for the placement of the base
plate and jack by the application of cement grout on the top of
the pile to create a level surface.
Fig. 8. Test Set Up For Pile Load Test
The pile load test was started around 10.30 am on April 14
and was conducted as shown in the Photo above. The loads
were applied through the hand pump that was used to transmit
the hydraulic pressure to activate the jack. A digital readout
gauge from the load cell was used to record the load in
pounds or kilograms provided by the jack through a load cell
located above the jack and bearing on the H-beam.
The ASTM Quick Load Test method outlined under ASTM D
1143-81 “Piles under Static Axial Compressive Load” was
used in carrying out the test. The full load was removed from
the pile in decrements after the test was taken to greater than
twice the desired design load of 60 tons.
Three (3) load and unloading tests were undertaken on the
same pile. In the first test or loading cycle, the test was taken
to 100 tons since the readout gauge was starting to show
fluctuations in the load indicating that the jack could not hold
higher loads.
Malfunctioning of the jack was again noted when the load
was being released from the hand operated hydraulic pressure
pump. This unit would not allow the load to be released from
the jack despite the hydraulic pressure valve being placed in
the deflated position. Hydraulic fluid was noted to be leaking
from the unit and as a result the unloading portion of the test
could not be undertaken.
The defective hand operated hydraulic pressure pump was
exchanged for a functional one from the equipment supplier
and after the lunch period a second test was conducted on the
same pile. During this test, the hydraulic system functioned
properly, however the increment of loads intended to be
applied in pounds was applied in equivalent kilograms
instead, and hence a load increment thought to be applied in
pounds was approximately 2.2 times the originally intended
load. This load test was taken to 263,000 lbs before the error
was recognized. The unloading test was undertaken in
Paper No. 2.01 5
kilograms. A third test was undertaken after the issue with the
last test was rectified.
FIELDWORK FOR PILE No.2 UNDER PUSHER TRACK
Excavation to locate and expose Pile No. 2 began on April 15.
This pile was exposed the same day and was in alignment
with Pile No. 1 and under the south beam of the pusher track.
The location of this pile is shown in Fig 3. The excavation
was undertaken in almost completely dry conditions since
groundwater was drawdown by pumping from one
compartment to the other within the adjacent Coke Battery
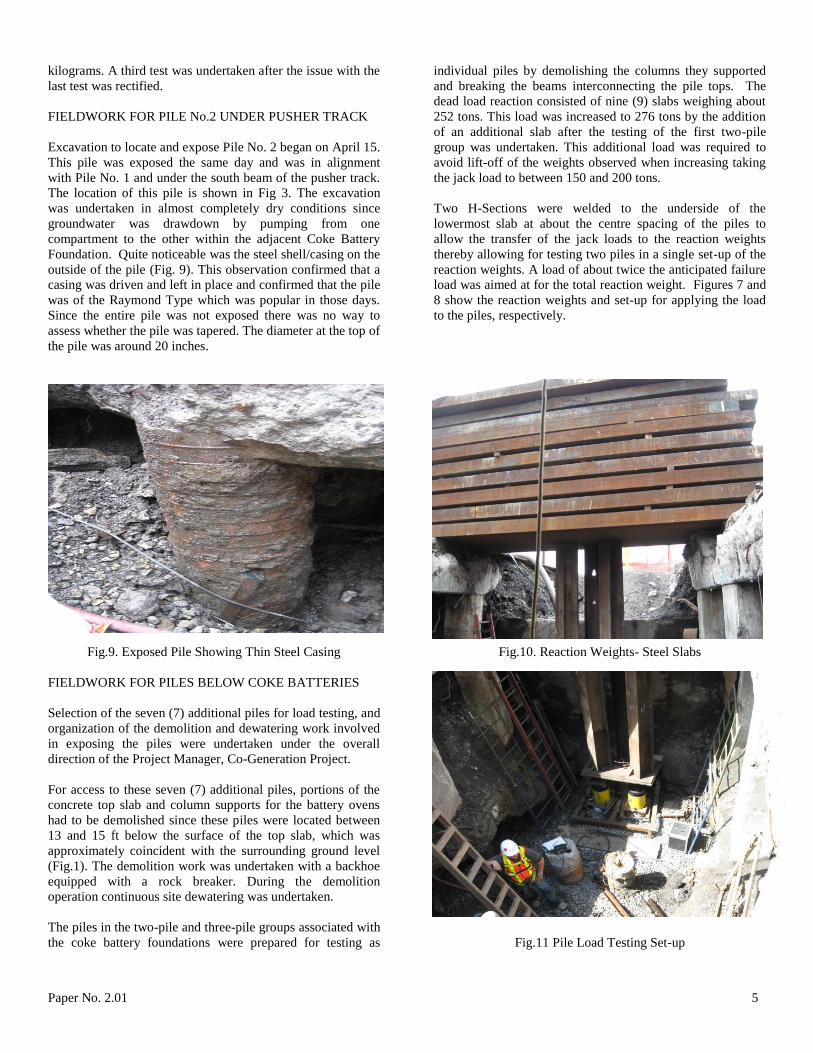
Foundation. Quite noticeable was the steel shell/casing on the
outside of the pile (Fig. 9). This observation confirmed that a
casing was driven and left in place and confirmed that the pile
was of the Raymond Type which was popular in those days.
Since the entire pile was not exposed there was no way to
assess whether the pile was tapered. The diameter at the top of
the pile was around 20 inches.
Fig.9. Exposed Pile Showing Thin Steel Casing
FIELDWORK FOR PILES BELOW COKE BATTERIES
Selection of the seven (7) additional piles for load testing, and
organization of the demolition and dewatering work involved
in exposing the piles were undertaken under the overall
direction of the Project Manager, Co-Generation Project.
For access to these seven (7) additional piles, portions of the
concrete top slab and column supports for the battery ovens
had to be demolished since these piles were located between
13 and 15 ft below the surface of the top slab, which was
approximately coincident with the surrounding ground level
(Fig.1). The demolition work was undertaken with a backhoe
equipped with a rock breaker. During the demolition
operation continuous site dewatering was undertaken.
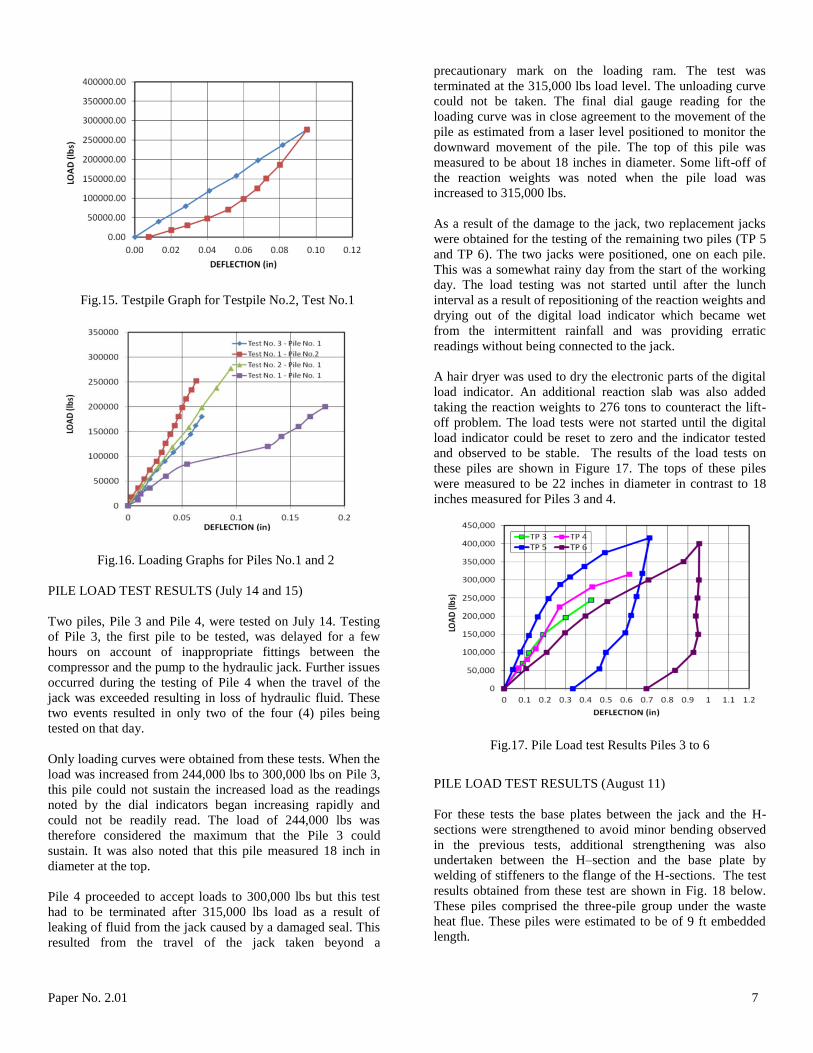
The piles in the two-pile and three-pile groups associated with
the coke battery foundations were prepared for testing as
individual piles by demolishing the columns they supported
and breaking the beams interconnecting the pile tops. The
dead load reaction consisted of nine (9) slabs weighing about
252 tons. This load was increased to 276 tons by the addition
of an additional slab after the testing of the first two-pile
group was undertaken. This additional load was required to
avoid lift-off of the weights observed when increasing taking
the jack load to between 150 and 200 tons.
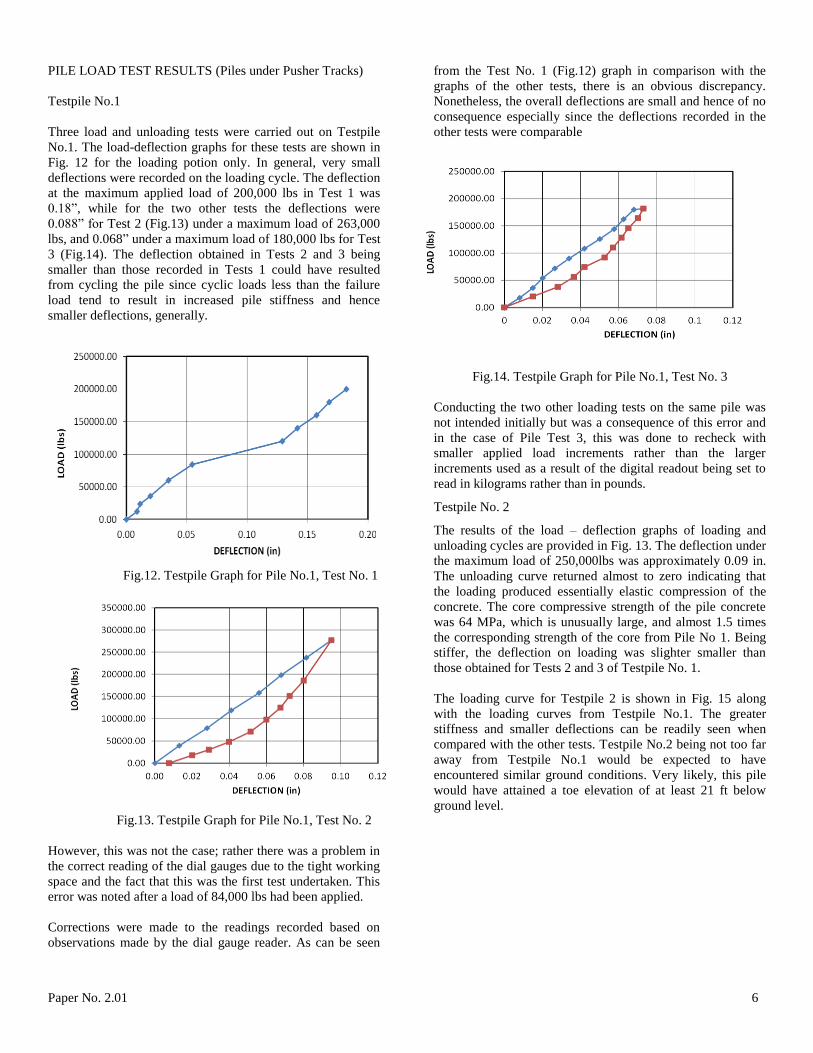
Two H-Sections were welded to the underside of the
lowermost slab at about the centre spacing of the piles to
allow the transfer of the jack loads to the reaction weights
thereby allowing for testing two piles in a single set-up of the
reaction weights. A load of about twice the anticipated failure
load was aimed at for the total reaction weight. Figures 7 and
8 show the reaction weights and set-up for applying the load
to the piles, respectively.
Fig.10. Reaction Weights- Steel Slabs
Fig.11 Pile Load Testing Set-up
Paper No. 2.01 6
PILE LOAD TEST RESULTS (Piles under Pusher Tracks)
Testpile No.1
Three load and unloading tests were carried out on Testpile
No.1. The load-deflection graphs for these tests are shown in
Fig. 12 for the loading potion only. In general, very small
deflections were recorded on the loading cycle. The deflection
at the maximum applied load of 200,000 lbs in Test 1 was
0.18”, while for the two other tests the deflections were
0.088” for Test 2 (Fig.13) under a maximum load of 263,000
lbs, and 0.068” under a maximum load of 180,000 lbs for Test
3 (Fig.14). The deflection obtained in Tests 2 and 3 being
smaller than those recorded in Tests 1 could have resulted
from cycling the pile since cyclic loads less than the failure
load tend to result in increased pile stiffness and hence
smaller deflections, generally.
Fig.12. Testpile Graph for Pile No.1, Test No. 1
Fig.13. Testpile Graph for Pile No.1, Test No. 2
However, this was not the case; rather there was a problem in
the correct reading of the dial gauges due to the tight working
space and the fact that this was the first test undertaken. This
error was noted after a load of 84,000 lbs had been applied.
Corrections were made to the readings recorded based on
observations made by the dial gauge reader. As can be seen
from the Test No. 1 (Fig.12) graph in comparison with the
graphs of the other tests, there is an obvious discrepancy.
Nonetheless, the overall deflections are small and hence of no
consequence especially since the deflections recorded in the
other tests were comparable
Fig.14. Testpile Graph for Pile No.1, Test No. 3
Conducting the two other loading tests on the same pile was
not intended initially but was a consequence of this error and
in the case of Pile Test 3, this was done to recheck with
smaller applied load increments rather than the larger
increments used as a result of the digital readout being set to
read in kilograms rather than in pounds.
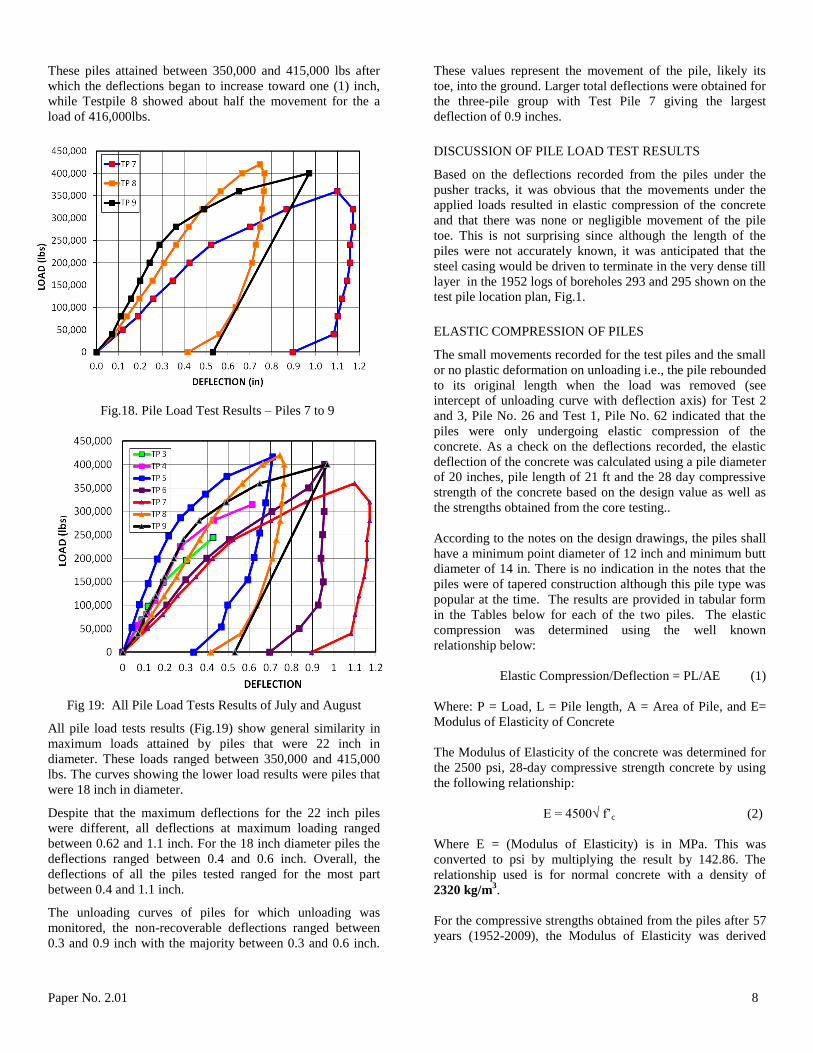
Testpile No. 2
The results of the load – deflection graphs of loading and
unloading cycles are provided in Fig. 13. The deflection under
the maximum load of 250,000lbs was approximately 0.09 in.
The unloading curve returned almost to zero indicating that
the loading produced essentially elastic compression of the
concrete. The core compressive strength of the pile concrete
was 64 MPa, which is unusually large, and almost 1.5 times
the corresponding strength of the core from Pile No 1. Being
stiffer, the deflection on loading was slighter smaller than
those obtained for Tests 2 and 3 of Testpile No. 1.
The loading curve for Testpile 2 is shown in Fig. 15 along
with the loading curves from Testpile No.1. The greater
stiffness and smaller deflections can be readily seen when
compared with the other tests. Testpile No.2 being not too far
away from Testpile No.1 would be expected to have
encountered similar ground conditions. Very likely, this pile
would have attained a toe elevation of at least 21 ft below
ground level.
Paper No. 2.01 7
Fig.15. Testpile Graph for Testpile No.2, Test No.1
Fig.16. Loading Graphs for Piles No.1 and 2
PILE LOAD TEST RESULTS (July 14 and 15)
Two piles, Pile 3 and Pile 4, were tested on July 14. Testing
of Pile 3, the first pile to be tested, was delayed for a few
hours on account of inappropriate fittings between the
compressor and the pump to the hydraulic jack. Further issues
occurred during the testing of Pile 4 when the travel of the
jack was exceeded resulting in loss of hydraulic fluid. These
two events resulted in only two of the four (4) piles being
tested on that day.
Only loading curves were obtained from these tests. When the
load was increased from 244,000 lbs to 300,000 lbs on Pile 3,
this pile could not sustain the increased load as the readings
noted by the dial indicators began increasing rapidly and
could not be readily read. The load of 244,000 lbs was
therefore considered the maximum that the Pile 3 could
sustain. It was also noted that this pile measured 18 inch in
diameter at the top.
Pile 4 proceeded to accept loads to 300,000 lbs but this test
had to be terminated after 315,000 lbs load as a result of
leaking of fluid from the jack caused by a damaged seal. This
resulted from the travel of the jack taken beyond a
precautionary mark on the loading ram. The test was
terminated at the 315,000 lbs load level. The unloading curve
could not be taken. The final dial gauge reading for the
loading curve was in close agreement to the movement of the
pile as estimated from a laser level positioned to monitor the
downward movement of the pile. The top of this pile was
measured to be about 18 inches in diameter. Some lift-off of
the reaction weights was noted when the pile load was
increased to 315,000 lbs.
As a result of the damage to the jack, two replacement jacks
were obtained for the testing of the remaining two piles (TP 5
and TP 6). The two jacks were positioned, one on each pile.
This was a somewhat rainy day from the start of the working
day. The load testing was not started until after the lunch
interval as a result of repositioning of the reaction weights and
drying out of the digital load indicator which became wet
from the intermittent rainfall and was providing erratic
readings without being connected to the jack.
A hair dryer was used to dry the electronic parts of the digital
load indicator. An additional reaction slab was also added
taking the reaction weights to 276 tons to counteract the lift-
off problem. The load tests were not started until the digital
load indicator could be reset to zero and the indicator tested
and observed to be stable. The results of the load tests on
these piles are shown in Figure 17. The tops of these piles
were measured to be 22 inches in diameter in contrast to 18
inches measured for Piles 3 and 4.
Fig.17. Pile Load test Results Piles 3 to 6
PILE LOAD TEST RESULTS (August 11)
For these tests the base plates between the jack and the H-
sections were strengthened to avoid minor bending observed
in the previous tests, additional strengthening was also
undertaken between the H–section and the base plate by
welding of stiffeners to the flange of the H-sections. The test
results obtained from these test are shown in Fig. 18 below.
These piles comprised the three-pile group under the waste
heat flue. These piles were estimated to be of 9 ft embedded
length.
Paper No. 2.01 8
These piles attained between 350,000 and 415,000 lbs after
which the deflections began to increase toward one (1) inch,
while Testpile 8 showed about half the movement for the a
load of 416,000lbs.
Fig.18. Pile Load Test Results – Piles 7 to 9
Fig 19: All Pile Load Tests Results of July and August
All pile load tests results (Fig.19) show general similarity in
maximum loads attained by piles that were 22 inch in
diameter. These loads ranged between 350,000 and 415,000
lbs. The curves showing the lower load results were piles that
were 18 inch in diameter.
Despite that the maximum deflections for the 22 inch piles
were different, all deflections at maximum loading ranged
between 0.62 and 1.1 inch. For the 18 inch diameter piles the
deflections ranged between 0.4 and 0.6 inch. Overall, the
deflections of all the piles tested ranged for the most part
between 0.4 and 1.1 inch.
The unloading curves of piles for which unloading was
monitored, the non-recoverable deflections ranged between
0.3 and 0.9 inch with the majority between 0.3 and 0.6 inch.
These values represent the movement of the pile, likely its
toe, into the ground. Larger total deflections were obtained for
the three-pile group with Test Pile 7 giving the largest
deflection of 0.9 inches.
DISCUSSION OF PILE LOAD TEST RESULTS
Based on the deflections recorded from the piles under the
pusher tracks, it was obvious that the movements under the
applied loads resulted in elastic compression of the concrete
and that there was none or negligible movement of the pile
toe. This is not surprising since although the length of the
piles were not accurately known, it was anticipated that the
steel casing would be driven to terminate in the very dense till
layer in the 1952 logs of boreholes 293 and 295 shown on the
test pile location plan, Fig.1.
ELASTIC COMPRESSION OF PILES
The small movements recorded for the test piles and the small
or no plastic deformation on unloading i.e., the pile rebounded
to its original length when the load was removed (see
intercept of unloading curve with deflection axis) for Test 2
and 3, Pile No. 26 and Test 1, Pile No. 62 indicated that the
piles were only undergoing elastic compression of the
concrete. As a check on the deflections recorded, the elastic
deflection of the concrete was calculated using a pile diameter
of 20 inches, pile length of 21 ft and the 28 day compressive
strength of the concrete based on the design value as well as
the strengths obtained from the core testing..
According to the notes on the design drawings, the piles shall
have a minimum point diameter of 12 inch and minimum butt
diameter of 14 in. There is no indication in the notes that the
piles were of tapered construction although this pile type was
popular at the time. The results are provided in tabular form
in the Tables below for each of the two piles. The elastic
compression was determined using the well known
relationship below:
Elastic Compression/Deflection = PL/AE (1)
Where: P = Load, L = Pile length, A = Area of Pile, and E=
Modulus of Elasticity of Concrete
The Modulus of Elasticity of the concrete was determined for
the 2500 psi, 28-day compressive strength concrete by using
the following relationship:
E = 4500√ f’c (2)
Where E = (Modulus of Elasticity) is in MPa. This was
converted to psi by multiplying the result by 142.86. The
relationship used is for normal concrete with a density of
2320 kg/m3.
For the compressive strengths obtained from the piles after 57
years (1952-2009), the Modulus of Elasticity was derived
Paper No. 2.01 9
using the following relationship:
E=0.043yc1.5
√f’c (3)
Where E is MPa, yc is the density of concrete, and f’c is the
compressive strength of concrete. The density of concrete for
Pile No. 1 was 2418 kg /m3.
The defections obtained using the compressive strength of the
cores was generally smaller than those with the design
compressive strength and almost one half of the measured
values from the pile load test. The smaller deflections
obtained using the larger Modulus of Elasticity values are to
be expected. The slightly larger deflection obtained when the
maximum load was increased to 263,000 lbs for Test 2, pile
No.1 is an indication that the test was proceeding to a failure
zone. This is judged since there is a small residual strain when
the loads were removed incrementally. Note in comparison
Test No. 3 showed full elastic behaviour as there was no
residual strain on off-loading. Hence, one can assume that less
than around 180,000 lbs, the piles are expected to behave
elastically.
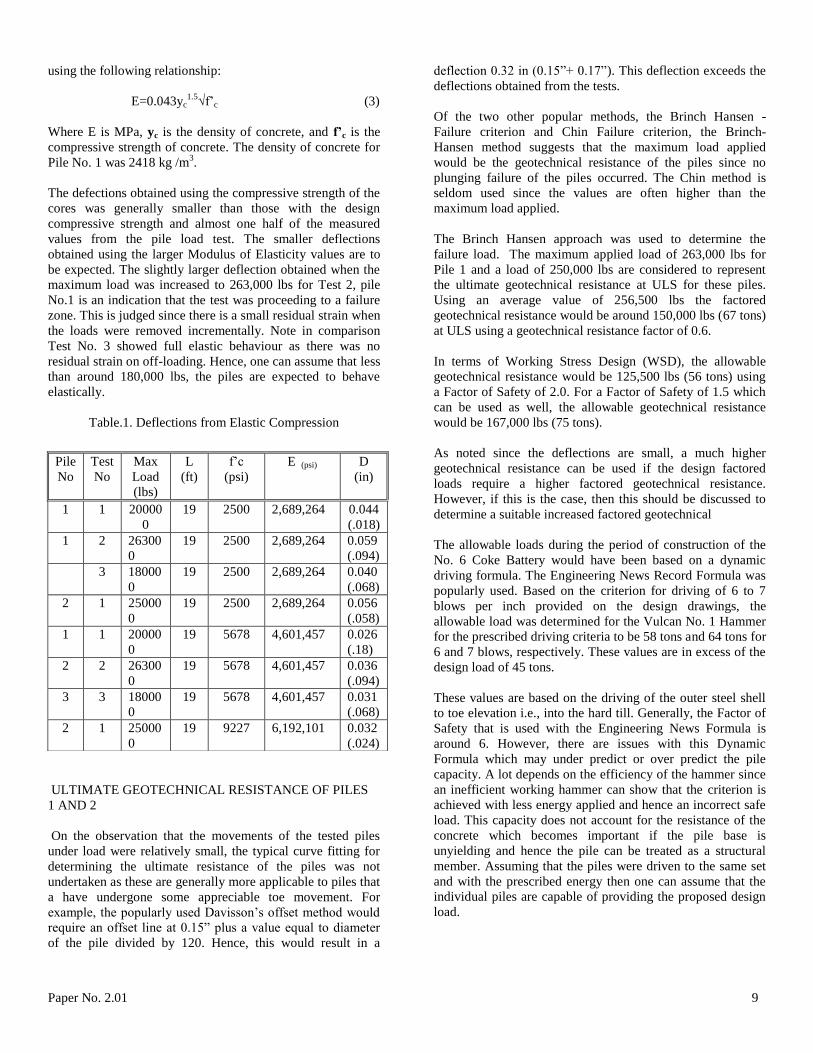
Table.1. Deflections from Elastic Compression
ULTIMATE GEOTECHNICAL RESISTANCE OF PILES
1 AND 2
On the observation that the movements of the tested piles
under load were relatively small, the typical curve fitting for
determining the ultimate resistance of the piles was not
undertaken as these are generally more applicable to piles that
a have undergone some appreciable toe movement. For
example, the popularly used Davisson’s offset method would
require an offset line at 0.15” plus a value equal to diameter
of the pile divided by 120. Hence, this would result in a
deflection 0.32 in (0.15”+ 0.17”). This deflection exceeds the
deflections obtained from the tests.
Of the two other popular methods, the Brinch Hansen -
Failure criterion and Chin Failure criterion, the Brinch-
Hansen method suggests that the maximum load applied
would be the geotechnical resistance of the piles since no
plunging failure of the piles occurred. The Chin method is
seldom used since the values are often higher than the
maximum load applied.
The Brinch Hansen approach was used to determine the
failure load. The maximum applied load of 263,000 lbs for
Pile 1 and a load of 250,000 lbs are considered to represent
the ultimate geotechnical resistance at ULS for these piles.
Using an average value of 256,500 lbs the factored
geotechnical resistance would be around 150,000 lbs (67 tons)
at ULS using a geotechnical resistance factor of 0.6.
In terms of Working Stress Design (WSD), the allowable
geotechnical resistance would be 125,500 lbs (56 tons) using
a Factor of Safety of 2.0. For a Factor of Safety of 1.5 which
can be used as well, the allowable geotechnical resistance
would be 167,000 lbs (75 tons).
As noted since the deflections are small, a much higher
geotechnical resistance can be used if the design factored
loads require a higher factored geotechnical resistance.
However, if this is the case, then this should be discussed to
determine a suitable increased factored geotechnical
The allowable loads during the period of construction of the
No. 6 Coke Battery would have been based on a dynamic
driving formula. The Engineering News Record Formula was
popularly used. Based on the criterion for driving of 6 to 7
blows per inch provided on the design drawings, the
allowable load was determined for the Vulcan No. 1 Hammer
for the prescribed driving criteria to be 58 tons and 64 tons for
6 and 7 blows, respectively. These values are in excess of the
design load of 45 tons.
These values are based on the driving of the outer steel shell
to toe elevation i.e., into the hard till. Generally, the Factor of
Safety that is used with the Engineering News Formula is
around 6. However, there are issues with this Dynamic
Formula which may under predict or over predict the pile
capacity. A lot depends on the efficiency of the hammer since
an inefficient working hammer can show that the criterion is
achieved with less energy applied and hence an incorrect safe
load. This capacity does not account for the resistance of the
concrete which becomes important if the pile base is
unyielding and hence the pile can be treated as a structural
member. Assuming that the piles were driven to the same set
and with the prescribed energy then one can assume that the
individual piles are capable of providing the proposed design
load.
Pile
No
Test
No
Max
Load
(lbs)
L
(ft)
f’c
(psi)
E (psi)
D
(in)
1 1 20000
0
19 2500 2,689,264 0.044
(.018)
1 2 26300
0
19 2500 2,689,264 0.059
(.094)
3 18000
0
19 2500 2,689,264 0.040
(.068)
2 1 25000
0
19 2500 2,689,264 0.056
(.058)
1 1 20000
0
19 5678 4,601,457 0.026
(.18)
2 2 26300
0
19 5678 4,601,457 0.036
(.094)
3 3 18000
0
19 5678 4,601,457 0.031
(.068)
2 1 25000
0
19 9227 6,192,101 0.032
(.024)
Paper No. 2.01 10
ULTIMATE GEOTECHNICAL RESISTANCE OF PILES 3
TO 9
The maximum loads on the pile-movement graphs were taken
to represent the failure loads of the piles since it was generally
observed that for piles taken to 400,000 lbs and larger the dial
indicators showed substantial increased movements. For the
last three piles tested in August 11, the movements of these
piles recorded by the dial indicators were visually checked
against movement of the pile using a laser beam. The change
in the position of the laser beam location between the
beginning and end of a test was found to be generally of the
same order and hence the load curves obtained are felt to be
realistic and curves reliable to be used for design purposes.
The geotechnical resistances, which represent the ultimate
resistance of the piles, are summarized in the Table 1. A
factor of 2240 lbs per ton was used in converting pounds to
tons.
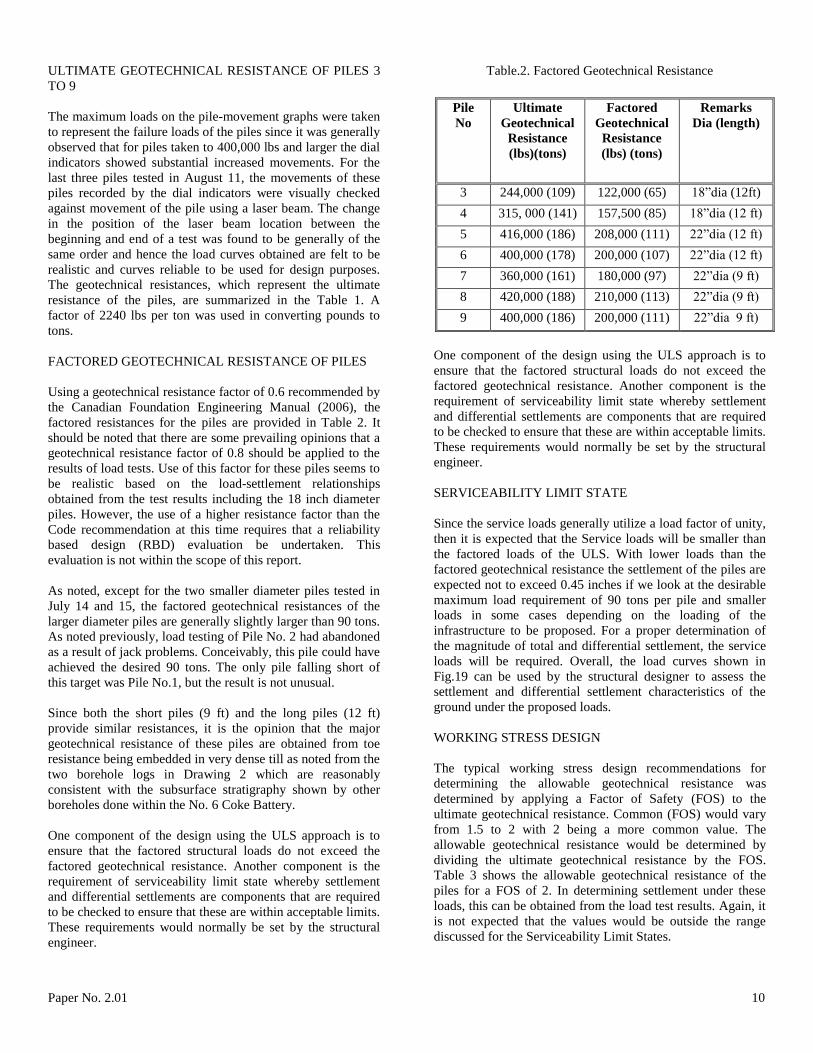
FACTORED GEOTECHNICAL RESISTANCE OF PILES
Using a geotechnical resistance factor of 0.6 recommended by
the Canadian Foundation Engineering Manual (2006), the
factored resistances for the piles are provided in Table 2. It
should be noted that there are some prevailing opinions that a
geotechnical resistance factor of 0.8 should be applied to the
results of load tests. Use of this factor for these piles seems to
be realistic based on the load-settlement relationships
obtained from the test results including the 18 inch diameter
piles. However, the use of a higher resistance factor than the
Code recommendation at this time requires that a reliability
based design (RBD) evaluation be undertaken. This
evaluation is not within the scope of this report.
As noted, except for the two smaller diameter piles tested in
July 14 and 15, the factored geotechnical resistances of the
larger diameter piles are generally slightly larger than 90 tons.
As noted previously, load testing of Pile No. 2 had abandoned
as a result of jack problems. Conceivably, this pile could have
achieved the desired 90 tons. The only pile falling short of
this target was Pile No.1, but the result is not unusual.
Since both the short piles (9 ft) and the long piles (12 ft)
provide similar resistances, it is the opinion that the major
geotechnical resistance of these piles are obtained from toe
resistance being embedded in very dense till as noted from the
two borehole logs in Drawing 2 which are reasonably
consistent with the subsurface stratigraphy shown by other
boreholes done within the No. 6 Coke Battery.
One component of the design using the ULS approach is to
ensure that the factored structural loads do not exceed the
factored geotechnical resistance. Another component is the
requirement of serviceability limit state whereby settlement
and differential settlements are components that are required
to be checked to ensure that these are within acceptable limits.
These requirements would normally be set by the structural
engineer.
Table.2. Factored Geotechnical Resistance
One component of the design using the ULS approach is to
ensure that the factored structural loads do not exceed the
factored geotechnical resistance. Another component is the
requirement of serviceability limit state whereby settlement
and differential settlements are components that are required
to be checked to ensure that these are within acceptable limits.
These requirements would normally be set by the structural
engineer.
SERVICEABILITY LIMIT STATE
Since the service loads generally utilize a load factor of unity,
then it is expected that the Service loads will be smaller than
the factored loads of the ULS. With lower loads than the
factored geotechnical resistance the settlement of the piles are
expected not to exceed 0.45 inches if we look at the desirable
maximum load requirement of 90 tons per pile and smaller
loads in some cases depending on the loading of the
infrastructure to be proposed. For a proper determination of
the magnitude of total and differential settlement, the service
loads will be required. Overall, the load curves shown in
Fig.19 can be used by the structural designer to assess the
settlement and differential settlement characteristics of the
ground under the proposed loads.
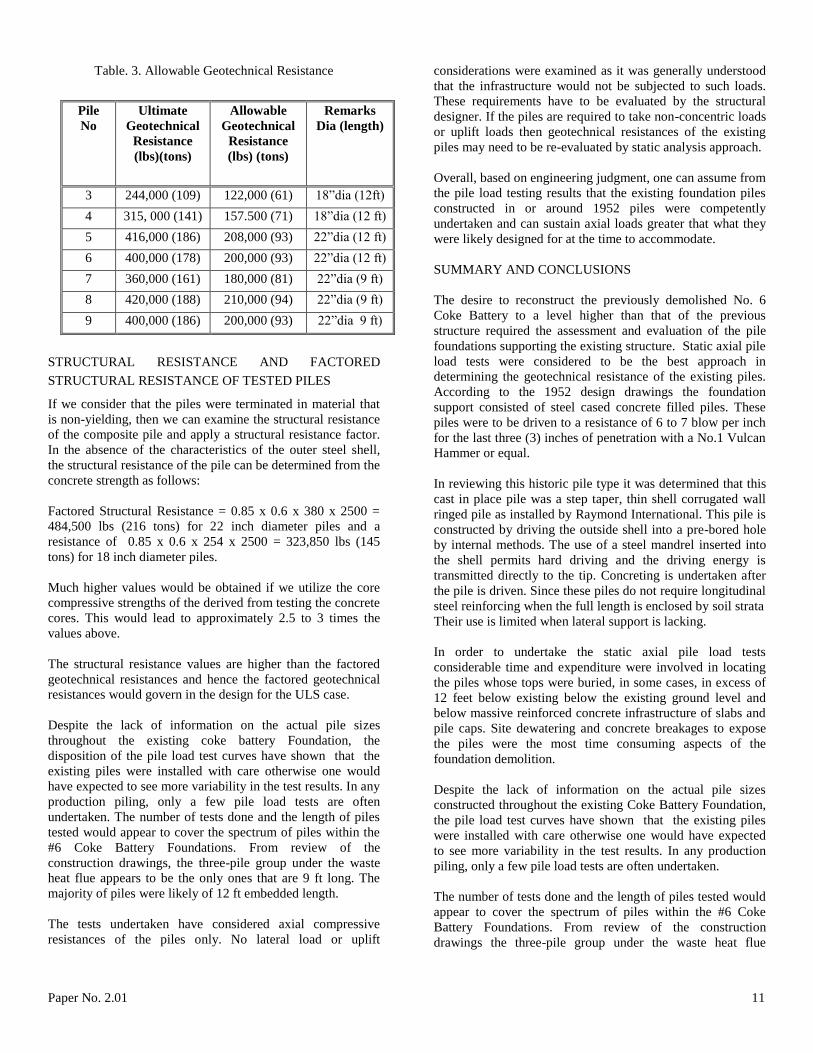
WORKING STRESS DESIGN
The typical working stress design recommendations for
determining the allowable geotechnical resistance was
determined by applying a Factor of Safety (FOS) to the
ultimate geotechnical resistance. Common (FOS) would vary
from 1.5 to 2 with 2 being a more common value. The
allowable geotechnical resistance would be determined by
dividing the ultimate geotechnical resistance by the FOS.
Table 3 shows the allowable geotechnical resistance of the
piles for a FOS of 2. In determining settlement under these
loads, this can be obtained from the load test results. Again, it
is not expected that the values would be outside the range
discussed for the Serviceability Limit States.
Pile
No
Ultimate
Geotechnical
Resistance
(lbs)(tons)
Factored
Geotechnical
Resistance
(lbs) (tons)
Remarks
Dia (length)
3 244,000 (109) 122,000 (65) 18”dia (12ft)
4 315, 000 (141) 157,500 (85) 18”dia (12 ft)
5 416,000 (186) 208,000 (111) 22”dia (12 ft)
6 400,000 (178) 200,000 (107) 22”dia (12 ft)
7 360,000 (161) 180,000 (97) 22”dia (9 ft)
8 420,000 (188) 210,000 (113) 22”dia (9 ft)
9 400,000 (186) 200,000 (111) 22”dia 9 ft)
Paper No. 2.01 11
Table. 3. Allowable Geotechnical Resistance
STRUCTURAL RESISTANCE AND FACTORED
STRUCTURAL RESISTANCE OF TESTED PILES
If we consider that the piles were terminated in material that
is non-yielding, then we can examine the structural resistance
of the composite pile and apply a structural resistance factor.
In the absence of the characteristics of the outer steel shell,
the structural resistance of the pile can be determined from the
concrete strength as follows:
Factored Structural Resistance = 0.85 x 0.6 x 380 x 2500 =
484,500 lbs (216 tons) for 22 inch diameter piles and a
resistance of 0.85 x 0.6 x 254 x 2500 = 323,850 lbs (145
tons) for 18 inch diameter piles.
Much higher values would be obtained if we utilize the core
compressive strengths of the derived from testing the concrete
cores. This would lead to approximately 2.5 to 3 times the
values above.
The structural resistance values are higher than the factored
geotechnical resistances and hence the factored geotechnical
resistances would govern in the design for the ULS case.
Despite the lack of information on the actual pile sizes
throughout the existing coke battery Foundation, the
disposition of the pile load test curves have shown that the
existing piles were installed with care otherwise one would
have expected to see more variability in the test results. In any
production piling, only a few pile load tests are often
undertaken. The number of tests done and the length of piles
tested would appear to cover the spectrum of piles within the
#6 Coke Battery Foundations. From review of the
construction drawings, the three-pile group under the waste
heat flue appears to be the only ones that are 9 ft long. The
majority of piles were likely of 12 ft embedded length.
The tests undertaken have considered axial compressive
resistances of the piles only. No lateral load or uplift
considerations were examined as it was generally understood
that the infrastructure would not be subjected to such loads.
These requirements have to be evaluated by the structural
designer. If the piles are required to take non-concentric loads
or uplift loads then geotechnical resistances of the existing
piles may need to be re-evaluated by static analysis approach.
Overall, based on engineering judgment, one can assume from
the pile load testing results that the existing foundation piles
constructed in or around 1952 piles were competently
undertaken and can sustain axial loads greater that what they
were likely designed for at the time to accommodate.
SUMMARY AND CONCLUSIONS
The desire to reconstruct the previously demolished No. 6
Coke Battery to a level higher than that of the previous
structure required the assessment and evaluation of the pile
foundations supporting the existing structure. Static axial pile
load tests were considered to be the best approach in
determining the geotechnical resistance of the existing piles.
According to the 1952 design drawings the foundation
support consisted of steel cased concrete filled piles. These
piles were to be driven to a resistance of 6 to 7 blow per inch
for the last three (3) inches of penetration with a No.1 Vulcan
Hammer or equal.
In reviewing this historic pile type it was determined that this
cast in place pile was a step taper, thin shell corrugated wall
ringed pile as installed by Raymond International. This pile is
constructed by driving the outside shell into a pre-bored hole
by internal methods. The use of a steel mandrel inserted into
the shell permits hard driving and the driving energy is
transmitted directly to the tip. Concreting is undertaken after
the pile is driven. Since these piles do not require longitudinal
steel reinforcing when the full length is enclosed by soil strata
Their use is limited when lateral support is lacking.
In order to undertake the static axial pile load tests
considerable time and expenditure were involved in locating
the piles whose tops were buried, in some cases, in excess of
12 feet below existing below the existing ground level and
below massive reinforced concrete infrastructure of slabs and
pile caps. Site dewatering and concrete breakages to expose
the piles were the most time consuming aspects of the
foundation demolition.
Despite the lack of information on the actual pile sizes
constructed throughout the existing Coke Battery Foundation,
the pile load test curves have shown that the existing piles
were installed with care otherwise one would have expected
to see more variability in the test results. In any production
piling, only a few pile load tests are often undertaken.
The number of tests done and the length of piles tested would
appear to cover the spectrum of piles within the #6 Coke
Battery Foundations. From review of the construction
drawings the three-pile group under the waste heat flue
Pile
No
Ultimate
Geotechnical
Resistance
(lbs)(tons)
Allowable
Geotechnical
Resistance
(lbs) (tons)
Remarks
Dia (length)
3 244,000 (109) 122,000 (61) 18”dia (12ft)
4 315, 000 (141) 157.500 (71) 18”dia (12 ft)
5 416,000 (186) 208,000 (93) 22”dia (12 ft)
6 400,000 (178) 200,000 (93) 22”dia (12 ft)
7 360,000 (161) 180,000 (81) 22”dia (9 ft)
8 420,000 (188) 210,000 (94) 22”dia (9 ft)
9 400,000 (186) 200,000 (93) 22”dia 9 ft)
Paper No. 2.01 12
appears to be the only ones that are 9 ft long. The majority of
piles would likely have been embedded 12 ft.
The tests undertaken have considered axial compressive
resistances of the piles only. No lateral load or uplift
considerations were examined as it was generally understood
that the infrastructure would not be subjected to such loads.
However, these requirements have to be evaluated by the
structural designer. If the piles are required to take eccentric
loads or uplift loads then geotechnical resistances of the
existing piles may need to be re-evaluated by static analysis
approach.
Overall, based on engineering judgment, one can assume from
the pile load testing results that the existing foundation piles
constructed in or around 1952 piles were competently
undertaken and can sustain axial loads greater that what they
were likely designed for at the time to accommodate.
This case study demonstrates the difficulties that could arise
in testing and evaluating historic foundations and the need to
have some forward thinking in the design and construction of
new infrastructure so that substructure elements can be readily
tested and evaluated in time.
The re-use of foundations should be considered both when
installing new foundations or re-using existing foundations.
To future-proof these foundations they need to be documented
and an understanding of their behaviour gathered. A
documentation system needs to be developed to record all the
necessary data to enable a foundation to be re-used and new
‘smart’ instrumentation that can monitor a building’s
behaviour during its life thereby demonstrating the foundation
behaviour and its potential for re-use. Much of this type of
work has been initiated in 2003 by the European Community
under project “RuFUS” (Re-use of Foundations for Urban
Sites).
REFERENCES
Canadian Foundation Engineering Manual, 4th Edition, 2006
Seelye, E.E, [1960]. “Data Book For Civil Engineers” Design,
Volume 1, Third Edition. John Wiley and Sons, Inc New
York, London, Sydney. Section 7-15.
Tomlinson, M.J. [1986]. “Foundation Design and
Construction”, Fifth Edition, Longman Group Ltd, Longman
House, Burnt Mill, Harlow Essex, CM 20 2JE, pp 557-558.
ACKNOWLEDGEMENTS
The author wishes to express his appreciation to Mr. Jason
Khan (Architectural Student) for drafting the figures
contained in this paper.