Embed Size (px)
Citation preview

Full paper submitted to 19th European Regional ITS Conference Luiss Guido Carli University, Rome, 18-20 September 2008
Title:
Operator Cooperation as a Competitive Advantage for Provisioning of Low Cost High Capacity Mobile Broad band Services
Jan Markendahl Wireless@KTH
Royal Institute of Technology Electrum 418
S-164 40 Kista Sweden
[email protected] phone: + 46 70 663 01 63
Jan Werding Wireless@KTH
Royal Institute of Technology Electrum 418
S-164 40 Kista Sweden
[email protected] phone: + 46 70 491 32 61
Petteri Pöyhönen Nokia Siemens Networks
Itämerenkatu 11-13 00180 Helsinki
Finland [email protected]
Ove Strandberg Nokia Siemens Networks
Itämerenkatu 11-13 00180 Helsinki
Finland [email protected]

Operator Cooperation as a Competitive Advantage for Provisioning of Low Cost High Capacity
Mobile Broad band Services
Abstract
Operator utility is related to expected profits, risks and strategic issues. In this paper we focus on the potential change in operator utility from network cooperation. If network cooperation would increase operator utility significantly, that would be an important driver of cooperation.
We show that the most important effect of network cooperation would be increased user utility, which in turn is shown to have significant impact on operator utility. The user utility is compared without and with cooperation between mobile operators. The user utility is expressed as a User Satisfaction Index (USI) which is depending on the service availability, service quality and the price.
Cooperation in the form of sharing of network resources is usually seen as a way to share costs and risk for network deployment. However, there are other operator benefits:
- improved network utilization and increased traffic which may increase the revenues
- improved user satisfaction due to improved service availability and quality
The network related property of cooperation to reduce the number of disconnected users is transformed into a higher degree of user satisfaction. This would most likely result in more loyal customers and hence the churn would be reduced.
In this paper we discuss the implications of the increased user satisfaction on operator costs for customer acquisition and management. We see business opportunities for mobile operators leading to cost savings and changes in the cost structure.

I. Introduction
Cooperation between wireless operators is usually seen as means to reduce network costs. This approach has been one of the major drivers of different network sharing initiatives. Network sharing derives benefits from hardware scale economic effects. It may be efficiently implemented mainly in green field and other significant build out situations based on same or similar technologies.
Network sharing however, does generally not involve cooperative use of the air interface through some type of common radio resource management (RRM). Recent research projects like Ambient Networks [1], have investigated the advantages of cooperation between networks and operators . According to the Ambient Networks vision “any” user should be able to connect to “any” network at “any” time [2]. This requires new types of cooperation, which should be more dynamic and flexible compared to the more long term and “static” cooperation represented by network sharing [3]. Flexible roaming between networks and operators is a key characteristic of the proposed Ambient Network architecture. Extensive cooperation is supported both in the technical and the business domain. The benefits of cooperation can be described in terms of both technical and business aspects. Increased coverage and reliability of networks will result in improved service availability for end-users. Hence, we can expect end-users to be more satisfied and it is likely that fewer customers would consider switching operator.
Network cooperation
Cooperative use of the air interface could be organized in different ways ranging from fully integrated RRM between different operators’ networks to possibilities for the user to roam locally according to individual needs. It may be implemented between existing networks with different technologies.
Future mobile communication markets may contain networks with different radio access technologies with different characteristics, such as GSM/EDGE, WCDMA, LTE, CDMA, WiMax or WiFi as well as macro, micro, pico and femto applications of those technologies.
Many studies have demonstrated that cooperative use of the air interface offer significant technical performance advantages compared to separate operation of each network, see next section about the FP6 projects, Ambient Networks, Everest and Aroma. Contributions to performance derive from better trunking efficiency, improved coverage, better capacity utilization, improved quality of service (QoS) etc.
Cooperative use of networks with different properties offer additional improvements compared to RRM within the same technology. Comparative advantage adds to performance in the operation of mobile services with different requirements on throughput, latency, bit error rate etc. This means e.g. that cooperation between a GSM and a UMTS network will be beneficial for both parties even if GSM is inferior in all aspects. The requirement is only that GSM is relatively better e.g. in voice compared to data services.
Network cooperation derives benefits from the differences between characteristics of the networks as well as the user service demand of the partners. Cooperation between networks with different coverage will e.g. result in improved availability for all users.

Network cooperation effects
Network sharing will result in lower costs for the cooperating partners. Such lower costs may or may not result in lower prices for the users.
Network cooperation may in addition result in a wide spectrum of advantages for both the users and the operators. For the users the cooperation will lead to an increased availability and perceived service quality and hence more satisfied users. This may lead to increased usage as well as willingness to pay for the services and hence potentially more revenues. More satisfied users will be more loyal to the operator and hence cost related to churn may be reduced. Additionally, a happier customer base can also attract new business partners like new advertisers.
Our starting point is that network cooperation has a large potential for improving usage and pricing as well as user satisfaction and customer loyalty. The need for expenditures in marketing and sales to counteract churn could be reduced. Although the costs for network build out and operation are high, other types of costs are equally important. Customer related costs, i.e. marketing & sales, customer care and billing, are often higher than the network costs, see figure 1.
Cost structure of US mobile operators 2002 - 04
0%
5%
10%
15%
20%
25%
30%
35%
40%
Network opex and depreciation Customer acquisition costs Administration and customersupport
Opex DepreciationSource: Operator reports
Figure 1: Cost structure of US mobile Operators 2002 – 2004 (by Werding, 2005, [4])
The operator challenge
The underlying networking issue, according to operators and vendors, is the optimization of costs and performance. The problem has however become increasingly difficult during the last decade. Traffic has grown significantly and has become more and more concentrated to in-door locations and more differentiated among users. This development is expected to continue. Demand for broad-band data services is expected to increase tremendously going forward.
The mobile communications industry also communicates a fairly uniform view of the business challenge. Revenues from mobile voice are expected to decline. Operators will have to compensate with new revenues and cost reduction. Increased revenues will have to come from non-voice services, from bundling and other means to increase total communications market shares. Attractive new services are expected to require significantly increased capacity as well as bandwidth and QoS. Indoor coverage and capacity in most countries is not sufficient. Significant build out of the network capacity in order to satisfy the increased demand of mobile data services will require huge investments. The operators will face a challenge since the mobile data services are offered using (quite competitive) flat rate subscriptions. Hence, increased usage (and traffic) will not result in more revenues – this is a different business situation compared to to traditional voice services. As a result, Solutions with very low CAPEX and OPEX will be of very high importance.
Customer and user aspects
Since operators also “invest” in customers and customer relations, it is of very high importance to keep the customers. Satisfied and loyal customers are equally important as networks with good coverage and availability. Ofcom has presented a number of reports on “the consumer experience” that provide a very good insight in consumer behaviour and the basis for decision making [30][31][32]. The recent studies include fixed and mobile voice, fixed broadband and TV services. When it comes to reasons for switching or considering switching of operator the three major components are: pricing, quality of services and customer services. These findings will be further described in the section on related work.
Research questions
The aim of this paper is to further investigate the effects of network cooperation on operators’ technological and business performance and to identify potential drivers of future collaboration between operators. A key issue is to investigate what benefits of network cooperation that can be expected when it comes to customer satisfaction and loyalty. We will describe performance metrics for “cooperation benefits” and discuss how to capture the influences of pricing methods and how user satisfaction influences costs related to churn.
The general research question is: Which are the potentials of network cooperation to induce future collaboration between operators? We have in more detail investigated
• Under which circumstances will network cooperation increase service quality?
• How will customer satisfaction influence operators’ business performance?
• How may an efficient cooperation strategy be designed?
Outline of the paper
Related work is described in section two. In section three the methodology and the different performance metrics are described. The next section contains performance results describing the benefits of cooperation, both from an end-user and an operator perspective. Next, we will discuss different operators’ incentives to cooperate. In section six possible extensions of the performance metrics will be discussed. Section seven contains a summary.

2. Related and previous work Network cooperation The integrated EU project Ambient Networks (AN) proposes a framework for dynamic
cooperation between networks and business entities called network composition [1][5].This type of cooperation includes both business and technical aspects [6]. Each relation is described with a Composition Agreement (CA) between the networks/ operators or between the user terminal and the network One part of the AN project is focused on Multi Radio Architecture (MRA) where cooperation between different types of Radio Access Technology (RATs) is considered [7][8]. One example is design of strategies and algorithms for Radio Resource Management (RRM) for joint control of heterogeneous radio access networks, e.g. WLAN, GSM and UMTS.
Ambient Networks is not the only project that focuses on cooperation and joint use of network resources. In the FP5 project Monasidre a service and network resource management platform was developed focusing on a radio environment with UMTS, HIPERLAN-2 and DVB-T[9]. The FP6 projects Everest and Aroma have focused on strategies for efficient radio resources management in heterogeneous networks for support of end-to-end QoS [10][11]. For both these project “Common RRM” has been a key feature for the management of radio access technologies in GERAN, UTRAN (including HSPA) and WLAN and WIMAX. The Aroma project also included techno-economic evaluation of micro-cell and WLAN usage within 3G networks. However, in the AN project a strong focus has been on multi-radio and multi-operator aspects, i.e. cooperation between operators has been a key issue.
We must however remember that some forms of cooperation between operators have existed for many years. International and national roaming are well known examples. Inter-working between WLAN and cellular systems is an example where different Radio Access Technologies (RATs) are involved [12] . When 3G systems were introduced in Europe after year 2000 cooperation between 2G and 3G networks were needed and in some countries operators started to deploy and operate “shared networks” [13]. Hence, cooperation between operators and networks is not “new”. One of the innovations with the AN concepts is that the cooperation between operators can be dynamic and flexible, e.g. roaming between different local or national networks is possible without pre-negotiated agreements.
End-user perception of price and service quality The authors of this paper have proposed use of a set of performance metrics as a tool to
measure user and operator satisfaction in network cooperation compared to single operator networks. A User Satisfaction Index (USI) is calculated based on the radio related parameters, e.g. the number of connected mobile nodes [15]. The USI takes into account both the service quality, availability and the price [16][17]. Simulation results showed that cooperation provides benefits for both users and operators, see more in section 4. For the modeling and analysis of the user experience we have used and extended the approach proposed by Pohjola & Kilkki[18]. The model and assumptions on user perception and rating of service quality are based on the findings by Twersky & Kahneman [19].

The behavioral economics proposed by Twersky & Kahneman has also been used by Mitomo et al [20] for analysis of consumer preferences for flat rate. Papers have been presented analyzing both mobile phone services and media access. Lambrecht & Skiera [21] have investigated consumer behavior related to flat rate charging schemes for internet services. One major issue is to analyze the impact of the “flat-rate bias” and “per-per use bias”. In summary, the flat rate bias means that people may prefer flat rate even though they may not save money compared with a pay-per-use payment scheme. Lambrecht & Skiera show that that the pay-per-use bias “largely increase churn so that in the long run, the additional short term profit is offset by higher churn”. The pay-per-use bias is a result of underestimation of usage. It is also shown that the flat-rate bias does not increase churn which results in higher profit.
User satisfaction in terms of throughput for multimedia traffic is analyzed in [22]. Badia et al [23] model the user satisfaction taking into account requested Quality of Service (QoS), data rate and also price. This model enables analysis of impact of resource allocation on operator revenues. Lindemann et al [24] propose an approach to increase service quality and operator revenues based on monitoring of the number of active mobile and the packet loss probability. Edell & Varayia [25][26] present trail results on how users value different qualities of service (rate) for fixed Internet (broadband) access.
Consumer experience and decision making Noriaki Kano proposed a customer satisfaction model (Kano Model) that challenged
traditional approaches. Different service attributes are not seen as equal by the customers, “some attributes produce higher levels of satisfaction than others” [27][28] Different consumers will value different attribute differently and different consumer categories can be identified. Consumer satisfaction with telecom operators is analyzed by Xavier & Ypsilante [29]. The analysis includes aspects like whether dissatisfied consumers decide to switch and how the consumers could be provided with information that supports their decision making.
Ofcom in the UK annually present research reports on “the consumer experience” [31] and “the consumer decision making in the telecoms/ broadcast markets”[32] A number of factors are used to describe the user experience grouped in “rational/tangible” and “emotional” factors. For Mobile services the following factors are used: reliability of coverage, value for money, features & functions, low cost, ease of use, customer service, technical support and ability to get bundled package. For broadband services the rational factors include: reliability of connection, speed of connection, choice of connection type and amount of data that can be downloaded. The emotional factors are trustworthiness of brand and how highly other people rate the brand. These attributes are used to describe both the “perceived performance of current supplier” and “whether there are better alternatives available from other suppliers”. In general the performance of the current supplier is perceived to be good or very good. Nevertheless, quite many consumers think that will be benefits in switching operator. For mobile services benefits are expected by 36-46% of the participants in the survey (depending on what factor). For the broadband services the corresponding numbers are 39-50%.
3. Methodology and performance metrics In this section we will outline the work flow and describe the methodology, including the simulation model and the used performance metrics. The overall approach is based on the following relationship showing the profit of an operator [15]: Profit = Number of users * Revenue per user – Costs
The analysis will focus on the term (Number of users * Revenue per user) which is related to the customer satisfaction, network utilization and usage, pricing and willingness to pay.
3.1 Network model The radio related network performance is evaluated using simulation of a multi-radio
multi-operator scenario. A number of users with Mobile Nodes (MN) are moving in the area. For the case with network cooperation the MNs nodes can connect to any of the networks, if one network is overloaded the MNs can connect to another network no matter the operator [34]. Without cooperation the MNs have to stay in the networks belonging to the “own” operator. The network performance with and without cooperation is expressed using both traditional radio-related parameters like network utilization and connectivity statistics as well as metrics related to the user and operator performance.
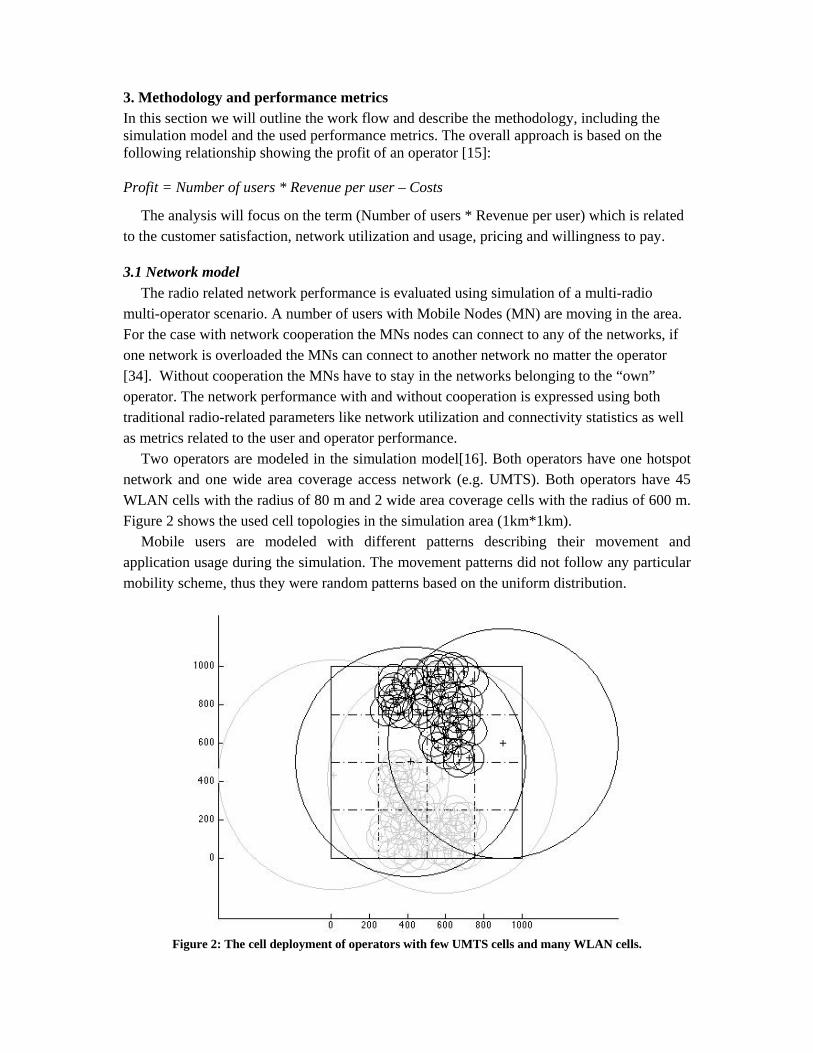
Two operators are modeled in the simulation model[16]. Both operators have one hotspot network and one wide area coverage access network (e.g. UMTS). Both operators have 45 WLAN cells with the radius of 80 m and 2 wide area coverage cells with the radius of 600 m. Figure 2 shows the used cell topologies in the simulation area (1km*1km).
Mobile users are modeled with different patterns describing their movement and application usage during the simulation. The movement patterns did not follow any particular mobility scheme, thus they were random patterns based on the uniform distribution.
Figure 2: The cell deployment of operators with few UMTS cells and many WLAN cells.

3.2 User satisfaction model The “User happiness” is related to service quality and price and we use a “User
Satisfaction Index (USI) as one performance metric. We consider a set of users and an analysis over a number of time slots j. For each time slot of duration Tj we consider the perceived service quality Qj and the price Pj. For user i we get
USIi = Σj Qj Tj /Pj The USI increases with increasing service availability and quality and with decreasing
price. A simple illustration on the use of the USI metric is shown in figure 3 below, where moving users can be connected to networks with different data rate and price characteristics. Wide cylinders indicate networks with wide area coverage and the heights indicate capacity or data rate. High data rate and low price imply an increasing USI. Disconnection results in a low or a negative USI value.
Happinessof movinguser
Low rate High rate High rate Medium rate Low rateLow cost Low cost High cost High cost Low cost
Happiness of rate sensitive user - access to network with highest rateHappiness of price sensitive user - access to network with low rate only
Happinessof movinguser
Low rate High rate High rate Medium rate Low rateLow cost Low cost High cost High cost Low cost
Happiness of rate sensitive user - access to network with highest rateHappiness of price sensitive user - access to network with low rate only
Figure 3: Example of price sensitive user and impact on the USI (User Satisfaction Index)
The USI takes into account both the service quality, availability and the price. In our
simulation experiment the end-user perception of the service (the USI) is calculated based on the radio related parameters, e.g. the number of connected mobile nodes. The perceived service quality can be related to absolute values (e.g. data rate) in many ways depending on the user perception. For the modeling of the user experience, i.e. the Qi parameter, we use the findings from Pohjola & Kilkki [18] and Tversky & Kahneman [19]. In [18] the authors describe the use of Expected Experience and Expected Value function to represent user happiness as follows:

“.. the users evaluate their benefits relative to a reference level (usually their status quo or expectation due to marketing) so that the gains are by a factor of about 2-2.5 lower than losses. This implies that below the reference the perceived value decreases rapidly and above the reference level the user experience is “good enough” … and further improvements do not significantly increase the benefits …. The reference level is, however, not stable. “Good enough” is only good enough for the present and the criteria for it may change. “
Based on this, we introduce the 4-level model of the perceived service quality using a set of P-values. P1 represents a disconnected user, P2 represents a user perceiving a service level “less than expected”, P3 represents a user perceiving the requested (expected) service level, and P4 represents a user perceiving a service level “higher than expected”, see figure 4.
Figure 4: User happiness function (left side) and the 4 level model (right side)
In general the “user happiness” function can have any shape and any sets of weights. One
set of weights that reflects the right hand side of figure 4 could be [-1, 0.25, 1.0 1.25]. The expected value gets the weight +1.0 and disconnection gets -1.0 in order to model a negative experience. However, the USI model allows other types of functions Error! Reference source not found.[33], and any set of weights to be used. Hence, different kinds of user perception can be modeled. In the general case the USI expression can be extended and be composed of many different services each with different prices [16].
3.3 User survey
In order to verify the modeling assumptions used for the estimation of the USI metric a user survey was conducted on user perception of services[16]. The survey included three parts • Part one consists of one open question “what are the most important aspects for usage of
wireless broadband and selection of service offers?” • The second part includes rating of different statements on how the person would perceive
different levels of service quality, e.g. availability and delivered data rates. • In the third part the persons were asked to rate “the attractiveness” of different service
offers for wireless broadband access with different prices, data rates and amounts of usage
30 persons participated in this “small” survey. Two types of users were included in the user survey; telecom people (students at technical university) and “ordinary users” (non-engineers). The participants were asked about there experience of wireless broadband access and where the access was used: at home, at the office/school or in public places. Most participants used some WLAN and/or 3G wireless access on a regular basis.
The objective of part one was to confirm that our “assumed” parameters were the ones that were considered important when the service quality or service offers were evaluated. People were asked to list parameters that were considered important and to provide a motivation. We counted how many persons did mention a specific aspect as having a high degree of importance. The following aspects were mentioned: Availability & coverage, Data rate (speed) important, Data rate not so important if availability is OK, Security and reliability, Price level, Type of subscription, User terminal & interface and Ease of use
The objective of part two was to get an indication on how people perceive service quality and how they “value” different aspects. People were asked to rate (from -10 to +10) how they did perceive service availability and the delivered data rate assuming a specific value of the expected data rate.
The objective of part three was to get some insight about reasoning when choosing between different offers, how trade-offs are made and what parameters that were considered most important.
3.4 Operator Satisfaction Index The impact of cooperation on the USI is investigated for a number of networking
scenarios. The overall operator performance is expressed as an Operator Satisfaction Index (OSI) [15][17]. This metric can be represented as a value pair of the overall USI (USIall ) and Cost Revenue function ( fRC ) including network costs and revenue aspects. These two values are not directly comparable with each other and they represent two different dimensions of the operator satisfaction. The former represents how happy users are and the latter is a monetary metric.
OSI = )},(Re,{ allallRCall CostvenuefUSI
The overall USI (USIall ) is just the sum of USI valies of all users’; USIall = USIii
J
∑
The Cost Revenue function ( fRC (Revenueall ,Costall ) ) is a metric where Revenueall refers to the revenues generated by the users during a certain time period, i.e., a positive money flow. And Costall refers to the operator’s cost associated with the generated traffic by the users during a certain time period, i.e. a negative money flow. This leads us to the following generic form of the Cost Revenue function:
fRC = RevenueAll - CostAll

We used the usage based pricing in our simulation and the price for a single data unit was defined for each service type. The Cost Revenue function fRC for a single user j for a number of time intervals Ti can be estimated as:
fRC j = DiPi − DiCii∑
where Di = Amount of data used during the time interval Ti
Pi = The price per data unit paid by the user for the data Di Ci = The production cost per data unit for the operator to deliver the data Dj
In our analysis the different performance metrics were calculated for different levels of
network load and connected number of users [15]. The Operator Satisfaction Index (OSI) was calculated using aggregated USI values and revenue estimates obtained from the traffic and network utilization numbers in the simulated scenarios. The usage based pricing was used in the numerical OSI and USI calculations The overall analysis is based on the comparison between performance with and without cooperation.
3.4 Analysis of operator challenges and opportunities The last part in our analysis framework deals with the operator challenges mainly related to
customer loyalty and churn. The approach is more or less an “analysis by reasoning” where we discuss the cost of having customers with low level of satisfaction.
Public data on the amount of customers that switch operator and the typical cost to acquire a new customer is used to support the reasoning. The overall idea is that cooperation result in better service availability and most likely resulting in more satisfied users. Hence, less churn can be expected further reducing the amount of customer retention and acquisition costs.

4. Results In this section we will summarize results from the survey on user perception of services,
simulation results providing examples of network performance benefits and the related end-user and operator performance using the USI and OSI metrics [16].
4.1 User survey In order to verify how users rate service quality and price a small user survey was
conducted. The survey consists of three parts, one part with open questions on “what aspects” that are considered to be important from a user perspective, a second part with rating of different levels of service quality e.g. availability and data rate and a third part with rating of different service offers.
The results of the first part to a large extent confirmed our own assumptions of selection of “most important” parameters. Parameters considered to have “high importance” were “availability & coverage” (mentioned by 85 %) and “price” (mentioned by 80 %). “Security & reliability”, “ease of use” and “type of subscription” was mentioned by 50-60 % of the participants. Half of the persons mentioned “data rate” as being important, but it is interesting to note that equally many answered that data rate “is not so important” provided that the service availability is satisfactory.
The results of the second part on perception of service quality confirmed the findings by Twersky & Kahneman [19]when it comes to the user experience as being related to an expected value and also the “shape” of the “user happiness” function in Figure 4. Less than expected data rate resulted in a quick drop of perceived value whereas an increase resulted in a much lower increase of the perceived value service. This is illustrated in figure 5.
As an example consider the case where a user has a GPRS/ 3G/HSDPA surf card in the laptop. If the user expects a ordinary UMTS connection then a 200 kbps data rate may correspond to the expected service. If HSDPA is available providing a 2 Mbps data rate the user probably not will be 10 times happier, but still happier. If HSDPA is available but the delivered data rate is 200 kbps the the user experience will be much lower, all depending on the expectation of the user. In the same way if only a GPRS connection is available with e.g. 20 kbps data rate the user will get even more disappointed.
User perception - rate
-15
-10
-5
0
5
10
15
0 1 2 3 4 5 6 7 8Series1
Offered service200-300 kbps
Expected value
Offered service1 – 2 Mbps
User perception - rate
-15
-10
-5
0
5
10
15
0 1 2 3 4 5 6 7 8Series1
Offered service200-300 kbps
Expected value
Offered service1 – 2 Mbps
Figure 5: Curves of perceived value as a function of delivered data rate

Also for the service availability the perceived value decreased quite rapidly with lower availability, see Figure 6.for average values. It is interesting to note that for individuals the transition from “good” to “very bad” was more rapid than indicated by the average values shown in Figure 6. When the availability went under some (personal) limit then the rating in most cases rapidly went down to the lowest level (-10). This result is well in line with the results in the Ofcom results indicating very high user value for coverage and availability.
User perception of availability
-15
-10
-5
0
5
10
15
0% 20% 40% 60% 80% 100% 120%
Mobile broadbandHot spot
Figure 6: Curves of perceived value as a function of availability
When it comes to the third part of the survey, to rate “the attractiveness” of different
service offers, no clear pattern could be observed in decision making and the trade-off analysis. It may be that the sample size was too small. It turned out that the group “students” frequently used WLAN (for free) but not 3G (where payment is needed). People in the other group either had 3G subscriptions (often through their employer) or did not use wireless broadband at all.
However, price seems to be the single most important parameter. The offers with lowest price got a rating between +5 and +10 and offers with highest prices got ratings between -10 and 0.
4.2 Traffic load and network utilization Here we will present the simulation results for the scenario with 2 mobile operators with
overlapping coverage areas. The specific numbers is a result of the working assumptions and the simulation setup, but the general behavior and impact of cooperation is clear. The network utilization increases and more mobile nodes can be served.
Figure 7 shows the connectivity statistics (% served MNs) for different levels of network load (number of MNs). The corresponding absolute number of served (connected) MNs is presented in Figure 8. As both figures show, the network cooperation results in increases in the number of served MNs. For 100 MNs the improvement is approximately 20% and for 700 MNs the improvement is 73%. Hence, more served MNs represents different levels of network utilization and total traffic.

Figure 7: Served MNs (%) under different network loads.
0
100
200
300
400
500
600
100 200 300 400 500 600 700 800
Number of MNs
Num
ber of served MNs
Coop
No Coop
Figure 8: Number of served MNs under different network loads.

4.3 End-user related performance From the connectivity statistics we can derive USI values and compare the performance
without and with cooperation. Using the results in Figure 7 for 200 and 500 MNs we calculate a set of USI values. In table 1 we show USI values using the vector [-1 1 1 1] for the weights in the USI function, see figure 4. The shown USI values are normalized so that USI = 100 corresponds to 100 % of the MNs being connected.
If we compare the impact of cooperation expressed in terms of connected MNs and the USI values respectively, we can see that the differences using USI are larger. One reason is that disconnection makes a negative contribution to the USI value.
Network load Cooperation Connected MNs USI value
200 MNs No 79 % 58 200 MNs Yes 99 % 98 500 MNs No 46 % -8 500 MNs Yes 75 % 50
Table 1.Example of Connectivity statistics and related USI values
4.42 Operator related performance In order to illustrate the operator performance OSI values were computed for both
operators without and with cooperation, see Figure 9. The OSI, the USI and fRC value pair, was computed by aggregation of all users during all time slots. The same trend can be seen for both operators; the USI (for all users) rises dramatically as a result of the cooperation whereas the cost - revenue function values are quite stable but still increasing. In case of usage based charging this means increasing revenues
The use of the USI metric illustrate the benefits in user satisfaction which would be of value to the operators since it would increase customer loyalty and hopefully reduce the churn.
Figure 9: The OSI value pair measurements, absolute values are not normalized.
5. Operator incentives to cooperate
In this section we return to the question of what may drive and what may impede network cooperation. The previous section showed that network cooperation clearly improve network performance and hence increase user satisfaction due to improved availability (better coverage, lower probability of blocking and dropped calls) as well as improved quality of service. The operators on the other hand, strive to increase their utility in terms of maximizing expected profits, minimizing risks and comply with a number of strategic targets. So what may be the contribution of better network performance and increased user satisfaction? What may hinder cooperation in spite of the benefits?
Estimates of expected future profit for a wireless operator are complex issues as such. Evaluation of risks involves the stability and manageability of revenues, costs and capital expenditures as well as handling of the uncertainty of the future. The wireless industry faces challenging uncertainty today as it enters a new phase of development. Voice revenues are expected to decline while the development of new revenues remains uncertain. Strategic issues include competitive game situations and conclusions about environment trends. Timing issues are related to development of technology performance and of demand for different services. Usability of existing business and technology assets determine freedom of action. Possible lock-in effects influence business decisions and investments.
We separate factors related to implemented network cooperation from factors related to the transition from the present state to cooperative network management. There are today clear indications of perceived technology risk as the standard is not yet completed and e.g. scalability has not been thoroughly investigated. There are business risks related to the fact that equipment prices depend on volume, which is still uncertain.
We limit our analysis to possible changes of operator utility that derive from network cooperation and which may be motives for such cooperation. We assume that operators will cooperate if the involved partners all expect that their utilities will increase. This paper is mainly not about transition issues. Transition problems may however become important obstacles to the implementation of network cooperation. Business model issues, risks and strategic considerations are closely interrelated. In the following we make a rough grouping simplified overview.
5.1 Revenues and cost
Network cooperation effects on network performance, user satisfaction and user satisfaction effects on expected profits are key issues in the mechanisms that may drive a virtuous circle of cooperation developments.
Improved availability is expected to improve operators’ revenues. Improved coverage as well as lower probability of blocking and of dropped calls improves the users’ possibilities to use the service at all. Improved coverage derives from non-overlapping coverage of participating partners. Load sharing and trunking gains will contribute in overlapping areas. The direct impact of network cooperation on network performance has been investigated in previous work. The simulations [16][35] have shown higher network utilization and clearly increased number of served users (i.e. less number of disconnected users).

Revenues will increase in case of usage pricing. In case of flat rate pricing, there will be room for more users. Observe that these effects derive from cooperation between existing networks without any build-out.
Improved availability may also involve shorter average distance to access points and thereby better quality of service (QoS) through improved link-budgets. Better QoS enable new and possibly more profitable services.
Improved user satisfaction as such should spur usage as well as improve readiness to pay for the service and user loyalty to the operator. Improved user satisfaction may also attract new users and hence improve revenues. It may also increase revenues from third-party service-providers and advertising suppliers.
Network cooperation also influences operators’ costs and capital expenditures. There are some but minor costs for cooperative RRM. Changes in user behavior from improved satisfaction may spur traffic, attract new users and third-party suppliers and thus necessitate network build-out. This will however elevate operator utility as it will be accompanied by increased revenues at high margins.
5.2 Customer acquisition and churn
An important issue is that increased user satisfaction should have a positive influence on user churn. Churn is a persistent problem for mobile operators. It remains at high levels also in Western Europe where markets have matured and mobile service is almost all-embracing. Vodafone reports the following unweighted averages for Germany, Italy, Spain and the UK. Average total “penetration” in those markets was 130% and Vodafone’s market share was 31%. The total churn levels in the US are fairly similar.
Annual churn Prepaid Contact Total
2005 27,0% 16,7% 22,7%
2006 32,3% 15,9% 25,3%
2007 32,3% 15,4% 25,2%
Table 2 Churn statistics for selected countries Vodafone had around 90 million subscriptions in the end of 2007 in the four countries
together. 35% were contract subscriptions and 65% were pre-paid. There are indications that churn is much more related to the characteristics of the markets and of individual users than to the type of subscription. The US and Italy, where almost all subscriptions are pre-paid, did not have any higher total churn rate than other countries.
Churn more or less forces operators to take countermeasures to defend market share or support growth plans. Otherwise declining revenues and fixed costs would hurt profit margins severely (i.e. a reverse of the above mentioned effects on profits). The costs to recruit new customers and to retain present ones are significant. Reports about such costs are however increasingly rare. But US operators reported details up to 2004 at around USD350 per gross add. Around USD150 of that was for handset subsidies and USD200 for expenses directly related to acquisition of new subscriptions. Pricing concessions are in additions used as marketing tools.

Vodafone reports acquisition costs of 150 USD per gross add in 2007. Acquisition costs amounted to 20% of depreciation and expenses excluding interconnect fees. Acquisition costs are defined as the total of connection fees, trade commissions and equipment costs relating to new customer connections. Marketing and similar costs incurred by the operator, as well as the implications of forgone revenues from competitive pricing actions are not included. Retention costs in 2007 were 12% of depreciation and expenses excluding interconnect fees. Retention costs are defined as the total of trade commissions, loyalty scheme and equipment costs relating to customer retention and upgrade.
Vodafone in Germany, Spain, Italy and the UK suffered from 22 million churned subscriptions in 2007. The direct acquisition costs to recruit substitutes were at least 150 USD/75 GBP each or 1650 million GBP. Retention costs were 1415 million GBP.
Previous research has shown that the distinction between new acquisitions and retentions is not very clear. Change of plan, tariff or package may be recorded as churn while the costs may be recorded as retention costs for an existing customer. Vodafone’s combined acquisition and retention cost in the major European markets amounted to 3065 million GBP in 2007.
A ten per cent reduction of churn and lack of satisfaction with the present subscription would save the company at least 307 million GBP, an increase of operating profit with at least 8%.
5.3 Profit
Actual impact from network cooperation on profits remains to be shown. But it is reasonable to assume that it is clearly positive. Increased usage from existing customers at stable prices is very profitable for operators. Expansion within existing network capacity would, according to OECD operator annual reports, generate network margins of 70% - 90% depending on the level and flow of connection fees. Margins will be almost at that level if expansion requires only moderate build-out with e.g. additional carriers. Profit margins from increased usage would be in the order of 40% - 60% even with if significant network build-out is required.
Improved customer satisfaction may have influences on customers’ willingness to pay for service with better quality than before and compared to other operators. Actual impact on revenues remains to be shown. But it is reasonable to assume that it is clearly positive. OECD operators have in the order of 25% - 40% operating margin today. Ten per cent higher prices should elevate profit after operating costs with 25% to 50%. A ten per cent reduction of churn should contribute to an increase of operating profit with at least 8%.
5.4 Risks
Network cooperation serves to reduce business risks or is fairly risk neutral. Improved customer satisfaction should contribute to better stability of revenues. Several unexpected disappointments in the last few years derive from high customer churn. Sprint is a recent example with 0.9 million customer losses in the second quarter of 2008. AT&T and Verizon gained 1.3 and 1.5 million customers in the quarter respectively. Sprint lost 11% of revenues and reported a net loss of USD 311 million.
Cooperation in general may introduce risks of irreversible dependencies between the partners. In this case however the partners only contribute access to their respective networks. Investments concern software and capacity for coordinated network management. Network cooperation is readily reversible.
5.5 Strategic issues
The strategic situation of the mobile communication industry today is quite complex. The attitude to cooperation will be dependent on the perceived nature of this complexity and how it will be handled.
The mobile communications industry communicates a fairly uniform view of the strategic business challenges. Revenues from mobile voice are expected to decline. Operators will have to compensate with new revenues and cost reduction. Increased revenues will have to come from non-voice services, from bundling and other means to increase total communications market shares.
A fundamental strategic target for business operations is to attain and preserve growth. Earnings growth is the core variable in enterprise valuation. Revenue growth is perceived as the driving factor of earnings. Cost reductions are more defensive means. Market share is an important target variable in growth management. Cooperation results in benefits also for the partners, which may complicate competition and market share gain endeavors. This may have moderated interest in cooperation so far.
Hence mobile operators continue to search for new services and new markets. Offerings of new content, video and advertising services and application services start to have some impact. New non-traditional sources are being explored. “Opportunities for new digital services range from extended transmission services to content services and IT services. The main challenges will be a much more competitive environment and a much more intense use of IT in the delivery of services by CSPs”[36]. Mobile broad-band Internet access is a major growth engine at the moment. At the same time competition increases from internet companies, large and small, as well as equipment companies. Exclusive control of the access network declines in relative importance, while demand for high capacity and QoS increase. This development may spur interest in cooperation. As regulatory authorities are generally not in favour of cooperation between peers, the alternative is to seek new types of partners. Cooperation between cellular operators and WLAN local access providers has started to appear. Local enterprise networks offer further possibilities.

6. Conclusions and discussion
Operator behavior
Given the very positive potential for network cooperation, that we have identified, it is relevant to ask why we don’t already have that type of cooperation between operators today.
The first explanation is that networks in many countries are very similar. They have the same coverage, roughly the same capacity and characteristics of the customer base. The explanation for this is that regulatory authorities issued similar requirements on coverage and capacity along with spectrum licenses. This similarity makes the initial potential of network cooperation limited to trunking gains.
A lot could be gained even if the initial potential is limited. Cooperative RRM in combination with selected build-out strategies are however counteracted by competition authorities in the most common oligopolistic markets. The three or four leading operators are generally not allowed to cooperate.
Even if operators would be allowed to cooperate this is not the common way to do business. Operators are not used to cooperate with their competitors. One reason may be the business setup with spectrum allocation, licenses and deployment of own infrastructure. The coverage of the own network was a major issue in the marketing of mobile operators. It may be that this still is the main driver of the business logic. However, we believe that this situation will change when high capacity networks for mobile broad band will be deployed. With the expected need for network capacity combined with flat rate subscription the operators cannot afford to build own networks everywhere – they will be forced to cooperate one way or another.
Extensions of modeling of performance metrics
From the Ofcom studies of consumer experience a number of factors was identified describing different aspects of user satisfaction. We can group these factors into the following categories:
• Network related factors: reliability of coverage, ease of use of network services, reliability and speed of the connection.
• Factors related to the price and service offers: low cost, amount of data that can downloaded, ability to get bundled offers and “value for money”
• Factors related to customer management: technical support and customer service
• Emotional and brand factors: Trustworthiness of the brand and how highly other people rate the brand of the operator.
In our current modeling of the user satisfaction index (USI) performance metric we include the network related factors and the price. One possible extension is to also include the more “soft” issues describing the perceived quality of customer management and support of the operator. In the simplest form this would be a scaling factor applied to the USI metric.

Another possible extension is to use different sets of weights for different services and/or type of users. This could be used to analyze the user experience for different market segments. Use of different weight sets for different types of services is described in more detail in the next section on possible future work items.
Operator opportunities
We can clearly see that the cooperation between mobile operators have a number of advantages beside the commonly identified cost reduction due to sharing of network resources. It may be that operators have not fully identified the benefits described in this paper: i.e. high increase in customer satisfaction and some increased revenue potential due to higher network utilization.
If our findings on increased customer satisfaction turn out to be generally true in rela business situations, this would offer the mobile operators opportunities to optimize their CAPEX and OPEX. With cooperation resulting in more satisfied customers and less churn, the”investments” in customer acquisition and customer retention could be lower. This effect is illustrated in figure 10 showing possible cost structure changes due to cooperation.
The cost for networks would be lower due to sharing of network resources, even when additional investments are needed for systems that allow network cooperation. The customer acquisition costs will decrease. Administrative costs will most likely increase due to increased inter-operator charging and billing.
0
20
40
60
80
100
120
140
Network related costs Customer acquistioncosts
Customer care, billing,admin costs
current situationWith cooperation
Figure 10: Illustration of possible cost structure changes with cooperation
(Number are just to illustrate the potential for cost savings)

7. More on future work
Possible future work items are identified when it comes to extension of the USI model. One possibility extension is to use different sets of weights for different types of services. Another option is to use different weight sets for different types of users or market segments assuming that the user behavior is different. In this section, we go through some example services and explain how P value weights could be set to capture average user expectations. In general it is important to note that the gains of the USI values depend on the used weight set.
Connectivity and quality sensitivity
As explained, the USI calculations are case sensitive and with a proper adjustment of the P value weights, see figure 4, it is possible to model the preferred user behavior. However, there are no generic rules on how to do this and even in the context of a single service, there are differences between users like different expectations due to for instance educational background. The person with a technical education may be more forgiving than the non-technical person.
First, we need to analyze how connectivity sensitive services are, since this defines the importance of P1 value weight. Secondly, the similar quality sensitivity analysis is needed to illustrate the importance of P2 and P4 value weights. There are many ways to classify services and we ended up to the following classification.
Service Connectivity and Quality Sensitivity Email applications, push email, contacts, calendar, address book
Short transactions, not connectivity sensitive, some level of quality sensitivity
Instant messaging including chat and text messaging
Short transactions, not connectivity sensitive, not quality sensitive
Voice services Connectivity and quality sensitive, cannot necessary benefit temporary additional quality/resources
Real time including video Connectivity and quality sensitive, can benefit from temporary additional esources if caching is used
Best effort including web surfing
Connectivity sensitive, some quality sensitivity, can benefit from temporary additional quality/resources
Table 3 Connectivity and Quality sensitivity for different types of services
Selection of weights in the USI model
Email applications are not typically very connectivity sensitive due to their short transactions. However, there are some exceptions like in case of synchronizing large mailboxes. Instant messaging belongs to a large extent to the same category as email applications. For both categories, P1 value weight could be set either equal to the zero or a small negative value. Both voice and real time services are highly connectivity sensitive and therefore the P1 value weight should be set accordingly, e.g. -1, to ensure that disconnections have significant negative impact to the user happiness represented by the USI.

Best effort services like web surfing is quite connection sensitive, but it tolerates some connection breaks and is not so quality sensitive. So P1 value weight is recommended to set between the email and instant messaging services and highly connectivity sensitive services.
The following figure shows how the connectivity and quality sensitivity relate to the USI model and P value weights.
Figure 11: The connectivity and quality sensitivity and the USI model.
So basically, different traffic characteristics captured by the P value weights are as follow; • Connectivity sensitivity defines the importance of the P1 value
• Quality sensitivity defines the importance of the P2 and P4 value
• The capability of using temporary additional quality/resources defines the importance of the P4 value

References [1] Final System Description, Public Deliverable D-A.4, February 2008, available online on
www.ambient-networks.org [2] O Rietkerk et al, ”Business roles enabling access for anyone to any network and service with
Ambient Networks”, Proc. Helsinki Mobility Roundtable, June 2006 [3] J Markendahl, M Johnsson, “Ambient networking and related business concepts as support for
regulatory initiatives and competition", 5th Conference on Telecommunication Techno-Economics (CTTE2006), Athens, June 2006
[4] J Markendahl Ö Mäkitalo, J Werding, “Company asset analysis of candidates for novel access provisioning”, Proc. RVK05, Linköping, June 2005
[5] Design of Composition Framework, AN public deliverable D03-G.1 available online on www.ambient-networks.org., December 2006
[6] Business Feasibility analysis, public report D14-A.5 available online on www.ambient-networks.org., December 2007
[7] Mobility Support: Design and Specification , AN public deliverable D09-B.1 available online on www.ambient-networks.org. December 2006.
[8] Multi-Access & ARI design and initial specification, Public deliverable D2 available online on www.ambient-networks.org., December 2006
[9] http://cordis.europa.eu/fp5/home.html [10] http://www.everest-ist.upc.es/ [11] http://www.aroma-ist.upc.edu/ [12] 3GPP TR 23.234, “3GPP - WLAN Interworking; System description“ 3GPP system to Wireless
Local Area Network (WLAN) interworking; System description (Release 7) [13] 3GPP TS 23.251, "Network Sharing; Architecture and Functional Description". [14] 3GPP SA1, TR22.980, “Network Composition Feasibility Study”. [15] Systems Evaluation Results, Public Deliverable D-H.5, December 2007, available online on
www.ambient-networks.org. [16] P. Poyhonen, J. Markendahl, O. Strandberg, “Analysis of benefits of operator cooperation using
end-user and operator performance metrics” 17th Biennal Confernce of the ITS, Montreal 2008 [17] P. Poyhonen, J. Markendahl, O. Strandberg, “Analysis of Network Cooperation in Terms of
Operator and User Satisfaction”, 7th Conference on Telecommunication Techno-Economics (CTTE2008), Paris, June 2008
[18] O.Pohjola, K. Kilkki, “Value-based methodology to analyze communication services”, Proceedings CTTE 2006, Athens, June 2006
[19] A.Tversky, D.Kahneman, “Advances in prospect theory: Cumulative representation of uncertainty,” Journal of Risk and Uncertainty, 5, pp. 297–323, 1992
[20] H. Mitomo, T. Otsuka and K. Nakaba (2007), “A Behavioral Economic Interpretation of the Preference for Flat Rates: A Case of Post-Paid Mobile Phone Services”, 18th European Regional ITS Conference, International Telecommunications Society, Istanbul, 2007
[21] A. Lambrecht, B. Skiera, “ Paying too much and being happy about it: Existence, Causes, and consequencies of tariff-choice biases”, Journal of Marketing Research, Vol XLIII, May 2006
[22] J Gozálvez, et al, “User QoS-based Multi-Channel Assignment Schemes under Multimedia Traffic Conditions”, Proc IEEE Conf. ISWCS 2007
[23] L. Badia, M. Lindström, J. Zander, and M. Zorzi. Demand and pricing effects on the radio resource allocation of multimedia communication systems. Globecom 2003.
[24] C. Lindemann, M. Lohmann, and A. Thümmler. A unified approach for improving QoS and provider revenue in 3g mobile networks. ACM Journal on Special Topics in Mobile Networks and Applications (MONET), 2003.
[25] R. Edell, P. Varaiya, “Providing Internet Access: What we learn from the INDEX Trial”, IEEE Network, sept/oct 1999
[26] R J. Edell, et al “INDEX: A platform for determining how people value the quality of their Internet Access”, project report #98-010P, May 1998
[27] D. Walder, (1993). Kano’s model for understanding customer-defined quality. Center For Quality of Management Journal, 39, 65 – 69.

[28] Erica Lynn Farmer “Kano's Model presentation” , Presented at the American Society for Quality, February 4th, 2008, available at http://www.iems.ucf.edu/asq/presentations.htm
[29] Xavier P, Ypsilanti D, Demand Side Analysis, Consumer Behaviour And Telecommunications Policy , 17th Biennal Confernce of the ITS, Montreal 2008
[30] Ofcom (2006), “Consumer Experience Research” Annex 4, “Consumer Decision-Making in the Telecoms Market”, Report on research findings, Research Annex, November 16, 2006.
[31] Ofcom, (2007i),”The consumer experience”, November 20, 2007 [32] Ofcom (2006ii),” Consumer decision making in the telecoms and TV broadcast market,
November 20, 2007 [33] J.Sachs, M.Prytz, J.Gebert, “Multiaccess management in heterogeneous Networks”, Wireless
Pers Commun DOI 10.1007/s11277-007-9431-8 [34] P. Pöyhönen, J. Tuononen, H. Tang, O. Strandberg, “Study of Handover Strategies for Multi-
Service and Multi-Operator Ambient Networks”, ChinaCom 2007, Shanghai, August 2007 [35] P. Pöyhönen , J Markendahl J, O Strandberg , “Impact of operator cooperation on traffic load
distribution & user experience in Ambient Networks scenarios” Proc. Los Angeles Mobility Roundtable, June 2007
[36] J. C Delacroix, New Digital Services Require Synergistic Modernization of Telecom Carriers' IT and Networks, Gartner Research, 16 July 2008