Embed Size (px)
Citation preview

Copyright © 2011 by Turbomachinery Laboratory, Texas A&M University
Proceedings of the Fortieth Turbomachinery Symposium
September 12-15, 2011, Houston, Texas
FULL LOAD TESTING OF A 12.5MW VERTICAL HIGH SPEED SUBSEA MOTORCOMPRESSOR
Giuseppe Vannini
Senior Engineer (Mechanical Engineer)
GE Oil&Gas Nuovo Pignone
Via Felice Matteucci, 2, 50127, Florence, Italy
Andrea Masala
Senior Engineer (Mechanical Engineer)
GE Oil&Gas, Nuovo Pignone
Via Felice Matteucci, 2, 50127, Florence, Italy
Massimiliano Ortiz Neri Lead Engineer (Control Engineer)
GE Oil&Gas, Nuovo Pignone
Via Felice Matteucci, 2, 50127, Florence, Italy
Silvia Evangelisti Lead Engineer (Test Project Engineer)
GE Oil&Gas, Nuovo Pignone
Via Felice Matteucci, 2, 50127, Florence, Italy
Massimo Camatti
Engineering Manager
GE Oil&Gas, Nuovo Pignone
Via Felice Matteucci, 2, 50127, Florence, Italy
Federico Svetti Lead Engineer (Electrical Engineer)
GE Oil&Gas, Nuovo Pignone
Via Felice Matteucci, 2, 50127, Florence, Italy
Sergio Bondi Principal Engineer (System Engineer)
GE Oil&Gas, Nuovo Pignone
Via Felice Matteucci, 2, 50127, Florence, Italy
Giuseppe Vannini is a Senior Engineer in the Advanced Technology
Organization of GE Oil&Gas, which he joined in
early 2001. He has been involved in advanced
rotordynamics studies on high performance
compressors developing both analytical and
experimental research activities. Recently he
extended his activity to the design of prototypes
for subsea applications (i.e. integrated high speed
motocompressors). He holds a PhD in
Mechanical Engineering at Pisa University and
he’s member of API684 Task Force.
Andrea Masala is Senior Engineer in GE Oil&Gas Advanced Technology
Rotordynamic team. He earned is MSc in
Mechanical Engineering from University of Cagliari
in 1999 and joined GE in 2002. He had assignments
in the auxiliaries systems, rotating machinery and
centrifugal compressors NPI teams. In the current
position his area of activity is on rotating equipment
dynamics with focus on AMBs integration in GE
Oil&Gas machines. He is a certified Root Cause
Analysis leader and Six Sigma DFSS green belt.
Masimiliano Ortiz Neri graduated in Automation Engineering from the
University of Pisa in 1999. After several years of
work in the telecommunication industry, he
joined GE Oil&Gas in 2005 as Control Systems
engineer in the Steam Turbine and Electric Motor
Driven Turbomachinery Control Department,
being involved in the design of the control system
for several challenging NPI projects like Subsea
Compressor and Solar Power Plant. He is
specialized in Active Magnetic Bearing control
system.
Silvia Evangelisti is a Lead Test Engineer in GE Oil&Gas Technology
Laboratory. She joined GE in 2001, and moved to her current role in 2005,
after Engineering Edison Development Program. She has been involved in
several projects, from conceptual test design
to data analysis, with a special focus on centrifugal compressors validation
area. Silvia holds a M.S. degree in Mechanical Engineering from the
University of Bologna.
Massimo Camatti is the manager of Turbomachinery Mechanical Design
Dpt. of Advanced Technology Division of GE
Oil&Gas. He holds a Master Degree in Mechanical
Engineering at Florence University and joined
Nuovo Pignone in 1988. After a first period as
centrifugal compressors design engineer he was
design leader of innovative compression projects.
Before the current position, he covered the roles of
engineering manager of centrifugal and axial
compressors for Liquefied Natural Gas application
and R&D manager for centrifugal and axial
compressor product line.
Federico Svetti is an Engineering Technical Leader in the Electrical &
Control System Department of GE Oil & Gas,
Florence. He joined the company in the 2006
and, since that time, he has followed the design
of electrical drives (Variable Speed Drive
Systems) for Motor-compressors and LNG
applications. In the last 2 years, he has been
involved in the new technologies and
applications around the subsea field.
He received the MSc. in Electrical Engineering
from the University of Pisa, Italy, in 2002.
Sergio Bondi started his career in the aerospace sector and then moved to
Oil&Gas. He developed his expertise within
rotating machinery with special focus in gear and
couplings and then took the responsibility of the
system integration of the subsea compressor.
Currently he his responsible for pumps, valves
and systems manufactured by GE Oil&Gas. He is
graduated in aeronautical engineering and holds
an MBA from Bocconi University.

Copyright © 2011 by Turbomachinery Laboratory, Texas A&M University
ABSTRACT
In late 2006 Authors’ Company was awarded a contract for
the motorcompressor for the Ormen Lange Subsea
Compression Pilot. This Pilot represents the first subsea
motorcompressor unit ever built in a fully marinized version
and tested in a water pit, which was developed specifically for
the project at the customer’s site (Nhyamna, Norway).
The prototype unit is a 12.5MW (16763HP) integrated
motorcompressor, which runs up to 10.5krpm in a vertical
configuration with the following features:
• Single casing
• High-speed motor rigidly coupled to a multistage
centrifugal compressor (3 journal bearings shaft line)
• Canned Active Magnetic Bearings (AMBs)
• Process gas used as cooling fluid for the Electric Motor
• Internal separation system (to protect the bearings and the
electric motor from the intrusion of solid and liquid
materials)
• Fully marinized AMBs control system
• The design and validation plan for this complex equipment
were developed through a four years program where many
challenging milestones were achieved.
• The Ormen Lange Subsea Compression Pilot
motorcompressor has successfully completed an intensive
full load testing campaign in the Authors’ Company plant
including the following:
• Static-dynamic tuning of the AMBs
• Mechanical Running Test
• Compressor Performance Test (ASME PTC-10 Type 2 +
Full Load test)
• Electric Motor Performance Test
• Overall cooling system check
• Landing test (partial landing and full speed delevitation
test)
The test campaign has fully demonstrated the functionality
of this prototype unit capable of operation in the service
conditions.
The Next step will be the shipment to the costumer site
where the submerged testing will be conducted.
This paper will provide a detailed description of the main
test results of the subsea motorcompressor covering all aspects
of the test program including rotordynamic behaviour,
compressor thermodynamic performance, axial load variation
versus operating conditions (monitored thanks to the thrust
AMB), electric motor cooling system behaviour, electric motor
performance, AMBs and control system operability.
Of special interest is the rotor delevitation test from full
speed consisting in the two ton rotor running at 10.5krpm
dropping onto the mechanical emergency bearings until the
machine reached a complete stop condition. This test, which
was repeated 5 times, provided a full-scale verification of the
landing numerical simulation developed by the authors
(Ransom et al., 2009).
INTRODUCTION
In 2006 the Authors’ Company was awarded a contract for
the motorcompressor of the Ormen Lange Subsea Compression
pilot project. Soon after, the Authors’ Company (together with
the project EPC) started the long and demanding task of
delivering this subsea motorcompressor suitable for
uninterrupted operation on the bed of the North Sea.
The project centers on the development of a complete
compression train to demonstrate the feasibility of subsea
technology through extensive testing in the Nyhamna pit. The
Pilot compression train delivered to the final costumer
(HydroStatoil) will be in fact tested in a specially constructed
test facility (Nyhamna site) where a special pit will be prepared
to simulate subsea conditions.
The Pilot compression train (see Figure 1) includes:
• Motocompressor unit
• AMBs control system
• Upstream separator
• Subsea Variable Speed Driver
• Subsea Ancillaries: condensate pump, transformers, circuit
breakers.
Figure 1 – Ormen Lange subsea compressor station.
The Ormen Lange Subsea Compression Pilot project will
be the enabler for the Ormen Lange production phase, which
will employ four trains (identical to the Pilot) in subsea service.
This motorcompressor was developed over a four full year
period (from design to testing) and is a full prototype for the
subsea compression service. During this time, the project
achieved many important milestones in terms of qualification
of technology for the various single components. These
achievements will not be covered in detail in this article, which
is dedicated primarily to the full load testing of the unit but it is
worthwhile to mention them as background.
The emergency landing of a vertical shaft on three journal
bearings was validated through a subscale test done in the
laboratory (Ransom et al., 2009). This test increased the
confidence in the design of the bearings and also served as a
demonstration of the smooth operation of the vertical shaft on
the AMBs.
Still on rotordynamics, the high speed balancing of the
three-journal bearing rotor was performed at the Authors’
Company plant to guarantee smooth vibration behaviour during
the full load test. The balancing operation was very challenging
due to the need for three supports and the high peripheral
speeds reached at the bearings (160m/sec – 525ft/sec).
Other important milestones were achieved in the
development of canned AMBs, marinized control system
validation and electric motor stator parts qualification for a wet
environment and erosion.
In the following paragraphs, the functional testing of all
these components assembled together will be discussed in
detail.
Before entering into the details of the test program it is

Copyright © 2011 by Turbomachinery Laboratory, Texas A&M University
worthy to describe the motocompressor layout, which is shown
in Figure 2.
The unit is a vertical integrated motorcompressor running
up to 10.5krpm and rated for 12.5MW of power. The electric
motor is located topside and it is housed in a cast stainless steel
casing, which provides interfaces for the high voltage
connectors. The rotor is a single shaft line thanks to the rigid
Hirth coupling and is supported by three radial AMBs.
The following discussion provides some more specific
thoughts on the main features of the motorcompressor. The
vertical layout based on the topside electric motor was selected
for this application with the specific goal of protecting the
electric motor from water and condensates.
Figure 2 – Motorcompressor 3D view.
The unit is quite compact with respect to the power rating:
6m (19.7ft) in height and 2m (6.6ft) in diameter, with an overall
weight of 55t (121254lb) (not including the external seawater
cooler).
The three-journal bearing rotor was considered a very
robust solution for smooth rotordynamics associated with a
high rotational speed. In fact, three rotor modes are crossed in
this configuration but they are all critically damped. This is
made possible also thanks to the AMBs, which take advantage
of the absence of the gravity load, saving load capacity for the
lateral dynamics. For reference the AMBs are named #1, #2, #3
going from the top to the bottom (e.g. AMB#3 is the
compressor bearing).
The axial magnetic bearing is located on the top and is of
the double effect type, since the global axial load can be
reversed during operation.
The AMBs are all canned, which means that the statoric
parts are completely enveloped with stainless steel protective
cans. This technology was qualified during the project and the
authors believe it is a big plus for the subsea compression
application.
On the electric motor side, state-of-the-art technology in
terms of high speed, process cooled motors was used. The
motor was integrated in the motocompressor environment and
made as robust as possible and insensitive to potential process
upset conditions. For instance, the cooling gas is filtered and
then maintained in a closed loop, the casing material is made of
stainless steel to avoid rust and deposits on the magnetized
parts, and the layout is vertical to allow drainage of liquids.
The unit allows for the collection of liquid slugs on the
bottom sump that is sized for 500l (132.1gallon).
The compressor is conceived as a cartridge, which can be
removed from the electric motor section if a rebundle is needed.
The maximum number of impellers is dictated by the available
room in the suction plenum and also by a compromise with the
rotordynamic behaviour. The compression service for the
current application is fulfilled with a three-wheel rotor. Finally,
this solution is fully marinized and ready for submerged testing.
FULL LOAD TEST DESCRIPTION AND RESULTS
Test program
The motorcompressor test bench was erected at the
Authors’ Company facility at Le Creusot (see Figure 3) and the
test started in January 2010. The test was intended as a general
functional qualification test for the motorcompressor
preliminary to the validation phase at the costumer’s site
(submerged test).
The test program consisted of the following main steps:
• Tuning of the AMBs
• Mechanical Running Test
• Compressor Performance Test
o Similitude (ASME PTC-10 Type II)
o Maximum load test (10MW vs. 12.5MW)
• Overall cooling system check
• Landing test
o Partial landing
o Full speed landing
All these steps contributed to the overall motorcompressor
validation in terms of:
• Compressor Thermodynamics
• General Rotordynamics
• System Cooling
• Axial Thrust
• Electric Motor
• AMB Control System
• Full speed emergency landing
Since the test data were critical to the validation of this
technology, the instrumentation setup was of special
importance and is described in detail below.
Figure 3 – Le Creusot test bench.

Copyright © 2011 by Turbomachinery Laboratory, Texas A&M University
Instrumentation
Dedicated instrumentation was installed on the machine
and test facility in order to validate the new design, to data-
match analytical models and to monitor test parameters.
The areas of primary interest in the validation testing were:
• System cooling
• Auxiliary bearings
• VSDS Electric Network and Motor Power Analysis
• AMBs
The data acquisition system was designed to act as a single
entry point collecting data coming not only from special
instrumentation, but also from the test rig control panel and
AMB cabinet.
System cooling (Motor and bearing cooling)
System cooling in the subsea motorcompressor is designed
to provide cooling flow to the AMBs and to the electric motor.
The system is composed of a quasi-closed loop for the cooling
of motor-side devices and an open loop for the compressor-side
bearing and seal buffering (see System Cooling paragraph for
more details).
The scope of the measurements is to provide data (pressure
and temperature measurements) for validation of the secondary
flows (cooling flows) model.
For pressure measurements, miniature piezo-resistive high-
pressure transducers were installed inside the machine. This
solution, requiring minor machining, was preferred to
traditional pneumatic measurements, both because of reduced
intrusion and increased intrinsic safety.
Temperatures were measured with RTDs; in low
accessibility areas, pressure sensors were equipped with
onboard Pt1000.
Wiring was routed through dedicated flanges on the casing.
In order to minimize the risk of leak, high pressure, high-
density conductor sealing glands were selected. This type of
gland assembly, due to its insulated, compact, uninterrupted
copper wires, guarantees physical disconnection and no leakage
through wire protection in case of sensor failure. The design of
the installation, including external routing in the test facility
area, is compliant with the applicable EC Directives.
Auxiliary Bearings
Vibration monitoring of auxiliary bearing housings was
performed during landing test execution to check (on-line) the
vibration level reached, as a follow up of previous laboratory
tests (Ransom et al., 2009). Miniaturized 3-axial accelerometers
ICP with integrated cable were screwed onto the auxiliary
bearing housings. Additionally, the overall machine casing
vibration monitoring during landing tests was done using
ATEX compliant mono-axial accelerometers installed on the
top flange of the motorcompressor body.
VSDS, Electric Network Grid and Motor Power Analysis
VSDS components were instrumented in order to data-
match the analytical model and to perform power analysis.
Network power analysis: Dedicated voltage and current
probes were placed on the main transformer bus-bars (inside
the power cabinet) and were measured using a power-meter
with Harmonic Analyzer capability.
VSDS output filter temperatures were measured by PT100
type RTDs installed on the filter coils, measured by a dedicated
data logger placed on site.
Due to the distance between the Control Room and the
Frequency Converter/Main Transformer location, the static and
dynamic acquisition system had to be doubled and localized:
connection with the control room was realized through a
dedicated fiber optic link.
Motor power analysis: voltage and current probes were
installed on the intermediate junction box located close to the
motorcompressor. In order to correctly measure all harmonics
up to the 50th, all the probes selected had a high bandwidth.
During an extensive front-end calibration campaign
performed on site by the metrology lab, in particular, the
frequency response of voltage probes was shown to be strongly
affected by the cabling length and acquisition conditioning. The
result of the optimization was a set of HV probes with an
internally compensated integrated 30m (98.4ft) extension cable
designed to compensate stray capacitance, and custom tuned
conditioning boards: the accuracy was within 1% of the reading
up to 8.5kHz.
All data, including those retrieved from the Test Control
Panel (such as data from the VFD and compressor
performance) were collected and recorded. Visual panels (see
Figure 4) were used during running to perform checks on the
system functionality.
Figure 4 –Visual panel for motor performance evaluation.
AMBs
Operating parameters from the AMBs (currents, coil
temperatures, displacements) were recorded and synchronized
with the rest of data.
When possible, physical connections to the AMB control
cabinet were used for direct high-sample-rate acquisition: this
was possible for speed, axes positions and currents.
As for other slowly varying signals, such as bearing
temperatures, they were indirectly retrieved from the test
control panel via Ethernet. The connection between the UCP
and AMB cabinet was via MODBUS protocol.
Overall, the integrated acquisition system (see Figure 5)
was highly beneficial, allowing the synchronized acquisition of
all data coming from both the test facility and the machine.
This made it possible to perform system-level analyses, with
direct comparison between different system component trend-
lines, making the identification of cause-effects relationships
easier and simplifying troubleshooting.

Copyright © 2011 by Turbomachinery Laboratory, Texas A&M University
Figure 5 – Integrated acquisition system.
Compressor Thermodynamics
Initially, the performance test was executed at low pressure
according to the similitude criteria of ASME PTC-10 code and
later at full pressure to match the site conditions. It is important
to note that the compressor duty is based on many operating
points, which represent the evolution of the gas reservoir life.
The delivery pressure is always constant at 140bar (2031psi)
while the suction pressure decreases more and more over the
time: the starting suction pressure is just below 140bar and the
target final plateau value is 80bar (1160.3psi). This means the
compressor starts to operate at its minimum rotational speed
and increase the speed along the years. For this reason the
motorcompressor operating range is very broad with a
minimum operating speed (mos) of 3048rpm and a Maximum
Continuous Speed (MCS) of 10668rpm.
The compressor performance was in general agreement
with expectations. Figure 6 shows the result of the low pressure
performance test conducted at 25bar (362.6psi) in terms of the
non dimensional parameters psi and eta with respect to the flow
coefficient.
Figure 6 – Expected vs. Tested compressor performances.
The efficiency is generally flat and higher than expected at
high flow while it is in line with or slightly below expectations
at low flow. The head is always higher than expected. During
the low pressure test, the surge region of the compressor was
explored in order to find the operating limit: the operating point
was extended up to 14% less flow than the expected right limit
without any evidence of surge.
General Rotordynamics
Special consideration to rotordynamics and AMB
performance was given during motorcompressor testing to
validate the predictions and assess the robustness of operation
at different operating conditions.
Due to the lack of specific design and acceptance test
requirements in the API617 Standard for integrated motor-
compressors equipped with AMBs, ISO 14839-2/3 Standards
acceptance test requirements in terms of vibration amplitude
and stability performance were applied, with the concurrence of
the customer. Aiming to target the most conservative
acceptance values for newly commissioned machines, in the
Zone-A class of merit, the following ISO 14839 criteria were
selected:
• Maximum allowable rotor displacement (0-Pk), equal to
0.3 Cmin (where Cmin=200µm / 7.88mils) is the minimum
radial clearance inside the machine and corresponds to the
auxiliary bearing air gap).
• Maximum allowable Peak Sensitivity Transfer Function
gain (|Gs|) equal to 3 (9.5 dB).
To target these requirements, an extensive rotor and AMB
system design and optimization (requiring extension of both
Authors’ Company and AMB Supplier tools and design
criteria) was carried out during the development phase, as
explained in Masala et al., 2010. The objective of targeting ISO
14839 requirements was made even more challenging due to
the following specific features and technical innovations
introduced in this prototype:
• A rotor configuration supported by three AMBs and with
one honeycomb seal on the balance drum,
• The presence of the canning on the AMBs, affecting the
dynamic performances and introducing possible gas
induced aerodynamic cross-coupling excitation.
• The machine vertical configuration, which required an
integration of the rotor and AMB dynamics with the casing
and overall structure dynamics.
The rotordynamic performance validation was carried out
in three major steps:
I. AMB control system tuning
II. Mechanical running test
III. Performance test
The first task was required to validate the predicted rotor
and AMB transfer function, as determined during the design
phase, and to identify the proper control parameters to provide
suitable stiffness and damping over the AMB controller
bandwidth. In this regard, it was of special interest to identify:
• The actual position of the 1st rotor bending mode, which
was within the operating speed range of the machine and
required proper AMB controller parameter to be critically
damped.
• The actual position 2nd
rotor bending mode, which was
above the maximum continuous speed and had by a low
damping ratio, requiring suitable separation margin from
MCS.
• All high frequency dynamics of the rotor and correct
interlacing violations generated by sensor and actuator non-
collocation, as already addressed during the design phase,
and deviation of the AMB system dynamics from predicted

Copyright © 2011 by Turbomachinery Laboratory, Texas A&M University
model.
The rotor system identification revealed good
correspondence of the 1st bending mode of the rotor with the
calculated value, whereas some deviation on the 2nd
and 3rd
bending mode was identified, as depicted in Figure 7.
Figure 7 - Rotor transfer function check. Measured (blue) and
predicted (red) rotor response.
The potential deviation of the actual rotor bending modes
from predicted values had already been identified during the
rotor free-free test performed at Authors’ Company plant, prior
to installing the rotor in the machine. Since the deviation was in
the conservative direction, as the actual separation margin of
the 2nd
bending mode from the operating speed range was
higher compared to the predicted value, the modification of the
control system was deferred to the tuning phase.
72.2
210.6
325.1
72.1
223.9
332.5
0
50
100
150
200
250
300
350
1st rotor bending 2nd rotor bending 3rd rotor bending
Fre
qu
en
cy
(H
z)
Predictions
Measurements
Figure 8 - Calculated and measured free-free bending modes.
Another important task addressed during the tuning phase,
was to identify proper rotor centering inside the auxiliary
bearing air gap. Because of installation tolerances between the
auxiliary bearings and the magnetic actuator, proper
identification of the reference center of rotation, with respect to
the ideal position, is required for any AMB supported rotor. In
this case, the task was even more challenging because the rigid
rotor was supported by three AMBs and some amount of
mounting misalignment was present among them, despite the
tight manufacturing and installation tolerances. The centering
procedure was performed, for each AMB, as a trade-off
between the minimum rotor deflection (involving a
consumption of AMBs load capacity), and the best geometrical
rotor centering in the auxiliary bearing air gap.
The AMB tuning procedure performed at stand-still
condition was finalized as the machine started to run and the
speed increased up to maximum continuous speed. A step-by-
step speed increase was setup to verify the correct controller
parameters and arrange the settings of the synchronous filters to
cross the critical speed inside the operating speed range while
reducing the vibration amplitudes.
The final settings of the AMB controller parameters
allowed reaching the maximum continuous speed during
mechanical running test with very smooth crossing of the
critical speeds and low vibration amplitude, with the
synchronous filters either activated or deactivated, as depicted
in Figure 10 and Figure 11.
Figure 9 - Rotor free-free test.
Figure 10 - Rotor vibration amplitude (1µµµµm=0.04mils) on AMB#1,
AMB#2 and AMB#3 with Synchronous Filters deactivated.
1st bending 2nd bending 3rd bending
Top AMB#1 120µm- Zone A (ISO14839-2)
mm
Mid Span AMB#2 120µm- Zone A (ISO14839-2)
mm
Bottom AMB#3 120µm- Zone A (ISO14839-2)
mm

Copyright © 2011 by Turbomachinery Laboratory, Texas A&M University
Figure 11 - Rotor vibration amplitude (1µµµµm=0.04mils) on AMB#1,
AMB#2 and AMB#3 with Synchronous Filters activated.
A further control system adjustment was required during
the machine performance test to limit the vibration amplitude in
the low and high frequency range as different operating points
on the performance map were explored.
Due to reduced AMB stiffness in the 10÷70 Hz frequency
range, AMB-equipped machines are susceptible to low
frequency broadband excitation induced by fluid and
aerodynamic instabilities, which increase with the gas power
delivered by the machine. During motorcompressor testing an
odd sub-synchronous vibration, tracking the rotor speed with a
ratio of approximately 1:6, was identified when the machine
was operating with higher pressure and speed. Surprisingly, the
sub-synchronous vibration was not fixed in frequency, hence
not correlated to rotor mode excitation, neither correlated to gas
flow rate and pressure ratio, which excluded the possible
correlation of the phenomena with fluid instability on
compressor impellers or stationary parts.
Figure 12 - Sub-synchronous vibration (1µµµµm=0.04mils) tracking
rotor speed.
While operating on the AMB cooling flow system to test
the effect of the cooling gas flow rate on AMB temperature, it
was found that as the flow on mid-span AMB2 was increased
by opening the valve on the injection line, the sub-synchronous
vibration suddenly disappeared, as depicted in Figure 12.The
correlation with the cooling gas injection provided an important
clue on the source of the excitation, which was corrected by
changing AMB2 cooling path and fan geometry. Overall, the
experience was an important observation on how closely
related the phenomena are in integrated machines, and how
secondary flows can impact the machine dynamic performance.
1:6 X
Cooling gas injection1X
1:6 X
Cooling gas injection1X
Figure 13 - Subsynchronous vibration (1µµµµm=0.04mils) suppressed
by injection of cooling flow on AMB2.
From a stability standpoint, the stability check based on the
peak sensitivity transfer function, combined with AMB
Supplier internal stability criteria, confirmed good stability
margin, in accordance with ISO14839-3 requirements and
predicted values, as depicted in Figure 14.
Pea
k s
ensi
tiv
ity
TF
Gai
n ISO14839-3 Zone AISO14839-3 Zone A
Pea
k s
ensi
tiv
ity
TF
Gai
n ISO14839-3 Zone A
AMB1 top
Pea
k s
ensi
tiv
ity
TF
Gai
n ISO14839-3 Zone AISO14839-3 Zone A
AMB1 top
AMB2 mid
Pea
k s
ensi
tiv
ity
TF
Gai
n
AMB3 bottom
ISO14839-3 Zone A
Pea
k s
ensi
tiv
ity
TF
Gai
n
AMB3 bottom
ISO14839-3 Zone AISO14839-3 Zone A
Figure 14 - Stability check according ISO14839-3 on AMB1 (top),
AMB (mid-span), AMB3 (bottom) – Measured (blue) and
predicted (red) Peak Sensitivity Transfer Function.
Top AMB#1 120µm- Zone A (ISO14839-2)
mm
Mid Span AMB#2 120µm- Zone A (ISO14839-2)
mm
Bottom AMB#3 120µm- Zone A (ISO14839-2)
mm

Copyright © 2011 by Turbomachinery Laboratory, Texas A&M University
System Cooling
The cooling of the motorcompressor system was
completely new since it was designed for the purpose of this
new configuration (see Figure 15). Since the cooling medium is
the process gas, a special attention was paid to protect the
electric motor and the AMBs. Regarding the AMBs, they were
protected through the canned design, which isolates the stator
coils from any contaminant present in the cooling gas. The
electric motor, on the contrary, is based on more standard
technology with stator parts directly exposed to the gas. For this
reason, special care was given by the manufacturer to increase
the coil insulation thickness and to increase the robustness
towards liquids. In any case, the cooling network was designed
to keep the electric motor volume in a controlled environment,
separate from the process. In fact, the motor cooling flow,
driven by a small fan installed on the motor shaft end, passes
through respectively the AMB#1, the motor stator and air gap,
AMB#2 and finally is routed out the casing towards an external
cooler. This is basically a closed loop where the gas is the
process gas but is provided only once for all at the startup of the
motorcompressor from the compressor after a filtering stage
(clean and dry gas).
Instead, the compressor bearing cooling is from a flow,
which is extracted from the compressor flow path after a double
filtering stage.
Finally, a buffer line is provided between the electric motor
and the centrifugal compressor to seal the motor environment
and keep it clean.
The system cooling was verified during FAT both at partial
and full load.
Figure 15 – System cooling: overall network.
The results of two different runs are shown in the figures
below. Figure 16 and Figure 17 show the AMB coil
temperatures and the EM stator temperatures relevant to the full
load test.
Figure 18 and Figure 19 show the same temperatures for a
minimum pressure case with the motorcompressor running at
MCS.
It is worthwhile to mention that both the AMBs and the
EM show critical conditions from a thermal point of view in the
following scenarios:
• Minimum pressure and maximum speed
• Full load
The AMBs are mainly heated by the windage losses in the
air gap (which are dependent especially on the rotational speed)
but the available cooling mass flow is lower when the pressure
is at the minimum level. Moreover, the EM shows lower
electrical losses when the pressure (hence the compressor load)
is at a minimum level but the point of the lower cooling mass
flow at minimum pressure holds true as well. So both the
operating conditions were checked as described below.
0%
10%
20%
30%
40%
50%
60%
70%
14.24.00 15.36.00 16.48.00 18.00.00 19.12.00 20.24.00
time
Te
mp
era
ture
/ M
AX
Allo
wa
ble
Te
mp
era
ture
[%
]
TEMP. 001A PALIER V13A(°C)
TEMP. 002A PALIER W13A(°C)
TEMP. 003A PALIER V24A(°C)
TEMP. 004A PALIER W24A(°C)
TEMP. 005A PALIER V57A(°C)
TEMP. 006A PALIER W57A(°C)
TEMP. 007A PALIER Z1A(°C)
TEMP. 008A PALIER Z2A(°C)
Figure 16 –Temperature of AMBs from full load test.
The main outcome of the FAT was the demonstration of
the cooling system full functionality at full load and the
verification of the minimum pressure achievable. In further
detail:
• The AMBs were operating below 70% maximum
allowable temperature at full load and below 95% at
45bar (652.7psi) (minimum pressure).
• The EM stator was operating below 60% maximum
allowable temperature at full load test points and
below 65% at 45bar (minimum pressure).
0%
10%
20%
30%
40%
50%
60%
14.24.00 15.36.00 16.48.00 18.00.00 19.12.00 20.24.00
time
Te
mp
era
ture
/ M
AX
Allo
wa
ble
Te
mp
era
ture
[%
]
TE-17-0207 Motor Stator Temperature U1(°C)
TE-17-0208 Motor Stator Temperature V1(°C)
TE-17-0209 Motor Stator Temperature W1(°C)
TE-17-0217 Motor End Winding Temperature(°C)
TE-17-0218 Motor End Winding Temperature(°C)
TE-17-0219 Motor End Winding Temperature(°C)
Figure 17 – EM temperatures from full load test.
0%
10%
20%
30%
40%
50%
60%
70%
80%
90%
100%
9.36.00 10.48.00 12.00.00 13.12.00 14.24.00 15.36.00
time
Te
mp
era
ture
/ M
AX
Allo
wa
ble
Te
mp
era
ture
[%
]
TEMP. 001A PALIER V13A(°C)TEMP. 002A PALIER W13A(°C)TEMP. 003A PALIER V24A(°C)TEMP. 004A PALIER W24A(°C)TEMP. 005A PALIER V57A(°C)TEMP. 006A PALIER W57A(°C)
TEMP. 007A PALIER Z1A(°C)TEMP. 008A PALIER Z2A(°C)
Figure 18 – AMB temperatures from minimum pressure test.
0%
10%
20%
30%
40%
50%
60%
70%
9.36.00 10.48.00 12.00.00 13.12.00 14.24.00 15.36.00
time
Te
mp
era
ture
/ M
AX
Allo
wa
ble
Te
mp
era
ture
[%
]
TE-17-0207 Motor Stator Temperature U1(°C)
TE-17-0208 Motor Stator Temperature V1(°C)
TE-17-0209 Motor Stator Temperature W1(°C)
TE-17-0217 Motor End Winding Temperature(°C)
TE-17-0218 Motor End Winding Temperature(°C)
TE-17-0219 Motor End Winding Temperature(°C)
Figure 19 – EM stator temperatures from minimum pressure test.

Copyright © 2011 by Turbomachinery Laboratory, Texas A&M University
The separation system which is implemented in the
compressor is also valid for the liquid phase and this feature
can be applied for wet gas conditions. In order to demonstrate
this specific capability a dedicated validation testing has been
performed in a dedicated external rig built at Southwest
Research Institute in 2010.
Figure 20 - Extraction system layout.
The extraction system (see Figure 20) is composed of an
extraction diaphragm, which separates the cooling flow from
the first stage diffuser by means of 60 quasi-counter flow holes,
acting as a primary separator and an impactor acting as a
secondary separator.
The wet gas tests were performed on a two-stage
centrifugal compressor working with air-water mixtures and
equipped with an equivalent separation system. The test
conditions were as follows:
- Suction pressure: 20bara
- Liquid volume fractions (LVF): 0.3 ÷ 5% (up to 72% in
liquid mass fraction)
1,1,
1,
lg
l
QLVF
&&
&
+= (1)
In order for the test to be representative of the real
machine, the same design criteria were used to size the
separation system of the test compressor. The impactor was
geometrically scaled down to 67% of the original one to keep
the same nozzle Mach number, while the diameter of the
extraction holes and the test conditions were chosen to match
the Stokes number.
The separation efficiency for both the diaphragm and the
impactor was measured and finally, the overall system
efficiency was calculated and is shown in Figure 21. The
overall system efficiency is defined as:
1,
2,1
l
l
Q
Q
&
&
−=η (2)
where 2,lQ& is the liquid flow rate of the extracted secondary
flow and 1,lQ& is the liquid flow rate of the compressor process
gas.
The test results show that the separation efficiency of the
extraction system is close to the typical value of high efficiency
separators: it ranges from 98.65 to 99.45% without any net
dependence on LVF.
These tests demonstrate excellent separation performance
under wet gas operation.
Figure 21 - Extraction system separation efficiency versus LVF.
Axial Load
In order to evaluate the axial load for this motorcompressor
it is necessary to analyze all the contributions along both the
electric motor and the centrifugal compressor rotor.
For this purpose a model was developed, which is represented
in Figure 22.
Figure 22 – Axial load model.
The sign convention should be noted: a positive axial load
means the rotor is pushed to the top.
The contributions to the axial load are given by the
following effects (including the direction):
• All static pressures insisting on the rotor surfaces: load
direction depends on surface position
• Centrifugal compressor primary effects (static pressure
across the stages): positive load
• Centrifugal compressor axial momentum change: negative
load
• Centrifugal compressor secondary effects (pressure
distribution in the compressor cavities): positive load
• Balance piston: negative load
The axial load predicted curves versus the compressor flow
are shown in Figure 23.
During the test, a general mismatch between the
predictions and the measurements was noticed, with the
measured axial loads greater in the downward direction
(negative sign according to the sign convention). The
measurement of the axial load was possible through the
currents of the axial magnetic bearing.
This gap made it difficult to operate the compressor in the
high flow region where the load is mainly downwards due to
the high axial momentum in the compressor section. In fact,
during the test when the compressor operating envelope was

Copyright © 2011 by Turbomachinery Laboratory, Texas A&M University
mapped, the last stable point on the right was reached due to the
saturation of the axial load capacity.
-150%
-100%
-50%
0%
50%
100%
150%
0% 25% 50% 75% 100% 125% 150% 175% 200%
volumetric flow/design flow [%]
Th
rus
t lo
ad
/ b
ea
rin
g M
AX
lo
ad
[%
]Case 13 design
MCS design
Case 11 design
Case 9 design
Case 7 design
Case 5 design
Case 3 design
Case 1 Design
Figure 23 – Axial load predicted curves.
In order to enlarge the operating range at high flow, a
trimming of the balance piston was finally performed leading to
a 6% gain in the maximum flow that could be handled. Figure
24 shows the predicted compressor envelope (defined by the
continuous curves) and the associated test points. It is easy to
see that the compressor was working properly on the operating
points (white circles); while in the high flow region the last
point corresponded to a limit in the axial load. The red line was
the original limit while the green line is the final limit after
trimming the balance piston.
Figure 24 – Compressor operating envelope.
The lesson learned from this test is that the axial load is a
critical parameter for this type of machinery and the
predictability of the axial load is even more complicated than
for traditional centrifugal compressors due to the presence of
the rest of the system. Moreover, the lower load capability of
the AMB with respect to a hydrodynamic bearing requires the
axial load estimation to be performed with a higher level of
accuracy. An uncertainty analysis on the key parameters
affecting the axial load (especially the pressure distribution
across the entire rotor) is needed for a more robust design.
Electric Motor
At the Le Creusot site the available Frequency Converter
was a drive from the MV7000 family (12MW @ 50Hz). Due to
the limitation of the drive, the maximum shaft power
achievable at 170Hz during the string test was 9.8MW
(12740HP).
A dedicated sinus filter was installed in the output of the
VFD in order to reduce the harmonic content to the motor, thus
preserving the motor insulation. The sinus filter was water-
cooled.
The motor was connected to the drive basically with 300m
(984ft) of power cables of the following sizes: one section with
3 x 400mm2 (0.62in
2) per phase and another one of
approximately 100m (328ft) with 4 x 240mm2 (0.37in
2) per
phase.
Discharge resistors (3MJ / 1.12HP-h) were installed in the
output of the sinus filter with the aim of reducing self-
excitation phenomena. The self-excitation is generated by the
resonance between the filter, power cable system and motor
when an emergency trip is commanded to the VFD (in this
case, the output inverter stop to pulse). The discharge resistors
are activated by a Ross Relay (with a release time of 80ms).
The electrical power connection in the motor-compressor
is done through a pass-through. This system replaced the job
high voltage connectors that were not suitable for connection to
the shop cabling.
On the motor side, the pass-through is connected to one of
the three flanges of the motor junction box (all 12 motor power
cables are carried out from this flange) and is able to withstand
the differential pressure between the motor room and the
external environment. On the other side, the cabling is
connected through about 3m (9.84ft) of piping to an external
junction box. The picture below shows the motor-compressor
with the pass-through system and the JB.
Figure 25 – Motor-compressor with pass-through
All motor instrumentation (voltage and current probes) was
installed in the junction box.
The motorcompressor was tested under 11 cases (over the
13 contractual operating points), each one at fixed speed;
several points were taken for each case (changing the
compressor gas flow) in order to build the compressor curves.
For each point the whole system was monitored and all data
were recorded. In this section, the measurement and results
related to the motor are presented. The relevant points from
the 11 cases are shown in Table 1.
Copyright © 2011 by Turbomachinery Laboratory, Texas A&M University
The power input to the motor were calculated from the
voltages and currents measured at the motor terminals. The
motor active power at the terminals is calculated according the
following formula:
∫ ⋅+⋅+⋅=T
fffMOTOR ivivivT
P )(1
332211 (3)
where vf1, vf2 and vf3 are the phase-to-ground voltages. The
Authors’ Company acquisition system performed these
calculations in real time.
Frequency
[Hz] Pressure
[barg]
1 63 135
2 73 130 3 82 125
4 91 120
5 99 114
6 109 109
7 119 105
8 128 99 9 148 88
10 154 85
11 178 45
12 146 88
Table 1 – Pressure (1barg= 14.5psig) and speed of the main test
points.
The Power Factor is calculated according to its definition:
S
Pfp MOTOR=.. (4)
where S is the Apparent Power.
The electric motor performance was evaluated comparing
the losses in the motor with the difference between the motor
(input) power and the process gas power, and with the heat
dissipated in the external cooler.
The expected losses in the motor come form the
calculations performed during the engineering phase; basically,
the comparison between the motor losses with the test
measurements provides the estimate of the motor performance.
The motor losses are the sum of the following three values:
• Iron losses: losses in the iron of the stator, directly
proportional to the voltage at the terminals.
• Copper losses: losses in the copper due to the currents.
• Windage: losses induced by the windage of the gas due to
the high speed of the rotor.
• DeltaP: the difference between the motor power at the
terminals and the power delivered to the process gas.
GASMOTOR PPDeltaP −= (5)
The heat dissipated in the external cooler is calculated with
the following formula:
TmHQ SP ∆⋅⋅=∆ && (6)
where HSP is the gas specific heat based on the Authors’
Company real gas database and ∆T is the difference between
the hot gas temperature (input to the cooler) and the cold gas
temperature (output from the cooler).
The main results are presented below. Figure 26 shows a
comparison between the expected efficiency and the measured
efficiency.
EFFICIENCY
1 2 3 4 5 6 7 8 9 10 11 12
points
eff
icie
ncy
expected
efficiency
efficiency
Figure 26 – Electric Motor efficiency evaluation.
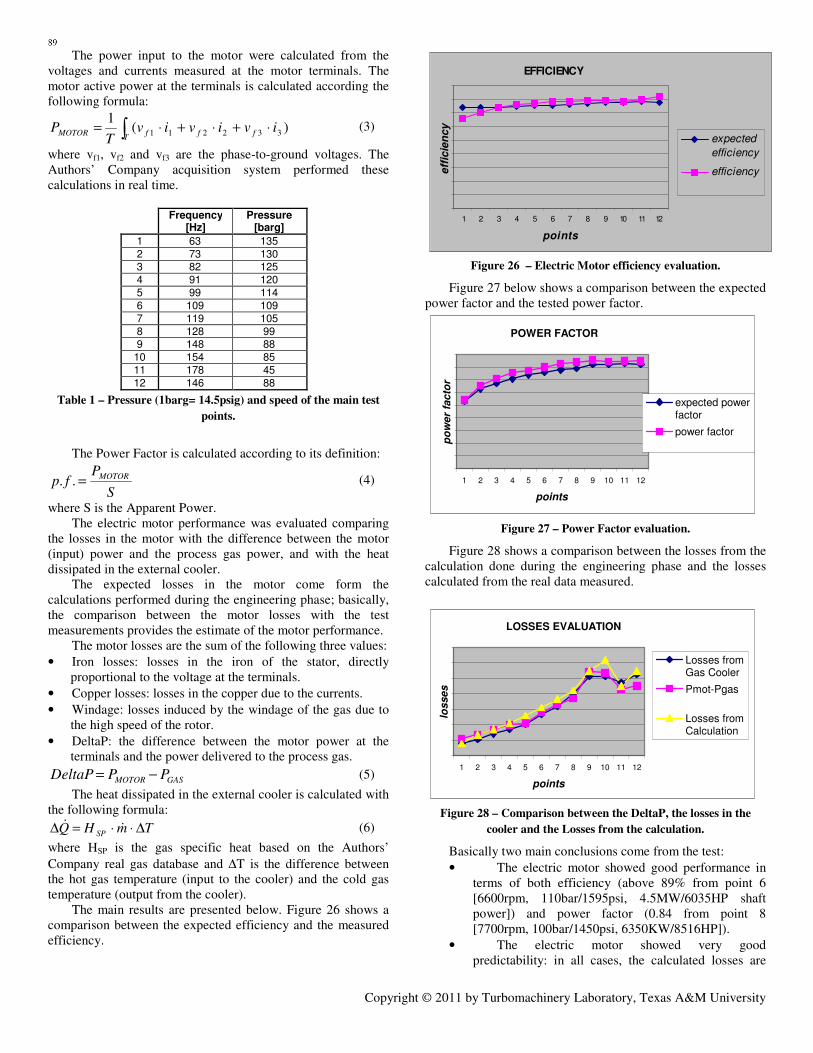
Figure 27 below shows a comparison between the expected
power factor and the tested power factor.
POWER FACTOR
1 2 3 4 5 6 7 8 9 10 11 12
points
po
wer
facto
r
expected powerfactor
power factor
Figure 27 – Power Factor evaluation.
Figure 28 shows a comparison between the losses from the
calculation done during the engineering phase and the losses
calculated from the real data measured.
LOSSES EVALUATION
1 2 3 4 5 6 7 8 9 10 11 12
points
losses
Losses fromGas Cooler
Pmot-Pgas
Losses fromCalculation
Figure 28 – Comparison between the DeltaP, the losses in the
cooler and the Losses from the calculation.
Basically two main conclusions come from the test:
• The electric motor showed good performance in
terms of both efficiency (above 89% from point 6
[6600rpm, 110bar/1595psi, 4.5MW/6035HP shaft
power]) and power factor (0.84 from point 8
[7700rpm, 100bar/1450psi, 6350KW/8516HP]).
• The electric motor showed very good
predictability: in all cases, the calculated losses are

Copyright © 2011 by Turbomachinery Laboratory, Texas A&M University
comparable to the values measured in the field (in
some cases the performance is even better than
predicted).
AMB control system
Because of the peculiarity of the environment and the
machine the project required the development a completely
new AMB control system; an architecture based on redundancy
of the main devices was defined in order to satisfy the
reliability and availability requirements. The 7-axis control
loop is implemented through a Digital Signal Processor at
13.8KHz, while the power electronics are based on the
supplier’s standard 300/30 (300 volt / 30 A).
The reason for a 7-axis control system is that the machine
is equipped with three radial and one axial bearing (totaling 7
axes: 2 X 3 radial bearings and 1 X 1 axial bearing). Until now
a 5 + 5-axis control system has been used for this type of
application.
An internal Profinet network, a sort of real-time Ethernet
communication protocol, guarantees the high throughput data
exchange between the devices that are managing the raw data
and the MBCSI (Magnetic Bearing Control System Interface),
which is collecting all data and transferring it to the topside
station.
The AMB control system is divided into two main parts:
• embedded control system, which will be installed in the
subsea environment
• remote control system; which will be installed in the
control room
The embedded part is an assembly of electronic devices
that are mainly used to implement the control loop, protection
of the machine and the interface to the remote systems.
The remote part, based on an industrial PC and dedicated
software, is used specifically for the remote tuning of the
machine and remote monitoring that continuously collects and
stores the data analyzed by the embedded system; the stored
data can be post-processed and used for diagnostic purposes.
The control system was developed in the AMBs Supplier
laboratories where it was validated through a scaled down
model of the machine rotor. The control system functionalities
were validated through extensive integration test sessions.
The string test was conducted with an industrial version of
the AMB control system for practical reasons since the
marinized version was still being qualified in a rigorous
program for that purpose. Nevertheless, both versions are
equipped with the same electronic devices and so the same
functionalities are guaranteed.
One of the most important features of the AMB control
system is the ability to be controlled and configured from a
remote control station using a network connection. A specific
tool was developed by AMBs Supplier for this purpose.
A dedicated session was organized for the validation of the
remote tuning tool. The test consisted of a comparison between
the measurements (open loop, closed loop, and sensitivity
transfer function) done using a commercial spectrum analyzer
and the measurements performed with the digital spectrum
analyzer tool included in the software suite. This tool will be
used when the machine is installed subsea (on the seabed or in
the test pit) and the control system will be no longer be
accessible with traditional equipments. This test demonstrated
that it is now possible to evaluate the rotordynamic behavior of
the system and to tailor the control loop parameters for the
motorcompressor using a remote station connected to the AMB
control system only through a network connection.
Full speed emergency landing
The final step of the FAT consisted of the rotor drop test
onto auxiliary bearings to prove the required tolerance of the
unit to unexpected rotor delevitation events that might occur
during the machine service life. Because of the extreme
importance of this feature for motorcompressor units installed
on the seabed and the requirement for very limited
maintenance, five drops from full speed condition down to
standstill were planned, as agreed by the AMB vendor, the
OEM and the final customer. The five drop test sequence,
which by far exceeded typical API617, 7th
ed. 2001,
requirements for turboexpanders [ref. Annex 4F] (generally
limited to two delevitation events and for a limited interval of
three seconds), was the most challenging and risky aspect f the
entire FAT.
For this test, the past experience on a scaled test rig for a
vertical rotor drop onto auxiliary bearings (Masala et. al, 2009)
and the results of the simulation performed to predict the
landing dynamics of the full scale machine, were leveraged and
incorporated into a drop test procedure. Starting from the
primary goal to protect the integrity of the machine, Go/No-Go
criteria were identified to decide, whether to proceed to the next
planned drop sequence or not after each drop.
Some indicators of auxiliary bearing failure had successfully
been identified during the endurance test performed at the
SwRI laboratories on the scaled test rig, as reported in Masala
et al., 2009). Since it was not possible to determine the failure
threshold level for the full-scale machine from past
experiments, the Go/No-Go criteria were based on the deviation
of the measured parameters from the 1st drop of the sequence
performed during the FAT. The following parameters were
compared to the 1st drop measured values and corresponding
limits:
• Rotor vibration amplitudes at sensor location and whirl
frequency (Ω)
• Rotor deceleration rate from 2000 rpm to minimum speed
• Vibration signature of auxiliary bearings supports
• AMB and rotor transfer function
• Clearance checks of auxiliary bearings
• Machine performance checks
The check of the rotor whirl amplitude was aimed at
verifying that the rotor orbit was lower than 75% of the
minimum clearance values inside the machine and excluding
the possibility of rotor rubbing at the AMBs and seals. In
addition, the combination of the whirl frequency and amplitude,
together with the mass of the rotor, were used to determine a
conservative value of the loads exerted on the auxiliary
bearings and to compare this value to the corresponding
allowable level.
The remaining parameters, i.e., the deceleration rate, the
vibration signature, the rotor transfer function, the auxiliary

Copyright © 2011 by Turbomachinery Laboratory, Texas A&M University
bearing checks and machine performance, were used on a
comparative basis to identify possible performance degradation
or damage of the auxiliary bearing and rotor system. To be able
to compare the mentioned parameters after each drop, all five
of the drops had to be performed from the same rotor drop
condition. This condition was selected as a reasonable
operating point of the machine running at full speed, with
suitable separation from the surge line to prevent the
compressor from surging during the transient delevitation. The
selected drop conditions are summarized below:
• Rotor Speed, ω = 10160 rpm
• Gas Suction Pressure = 64 barg (934psig)
• Gas Discharge Pressure = 106 barg (1532psig)
Prior to starting the real drop sequence, a rotor trip
simulation and a rotor re-levitation check were performed.
The trip simulation, performed from the selected drop
conditions, was aimed at assuring that the required separation
margin from the surge line was guaranteed during coast-down
and that the deceleration rate of the machine was comparable to
the forecast level. Both conditions were successfully verified
during this test. In addition, the measurements of the currents
on the axial AMB coils, collected during rotor coast-down,
provided some important tips on the transient of the resultant
loads exerted on the rotor during the drop sequence, unveiling
an unaccounted axial load inversion due to modification of the
pressure pattern profile across the rotor as the machine speed
was decreasing.
The re-levitation test, performed at rotor speed of 2000 rpm,
confirmed the capability of the AMB control system to regain
control of the rotor position after a few seconds of delevitation.
In addition, the rotor orbit clipping identified during this test, as
depicted in Figure 30, provided an important clue about the
necessity to modify the nominal sensor settings of the AMBs,
which were typically set to measure the limited rotor orbit
during normal operation of the AMBs, to be able to detect the
full orbit during the rotor drop. With the modified sensor
settings, a larger measurement range was gained.
Figure 29 - Positions (1µµµµm=0.04mils) on the 1st bearing (blue) and
axial bearing (red) during partial landing.
Figure 30: AMB1 (a) , AMB2 (b) and AMB3 (c) rotor orbits
(1µµµµm=0.04mils) during rotor partial landing test at 2000rpm
Upon reestablishing the correct sensor parameters, the five
drop sequence was finally initiated.
The main insights gained from the drop sequence are
summarized below:
1) The rotor whirl frequency was forward and equal to 43 Hz
at its peak value after approximately 1 second from the
delevitation event;
2) A correlation between the axial load dynamics and the
whirl frequency was detected; the whirl frequency
increased as the axial load increased at a certain time in
the coast-down;
3) The whirl amplitude exceeded the air gap of the auxiliary
bearings and damping system compliance, confirming that
the auxiliary bearings and supports compliance need to be
accounted to predict reasonable vibration amplitudes and
set proper internal clearance of the machine.
Figure 31: Vibration Waterfall Plot (1µµµµm=0.04mils) on AMB1
(a), AMB2 (b) and AMB3 (c) during rotor drop from 10160rpm.
Figure 32: Vibration Orbits Plot (1µµµµm=0.04mils) on AMB1 (a),
AMB2 (b) and AMB3 (c) during rotor drop from 10160rpm.
A detailed description of the rotordynamics during the
delevitation event and a comparison with the simulation is
given in Masala et al. 2011.
Due to the repeatability of the drop measurements and
check parameters, indicating no meaningful deviation from the
1st drop, together with the vibration amplitude and frequency
being bounded within acceptable limits, the five drop tests were
successfully completed.
Upon disassembling of the machine, the auxiliary bearings,
landing sleeves and machine internal parts were thoroughly
inspected to identify possible wear experienced during the rotor
drop.
The visual and laboratory analysis performed on the
auxiliary bearings confirmed very good health of these
bearings, with evidence of partial degradation of the dry
lubricant film on the balls but no significant of material loss or
overheating. The auxiliary bearing races and landing sleeves
were smooth and showed limited scratches on the radial and
axial contact areas.
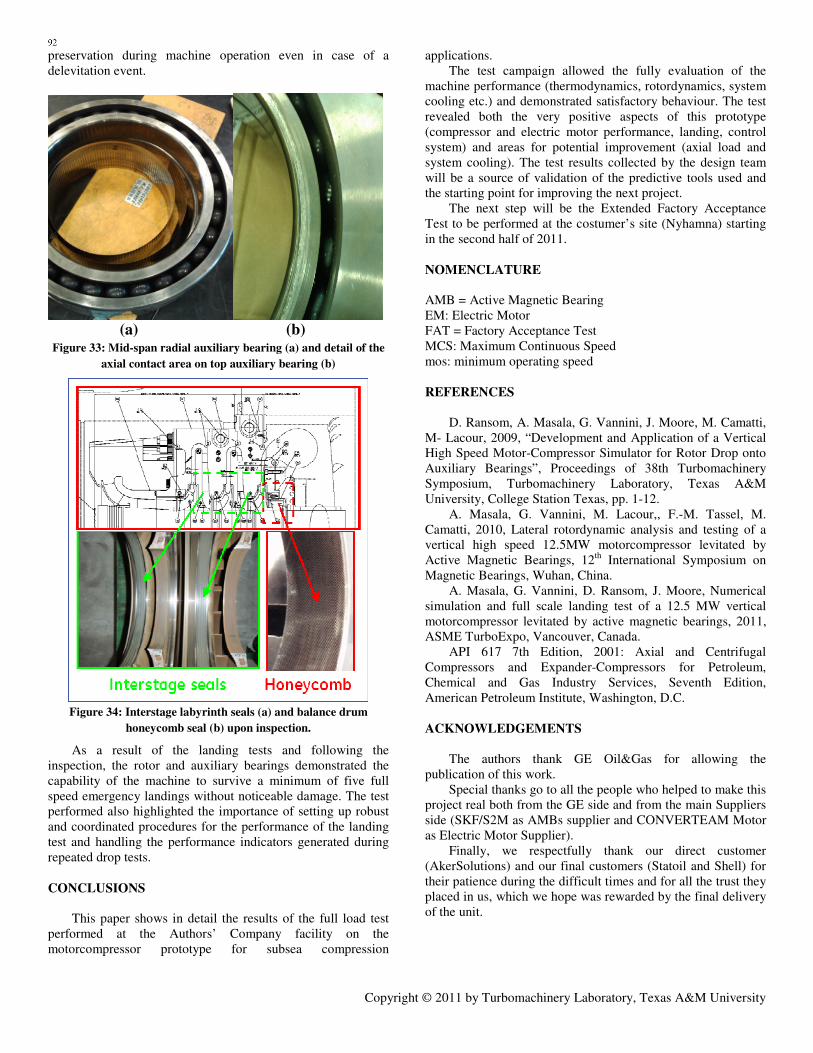
The inspection of the machine internal parts, as depicted in
Figure 34 confirmed that no contact between the rotor and the
seals had occurred during the landing tests and the correct
setting of the internal clearance for optimized performance and
Rotor speed
Rotor whirl Rotor whirl Rotor whirl
Rotor speed Rotor speed
Copyright © 2011 by Turbomachinery Laboratory, Texas A&M University
preservation during machine operation even in case of a
delevitation event.
(a) (b) Figure 33: Mid-span radial auxiliary bearing (a) and detail of the
axial contact area on top auxiliary bearing (b)
Figure 34: Interstage labyrinth seals (a) and balance drum
honeycomb seal (b) upon inspection.
As a result of the landing tests and following the
inspection, the rotor and auxiliary bearings demonstrated the
capability of the machine to survive a minimum of five full
speed emergency landings without noticeable damage. The test
performed also highlighted the importance of setting up robust
and coordinated procedures for the performance of the landing
test and handling the performance indicators generated during
repeated drop tests.
CONCLUSIONS
This paper shows in detail the results of the full load test
performed at the Authors’ Company facility on the
motorcompressor prototype for subsea compression
applications.
The test campaign allowed the fully evaluation of the
machine performance (thermodynamics, rotordynamics, system
cooling etc.) and demonstrated satisfactory behaviour. The test
revealed both the very positive aspects of this prototype
(compressor and electric motor performance, landing, control
system) and areas for potential improvement (axial load and
system cooling). The test results collected by the design team
will be a source of validation of the predictive tools used and
the starting point for improving the next project.
The next step will be the Extended Factory Acceptance
Test to be performed at the costumer’s site (Nyhamna) starting
in the second half of 2011.
NOMENCLATURE
AMB = Active Magnetic Bearing
EM: Electric Motor
FAT = Factory Acceptance Test
MCS: Maximum Continuous Speed
mos: minimum operating speed
REFERENCES
D. Ransom, A. Masala, G. Vannini, J. Moore, M. Camatti,
M- Lacour, 2009, “Development and Application of a Vertical
High Speed Motor-Compressor Simulator for Rotor Drop onto
Auxiliary Bearings”, Proceedings of 38th Turbomachinery
Symposium, Turbomachinery Laboratory, Texas A&M
University, College Station Texas, pp. 1-12.
A. Masala, G. Vannini, M. Lacour,, F.-M. Tassel, M.
Camatti, 2010, Lateral rotordynamic analysis and testing of a
vertical high speed 12.5MW motorcompressor levitated by
Active Magnetic Bearings, 12th
International Symposium on
Magnetic Bearings, Wuhan, China.
A. Masala, G. Vannini, D. Ransom, J. Moore, Numerical
simulation and full scale landing test of a 12.5 MW vertical
motorcompressor levitated by active magnetic bearings, 2011,
ASME TurboExpo, Vancouver, Canada.
API 617 7th Edition, 2001: Axial and Centrifugal
Compressors and Expander-Compressors for Petroleum,
Chemical and Gas Industry Services, Seventh Edition,
American Petroleum Institute, Washington, D.C.
ACKNOWLEDGEMENTS
The authors thank GE Oil&Gas for allowing the
publication of this work.
Special thanks go to all the people who helped to make this
project real both from the GE side and from the main Suppliers
side (SKF/S2M as AMBs supplier and CONVERTEAM Motor
as Electric Motor Supplier).
Finally, we respectfully thank our direct customer
(AkerSolutions) and our final customers (Statoil and Shell) for
their patience during the difficult times and for all the trust they
placed in us, which we hope was rewarded by the final delivery
of the unit.