Embed Size (px)
Citation preview
December 2012
Full-Cost Water Pricing Guidebook for Sustainable Community Water Systems

FULL-COST WATER PRICING GUIDEBOOK FOR SUSTAINABLE COMMUNITY WATER SYSTEMSIIII
Acknowledgements
A special thank you goes to the following reviewers of previous versions of this report:
Gerry Bakker, Financial Analyst, U.S. Environmental Protection Agency Region 5 Sustainability Team
Janice Beecher, Ph.D., Director, Institute of Public Utilities, Michigan State University
Andrew Bielanski, Environmental Engineer, U.S. EPA Region 5 Sustainability Team
Tim Loftus, Ph.D., Water Resource Planner, Chicago Metropolitan Agency for Planning Environment and Natural Resources Planning
Bud Mason, State Rural Development Coordinator, Illinois Association of Community Action Agencies/ Rural Community Assistance Program
Paul May, P.E., Director of Public Works and Village Engineer, Burr Ridge
Commissioner Erin M. O’Connell-Diaz, Illinois Commerce Commission
Kristin Rehg, Management Analyst, City of Evanston Utilities Department
Sahana Rao, Water Resources Intern, Illinois Indiana Sea Grant
Karla Olson Teasley, President, Illinois American Water
Dave Sheard, Former Assistant Administrator, Wisconsin Public Service Commission
Peter Wallers, P.E., President, Engineering Enterprises, Inc.
This project has been made possible through a collaboration between the Chicago Metropolitan Agency for Planning, IIlinois-Indiana Sea Grant and the University of Illinois Extension supporting the work of Margaret Schneemann Water Resource Economist.
Chicago Metropolitan Agency for Planning (CMAP) CMAP is the official regional planning organization for the northeastern Illinois counties of Cook, DuPage, Kane, Kendall, Lake, McHenry, and Will. CMAP developed and now leads the implementation of GO TO 2040, metropolitan Chicago’s first comprehensive regional plan in more than 100 years. To address anticipated population growth of more than 2 million new residents, GO TO 2040 establishes coordinated strategies that help the region’s 284 communities address transportation, housing, economic development, open space, environmental, and other quality-of-life issues. See www.cmap.illinois.gov for more information.
Illinois-Indiana Sea Grant Illinois-Indiana Sea Grant (IISG) IlSG is one of 33 college programs nationwide, and is dedicated to conducting research, education, and outreach to serve Lake Michigan’s southern coast. With its mandate to bring the latest university-based science to those who need it, IISG brings together scientists, educators, policy makers, community decision makers, outreach specialists, business leaders, and the general public to work towards a sustainable environment and economy. Visit www.iiseagrant.org.
University of Illinois Extension University of Illinois Extension is the flagship outreach effort of the University of Illinois at Urbana-Champaign, offering educational programs to residents of all of Illinois’ 102 counties — and far beyond.Through learning partnerships that put knowledge to work, U of I Extension’s programs are aimed at making life better, healthier, safer, and more profitable for individuals and their communities. See web.extension.illinois.edu/state for more information.
III
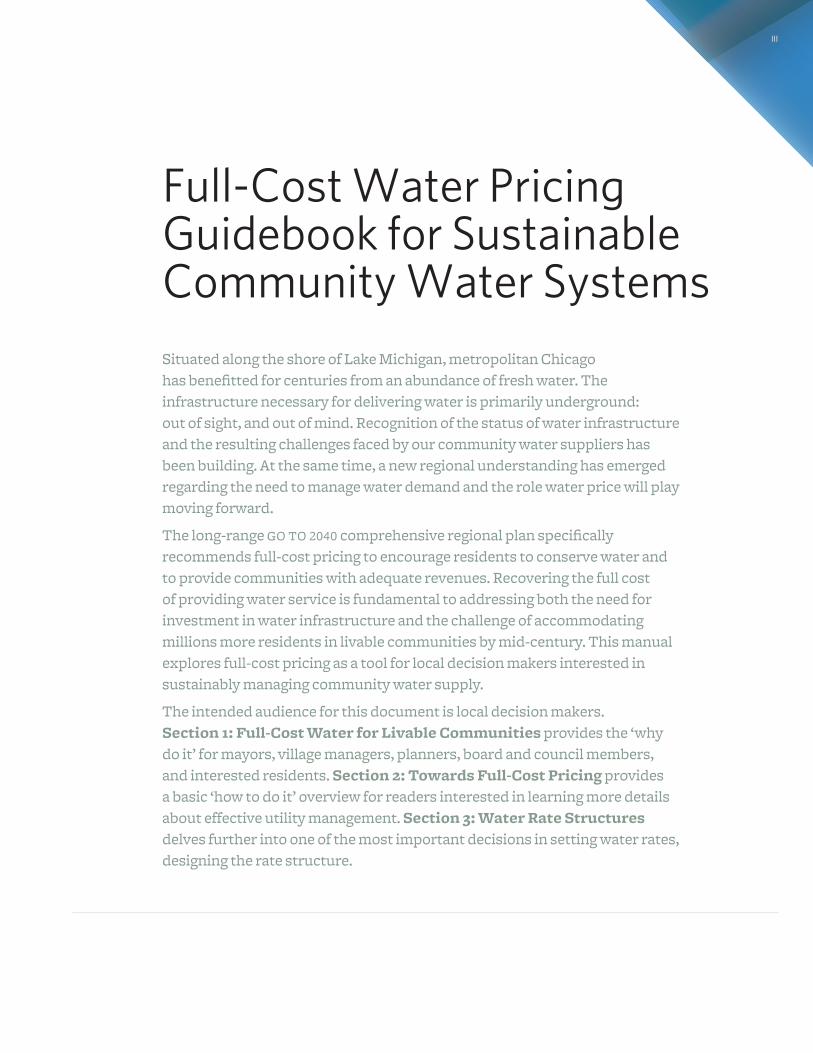
Full-Cost Water Pricing Guidebook for Sustainable Community Water SystemsSituated along the shore of Lake Michigan, metropolitan Chicago has benefitted for centuries from an abundance of fresh water. The infrastructure necessary for delivering water is primarily underground: out of sight, and out of mind. Recognition of the status of water infrastructure and the resulting challenges faced by our community water suppliers has been building. At the same time, a new regional understanding has emerged regarding the need to manage water demand and the role water price will play moving forward.
The long-range GO TO 2040 comprehensive regional plan specifically recommends full-cost pricing to encourage residents to conserve water and to provide communities with adequate revenues. Recovering the full cost of providing water service is fundamental to addressing both the need for investment in water infrastructure and the challenge of accommodating millions more residents in livable communities by mid-century. This manual explores full-cost pricing as a tool for local decision makers interested in sustainably managing community water supply.
The intended audience for this document is local decision makers. Section 1: Full-Cost Water for Livable Communities provides the ‘why do it’ for mayors, village managers, planners, board and council members, and interested residents. Section 2: Towards Full-Cost Pricing provides a basic ‘how to do it’ overview for readers interested in learning more details about effective utility management. Section 3: Water Rate Structures delves further into one of the most important decisions in setting water rates, designing the rate structure.
III

IV
V
Section 1. Full-Cost Water for Livable Communities 1
Sustainable Water Financing 2
The Evolution of Full-Cost Pricing 4
The Rationale for Full-Cost Pricing 6
Section 2. Towards Full-Cost Water Pricing 11
Getting the House in Order 13
Sustainable Infrastructure Planning: Where Do You Want to Go? 15
Rate Setting 20
Consider the Value of Water 26
Build Community Support 27
Evaluate 30
Policy Analysis of a Price Adjustment 31
Section 3. Water Rate Structures 33
Water Rate Schedules in Northeastern Illinois 33
Flat Rate 34
Volumetric Rate 34
Two-Part Rate 37
Seasonal Rate 38
Marginal-Cost Pricing 39
Other Rate Design Considerations 42
Conclusion 45
Appendix: Full-Cost Accounting 46
Selected Resources and Further Reading 49
Table of Contents
V
VI
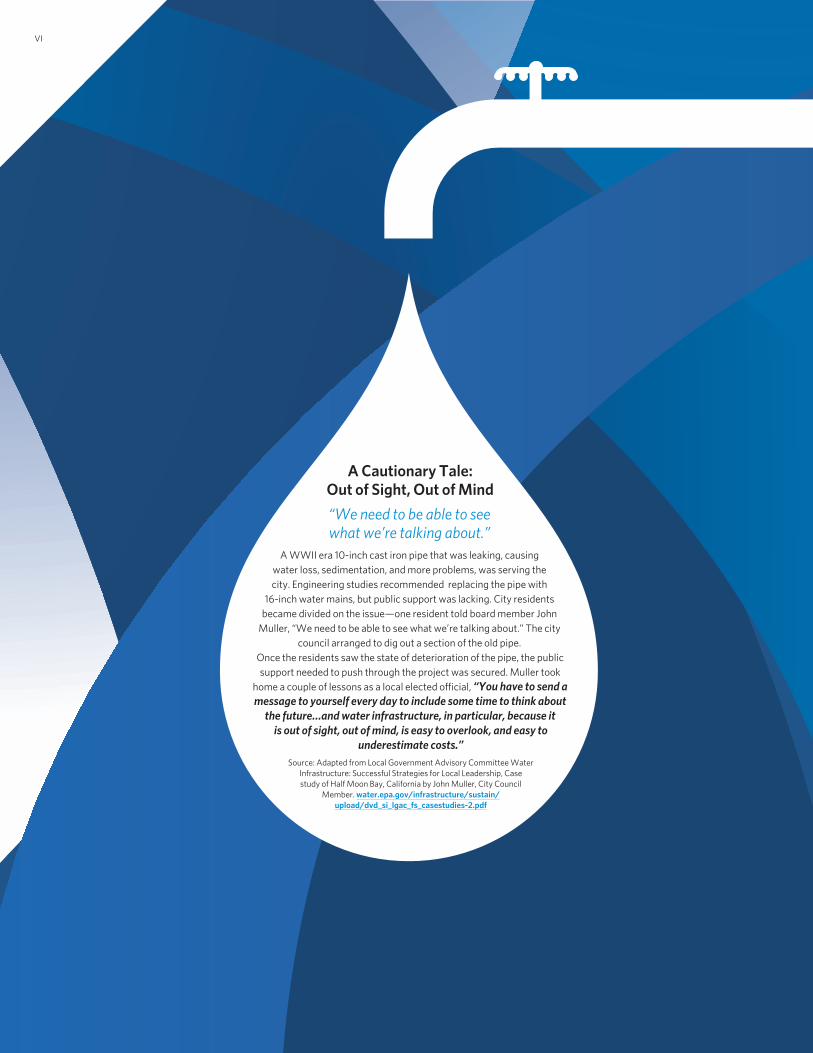
A Cautionary Tale: Out of Sight, Out of Mind
“We need to be able to see what we’re talking about.”
A WWII era 10-inch cast iron pipe that was leaking, causing water loss, sedimentation, and more problems, was serving the city. Engineering studies recommended replacing the pipe with
16-inch water mains, but public support was lacking. City residents became divided on the issue—one resident told board member John
Muller, “We need to be able to see what we’re talking about.” The city council arranged to dig out a section of the old pipe.
Once the residents saw the state of deterioration of the pipe, the public support needed to push through the project was secured. Muller took
home a couple of lessons as a local elected official, “You have to send a message to yourself every day to include some time to think about
the future…and water infrastructure, in particular, because it is out of sight, out of mind, is easy to overlook, and easy to
underestimate costs.”Source: Adapted from Local Government Advisory Committee Water
Infrastructure: Successful Strategies for Local Leadership, Case study of Half Moon Bay, California by John Muller, City Council
Member. water.epa.gov/infrastructure/sustain/upload/dvd_si_lgac_fs_casestudies-2.pdf
1
Potable water that is available on demand costs northeastern Illinois residents an average of $20 per month, less than other utility services such as monthly cable TV or cell phone service.1 The infrastructure necessary for delivering water and removing one’s wastewater is primarily underground: out of sight and out of mind. Yet, similar to more visible infrastructure like roads and bridges, water infrastructure grows old, deteriorates, and needs rehabilitation or replacement. Recognition of the status of water and wastewater infrastructure and the resulting challenges faced by our community water suppliers has been building. At the same time, a new regional understanding has emerged regarding the need to manage water demand and the role water price will play moving forward.
Water 2050: Northeastern Illinois Regional Water Supply/Demand Plan suggests that the region’s water supplies should not be taken for granted. Water 2050 emphasizes a new commitment to demand management, a suite of strategies reinforced in the region’s comprehensive plan, GO TO 2040. Recovering the full cost of providing water service is a complementary strategy and one that is fundamental to addressing both the need for investment in water infrastructure and the challenge of accommodating millions more residents in livable communities by mid-century.2
Section 1 Full-Cost Water Pricing for Livable Communities
This report guides community water systems toward sustainable full-cost pricing practices. Local officials, utility staff members, and individual residents create sustainable water systems through effective planning and decisions. Though definitions of community water system sustainability differ, sustainable systems tend to share some common traits: they have adequate water supplies that meet health and safety standards, have sufficient revenue, and encourage efficient water use. While the Chicago Metropolitan Agency for Planning (CMAP) and Illinois-Indiana Sea Grant (IISG) can help local governments address issues of sustainable water supply in their communities, decisions such as setting water rates will continue to be made locally. Communities across our region differ in factors affecting water use and system design, and each community will therefore uniquely define objectives regarding water use, efficiency, and pricing. With community-defined objectives in place, however, it will be easier to determine the best approach to take toward full-cost pricing.
1 Chicago Metropolitan Agency for Planning. 2008. Water Rate Survey: Northeastern Illinois, Unpublished Data.
2 B. Dziegielewski and F.J. Chowdhury. 2008. Regional Water Demand Scenarios for Northeastern Illinois: 2005-2050. Project Completion Report. Southern Illinois University Carbondale.
Situated along the shore of Lake Michigan, metropolitan Chicago has benefitted for centuries from an abundance of fresh water. The long-range GO TO 2040 comprehensive regional plan suggests these supplies not be taken for granted. Promoting sustainable water supplies in our region starts with recognizing the value of water and getting the price right.
3 Mayors Water Council Who Pays for the Water Pipes, Pumps, and Treatment Works? Local Government Expenditures on Sewer and Water- 1991 to 2005. Local government spending comprises over 99 percent of combined state and local expenditures on water suply
4 U.S. EPA Planning for Sustainability: A Handbook for Water and Wastewater Utilities, February 2012.
5 See Mehan, G. Tracy III. Diamonds and Water: Facing Up to the Full-cost of Utility Services. The Pipeline January/Feb 2008 and www.epa.gov/owm/gapreport.pdf. According to the U.S. EPA, using a combination of asset management and full-cost pricing enables communities to shrink their infrastructure funding shortfall, which is the difference between needed revenue and current revenue.
6 CMAP 2008 Survey of Water Utilities of Northeastern Illinois.
FULL-COST WATER PRICING GUIDEBOOK FOR SUSTAINABLE COMMUNITY WATER SYSTEMS2
DRINKING WATER
WASTE WATER
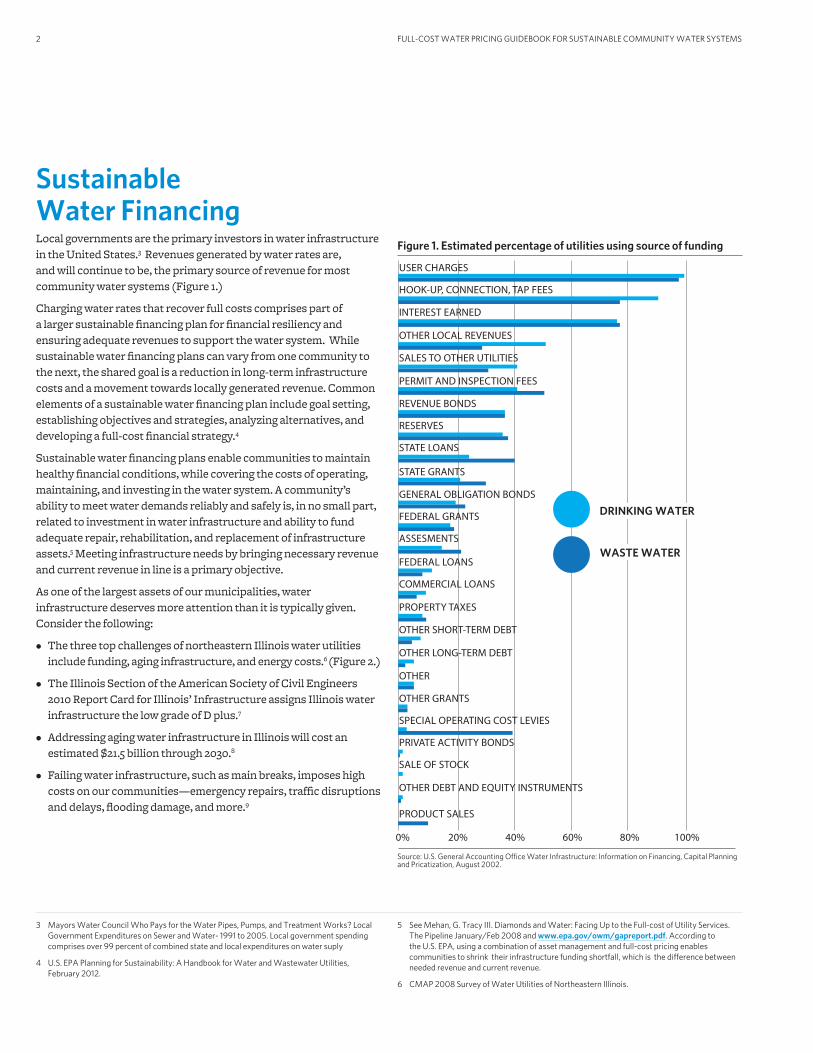
USER CHARGES
HOOK-UP, CONNECTION, TAP FEES
INTEREST EARNED
OTHER LOCAL REVENUES
SALES TO OTHER UTILITIES
PERMIT AND INSPECTION FEES
REVENUE BONDS
RESERVES
STATE LOANS
STATE GRANTS
GENERAL OBLIGATION BONDS
FEDERAL GRANTS
ASSESMENTS
FEDERAL LOANS
COMMERCIAL LOANS
PROPERTY TAXES
OTHER SHORT-TERM DEBT
OTHER LONG-TERM DEBT
OTHER
OTHER GRANTS
SPECIAL OPERATING COST LEVIES
PRIVATE ACTIVITY BONDS
SALE OF STOCK
OTHER DEBT AND EQUITY INSTRUMENTS
PRODUCT SALES
0% 20% 40% 60% 80% 100%
Sustainable Water FinancingLocal governments are the primary investors in water infrastructure in the United States.3 Revenues generated by water rates are, and will continue to be, the primary source of revenue for most community water systems (Figure 1.)
Charging water rates that recover full costs comprises part of a larger sustainable financing plan for financial resiliency and ensuring adequate revenues to support the water system. While sustainable water financing plans can vary from one community to the next, the shared goal is a reduction in long-term infrastructure costs and a movement towards locally generated revenue. Common elements of a sustainable water financing plan include goal setting, establishing objectives and strategies, analyzing alternatives, and developing a full-cost financial strategy.4
Sustainable water financing plans enable communities to maintain healthy financial conditions, while covering the costs of operating, maintaining, and investing in the water system. A community’s ability to meet water demands reliably and safely is, in no small part, related to investment in water infrastructure and ability to fund adequate repair, rehabilitation, and replacement of infrastructure assets.5 Meeting infrastructure needs by bringing necessary revenue and current revenue in line is a primary objective.
As one of the largest assets of our municipalities, water infrastructure deserves more attention than it is typically given. Consider the following:
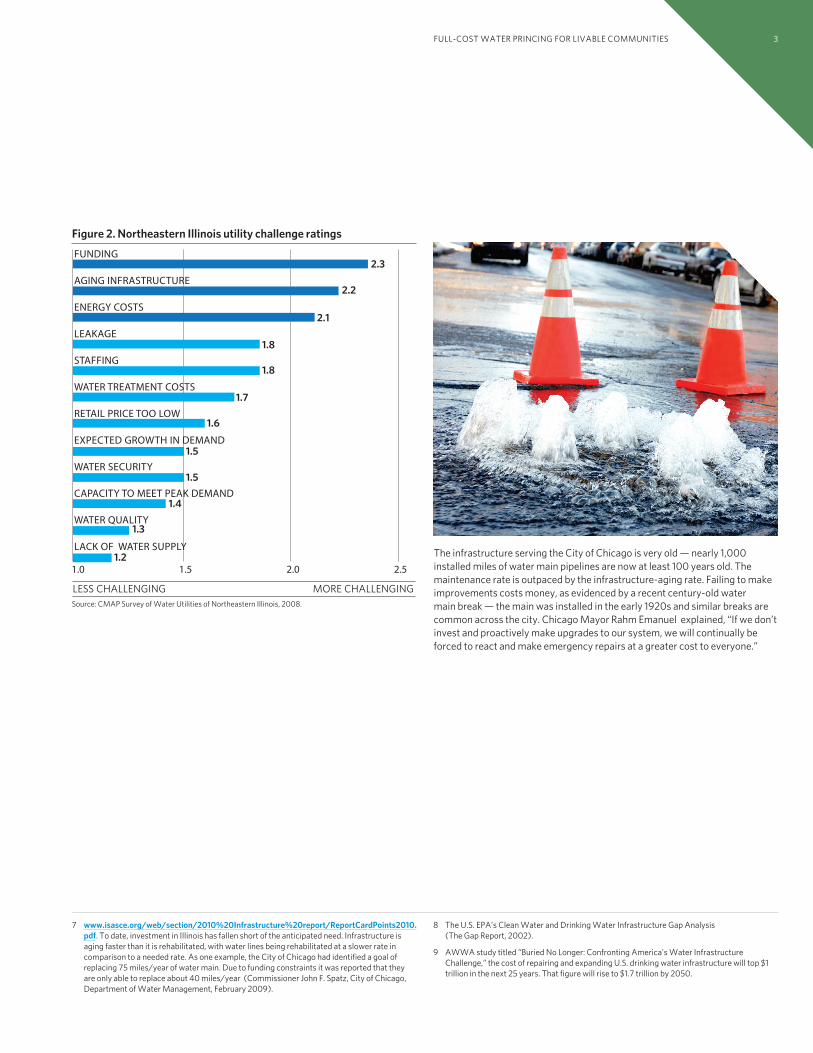
• The three top challenges of northeastern Illinois water utilities include funding, aging infrastructure, and energy costs.6 (Figure 2.)
• The Illinois Section of the American Society of Civil Engineers 2010 Report Card for Illinois’ Infrastructure assigns Illinois water infrastructure the low grade of D plus.7
• Addressing aging water infrastructure in Illinois will cost an estimated $21.5 billion through 2030.8
• Failing water infrastructure, such as main breaks, imposes high costs on our communities—emergency repairs, traffic disruptions and delays, flooding damage, and more.9
Figure 1. Estimated percentage of utilities using source of funding
Source: U.S. General Accounting Office Water Infrastructure: Information on Financing, Capital Planning and Pricatization, August 2002.
3
7 www.isasce.org/web/section/2010%20Infrastructure%20report/ReportCardPoints2010.pdf. To date, investment in Illinois has fallen short of the anticipated need. Infrastructure is aging faster than it is rehabilitated, with water lines being rehabilitated at a slower rate in comparison to a needed rate. As one example, the City of Chicago had identified a goal of replacing 75 miles/year of water main. Due to funding constraints it was reported that they are only able to replace about 40 miles/year (Commissioner John F. Spatz, City of Chicago, Department of Water Management, February 2009).
8 The U.S. EPA’s Clean Water and Drinking Water Infrastructure Gap Analysis (The Gap Report, 2002).
9 AWWA study titled “Buried No Longer: Confronting America’s Water Infrastructure Challenge,” the cost of repairing and expanding U.S. drinking water infrastructure will top $1 trillion in the next 25 years. That figure will rise to $1.7 trillion by 2050.
The infrastructure serving the City of Chicago is very old — nearly 1,000 installed miles of water main pipelines are now at least 100 years old. The maintenance rate is outpaced by the infrastructure-aging rate. Failing to make improvements costs money, as evidenced by a recent century-old water main break — the main was installed in the early 1920s and similar breaks are common across the city. Chicago Mayor Rahm Emanuel explained, “If we don’t invest and proactively make upgrades to our system, we will continually be forced to react and make emergency repairs at a greater cost to everyone.”
FULL-COST WATER PRINCING FOR LIVABLE COMMUNITIES
FUNDING
AGING INFRASTRUCTURE
ENERGY COSTS
LEAKAGE
STAFFING
WATER TREATMENT COSTS
RETAIL PRICE TOO LOW
EXPECTED GROWTH IN DEMAND
WATER SECURITY
CAPACITY TO MEET PEAK DEMAND
WATER QUALITY
LACK OF WATER SUPPLY
1.0 1.5 2.0 2.5
LESS CHALLENGING MORE CHALLENGING
2.3
2.2
2.1
1.8
1.8
1.7
1.6
1.5
1.5
1.4
1.3
1.2
Figure 2. Northeastern Illinois utility challenge ratings
Source: CMAP Survey of Water Utilities of Northeastern Illinois, 2008.
10 Human Development Report 2006, United Nations Development Programme.
11 The Price of Water: A Comparison of Water Rates, Usage in 30 U.S. Cities 2010. www. circleofblue.org/waternews/2010/world/the-price-of-water-a-comparison-of-water-rates-usage-in-30-u-s-cities/.
12 EPA Case Studies of Sustainable Water and Wastewater Pricing 2005 Office of Water (2007).
13 www.epa.gov/safewater/smallsystems/pdfs/guide_smallsystems_fullcost_pricing_case_studies.pdf.
14 This expanded view of full-cost pricing, where the complete economic costs are considered, is part of the legal framework of the European Union Water Framework Directive, which sets a global standard for integrating economics into water management, along with Australia’s National Water Initiative.
FULL-COST WATER PRICING GUIDEBOOK FOR SUSTAINABLE COMMUNITY WATER SYSTEMS4
The Evolution of Full-Cost PricingWater use in the United States is the highest in the world.10 While there is great variation in both water use and price across the country, the price we pay for this abundance of water is lower on average in the Great Lakes region than other areas of the United States.11 As our water use habits demonstrate, Great Lakes communities have generally embraced abundant, low-cost water. Anticipated population growth across the communities in our region through mid-century means that water demands and infrastructure needs will also evolve, requiring a fresh look at how we approach water—especially if we hope to ensure adequate water availability for livable communities and continued economic development going forward.
Interest in full-cost pricing as a water management tool is growing across the United States as well as the Great Lakes region. For example, The Johnson Foundation Wingspread Convening Report identifies a lack of full-cost pricing as one of the primary challenges communities face in financing more sustainable water infrastructure systems. The U.S. Environmental Protection Agency’s (U.S. EPA) Planning for Sustainability: A Handbook for Water and Wastewater Utilities provides guidance on incorporating sustainability practices into planning, a core element of which is ensuring prices cover full costs. In addition, the Great Lakes Protection Fund’s Value of the Great Lakes Water Initiative: Water Pricing Primer for the Great Lakes Region (2010) states, “An economically efficient [water] rate recovers the utility’s full cost of service to ensure financial sustainability.” Early use of the term full-cost pricing referred to the business practice of charging a price equal to production cost, “recouping the entire cost of water provision through rates, fees, charges, and other revenue derived from water sales.” 12 Cost recovery refers to revenues sufficient to pay the cost of water services, including costs of operations, maintenance, repair, and ultimate replacement of the infrastructure.
Some utilities have successfully implemented sustainable water rates, as profiled in the U.S. EPA’s 2005 Case Studies of Sustainable Water and Wastewater Pricing.13 These case studies demonstrate that a wide range of approaches can be taken by communities implementing sustainable pricing. The common outcome is that price signals promote efficient water use, reduced dependence of communities on subsidies, integration of demand-management and full-cost pricing, and revenue sufficient for infrastructure investment.
The term full-cost pricing can also be used to include all costs to society occurring as a result of producing and consuming a product. This includes both production costs and any scarcity and environmental costs.14 Scarcity costs reflect costs due to water resource over-use and depletion. Environmental costs capture the costs of damage that water supply uses place on the environment and ecosystem.
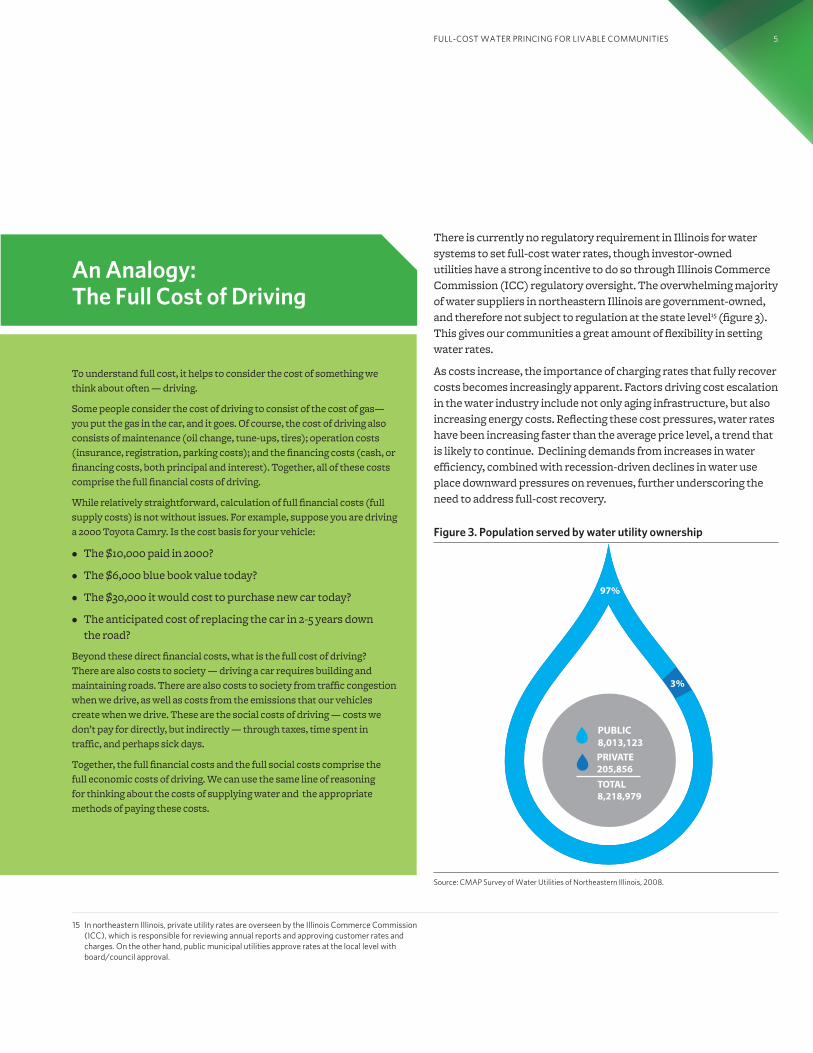
There is currently no regulatory requirement in Illinois for water systems to set full-cost water rates, though investor-owned utilities have a strong incentive to do so through Illinois Commerce Commission (ICC) regulatory oversight. The overwhelming majority of water suppliers in northeastern Illinois are government-owned, and therefore not subject to regulation at the state level15 (figure 3). This gives our communities a great amount of flexibility in setting water rates.
As costs increase, the importance of charging rates that fully recover costs becomes increasingly apparent. Factors driving cost escalation in the water industry include not only aging infrastructure, but also increasing energy costs. Reflecting these cost pressures, water rates have been increasing faster than the average price level, a trend that is likely to continue. Declining demands from increases in water efficiency, combined with recession-driven declines in water use place downward pressures on revenues, further underscoring the need to address full-cost recovery.
15 In northeastern Illinois, private utility rates are overseen by the Illinois Commerce Commission (ICC), which is responsible for reviewing annual reports and approving customer rates and charges. On the other hand, public municipal utilities approve rates at the local level with board/council approval.
FULL-COST WATER PRINCING FOR LIVABLE COMMUNITIES 5
An Analogy: The Full Cost of Driving
To understand full cost, it helps to consider the cost of something we think about often — driving.
Some people consider the cost of driving to consist of the cost of gas—you put the gas in the car, and it goes. Of course, the cost of driving also consists of maintenance (oil change, tune-ups, tires); operation costs (insurance, registration, parking costs); and the financing costs (cash, or financing costs, both principal and interest). Together, all of these costs comprise the full financial costs of driving.
While relatively straightforward, calculation of full financial costs (full supply costs) is not without issues. For example, suppose you are driving a 2000 Toyota Camry. Is the cost basis for your vehicle:
• The $10,000 paid in 2000?
• The $6,000 blue book value today?
• The $30,000 it would cost to purchase new car today?
• The anticipated cost of replacing the car in 2-5 years down the road?
Beyond these direct financial costs, what is the full cost of driving? There are also costs to society — driving a car requires building and maintaining roads. There are also costs to society from traffic congestion when we drive, as well as costs from the emissions that our vehicles create when we drive. These are the social costs of driving — costs we don’t pay for directly, but indirectly — through taxes, time spent in traffic, and perhaps sick days.
Together, the full financial costs and the full social costs comprise the full economic costs of driving. We can use the same line of reasoning for thinking about the costs of supplying water and the appropriate methods of paying these costs.
97%
3%
PUBLIC8,013,123PRIVATE205,856TOTAL8,218,979
Figure 3. Population served by water utility ownership
Source: CMAP Survey of Water Utilities of Northeastern Illinois, 2008.
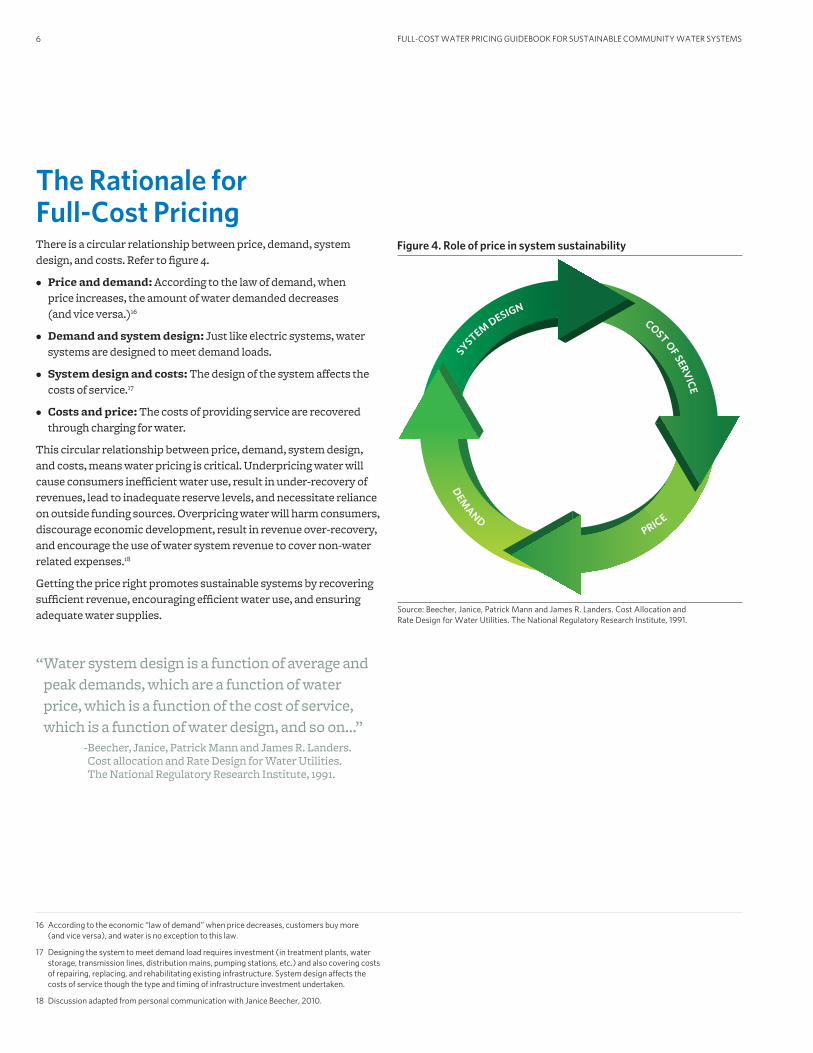
The Rationale for Full-Cost PricingThere is a circular relationship between price, demand, system design, and costs. Refer to figure 4.
• Price and demand: According to the law of demand, when price increases, the amount of water demanded decreases (and vice versa.)16
• Demand and system design: Just like electric systems, water systems are designed to meet demand loads.
• System design and costs: The design of the system affects the costs of service.17
• Costs and price: The costs of providing service are recovered through charging for water.
This circular relationship between price, demand, system design, and costs, means water pricing is critical. Underpricing water will cause consumers inefficient water use, result in under-recovery of revenues, lead to inadequate reserve levels, and necessitate reliance on outside funding sources. Overpricing water will harm consumers, discourage economic development, result in revenue over-recovery, and encourage the use of water system revenue to cover non-water related expenses.18
Getting the price right promotes sustainable systems by recovering sufficient revenue, encouraging efficient water use, and ensuring adequate water supplies.
“ Water system design is a function of average and peak demands, which are a function of water price, which is a function of the cost of service, which is a function of water design, and so on…”
- Beecher, Janice, Patrick Mann and James R. Landers. Cost allocation and Rate Design for Water Utilities. The National Regulatory Research Institute, 1991.
16 According to the economic “law of demand” when price decreases, customers buy more (and vice versa), and water is no exception to this law.
17 Designing the system to meet demand load requires investment (in treatment plants, water storage, transmission lines, distribution mains, pumping stations, etc.) and also covering costs of repairing, replacing, and rehabilitating existing infrastructure. System design affects the costs of service though the type and timing of infrastructure investment undertaken.
18 Discussion adapted from personal communication with Janice Beecher, 2010.
FULL-COST WATER PRICING GUIDEBOOK FOR SUSTAINABLE COMMUNITY WATER SYSTEMS6
PRICE
COST OF SERV
ICE
SYSTEM DESIGN
DEM
AND
Source: Beecher, Janice, Patrick Mann and James R. Landers. Cost Allocation and Rate Design for Water Utilities. The National Regulatory Research Institute, 1991.
Figure 4. Role of price in system sustainability
19 AWWA Water and Sewer Rates: Full Cost Recovery March 2006. Statement of Policy On Public Water Supply Matters–Financing, Accounting and Rates. www.awwa.org/about/oandc/officialdocs/AWWASTAT.cfm.
20 The Governmental Accounting Standards Board (GASB) establishes accounting and financial reporting standards for state and local government entities. Investor owned utilities comply with Securities and Exchange Commission standards, which rely on the National Association of Regulatory Utility Commissioners (NARUC). Illinois has adapted a system of accounts for water comparable to NARUC’s, but the state has no requirement that municipal utilities adhere to a uniform system of accounts.
21 Discussion adapted from Raftelis, George A. Water and Wastewater Finance and Pricing: A Comprehensive Guide.
FULL-COST WATER PRINCING FOR LIVABLE COMMUNITIES 7
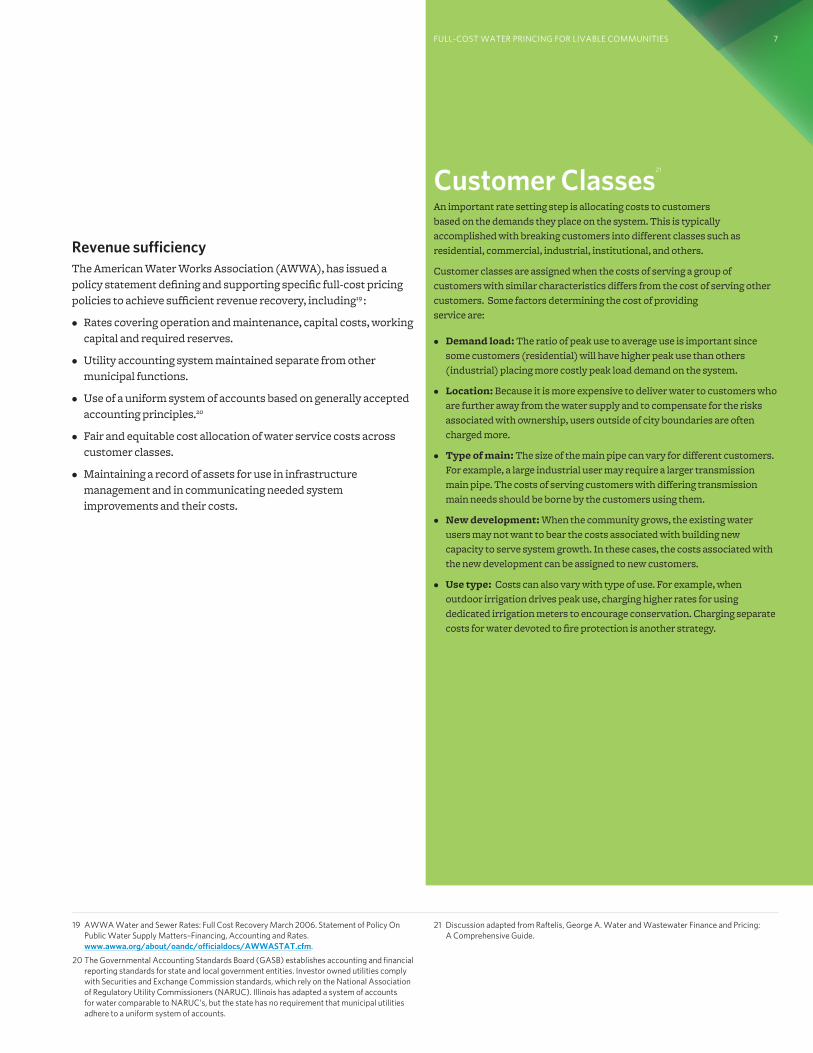
Customer Classes21
An important rate setting step is allocating costs to customers based on the demands they place on the system. This is typically accomplished with breaking customers into different classes such as residential, commercial, industrial, institutional, and others.
Customer classes are assigned when the costs of serving a group of customers with similar characteristics differs from the cost of serving other customers. Some factors determining the cost of providing service are:
• Demand load: The ratio of peak use to average use is important since some customers (residential) will have higher peak use than others (industrial) placing more costly peak load demand on the system.
• Location: Because it is more expensive to deliver water to customers who are further away from the water supply and to compensate for the risks associated with ownership, users outside of city boundaries are often charged more.
• Type of main: The size of the main pipe can vary for different customers. For example, a large industrial user may require a larger transmission main pipe. The costs of serving customers with differing transmission main needs should be borne by the customers using them.
• New development: When the community grows, the existing water users may not want to bear the costs associated with building new capacity to serve system growth. In these cases, the costs associated with the new development can be assigned to new customers.
• Use type: Costs can also vary with type of use. For example, when outdoor irrigation drives peak use, charging higher rates for using dedicated irrigation meters to encourage conservation. Charging separate costs for water devoted to fire protection is another strategy.
Revenue sufficiency The American Water Works Association (AWWA), has issued a policy statement defining and supporting specific full-cost pricing policies to achieve sufficient revenue recovery, including19 :
• Rates covering operation and maintenance, capital costs, working capital and required reserves.
• Utility accounting system maintained separate from other municipal functions.
• Use of a uniform system of accounts based on generally accepted accounting principles.20
• Fair and equitable cost allocation of water service costs across customer classes.
• Maintaining a record of assets for use in infrastructure management and in communicating needed system improvements and their costs.
22 Points from Article 9.1 of the European Union Water Framework Directive. An adequate quantity of water supply means that the amount of water demanded is equal to the available amount of water supplied. In economics, the price that balances water demand and supply is said to ‘clear the market’ since there will neither be a shortage of water (too much water demanded) nor a surplus of water (too much water supplied). Water pricing can therefore be used as a tool to ensure that available water supplies continue to meet current and projected water demands.
23 Correct prices encourage water users to become more efficient in their use of water. Full-cost rates are compatible with conservation-rates, as “the idea behind conservation-oriented pricing is to change customers for the full cost of water service and, over the long-term, bring supply and demand into balance.”Chesnutt, Thomas, et. al. Designing, Evaluating and Implementing Conservation Rate Structures: A Handbook Sponsored by the California Urban Water Conservation Council July 1997.
FULL-COST WATER PRICING GUIDEBOOK FOR SUSTAINABLE COMMUNITY WATER SYSTEMS8
Adequate water suppliesTo use water pricing as a tool for ensuring adequate water supply, the following can be included22:
• Supply costs (operation and maintenance, administrative, investment).
• Resource costs representing foregone profit due to water scarcity, shortage, and/or restrictions (opportunity costs).
• Environmental costs reflecting environmental damage and aquatic ecosystem impacts resulting from water use.
Efficient water use Communities implementing water conservation plans can use full-cost pricing to increase adoption of water efficiency practices by considering the following actions when designing conservation rates23 :
• Price according to user costs imposed on the system.
• Use more frequent billing to send a stronger conservation signal.
• Design the volumetric portion of the water charge to encourage conservation.
• Use integrated water resource pricing, considering how pricing for water, wastewater and stormwater fit together and send the proper signals about resource use.
• Limit the portion of the total bill that consists of fixed base charges, since the fixed charge portion of the bill does not provide a conservation message.
• Systems near supply capacity can include the cost of developing new capacity in the price as an incentive to reduce water use.
Summary To summarize, full-cost pricing:
• Ensures sufficient revenue by charging the full cost of water including all operating expenses, debt service, and reserve funds for maintenance and improvements.
• Sends signals to customers about the value of water and encourages efficient water use.
• Ensures adequate water supply and sustainability by sending signals throughout the circular relationship between price, demand, system design, and costs.
Section 2 discusses the activities involved in implementing full-cost water rates.

SECTION TITLE GOES HERE 9

10
24 A full discussion of foundational best utility management practices can be found in U.S. EPA’s Effective Utility Management: A Primer for Water and Wastewater Utilities, June 2008. www.awwa.org/Resources/utilitymanage.cfm?ItemNumber=3762&navItemNumber=29318.
25 Communities have already made progress towards these best practices under the state capacity-development programs that required small systems to develop strategies to improve their technical, managerial, and financial capacity under section 1420(c) of the Safe Drinking Water Act (SDWA). In this framework, most full-cost pricing practices are linked to developing the financial capacity of our community water systems.
26 The annual rate review is separate from a comprehensive rate study, which is conducted at a minimum every five years.
11
Every community has differing costs of providing water supply, therefore, full cost water prices and rate structures will vary from community-to-community across our region. Community-defined objectives will influence the pricing strategy, so there is no one water price or structure that works for each and every community in our region. Coupling a comprehensive public involvement process with an effective outreach campaign can mobilize community support for rates that sustain the communities’ desired level of service for water supply provision.
Section 2Towards Full-Cost Water Pricing
Full-cost rates cannot be accomplished in isolation from the larger utility planning and management process. Detailed guidance on utility management is available in several publications, such as the U.S. EPA’s Effective Utility Management: A Primer for Water and Wastewater Utilities Water (2008) and Wastewater Finance and Pricing: A Comprehensive Guide (Raftelis, 2005). Some communities will already have complementary foundational best practices in place, such as universal metering, full-cost accounting, capital planning, and asset management.24 Others will need to address these best practices concurrently with implementing full-cost pricing practices.25
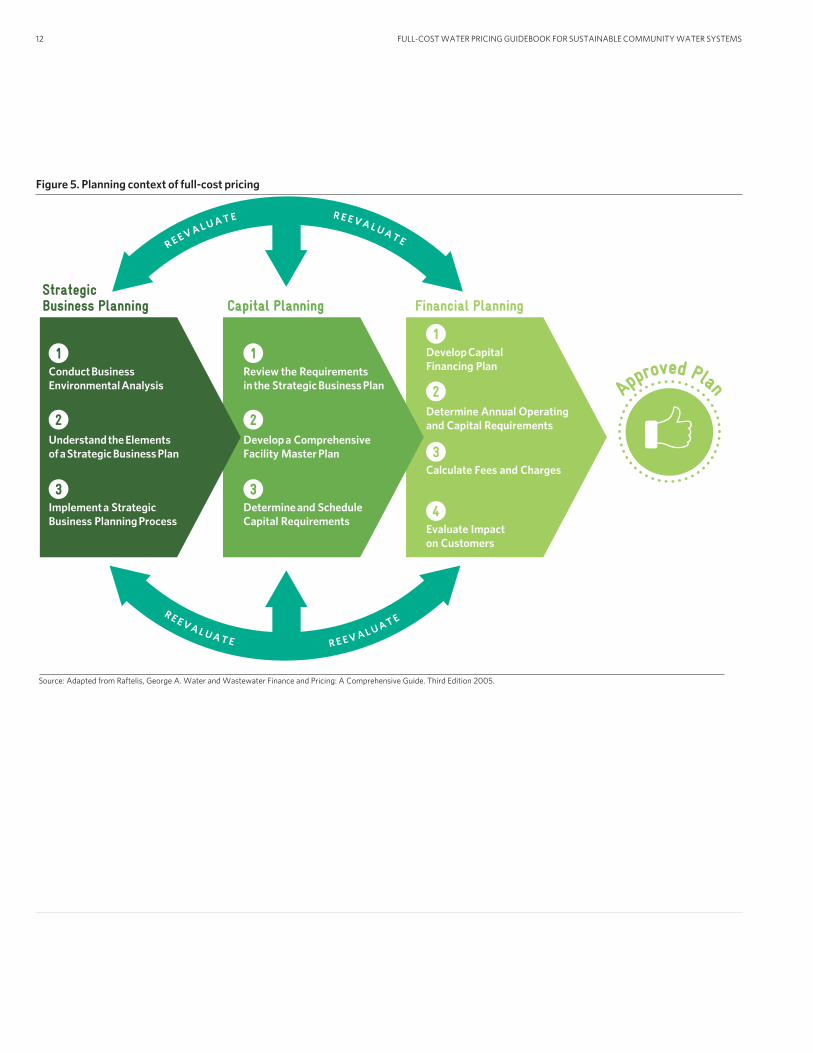
The three foundations of utility management—strategic business planning, capital planning, and financial planning—collectively ensure that rates charged are in keeping with both the strategic goals and infrastructure needs of the system. Strategic business planning includes an analysis of the utility’s operating environment, followed by a statement mission, goals, objectives, and strategies. Capital planning involves developing a comprehensive facility master plan and identifying and scheduling infrastructure needs. Business and capital plans are finalized after analyzing their impact on rates, through the financial planning process. Throughout the planning process, communication between local decision-makers, consultants, and system operators/managers is critical.
Full-cost rates are an integrated part of this long-term planning process, since changing part of the business, capital, or financial plan can have ramifications for rates. Since public infrastructure assets have a use life ranging from five to 100 years or more, their management requires long-term planning. At the same time, since water rates have a short shelf life, they need to be reviewed every year as part of the annual operating budget process and adjusted accordingly.26 For this reason, implementing full-cost pricing starts with a short-term planning tool—the annual budgeting process. Annual rate evaluation is then coupled with longer-term planning and rate studies to achieve full-cost pricing. Communities can take the following steps to move toward full-cost pricing:
• Getting the house in order
• Sustainable infrastructure planning
• Rate setting
• Consider the value of water
• Build community support
• Evaluate and revisit
(Figure 5.)
FULL-COST WATER PRICING GUIDEBOOK FOR SUSTAINABLE COMMUNITY WATER SYSTEMS12
Conduct Business Environmental Analysis
Understand the Elements of a Strategic Business Plan
Implement a Strategic Business Planning Process
Strategic Business Planning Capital Planning Financial Planning
Approved Plan
Planning context of full-cost pricing
Source: Adapted from Raftelis, George A. Water and Wastewater Finance and Pricing: A Comprehensive Guide. Third Edition 2005.
1
2
3
Review the Requirements in the Strategic Business Plan
Develop a Comprehensive Facility Master Plan
Determine and Schedule Capital Requirements
1
2
3
Develop Capital Financing Plan
Determine Annual Operating and Capital Requirements
Calculate Fees and Charges
1
2
3
Evaluate Impact on Customers
4
R E E V A L U A T E R E E V A L U A T E
R E E V A L U A T E R E E V A L U A T E
Figure 5. Planning context of full-cost pricing
27 Kemp-Rye, Mark. Running Your System Like a Good Business On Tap Summer 2004.
TOWARDS FULL-COST WATER PRICING 13
Getting the House in OrderThe annual budgeting process requires developing an operating budget detailing expenses and sources of revenue. Communities may have differing documents, records, and plans available from which to draw financial information that will affect the budgeting process. Communities may also need to address accounting practices, for example, if the water account is currently combined with another account such as the wastewater or general fund, the accounts should be separated and any transfers across accounts made clear.
Once the annual budget is complete, expenses are compared with revenues to evaluate the ability of current rates to cover day-to-day costs of doing business. Ideally, operating revenues will be sufficient to cover expenses. If revenues exceed expenses, it is recommended that surplus funds be placed into a reserve account.
If there are annual operating losses, communities will need to address the gap between operating expenses and revenues. In the short term, covering expenses can mean transferring money from somewhere else, such as an operating reserve account created expressly for this purpose. Communities without sufficient cash flow and rates will find it difficult both to leverage resources available through grants and loans, as well as to move towards full-cost pricing.
The Importance of Reserve AccountsReserve accounts hold dedicated funds that are collected over time from the system’s operation. Planning for reserves necessary to fund the maintenance and upgrades required is an important part of moving the system towards full-cost pricing.
Types of reserve funds include:
• Emergency operating reserves: The emergency reserve is for unexpected expenses such as major line breaks and other repairs. The recommended fund amount will vary for each utility, but is typically 10-15 percent of the operating budget.
• Debt service reserves: Lenders usually require a debt-service reserve, as do bond-covenants, so that the system can continue making debt payments should other funds be unavailable.
• Planned equipment repair/replacement reserve: This is for planned repair, rehabilitation, or replacement for short-lived assets.
• Capital improvements reserve: A reserve for funds dedicated to the payment of large, future capital projects needed to upgrade the system or construct new facilities. Often only a part of the cost is included in the reserve, with the remainder financed.
Ten Ways to Save Money27
1. Collect overdue accounts.
2. Reduce system leaks (Water Loss Auditing).
3. Make sure meters are working.
4. Update fees, deposits, charges.
5. Get bills out on time.
6. Find water ‘thieves.’
7. Buy in bulk.
8. Add new customers.
9. Invest.
10. Run pumps at off-peak hours.
Longer term, communities with operating losses can:
• Compare current rates to ordinance language and determine the actual date of the last rate increase.
• Identify areas where revenues can be modified to fit current needs and trends.
• Assess current costs, and review expenses looking for potential cost savings.
• Improve information available for the annual budget review (rate study, capital improvements plan, and asset management plan).
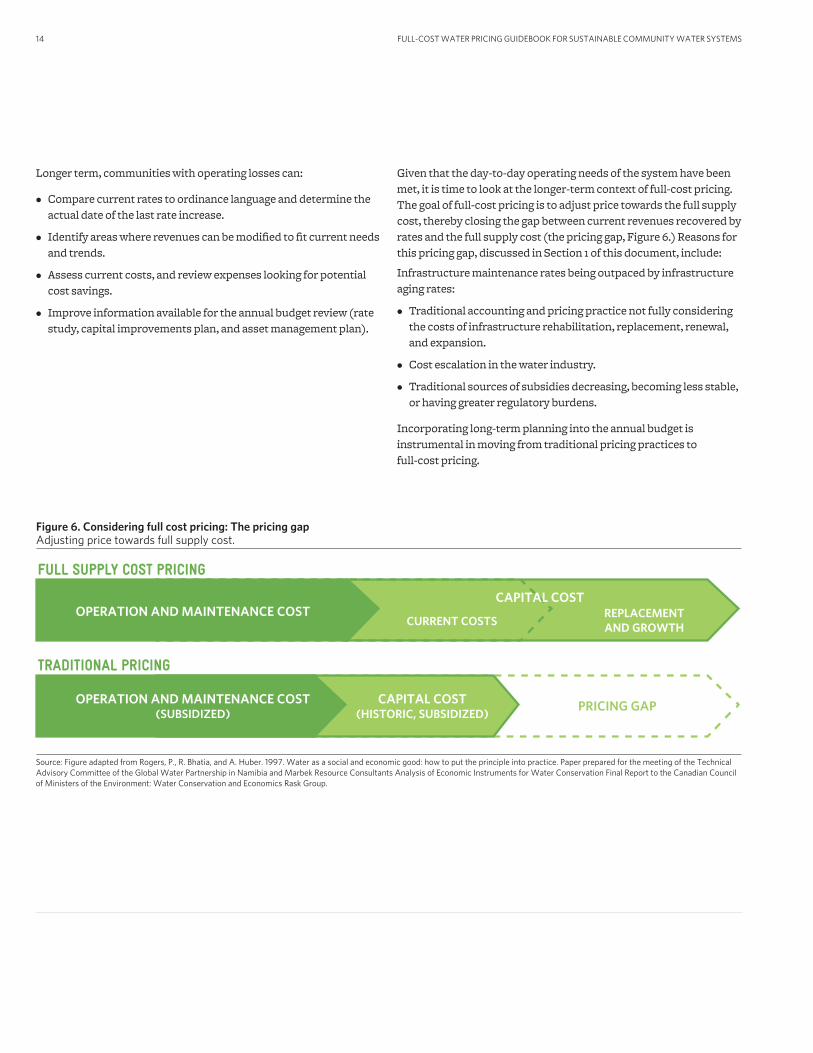
Given that the day-to-day operating needs of the system have been met, it is time to look at the longer-term context of full-cost pricing. The goal of full-cost pricing is to adjust price towards the full supply cost, thereby closing the gap between current revenues recovered by rates and the full supply cost (the pricing gap, Figure 6.) Reasons for this pricing gap, discussed in Section 1 of this document, include:
Infrastructure maintenance rates being outpaced by infrastructure aging rates:
• Traditional accounting and pricing practice not fully considering the costs of infrastructure rehabilitation, replacement, renewal, and expansion.
• Cost escalation in the water industry.
• Traditional sources of subsidies decreasing, becoming less stable, or having greater regulatory burdens.
Incorporating long-term planning into the annual budget is instrumental in moving from traditional pricing practices to full-cost pricing.
FULL-COST WATER PRICING GUIDEBOOK FOR SUSTAINABLE COMMUNITY WATER SYSTEMS14
Figure 6. Considering full cost pricing: The pricing gap Adjusting price towards full supply cost.
CAPITAL COST
CURRENT COSTSREPLACEMENTAND GROWTH
OPERATION AND MAINTENANCE COST
Source: Figure adapted from Rogers, P., R. Bhatia, and A. Huber. 1997. Water as a social and economic good: how to put the principle into practice. Paper prepared for the meeting of the Technical Advisory Committee of the Global Water Partnership in Namibia and Marbek Resource Consultants Analysis of Economic Instruments for Water Conservation Final Report to the Canadian Council of Ministers of the Environment: Water Conservation and Economics Rask Group.
FULL SUPPLY COST PRICING
CAPITAL COST(HISTORIC, SUBSIDIZED)
PRICING GAPOPERATION AND MAINTENANCE COST(SUBSIDIZED)
TRADITIONAL PRICING
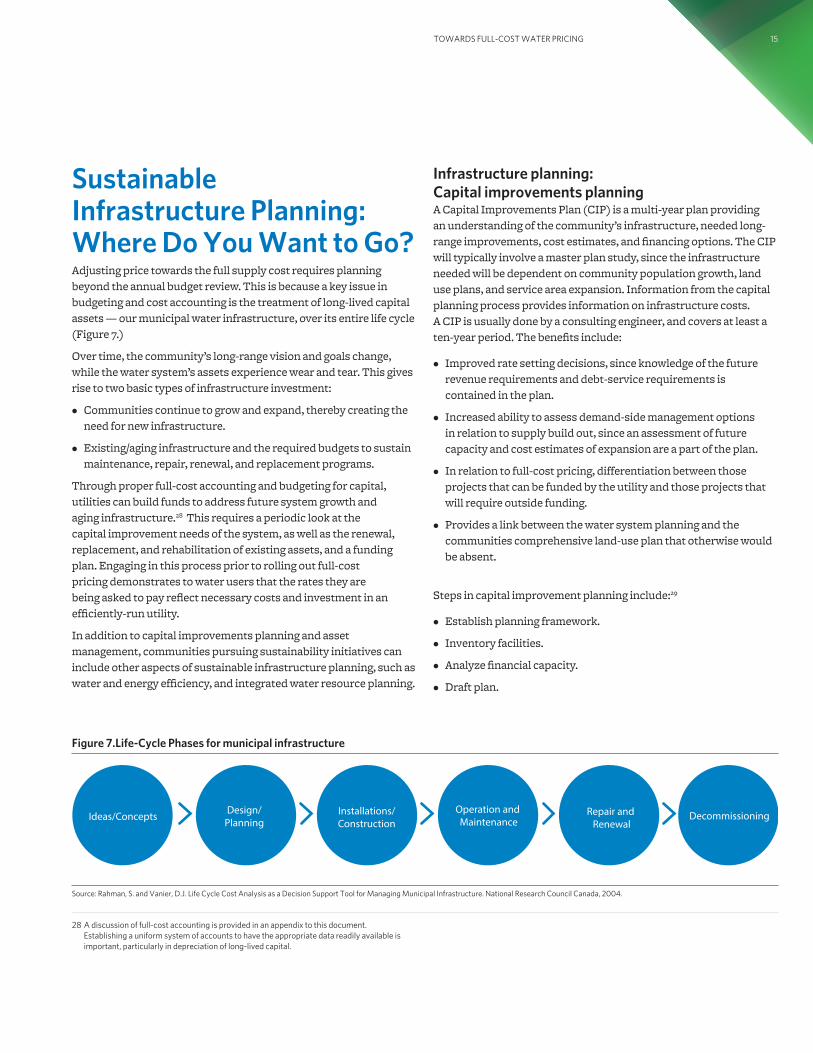
Sustainable Infrastructure Planning: Where Do You Want to Go? Adjusting price towards the full supply cost requires planning beyond the annual budget review. This is because a key issue in budgeting and cost accounting is the treatment of long-lived capital assets — our municipal water infrastructure, over its entire life cycle (Figure 7.)
Over time, the community’s long-range vision and goals change, while the water system’s assets experience wear and tear. This gives rise to two basic types of infrastructure investment:
• Communities continue to grow and expand, thereby creating the need for new infrastructure.
• Existing/aging infrastructure and the required budgets to sustain maintenance, repair, renewal, and replacement programs.
Through proper full-cost accounting and budgeting for capital, utilities can build funds to address future system growth and aging infrastructure.28 This requires a periodic look at the capital improvement needs of the system, as well as the renewal, replacement, and rehabilitation of existing assets, and a funding plan. Engaging in this process prior to rolling out full-cost pricing demonstrates to water users that the rates they are being asked to pay reflect necessary costs and investment in an efficiently-run utility.
In addition to capital improvements planning and asset management, communities pursuing sustainability initiatives can include other aspects of sustainable infrastructure planning, such as water and energy efficiency, and integrated water resource planning.
Figure 7.Life-Cycle Phases for municipal infrastructure
Infrastructure planning: Capital improvements planning A Capital Improvements Plan (CIP) is a multi-year plan providing an understanding of the community’s infrastructure, needed long-range improvements, cost estimates, and financing options. The CIP will typically involve a master plan study, since the infrastructure needed will be dependent on community population growth, land use plans, and service area expansion. Information from the capital planning process provides information on infrastructure costs. A CIP is usually done by a consulting engineer, and covers at least a ten-year period. The benefits include:
• Improved rate setting decisions, since knowledge of the future revenue requirements and debt-service requirements is contained in the plan.
• Increased ability to assess demand-side management options in relation to supply build out, since an assessment of future capacity and cost estimates of expansion are a part of the plan.
• In relation to full-cost pricing, differentiation between those projects that can be funded by the utility and those projects that will require outside funding.
• Provides a link between the water system planning and the communities comprehensive land-use plan that otherwise would be absent.
Steps in capital improvement planning include:29
• Establish planning framework.
• Inventory facilities.
• Analyze financial capacity.
• Draft plan.
TOWARDS FULL-COST WATER PRICING 15
Repair and Renewal
Installations/Construction
Operation and Maintenance
Design/PlanningIdeas/Concepts Decommissioning
28 A discussion of full-cost accounting is provided in an appendix to this document. Establishing a uniform system of accounts to have the appropriate data readily available is important, particularly in depreciation of long-lived capital.
Source: Rahman, S. and Vanier, D.J. Life Cycle Cost Analysis as a Decision Support Tool for Managing Municipal Infrastructure. National Research Council Canada, 2004.
29 Holloway, Jean. Road Map to the Future: Capital Improvements Planning for Small Water Systems On Tap 2007.
30 Kansas Department of Health and Environment & New Mexico Environmental Finance Center A.M. Kan Work! An Asset Management and Energy Efficiency Manual: Helping Water and Wastewater Utilities Achieve Sustainability.
31 InfraGuide, “Managing Infrastructure Assets.” DMIP Best Practice, National Research Council of Canada, 2004, Ottawa, Canada.
32 The U.S. EPA has free software available for use for smaller utilities as well as a guide, and a fact sheet for local officials (epa.gov/cupss).
FULL-COST WATER PRICING GUIDEBOOK FOR SUSTAINABLE COMMUNITY WATER SYSTEMS16
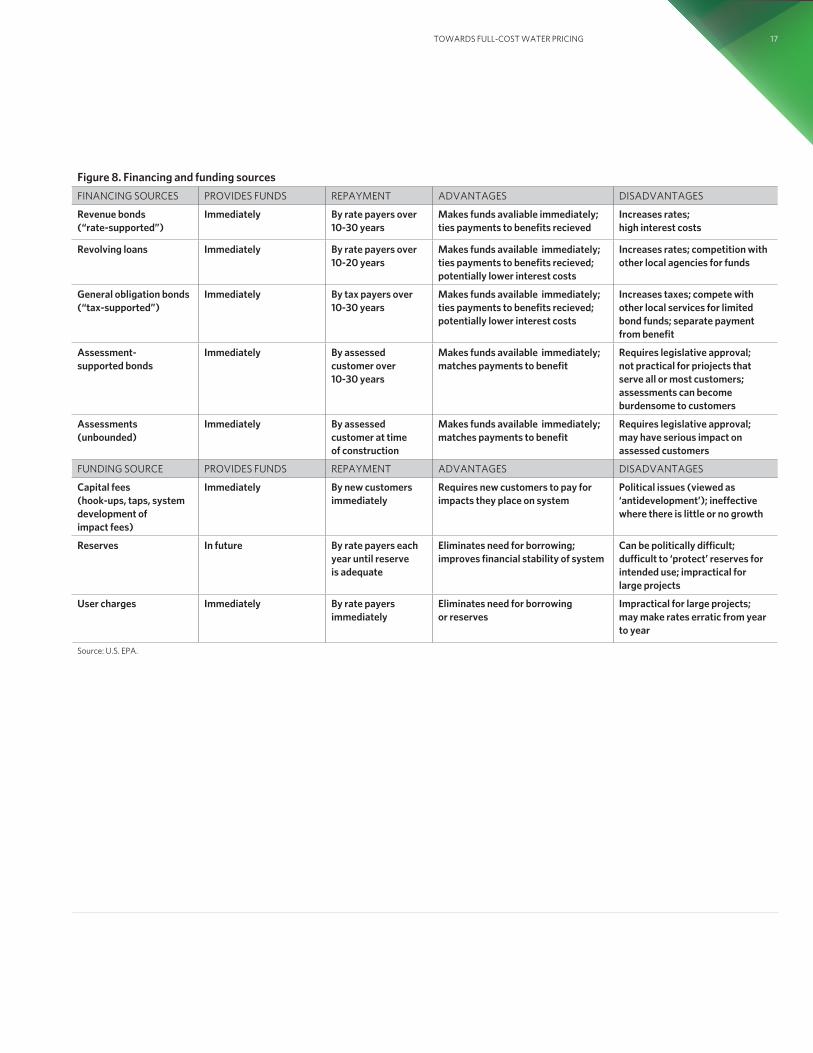
Financing and Funding SourcesThe recommended American Water Works Association (AWWA) best practice for funding is that utilities be self-sufficient through rate revenue. Communities are generally concerned about whether full-cost rates will be affordable to residents and protect established reserves. While rates and local utility self-sufficiency are the goals, each community has its own financial situation. For example, larger systems serve a greater population and are able to spread rate increases across a larger population base, while smaller systems have much smaller service populations across which to spread rate increases. Communities undertaking large investments will need to assess their financial capacity and requirements for long-term debt financing (Figure 8).
Going the distance: The asset management plan An asset management plan is a complementary tool for effective capital planning. There are extensive resources available on asset management, such as A.M. Kan Work! An Asset Management and Energy Efficiency Manual: Helping Water and Wastewater Utilities Achieve Sustainability.30 The goal of an asset management plan is to establish a process for maintaining a desired level of water service at the lowest appropriate cost.31 Creating an asset management plan requires staff members or technical assistance providers with asset management training, asset management software,32 and engineering, financial and regulatory information about the system. Medium to large utilities generally choose from a variety of commercially available asset management software and/or hire a consulting engineer to complete the plan.
Typical steps in an asset management program include:
1. Assess current state of assets.
2. Define level of service.
3. Analyze critical assets.
4. Determine costs.
5. Develop long-term funding plan.
Based on changing community conditions, the asset management plan requires periodic updates. The best way to approach asset management is by learning and experience, and adjusting the sophistication level on a system-by-system basis. Beyond planning for the infrastructure needs of the system, utilities can consider complementary sustainable infrastructure planning strategies.
TOWARDS FULL-COST WATER PRICING 17
Figure 8. Financing and funding sources
FINANCING SOURCES PROVIDES FUNDS REPAYMENT ADVANTAGES DISADVANTAGES
Revenue bonds (“rate-supported”)
Immediately By rate payers over 10-30 years
Makes funds avaliable immediately; ties payments to benefits recieved
Increases rates; high interest costs
Revolving loans Immediately By rate payers over 10-20 years
Makes funds available immediately; ties payments to benefits recieved; potentially lower interest costs
Increases rates; competition with other local agencies for funds
General obligation bonds (“tax-supported”)
Immediately By tax payers over 10-30 years
Makes funds available immediately; ties payments to benefits recieved; potentially lower interest costs
Increases taxes; compete with other local services for limited bond funds; separate payment from benefit
Assessment- supported bonds
Immediately By assessed customer over 10-30 years
Makes funds available immediately; matches payments to benefit
Requires legislative approval; not practical for priojects that serve all or most customers; assessments can become burdensome to customers
Assessments (unbounded)
Immediately By assessed customer at time of construction
Makes funds available immediately; matches payments to benefit
Requires legislative approval; may have serious impact on assessed customers
FUNDING SOURCE PROVIDES FUNDS REPAYMENT ADVANTAGES DISADVANTAGES
Capital fees (hook-ups, taps, system development of impact fees)
Immediately By new customers immediately
Requires new customers to pay for impacts they place on system
Political issues (viewed as ‘antidevelopment’); ineffective where there is little or no growth
Reserves In future By rate payers each year until reserve is adequate
Eliminates need for borrowing; improves financial stability of system
Can be politically difficult; dufficult to ‘protect’ reserves for intended use; impractical for large projects
User charges Immediately By rate payers immediately
Eliminates need for borrowing or reserves
Impractical for large projects; may make rates erratic from year to year
Source: U.S. EPA.
33 U.S. EPA. Planning for Sustainability: A Handbook for Water and Wastewater Utilities, February 2012.
34 McElhinnery, Cary. Presentation to the EPA/State Eastern Regional Operator Certification Program Workshop Sustainability Ideas for Operators June 27, 2012.
FULL-COST WATER PRICING GUIDEBOOK FOR SUSTAINABLE COMMUNITY WATER SYSTEMS18
U.S. EPA Case Study: Addressing Infrastructure without Raising Rates 33
Before making the decision to raise rates, utilities can take steps to examine potential cost efficiencies and evaluate alternative sources of funding to optimize their financial strategies. The Camden County Municipal Utilities Authority (CCMUA), which operates an 80 million gallon per day wastewater treatment plant, is one utility that successfully improved their infrastructure and avoided raising prices. The CCMUA was able to use an environmental management system (EMS) and associated asset management program to upgrade their infrastructure and lower their environmental impact without raising rates for the 500,000-odd residents of Camden, New Jersey.
The CCMUA sewage treatment plant was completed in 1987, so several of its important mechanisms were due to be replaced in the five-year period from 2007-2012. As these mechanisms got older, CCMUA noticed their maintenance costs were steadily increasing. Their overtime costs increased as well, due to the higher frequency of unplanned repairs. During this time period, newer technology was available that could reduce energy and operating costs, so the CCMUA decided to incorporate these into its infrastructure upgrade.
Overall, CCMUA’s EMS and asset management program took advantage of the opportunity to replace underperforming, high-maintenance capital with new, efficient capital, and they reaped significant benefits. The implementation of their EMS and asset management plan, as well as their use of the New Jersey State Revolving Fund’s low-interest financing, allowed the CCMUA to:
• Replace or upgrade all of their main treatment plant process units.
• Reduce annual operation and maintenance costs.
• Improve environmental performance without raising user rates.
Other aspects of sustainable infrastructure planningCommunities are increasingly becoming more interested in planning for sustainability.34 Potential sustainably planning goals for water services include:
• Reduce energy costs.
• Extend the adequacy of current water supplies.
• Address weather impacts.
• Reduce overall infrastructure costs.
TOWARDS FULL-COST WATER PRICING 19
Water and energy efficiency Improving water treatment and distribution infrastructure to minimize water loss can have benefits. When utilities are more efficient in using and providing water, this increases the longevity of existing water supplies. This can help utilities delay capacity expansion and the associated capital costs, because the utilities are making the most of the water sources they have already developed. Utilities looking to increase their water efficiency should start by accounting for their water, which allows them to see how much water is lost to inefficient processes and where those processes are in the system. Then, they can begin to reduce water loss by repairing leaks and addressing other inefficiencies through new treatment and distribution methods and technologies. This will allow utilities to deliver the same amount of water to customers while using less water in their treatment and distribution operations.
That energy use makes up a large portion of a water utility’s expenses is not immediately apparent, but energy can account for up to 40 percent of total operational costs. This percentage is expected to increase by 20 percent in the next 15 years, making energy use even more significant. Since energy use makes up such a substantial portion of operational costs, improving energy efficiency can significantly reduce these costs. Utilities can start their journey towards energy efficiency by establishing their baseline energy use and conducting an energy audit to determine what processes are using the most energy, how much energy those processes should need, how much energy is actually being used, and when the energy use occurs. Once this information is available, utilities can use it to pinpoint inefficiencies and address them. A utility could stagger the timing of certain processes so that they do not all occur during peak energy-use hours. Incorporating more energy-efficient technology into repairs and replacements is another approach. Utilities may also look into using renewable energy sources for part or all of their energy needs. Several states, including Illinois, have special grants, loans, and rebates that serve as incentives for companies to improve their energy efficiency; use of these resources can reduce the cost of upgrading to more energy-efficient technologies, which thereby increases the net benefit gained by improving energy efficiency.
Integrated water managementIntegrated water management is another important aspect of improving water efficiency. Communities can take advantage of alternative sources of water, such as rainwater or greywater, to augment their water supplies. Implementing programs that make these sources part of the water supply process can further delay capacity expansion, and the infrastructure investment required to set up further treatment for wastewater or to install a rainwater harvesting system may be less than what developing a new source of ground or surface water would entail. Stormwater and reclaimed wastewater can be supplied to consumers or used operationally by the utility; these sources are suitable for potable or non-potable uses, depending on the level of treatment. In either case, they help meet the water demand that is predicted to rise in the coming decades. In fact, there are several benefits to using either stormwater or wastewater; for instance, both sources take pressure off aquifers that are being depleted and can even be used to recharge these aquifers. In addition, both are relatively renewable sources of water.
Economic water leakage levelThere are various methods municipal water suppliers can use to detect leaks. Leak detection, however, costs money, and finding the economic leakage level involves balancing the costs of detecting leaks with the benefits of reducing water losses. Data on the value of the water lost, the real losses recovered with leak detection, and the cost of leak detection is necessary to make this determination.
35 Raftelis, George A. Water and Wastewater Finance and Pricing: A Comprehensive Guide Third Edition. 2005.
FULL-COST WATER PRICING GUIDEBOOK FOR SUSTAINABLE COMMUNITY WATER SYSTEMS20
Rate SettingRate setting is the process through which a water system ensures revenue adequacy. Water suppliers face several decisions about the rates to charge for water. Rate setting involves conducting a rate study, or hiring a consultant to perform a study on the community’s behalf. There are many resources available for those seeking more detailed and technical information on rate setting, including the AWWA’s Principles of Water Rates, Fees, and Charges M1 Manual.
Information needed for a rate study includes:
• Expenditures
• Operation & maintenance
• Capital investment
• Customer records (by meter size/ type of customer)
• Total number of service connections/bills
• Metered consumption
• Billing information in dollars
• Peak period demand data
• Socio-demographic distribution of customer base
• Fund balances
• Estimated costs of future maintenance projects and proposed capital budgets
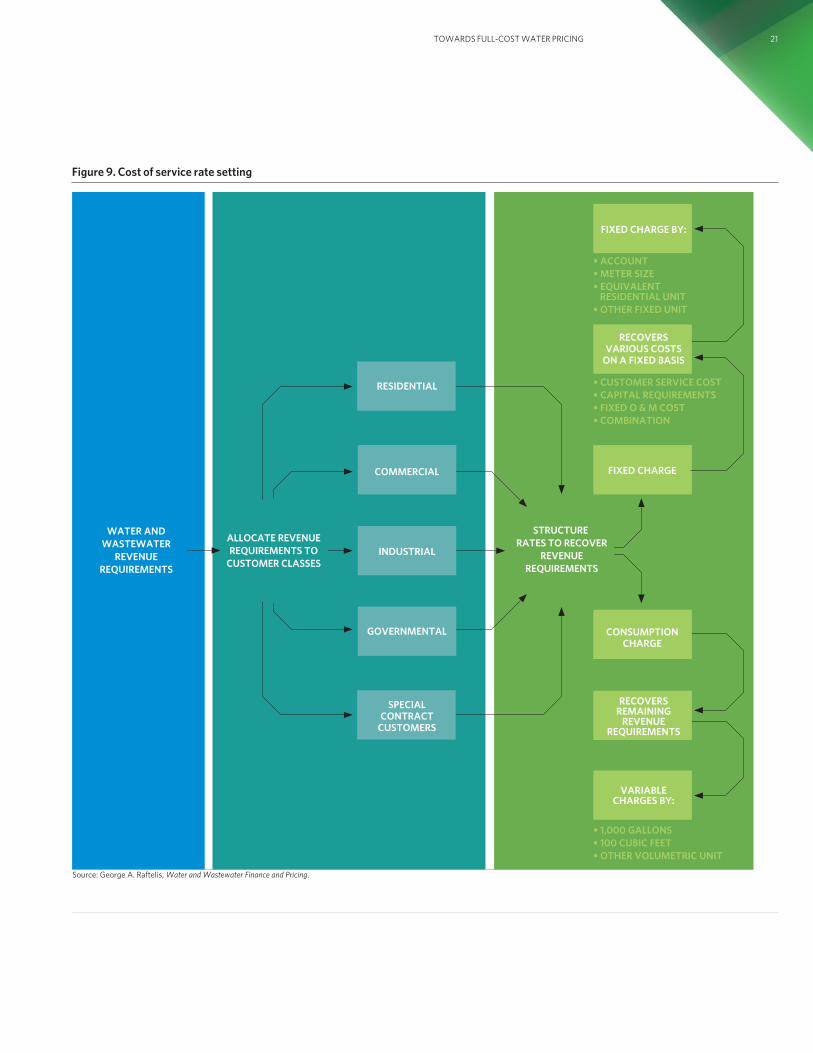
Cost-of-service rate setting involves the following three steps briefly described below and shown in Figure 9.35
TOWARDS FULL-COST WATER PRICING 21
• OPERATING COSTS•CAPITAL REQUIREMENTS
WATER ANDWASTEWATER
REVENUEREQUIREMENTS
ALLOCATE REVENUEREQUIREMENTS TO
CUSTOMER CLASSES
STRUCTURE RATES TO RECOVER
REVENUEREQUIREMENTS
RESIDENTIAL
FIXED CHARGE BY:
INDUSTRIAL
FIXED CHARGE
CONSUMPTIONCHARGE
RECOVERSVARIOUS COSTS
ON A FIXED BASIS
RECOVERSREMAINING
REVENUEREQUIREMENTS
VARIABLECHARGES BY:
• CUSTOMER SERVICE COST• CAPITAL REQUIREMENTS• FIXED O & M COST• COMBINATION
• 1,000 GALLONS• 100 CUBIC FEET• OTHER VOLUMETRIC UNIT
• ACCOUNT• METER SIZE• EQUIVALENT RESIDENTIAL UNIT• OTHER FIXED UNIT
COMMERCIAL
GOVERNMENTAL
STEP 1:IDENTIFY REVENUE REQUIREMENTS
STEP 2:DETERMINE COST OF SERVICE
STEP 3:DESIGN RATE STRUCTURE
Fig 10. Cost of service rate setting
Source: George A. Raftelis, Water and Wastewater Finance and Pricing.
SPECIALCONTRACT
CUSTOMERS
Figure 9. Cost of service rate setting
FULL-COST WATER PRICING GUIDEBOOK FOR SUSTAINABLE COMMUNITY WATER SYSTEMS22
Step 1: Identify revenue requirements Revenue requirements consist of operation and maintenance (O&M) and capital costs. O&M costs include day-to-day expenses (such as salaries and benefits, electricity for pumping, chemicals for treatment, customer account expenses, etc.). Capital costs include assets mainly used to deliver water with an expected life of one year or greater. Two primary methods of determining revenue requirements are:
• Utility approach: Followed by investor-owned (i.e., regulated) utilities, this approach provides an allowance for rate of return on investment. Capital costs include depreciation, interest on debt service, and return on rate base.
• Cash-needs approach: This approach is followed by governmental utilities. Capital costs generally include principal and interest on debt service, capital outlay, and contributions to reserve funds.
Because the majority of water systems in northeastern Illinois are government owned, most communities will use the cash-needs approach to calculate revenue requirements.
Step 2: Determine cost of serviceOnce the revenue requirements have been identified, they are allocated based on the cost of serving different types of water use. For example, costs can vary based on time of use (peak use versus non-peak use) or type of customer (residential, commercial, industrial, fire protection, etc.). The cost of service study allocates costs as follows:
• Cost functionalization separates costs according to the different functions performed by the utility, such as treatment, transmission, and distribution.
• Cost classification assigns the functional costs to service characteristics. Two main methods of cost allocation are:
• Base-extra capacity approach: Allocate costs to base (costs associated with meeting average day demands) and extra capacity (costs associated with meeting demands in excess of average day use).
• Commodity demand method: Allocate costs based on total annual use, including demand related costs (based on percent of total demand) and commodity costs (based on meter and billing requirements).
• Cost allocation assigns costs to customer classes in proportion to water demands.
TOWARDS FULL-COST WATER PRICING 23
36 Kemp-Rye, Mark. Proper Rates: Are Critical for Financial Health On Tap, Summer 2004.
37 AWWA Principles of Water Rates, Fees, and charges: M1 Manual of Water Supply Practices.
38 The following discussion is based on AWWA Principles of Water Rates, Fees, and charges: M1 Manual of Water Supply Practices.
39 The following discussion draws heavily on Boland, 1993.
40 Strictly speaking, changes in new revenue (excess revenue and insufficient revenue). While net revenue stability can be addressed by setting rates equal to the operation and maintenance costs of water, this results in insufficient revenue for the capital costs.
41 In Illinois, there is no requirement that public utility rates be approved at the state level (by the Illinois Commerce Commission). Because rates in Illinois are set at the local level, regulations regarding water rates will largely consist of local ordinances.
Step 3: Design rate structure In designing the rate structure, the utility can separate expenses into fixed costs and variable costs. As a simple example:36
• Fixed charge: Recovers the fixed cost components that remain the same regardless of the amount of water produced—examples are staff salaries and debt service. The amount of the fixed charge does not vary with the amount of water consumed. The fixed charge can be calculated as:
• Volumetric charge: Recovers the usage based cost components and varies with the amount of water used. Additional decisions must be made regarding the type of volumetric charge (uniform, block rate, seasonal rate), as explained in Section 3 of this document.
• Block rates: Block rates involve dividing water use into differing levels, or ‘blocks,’ and assigning a different volume charge to each block. For a simple block rate calculation37:
Beyond rate calculations, rate structure design involves balancing a variety of objectives. Publicly owned utilities in Illinois have a great degree of flexibility in choosing rate structures, and there are a multitude of rate structures from which to choose, as discussed in detail in Section 3 of this document. Communities can undertake a rate structure study plan that:
• Defines goals and objectives.
• Evaluates available alternatives.
• Communicates outcomes.38
Define goals and objectivesCommunities will set goals and objectives that are suited to the local conditions. In defining objectives for the rate structure, it is important for the community to understand why there is a need to adjust existing rates. This may involve understanding and communicating the history and operations of the utility, the customers’ past behavioral responses to rate adjustments, and the water resource situation of the community. The community can select rate objectives once the community context is clearly understood. Having a statement of objectives and a ranking of which take priority will be instrumental in selecting the most community-appropriate rate structure. Some objectives to take into consideration include:39
• Revenue sufficiency: Rates generate revenue sufficient to cover the financial costs of supplying water. It is possible to address revenue needs without changing the rate structure design by raising the level of the rate.
• Revenue stability: Changes in revenue resulting from unplanned demand fluctuations are minimized (due to unforeseen weather, economic conditions, etc.).40
• Equity: Consumers pay rates that are proportional to costs they impose on the water supply system (“same cost = same price”). Equity also implies that rate structures with arbitrary price differences will not be used.
• Fairness: Rates are perceived by consumers and the utility alike as being fair.
• Simple and easily understood: Rates are understood by customers so that they clearly know what the price of water is and are able to respond to that price appropriately.
• Legality: Rates meet any legal requirements.41
• Water efficiency/conservation: Rates provide users incentive to adopt water efficient products and practices.
• Economic efficiency: Rates promote water use levels that minimize costs of providing water supply, provide the greatest possible benefit to the community, and provide proper signals regarding use.
It is not possible to meet all the above objectives with any one-rate structure. Rate design, therefore, involves communities weighting and ranking these multiple objectives and evaluating feasible rate structures against one another.
Annual fixed costsNumber of hook-ups Annual fixed charge
Annual fixed costs12
=
=
Monthly fixed charge
Annual variable costsUnits of water sold
= Variable charge (charge per 1,000 gallons)
Annual variable costsblock 1 sales +
[block 2 sales X (1 + price differential)]
== Variable charge (charge per 1,000 gallons)
Block 2 rates Block 1 rate X (1 + price differential)
Block 1
=
FULL-COST WATER PRICING GUIDEBOOK FOR SUSTAINABLE COMMUNITY WATER SYSTEMS24
Data from Inside the Utility
Data from Outside the Utility
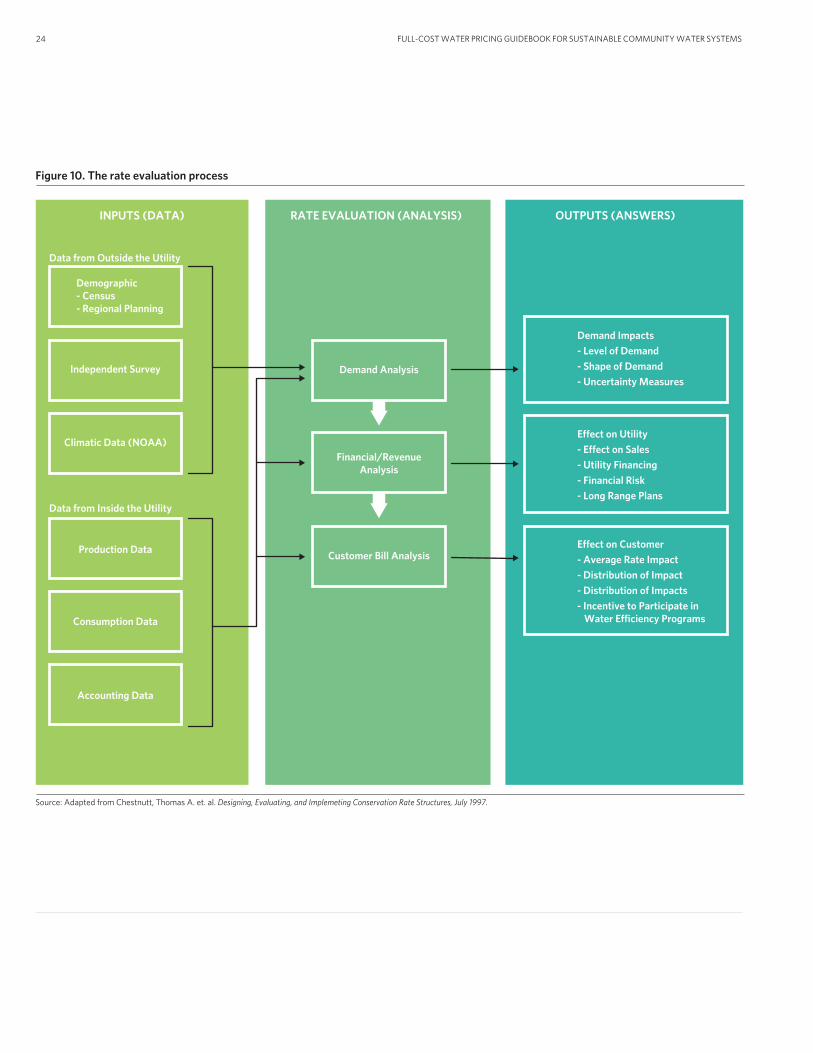
Figure 10. The rate evaluation process
INPUTS (DATA)
Demographic- Census- Regional Planning
Independent Survey
Climatic Data (NOAA)
Production Data
Consumption Data
Accounting Data
RATE EVALUATION (ANALYSIS)
Demand Analysis
Financial/RevenueAnalysis
Customer Bill Analysis
OUTPUTS (ANSWERS)
Demand Impacts
- Level of Demand
- Shape of Demand
- Uncertainty Measures
Effect on Utility
- Effect on Sales
- Utility Financing
- Financial Risk
- Long Range Plans
Effect on Customer
- Average Rate Impact
- Distribution of Impact
- Distribution of Impacts
- Incentive to Participate in Water Efficiency Programs
Source: Adapted from Chestnutt, Thomas A. et. al. Designing, Evaluating, and Implemeting Conservation Rate Structures, July 1997.
TOWARDS FULL-COST WATER PRICING 25
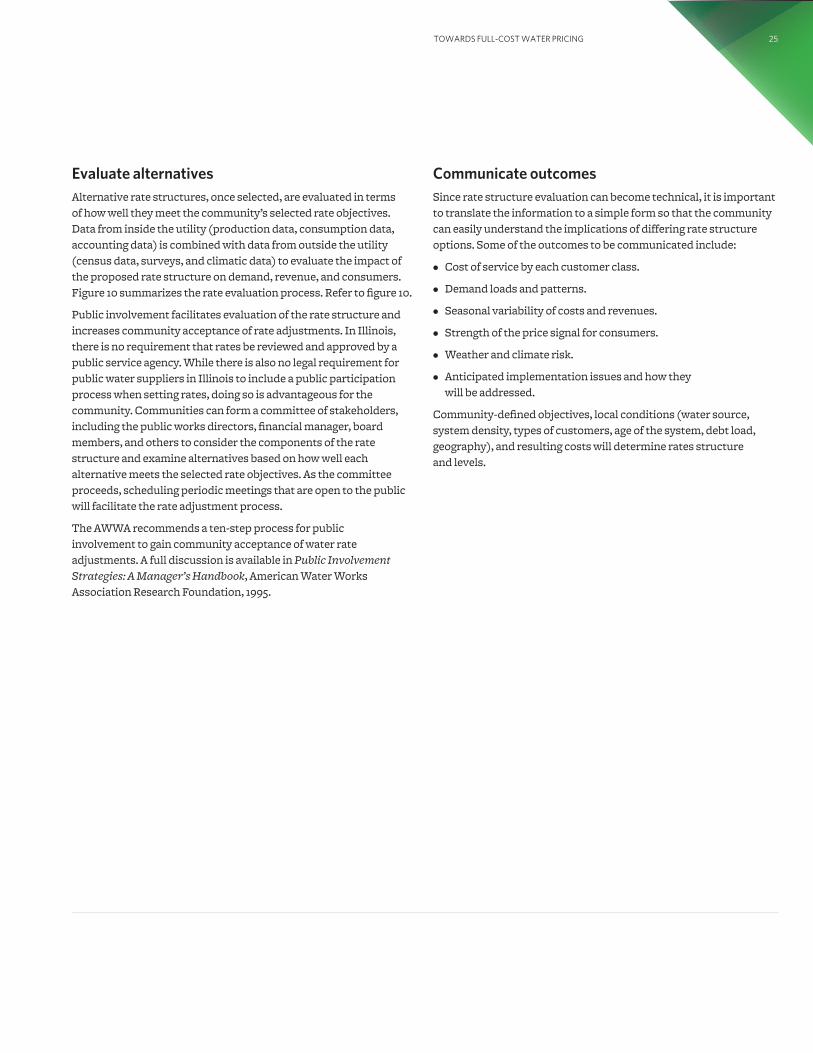
Evaluate alternativesAlternative rate structures, once selected, are evaluated in terms of how well they meet the community’s selected rate objectives. Data from inside the utility (production data, consumption data, accounting data) is combined with data from outside the utility (census data, surveys, and climatic data) to evaluate the impact of the proposed rate structure on demand, revenue, and consumers. Figure 10 summarizes the rate evaluation process. Refer to figure 10.
Public involvement facilitates evaluation of the rate structure and increases community acceptance of rate adjustments. In Illinois, there is no requirement that rates be reviewed and approved by a public service agency. While there is also no legal requirement for public water suppliers in Illinois to include a public participation process when setting rates, doing so is advantageous for the community. Communities can form a committee of stakeholders, including the public works directors, financial manager, board members, and others to consider the components of the rate structure and examine alternatives based on how well each alternative meets the selected rate objectives. As the committee proceeds, scheduling periodic meetings that are open to the public will facilitate the rate adjustment process.
The AWWA recommends a ten-step process for public involvement to gain community acceptance of water rate adjustments. A full discussion is available in Public Involvement Strategies: A Manager’s Handbook, American Water Works Association Research Foundation, 1995.
Communicate outcomesSince rate structure evaluation can become technical, it is important to translate the information to a simple form so that the community can easily understand the implications of differing rate structure options. Some of the outcomes to be communicated include:
• Cost of service by each customer class.
• Demand loads and patterns.
• Seasonal variability of costs and revenues.
• Strength of the price signal for consumers.
• Weather and climate risk.
• Anticipated implementation issues and how they will be addressed.
Community-defined objectives, local conditions (water source, system density, types of customers, age of the system, debt load, geography), and resulting costs will determine rates structure and levels.
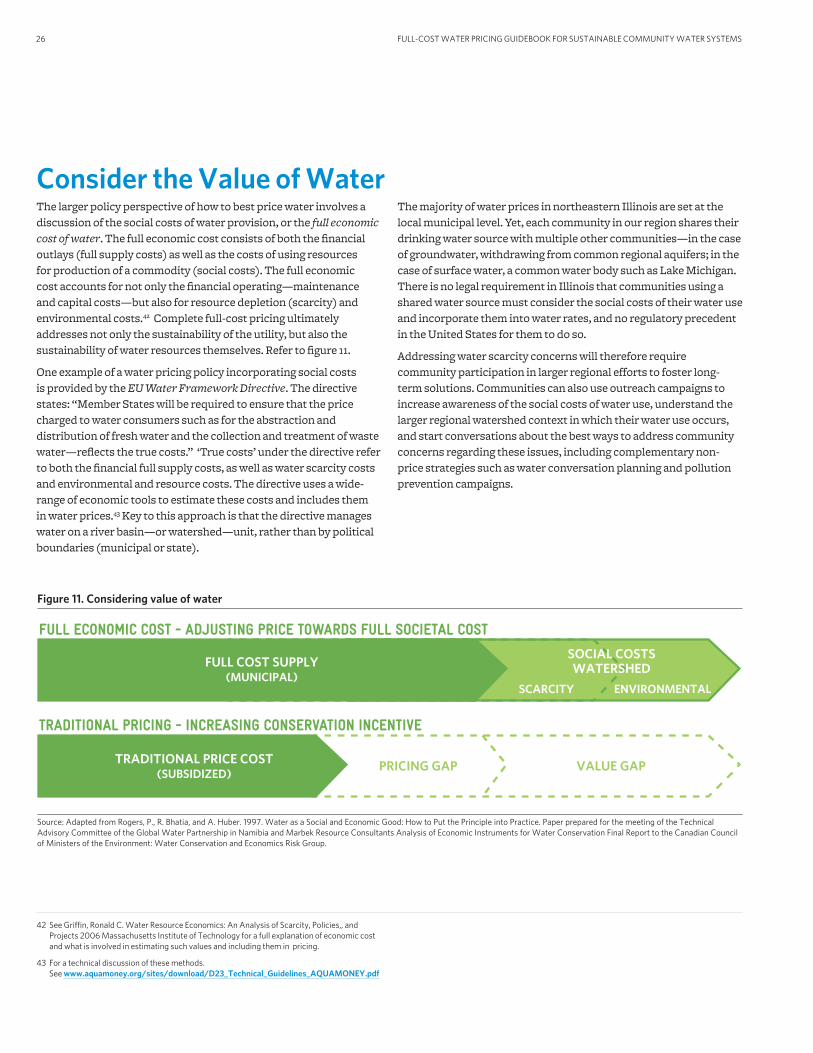
Consider the Value of WaterThe larger policy perspective of how to best price water involves a discussion of the social costs of water provision, or the full economic cost of water. The full economic cost consists of both the financial outlays (full supply costs) as well as the costs of using resources for production of a commodity (social costs). The full economic cost accounts for not only the financial operating—maintenance and capital costs—but also for resource depletion (scarcity) and environmental costs.42 Complete full-cost pricing ultimately addresses not only the sustainability of the utility, but also the sustainability of water resources themselves. Refer to figure 11.
One example of a water pricing policy incorporating social costs is provided by the EU Water Framework Directive. The directive states: “Member States will be required to ensure that the price charged to water consumers such as for the abstraction and distribution of fresh water and the collection and treatment of waste water—reflects the true costs.” ‘True costs’ under the directive refer to both the financial full supply costs, as well as water scarcity costs and environmental and resource costs. The directive uses a wide-range of economic tools to estimate these costs and includes them in water prices.43 Key to this approach is that the directive manages water on a river basin—or watershed—unit, rather than by political boundaries (municipal or state).
The majority of water prices in northeastern Illinois are set at the local municipal level. Yet, each community in our region shares their drinking water source with multiple other communities—in the case of groundwater, withdrawing from common regional aquifers; in the case of surface water, a common water body such as Lake Michigan. There is no legal requirement in Illinois that communities using a shared water source must consider the social costs of their water use and incorporate them into water rates, and no regulatory precedent in the United States for them to do so.
Addressing water scarcity concerns will therefore require community participation in larger regional efforts to foster long-term solutions. Communities can also use outreach campaigns to increase awareness of the social costs of water use, understand the larger regional watershed context in which their water use occurs, and start conversations about the best ways to address community concerns regarding these issues, including complementary non-price strategies such as water conversation planning and pollution prevention campaigns.
FULL-COST WATER PRICING GUIDEBOOK FOR SUSTAINABLE COMMUNITY WATER SYSTEMS26
42 See Griffin, Ronald C. Water Resource Economics: An Analysis of Scarcity, Policies,, and Projects 2006 Massachusetts Institute of Technology for a full explanation of economic cost and what is involved in estimating such values and including them in pricing.
43 For a technical discussion of these methods. See www.aquamoney.org/sites/download/D23_Technical_Guidelines_AQUAMONEY.pdf
Figure 11. Considering value of water
SOCIAL COSTSWATERSHED
SCARCITY ENVIRONMENTAL
FULL COST SUPPLY(MUNICIPAL)
Source: Adapted from Rogers, P., R. Bhatia, and A. Huber. 1997. Water as a Social and Economic Good: How to Put the Principle into Practice. Paper prepared for the meeting of the Technical Advisory Committee of the Global Water Partnership in Namibia and Marbek Resource Consultants Analysis of Economic Instruments for Water Conservation Final Report to the Canadian Council of Ministers of the Environment: Water Conservation and Economics Risk Group.
FULL ECONOMIC COST - ADJUSTING PRICE TOWARDS FULL SOCIETAL COST
VALUE GAPPRICING GAPTRADITIONAL PRICE COST(SUBSIDIZED)
TRADITIONAL PRICING - INCREASING CONSERVATION INCENTIVE
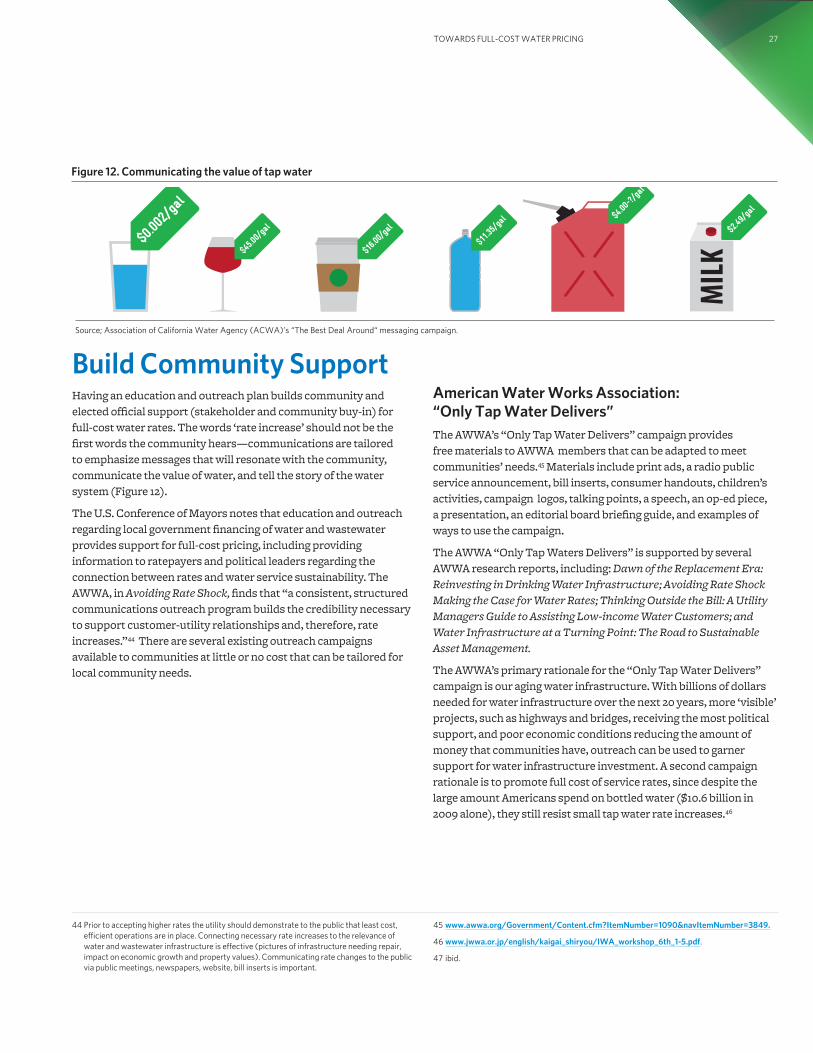
Build Community SupportHaving an education and outreach plan builds community and elected official support (stakeholder and community buy-in) for full-cost water rates. The words ‘rate increase’ should not be the first words the community hears—communications are tailored to emphasize messages that will resonate with the community, communicate the value of water, and tell the story of the water system (Figure 12).
The U.S. Conference of Mayors notes that education and outreach regarding local government financing of water and wastewater provides support for full-cost pricing, including providing information to ratepayers and political leaders regarding the connection between rates and water service sustainability. The AWWA, in Avoiding Rate Shock, finds that “a consistent, structured communications outreach program builds the credibility necessary to support customer-utility relationships and, therefore, rate increases.”44 There are several existing outreach campaigns available to communities at little or no cost that can be tailored for local community needs.
American Water Works Association: “Only Tap Water Delivers”The AWWA’s “Only Tap Water Delivers” campaign provides free materials to AWWA members that can be adapted to meet communities’ needs.45 Materials include print ads, a radio public service announcement, bill inserts, consumer handouts, children’s activities, campaign logos, talking points, a speech, an op-ed piece, a presentation, an editorial board briefing guide, and examples of ways to use the campaign.
The AWWA “Only Tap Waters Delivers” is supported by several AWWA research reports, including: Dawn of the Replacement Era: Reinvesting in Drinking Water Infrastructure; Avoiding Rate Shock Making the Case for Water Rates; Thinking Outside the Bill: A Utility Managers Guide to Assisting Low-income Water Customers; and Water Infrastructure at a Turning Point: The Road to Sustainable Asset Management.
The AWWA’s primary rationale for the “Only Tap Water Delivers” campaign is our aging water infrastructure. With billions of dollars needed for water infrastructure over the next 20 years, more ‘visible’ projects, such as highways and bridges, receiving the most political support, and poor economic conditions reducing the amount of money that communities have, outreach can be used to garner support for water infrastructure investment. A second campaign rationale is to promote full cost of service rates, since despite the large amount Americans spend on bottled water ($10.6 billion in 2009 alone), they still resist small tap water rate increases.46
Figure 12. Communicating the value of tap water
$16.0
0/ga
l
$45.0
0/ga
l
$11.3
5/ga
l $4.00
-?/g
al
$2.49
/gal
$0.00
2/ga
l
MILK
Source; Association of California Water Agency (ACWA)’s “The Best Deal Around“ messaging campaign.
TOWARDS FULL-COST WATER PRICING 27
44 Prior to accepting higher rates the utility should demonstrate to the public that least cost, efficient operations are in place. Connecting necessary rate increases to the relevance of water and wastewater infrastructure is effective (pictures of infrastructure needing repair, impact on economic growth and property values). Communicating rate changes to the public via public meetings, newspapers, website, bill inserts is important.
45 www.awwa.org/Government/Content.cfm?ItemNumber=1090&navItemNumber=3849.
46 www.jwwa.or.jp/english/kaigai_shiryou/IWA_workshop_6th_1-5.pdf.
47 ibid.
FULL-COST WATER PRICING GUIDEBOOK FOR SUSTAINABLE COMMUNITY WATER SYSTEMS28
47 ibid.
Specific objectives of the AWWA “Only Tap Water Delivers” campaign are to:
• Encourage community investment in water services and resources.
• Provide utilities with tools that help them communicate with consumers and decision-makers about the value of water service.
• Encourage and equip public officials to speak about the importance of investing in water service and resources.
• Elevate the value of water service in the minds of consumers.
The primary message is “Only Tap Water Delivers … public health protection, fire protection, support for the economy, quality of life.” Secondary campaign messages include:
• “We are all stewards of the water infrastructure and resources generations before handed down to us.”
• “Our water bills pay for both the a) stewardship of our water resources and b) the processes to get safe and reliable water to you.”
• “In the future, we will pay rates that more accurately reflect the true cost of water service.”47
• More information on the AWWA “Only Tap Water Delivers” campaign and additional resources can be found at www.awwa.org/Government/.
Water Environment Federation (WEF) The Water Environment Federation (WEF) is non-profit association serving water service professionals. The WEF has many resources, among which are two outreach campaigns that communities can use to bolster support for full-cost pricing.
Water is Life and Infrastructure Makes it HappenTM program The goal of the Water Is Life, and Infrastructure Makes It HappenTM program is to help communities plan, build, and upkeep their water and wastewater systems, as well as to educate the public and elected officials on the value of water, the role of water and wastewater infrastructure , and the need to invest in water infrastructure. The outreach program provides materials, resources to build partnerships, and information on tailoring the program to local conditions. The program focuses on getting the targeted audience to:
• Learn about water conservation and pollution prevention.
• Read and understand water/wastewater bills.
• Learn about community water and wastewater infrastructure.
• Start community discussions on water and wastewater infrastructure.
• Support investment in water and wastewater infrastructure.
More information about the program can be found at www.wef.org/.
TOWARDS FULL-COST WATER PRICING 29
48 http://www.wef.org/.
Water’s Worth It™ campaign The Water Environment Federation also has a campaign called Water’s Worth ItTM48 targeting a broad range of audiences (public, elected-official, decision makers, media) to provide:
• Education on the connection between water service provision and value to the public.
• Education on the value of water.
• Education on water as a limited resource and means of dealing with water scarcity.
• Awareness and respect for the work of water sector professionals.
• Public support for needed infrastructure investments.
• Support for water resource innovation.
A Water’s Worth It ™ toolkit is available online containing logos, advertising (print ads and web banners), public outreach materials (fact sheets, bill inserts, brochure, infographic, and Powerpoint slide template), and media outreach materials (media guide, press release, opinion editorial, letter to the editor, and news article). This toolkit is located at www.waters-worth-it.org/get-started/.
Liquid Assets outreachThe Liquid Assets outreach program centers around a documentary titled Liquid Assets: The Story of Our Water Infrastructure that explores the issue of deteriorating water infrastructure in communities. The documentary provides the framework for a larger outreach program, including a community toolkit. The toolkit can be used by communities looking to undertake a water infrastructure outreach campaign, and includes many materials designed to work with the documentary, such as a discussion guide.
Outreach campaigns such as the above, when combined with sustainable infrastructure planning, and full-cost rate setting, provide a multi-pronged approach for communities implementing full-cost pricing. As new information becomes available, periodically communicating with local elected officials, residents, other water customers in a timely and easy-to-understand format can build support for full-cost pricing. Public outreach is an ongoing process that will establish a communications platform for communities to communicate the need for rate adjustments to support investment in water.
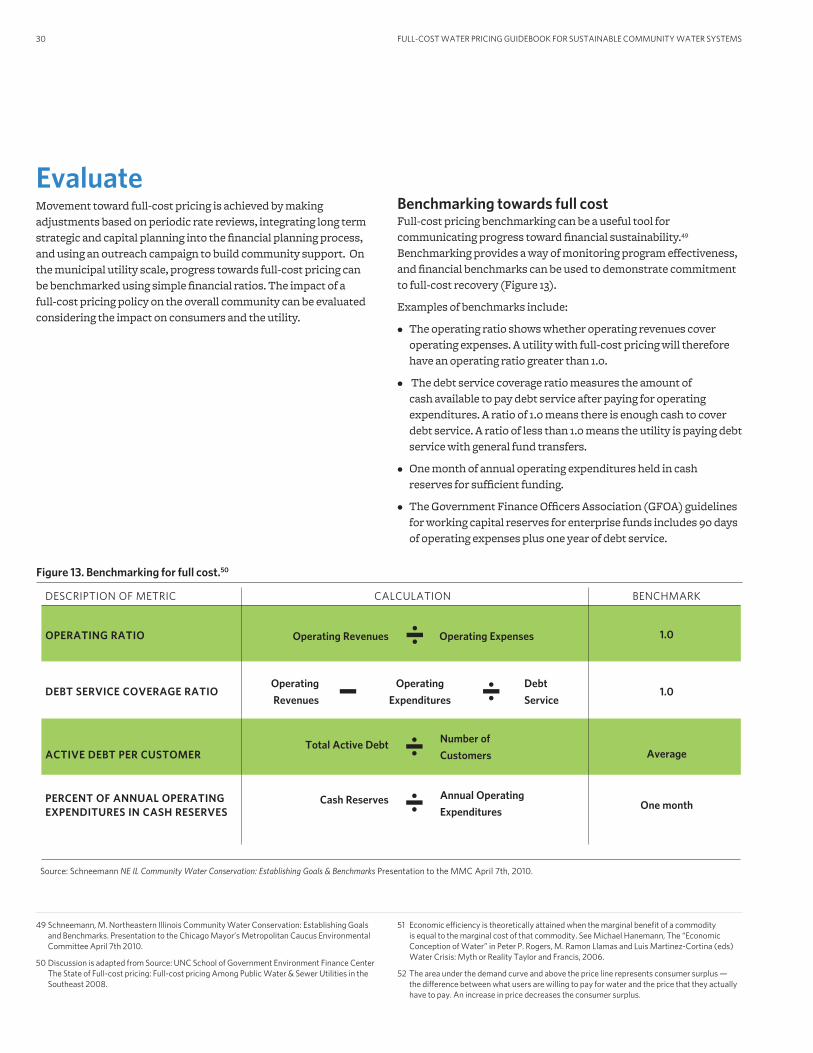
49 Schneemann, M. Northeastern Illinois Community Water Conservation: Establishing Goals and Benchmarks. Presentation to the Chicago Mayor’s Metropolitan Caucus Environmental Committee April 7th 2010.
50 Discussion is adapted from Source: UNC School of Government Environment Finance Center The State of Full-cost pricing: Full-cost pricing Among Public Water & Sewer Utilities in the Southeast 2008.
51 Economic efficiency is theoretically attained when the marginal benefit of a commodity is equal to the marginal cost of that commodity. See Michael Hanemann, The “Economic Conception of Water” in Peter P. Rogers, M. Ramon Llamas and Luis Martinez-Cortina (eds) Water Crisis: Myth or Reality Taylor and Francis, 2006.
52 The area under the demand curve and above the price line represents consumer surplus — the difference between what users are willing to pay for water and the price that they actually have to pay. An increase in price decreases the consumer surplus.
FULL-COST WATER PRICING GUIDEBOOK FOR SUSTAINABLE COMMUNITY WATER SYSTEMS30
EvaluateMovement toward full-cost pricing is achieved by making adjustments based on periodic rate reviews, integrating long term strategic and capital planning into the financial planning process, and using an outreach campaign to build community support. On the municipal utility scale, progress towards full-cost pricing can be benchmarked using simple financial ratios. The impact of a full-cost pricing policy on the overall community can be evaluated considering the impact on consumers and the utility.
Benchmarking towards full cost Full-cost pricing benchmarking can be a useful tool for communicating progress toward financial sustainability.49 Benchmarking provides a way of monitoring program effectiveness, and financial benchmarks can be used to demonstrate commitment to full-cost recovery (Figure 13).
Examples of benchmarks include:
• The operating ratio shows whether operating revenues cover operating expenses. A utility with full-cost pricing will therefore have an operating ratio greater than 1.0.
• The debt service coverage ratio measures the amount of cash available to pay debt service after paying for operating expenditures. A ratio of 1.0 means there is enough cash to cover debt service. A ratio of less than 1.0 means the utility is paying debt service with general fund transfers.
• One month of annual operating expenditures held in cash reserves for sufficient funding.
• The Government Finance Officers Association (GFOA) guidelines for working capital reserves for enterprise funds includes 90 days of operating expenses plus one year of debt service.
Source: Schneemann NE IL Community Water Conservation: Establishing Goals & Benchmarks Presentation to the MMC April 7th, 2010.
DESCRIPTION OF METRIC
OPERATING RATIO
DEBT SERVICE COVERAGE RATIO
ACTIVE DEBT PER CUSTOMER
PERCENT OF ANNUAL OPERATINGEXPENDITURES IN CASH RESERVES
CALCULATION BENCHMARK
Benchmarking metrics towards full cost recovery
Total Active Debt
Cash Reserves
1.0
1.0
Average
One month
Debt
Service
Annual Operating
Expenditures
Number of
Customers
Operating Revenues Operating Expenses
Operating
Revenues
Operating
Expenditures
Figure 13. Benchmarking for full cost.50
TOWARDS FULL-COST WATER PRICING 31
Policy Analysis of a Price AdjustmentPrice plays a critical role in finding the right balance between supply and demand. The demand for water is a downward sloping curve, meaning that as the price of water increases, the quantity of water demanded decreases. As volumetric price increases, less urgent, or discretionary water needs (outdoor lawn watering) are reduced so that essential water needs can be met (drinking, businesses). Users also adopt more efficient ways of meeting their essential water needs, such as installing more efficient plumbing fixtures. An efficient level of water use is attained where supply and demand are balanced.51
When volumetric price increases, there are three policy impacts to consider:
• Pricing effect on consumer well-being: Increasing volumetric prices results in consumers using less water and pay a higher price per unit of water consumed. The total water bill may remain unchanged, increase, or even decrease, depending on consumers response to the price change and the rate structure.52
• Pricing impact on utility revenue: When volumetric price increases, revenues per unit sold increase, resulting in a gain to producers; however, utilities also sell less water, placing downward pressure on revenue. The net impact on producers depends on both the rate structure as well as the consumer response to the price change.53
• Pricing impact on utility production costs: Because the utility is selling less water, the production costs are potentially decreased; it does not have to process and deliver as much water.
Full-cost pricing can also be implemented in conjunction with a demand management (water conservation) program. When this is the case, additional policy impacts to consider include:
• Conservation effect on consumer well-being: Decreasing use places downward pressure on water bills, after accounting for any outlays on water-conservation and loss in consumer values from reduced water use.
• Conservation impact on utility revenue: When demand decreases, revenues decrease, resulting in a loss to producers.54
• Conservation impact on utility production costs: Reduced demand potentially enables water to be supplied at a lower cost (after accounting for any conservation program costs).
Looking at these policy impacts together, the benefits of implementing full-cost pricing in conjunction with a water efficiency/conservation program are apparent—full-cost pricing provides sufficient revenue while water efficiency/conservation programs allow residents to manage their water bills.
53 There are two effects on the utility: they sell less water, but they get more revenue for the water that they do sell, as a result of the higher price on the units sold. Consumers are relatively non-responsive to price changes for water demand. Thus, when the price is increased, the increase in revenue on units sold will be greater than the loss in revenue from the lost sales, with a net increase in revenue. In theory, this is not a gain since prices (revenue) just cover costs, with no net benefit accruing to the utility.
54 In theory, this is not a loss since prices (revenue) just cover costs, with no net losses accruing to the utility.

FULL-COST PRICING GUIDEBOOK FOR LIVABLE COMMUNITIES32
55 CMAP, 2008. Survey of Water Utilities.
56 CMAP, 2008. Survey of Water Utilities.
WATER RATE STRUCTURES 33
Choosing which rate structure a utility uses to collect water charges is an important decision. Rate structures influence both water use and revenues collected by the system. For any given full-cost revenue requirement, there are a variety of rate structures that can be put in place to collect the necessary revenue.
Section 3 Water Rate Structures
Water Rate Schedules in Northeastern IllinoisThe type of rate structures used often depends on certain characteristics of the utility and its consumer base. For instance, metering can play a significant role in determining which rate structure is employed. An estimated 38 percent of utilities in the region do not have full (100 percent) metering in their consumer base55 which can limit price structure to the use of flat rates. When customer categories are differentiated, fixed or flat rates can change by category, allowing for more efficiency than a single flat rate charge. In northeastern Illinois, 55 percent of utilities have some system in place to distinguish between different customer classes or meter sizes when setting prices.56 Customers are generally classified as residential, commercial, industrial, governmental, or special contract consumers; however, specific classification systems vary by utility.
The majority of northeastern Illinois water utilities use volumetric rate structures, which reflect the actual amount of water used by the consumer. Many of these are two-part structures that include both a fixed base charge and volumetric pricing. Volumetric pricing strategies include uniform rate structures and block rate structures, and are used by nearly all utilities in the northeastern Illinois region (99 percent). Use of volumetric pricing schemes, unlike flat rate structures, requires metering for implementation. A full description of water rate schedules of water supply systems in the 11-county area of Northeast Illinois is provided in WATER 2050: Northeastern Illinois Regional Water Supply/Demand Plan. The various types of water pricing structures and associated advantages and disadvantages are discussed below and shown in Figure 14.
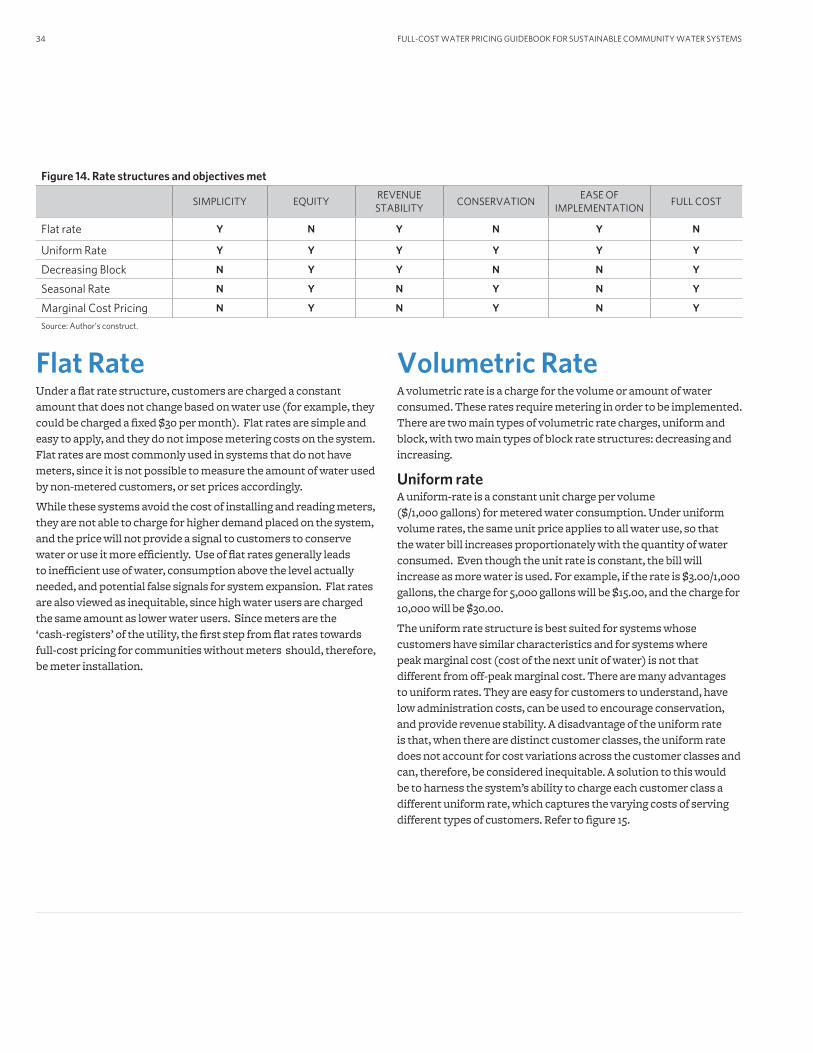
FULL-COST WATER PRICING GUIDEBOOK FOR SUSTAINABLE COMMUNITY WATER SYSTEMS34
Flat RateUnder a flat rate structure, customers are charged a constant amount that does not change based on water use (for example, they could be charged a fixed $30 per month). Flat rates are simple and easy to apply, and they do not impose metering costs on the system. Flat rates are most commonly used in systems that do not have meters, since it is not possible to measure the amount of water used by non-metered customers, or set prices accordingly.
While these systems avoid the cost of installing and reading meters, they are not able to charge for higher demand placed on the system, and the price will not provide a signal to customers to conserve water or use it more efficiently. Use of flat rates generally leads to inefficient use of water, consumption above the level actually needed, and potential false signals for system expansion. Flat rates are also viewed as inequitable, since high water users are charged the same amount as lower water users. Since meters are the ‘cash-registers’ of the utility, the first step from flat rates towards full-cost pricing for communities without meters should, therefore, be meter installation.
Volumetric RateA volumetric rate is a charge for the volume or amount of water consumed. These rates require metering in order to be implemented. There are two main types of volumetric rate charges, uniform and block, with two main types of block rate structures: decreasing and increasing.
Uniform rate A uniform-rate is a constant unit charge per volume ($/1,000 gallons) for metered water consumption. Under uniform volume rates, the same unit price applies to all water use, so that the water bill increases proportionately with the quantity of water consumed. Even though the unit rate is constant, the bill will increase as more water is used. For example, if the rate is $3.00/1,000 gallons, the charge for 5,000 gallons will be $15.00, and the charge for 10,000 will be $30.00.
The uniform rate structure is best suited for systems whose customers have similar characteristics and for systems where peak marginal cost (cost of the next unit of water) is not that different from off-peak marginal cost. There are many advantages to uniform rates. They are easy for customers to understand, have low administration costs, can be used to encourage conservation, and provide revenue stability. A disadvantage of the uniform rate is that, when there are distinct customer classes, the uniform rate does not account for cost variations across the customer classes and can, therefore, be considered inequitable. A solution to this would be to harness the system’s ability to charge each customer class a different uniform rate, which captures the varying costs of serving different types of customers. Refer to figure 15.
Figure 14. Rate structures and objectives met
SIMPLICITY EQUITYREVENUE STABILITY
CONSERVATIONEASE OF
IMPLEMENTATIONFULL COST
Flat rate Y N Y N Y N
Uniform Rate Y Y Y Y Y Y
Decreasing Block N Y Y N N Y
Seasonal Rate N Y N Y N Y
Marginal Cost Pricing N Y N Y N Y
Source: Author’s construct.
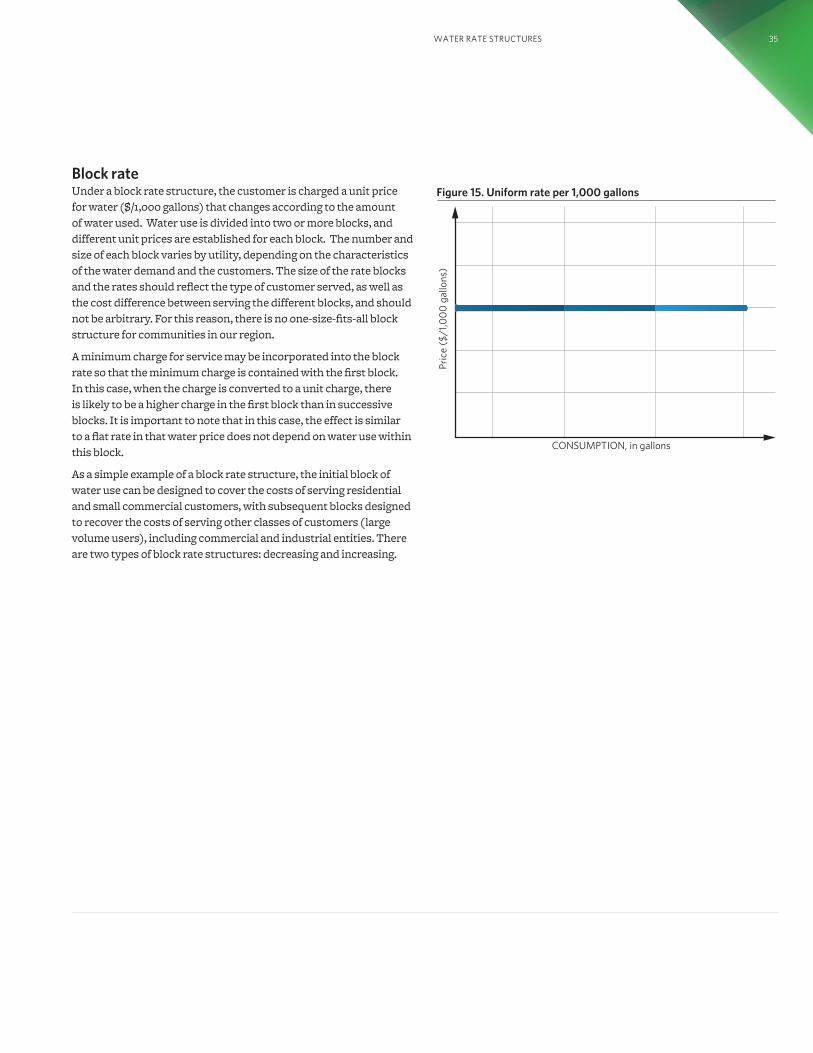
Block rateUnder a block rate structure, the customer is charged a unit price for water ($/1,000 gallons) that changes according to the amount of water used. Water use is divided into two or more blocks, and different unit prices are established for each block. The number and size of each block varies by utility, depending on the characteristics of the water demand and the customers. The size of the rate blocks and the rates should reflect the type of customer served, as well as the cost difference between serving the different blocks, and should not be arbitrary. For this reason, there is no one-size-fits-all block structure for communities in our region.
A minimum charge for service may be incorporated into the block rate so that the minimum charge is contained with the first block. In this case, when the charge is converted to a unit charge, there is likely to be a higher charge in the first block than in successive blocks. It is important to note that in this case, the effect is similar to a flat rate in that water price does not depend on water use within this block.
As a simple example of a block rate structure, the initial block of water use can be designed to cover the costs of serving residential and small commercial customers, with subsequent blocks designed to recover the costs of serving other classes of customers (large volume users), including commercial and industrial entities. There are two types of block rate structures: decreasing and increasing.
CONSUMPTION, in gallonsPr
ice
($/1
,00
0 g
allo
ns)
Figure 15. Uniform rate per 1,000 gallons
WATER RATE STRUCTURES 35
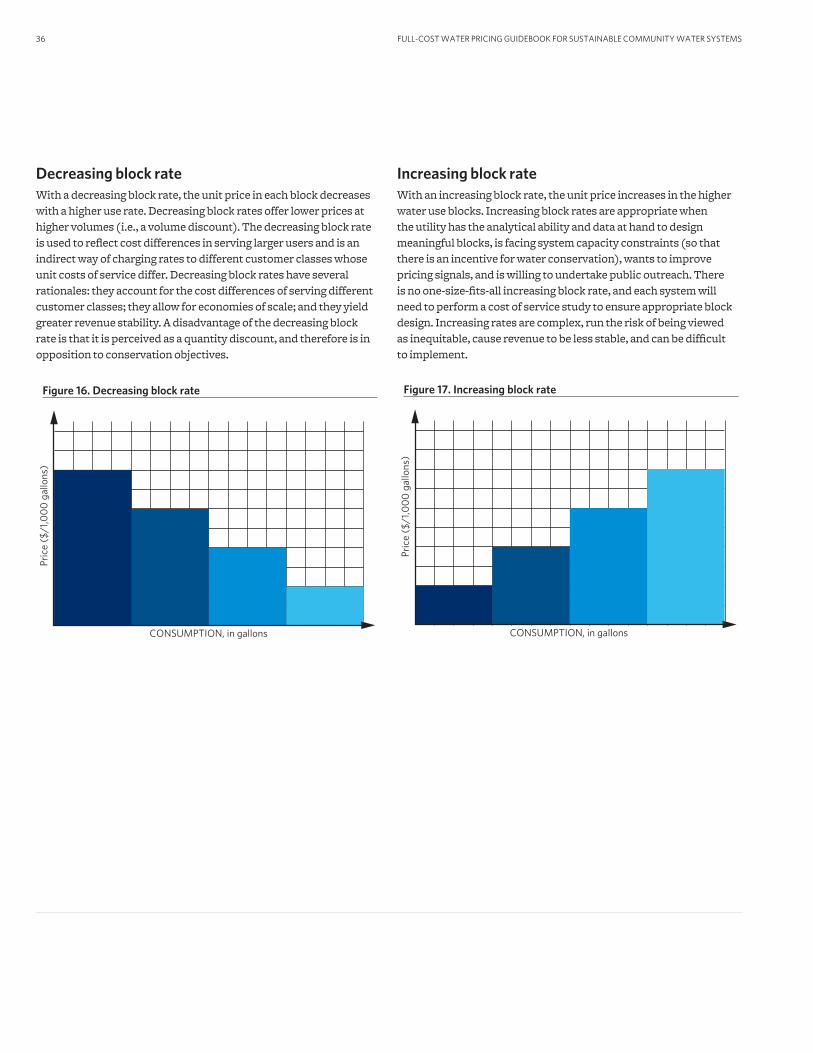
FULL-COST WATER PRICING GUIDEBOOK FOR SUSTAINABLE COMMUNITY WATER SYSTEMS36
Decreasing block rate With a decreasing block rate, the unit price in each block decreases with a higher use rate. Decreasing block rates offer lower prices at higher volumes (i.e., a volume discount). The decreasing block rate is used to reflect cost differences in serving larger users and is an indirect way of charging rates to different customer classes whose unit costs of service differ. Decreasing block rates have several rationales: they account for the cost differences of serving different customer classes; they allow for economies of scale; and they yield greater revenue stability. A disadvantage of the decreasing block rate is that it is perceived as a quantity discount, and therefore is in opposition to conservation objectives.
Increasing block rate With an increasing block rate, the unit price increases in the higher water use blocks. Increasing block rates are appropriate when the utility has the analytical ability and data at hand to design meaningful blocks, is facing system capacity constraints (so that there is an incentive for water conservation), wants to improve pricing signals, and is willing to undertake public outreach. There is no one-size-fits-all increasing block rate, and each system will need to perform a cost of service study to ensure appropriate block design. Increasing rates are complex, run the risk of being viewed as inequitable, cause revenue to be less stable, and can be difficult to implement.
Figure 16. Decreasing block rate
CONSUMPTION, in gallons
Pric
e ($
/1,0
00
gal
lons
)
Figure 17. Increasing block rate
CONSUMPTION, in gallons
Pric
e ($
/1,0
00
gal
lons
)
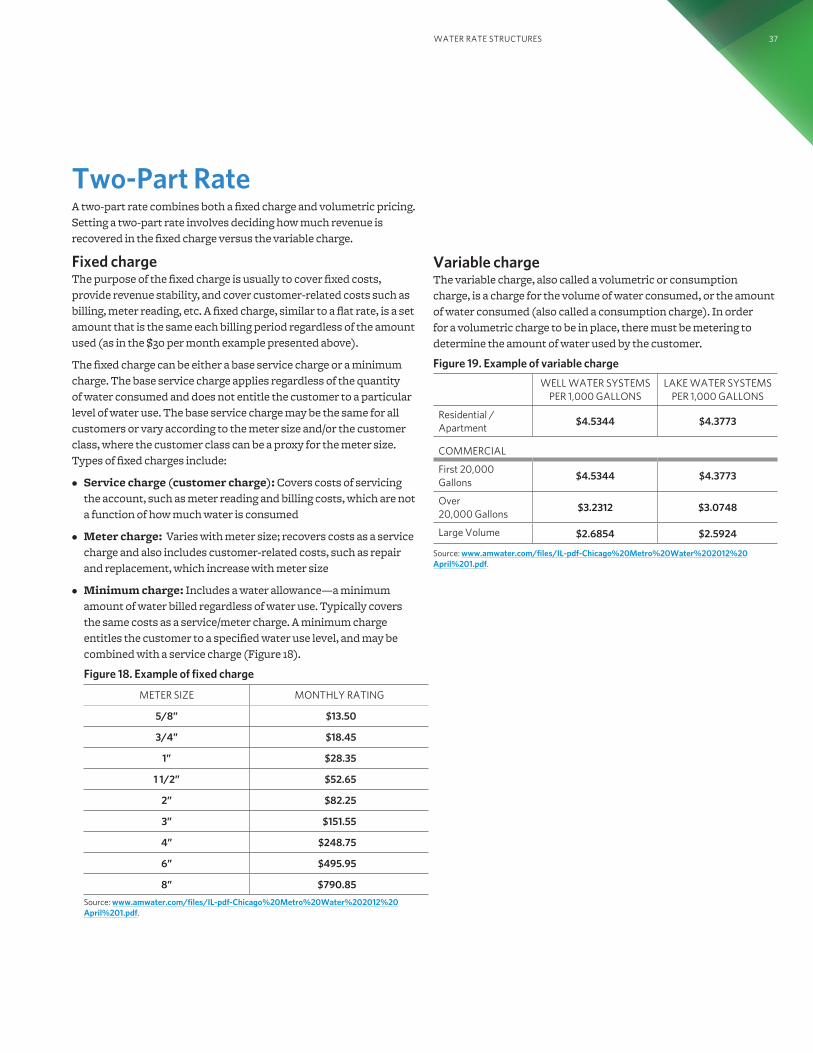
WATER RATE STRUCTURES 37
Two-Part Rate A two-part rate combines both a fixed charge and volumetric pricing. Setting a two-part rate involves deciding how much revenue is recovered in the fixed charge versus the variable charge.
Fixed charge The purpose of the fixed charge is usually to cover fixed costs, provide revenue stability, and cover customer-related costs such as billing, meter reading, etc. A fixed charge, similar to a flat rate, is a set amount that is the same each billing period regardless of the amount used (as in the $30 per month example presented above).
The fixed charge can be either a base service charge or a minimum charge. The base service charge applies regardless of the quantity of water consumed and does not entitle the customer to a particular level of water use. The base service charge may be the same for all customers or vary according to the meter size and/or the customer class, where the customer class can be a proxy for the meter size. Types of fixed charges include:
• Service charge (customer charge): Covers costs of servicing the account, such as meter reading and billing costs, which are not a function of how much water is consumed
• Meter charge: Varies with meter size; recovers costs as a service charge and also includes customer-related costs, such as repair and replacement, which increase with meter size
• Minimum charge: Includes a water allowance—a minimum amount of water billed regardless of water use. Typically covers the same costs as a service/meter charge. A minimum charge entitles the customer to a specified water use level, and may be combined with a service charge (Figure 18).
Figure 18. Example of fixed charge
METER SIZE MONTHLY RATING
5/8” $13.50
3/4” $18.45
1” $28.35
1 1/2” $52.65
2” $82.25
3” $151.55
4” $248.75
6” $495.95
8” $790.85
Source: www.amwater.com/files/IL-pdf-Chicago%20Metro%20Water%202012%20April%201.pdf.
Variable charge The variable charge, also called a volumetric or consumption charge, is a charge for the volume of water consumed, or the amount of water consumed (also called a consumption charge). In order for a volumetric charge to be in place, there must be metering to determine the amount of water used by the customer.
Figure 19. Example of variable charge
WELL WATER SYSTEMS PER 1,000 GALLONS
LAKE WATER SYSTEMS PER 1,000 GALLONS
Residential / Apartment
$4.5344 $4.3773
COMMERCIAL
First 20,000 Gallons
$4.5344 $4.3773
Over 20,000 Gallons
$3.2312 $3.0748
Large Volume $2.6854 $2.5924
Source: www.amwater.com/files/IL-pdf-Chicago%20Metro%20Water%202012%20April%201.pdf.
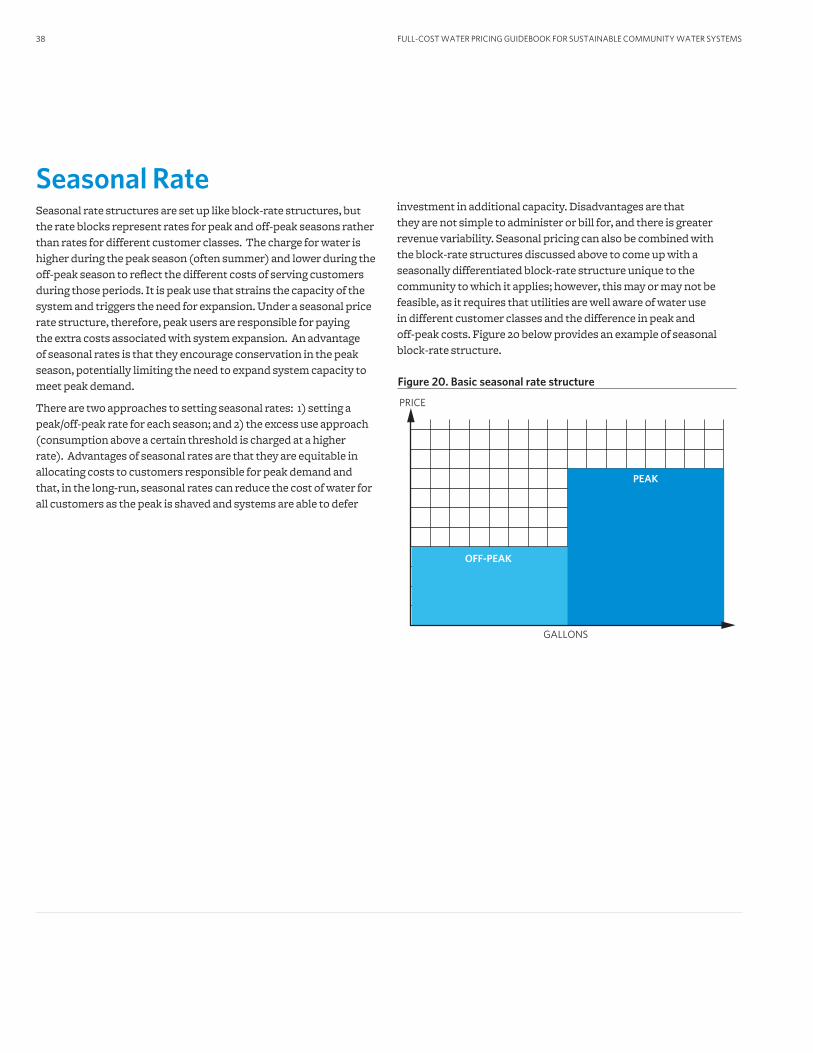
Seasonal RateSeasonal rate structures are set up like block-rate structures, but the rate blocks represent rates for peak and off-peak seasons rather than rates for different customer classes. The charge for water is higher during the peak season (often summer) and lower during the off-peak season to reflect the different costs of serving customers during those periods. It is peak use that strains the capacity of the system and triggers the need for expansion. Under a seasonal price rate structure, therefore, peak users are responsible for paying the extra costs associated with system expansion. An advantage of seasonal rates is that they encourage conservation in the peak season, potentially limiting the need to expand system capacity to meet peak demand.
There are two approaches to setting seasonal rates: 1) setting a peak/off-peak rate for each season; and 2) the excess use approach (consumption above a certain threshold is charged at a higher rate). Advantages of seasonal rates are that they are equitable in allocating costs to customers responsible for peak demand and that, in the long-run, seasonal rates can reduce the cost of water for all customers as the peak is shaved and systems are able to defer
investment in additional capacity. Disadvantages are that they are not simple to administer or bill for, and there is greater revenue variability. Seasonal pricing can also be combined with the block-rate structures discussed above to come up with a seasonally differentiated block-rate structure unique to the community to which it applies; however, this may or may not be feasible, as it requires that utilities are well aware of water use in different customer classes and the difference in peak and off-peak costs. Figure 20 below provides an example of seasonal block-rate structure.
PRICE
Figure 20. Basic seasonal rate structure
GALLONS
OFF-PEAK
PEAK
FULL-COST WATER PRICING GUIDEBOOK FOR SUSTAINABLE COMMUNITY WATER SYSTEMS38
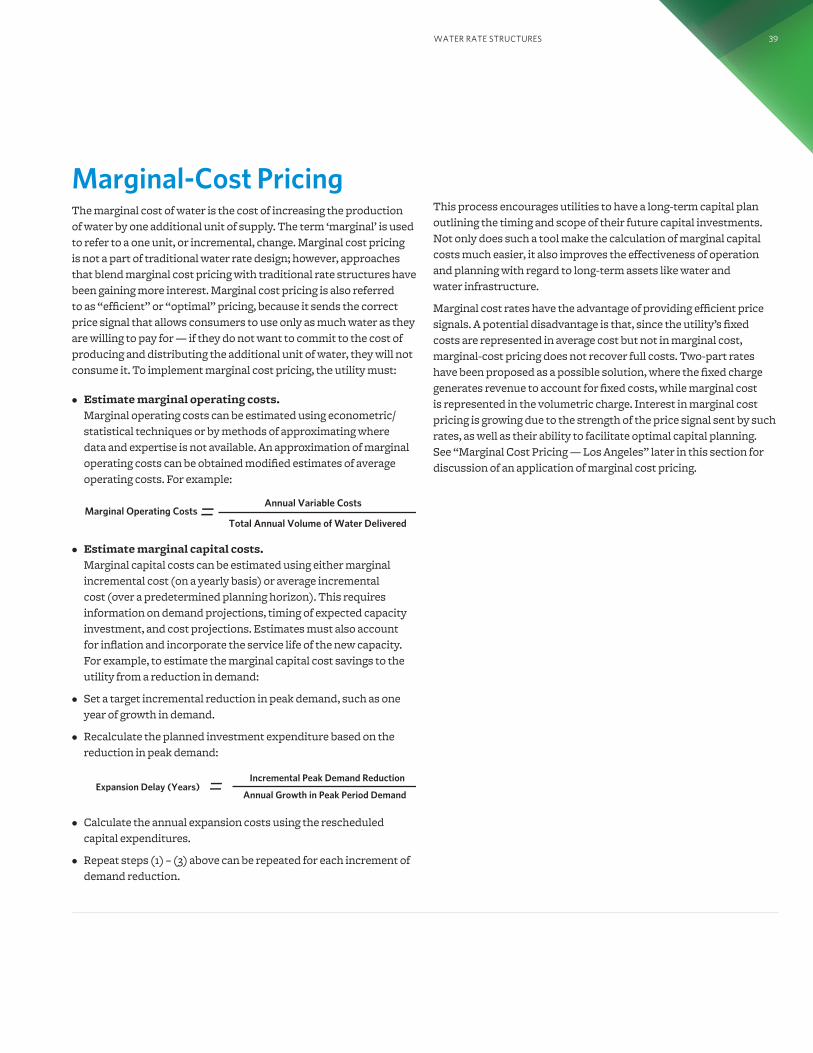
Marginal-Cost PricingThe marginal cost of water is the cost of increasing the production of water by one additional unit of supply. The term ‘marginal’ is used to refer to a one unit, or incremental, change. Marginal cost pricing is not a part of traditional water rate design; however, approaches that blend marginal cost pricing with traditional rate structures have been gaining more interest. Marginal cost pricing is also referred to as “efficient” or “optimal” pricing, because it sends the correct price signal that allows consumers to use only as much water as they are willing to pay for — if they do not want to commit to the cost of producing and distributing the additional unit of water, they will not consume it. To implement marginal cost pricing, the utility must:
• Estimate marginal operating costs. Marginal operating costs can be estimated using econometric/statistical techniques or by methods of approximating where data and expertise is not available. An approximation of marginal operating costs can be obtained modified estimates of average operating costs. For example:
• Estimate marginal capital costs. Marginal capital costs can be estimated using either marginal incremental cost (on a yearly basis) or average incremental cost (over a predetermined planning horizon). This requires information on demand projections, timing of expected capacity investment, and cost projections. Estimates must also account for inflation and incorporate the service life of the new capacity. For example, to estimate the marginal capital cost savings to the utility from a reduction in demand:
• Set a target incremental reduction in peak demand, such as one year of growth in demand.
• Recalculate the planned investment expenditure based on the reduction in peak demand:
• Calculate the annual expansion costs using the rescheduled capital expenditures.
• Repeat steps (1) – (3) above can be repeated for each increment of demand reduction.
This process encourages utilities to have a long-term capital plan outlining the timing and scope of their future capital investments. Not only does such a tool make the calculation of marginal capital costs much easier, it also improves the effectiveness of operation and planning with regard to long-term assets like water and water infrastructure.
Marginal cost rates have the advantage of providing efficient price signals. A potential disadvantage is that, since the utility’s fixed costs are represented in average cost but not in marginal cost, marginal-cost pricing does not recover full costs. Two-part rates have been proposed as a possible solution, where the fixed charge generates revenue to account for fixed costs, while marginal cost is represented in the volumetric charge. Interest in marginal cost pricing is growing due to the strength of the price signal sent by such rates, as well as their ability to facilitate optimal capital planning. See “Marginal Cost Pricing — Los Angeles” later in this section for discussion of an application of marginal cost pricing.
WATER RATE STRUCTURES 39
Marginal Operating CostsAnnual Variable Costs
Total Annual Volume of Water Delivered=
Expansion Delay (Years)Incremental Peak Demand Reduction
Annual Growth in Peak Period Demand=
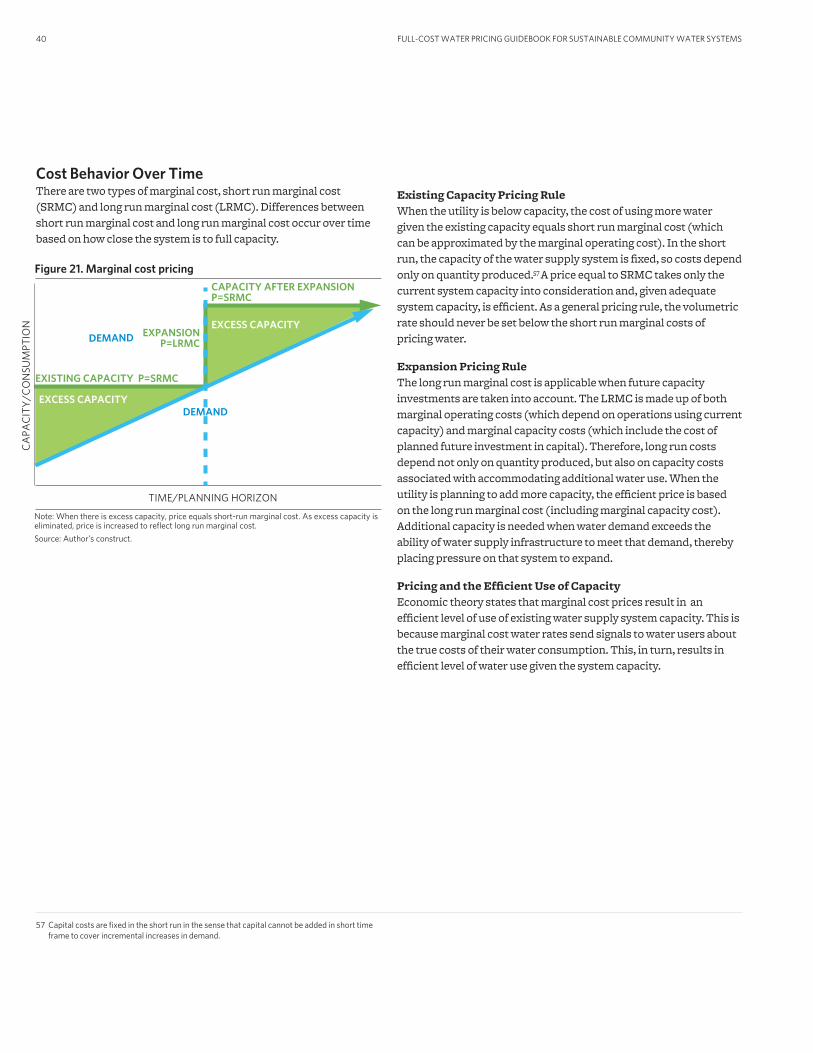
57 Capital costs are fixed in the short run in the sense that capital cannot be added in short time frame to cover incremental increases in demand.
FULL-COST WATER PRICING GUIDEBOOK FOR SUSTAINABLE COMMUNITY WATER SYSTEMS40
Cost Behavior Over Time There are two types of marginal cost, short run marginal cost (SRMC) and long run marginal cost (LRMC). Differences between short run marginal cost and long run marginal cost occur over time based on how close the system is to full capacity.
Existing Capacity Pricing Rule When the utility is below capacity, the cost of using more water given the existing capacity equals short run marginal cost (which can be approximated by the marginal operating cost). In the short run, the capacity of the water supply system is fixed, so costs depend only on quantity produced.57 A price equal to SRMC takes only the current system capacity into consideration and, given adequate system capacity, is efficient. As a general pricing rule, the volumetric rate should never be set below the short run marginal costs of pricing water.
Expansion Pricing Rule The long run marginal cost is applicable when future capacity investments are taken into account. The LRMC is made up of both marginal operating costs (which depend on operations using current capacity) and marginal capacity costs (which include the cost of planned future investment in capital). Therefore, long run costs depend not only on quantity produced, but also on capacity costs associated with accommodating additional water use. When the utility is planning to add more capacity, the efficient price is based on the long run marginal cost (including marginal capacity cost). Additional capacity is needed when water demand exceeds the ability of water supply infrastructure to meet that demand, thereby placing pressure on that system to expand.
Pricing and the Efficient Use of Capacity Economic theory states that marginal cost prices result in an efficient level of use of existing water supply system capacity. This is because marginal cost water rates send signals to water users about the true costs of their water consumption. This, in turn, results in efficient level of water use given the system capacity.
Figure 21. Marginal cost pricing
DEMAND
CAPACITY AFTER EXPANSION P=SRMC
EXPANSIONP=LRMC
EXISTING CAPACITY P=SRMC
TIME/PLANNING HORIZON
CA
PAC
ITY
/CO
NSU
MPT
ION
Note: When there is excess capacity, price equals short-run marginal cost. As excess capacity iseliminated, price is increased to reflect long run marginal cost.
Source: Author’s construct.
EXCESS CAPACITY
EXCESS CAPACITYDEMAND
Marginal Cost Pricing: Los Angeles58
Although incorporating the long run marginal cost (LRMC) of water into water rates is the most economically efficient pricing method, there are few longstanding examples of LRMC water pricing in the United States. Not only do utilities, municipal officials, and technical advisors have to work together to make sure that the prices they set will balance supply and demand, they also have to consider the political implications of any decision they enact. Setting water rates can be a very political process, with serious ramifications for officials who green-light rate designs opposed by their constituents. Though water use efficiency should be an everyday goal, reservations about marginal cost pricing are often not set aside until required by an emergency.
From 1987-1992, Los Angeles and the rest of California experienced one of the most severe droughts in state history. Los Angeles had enough reserves to continue providing water without major changes during the first three years of the drought. However, by 1990, significant water use measures became necessary to make existing supply last through the drought. One of these measures involved redesigning the water rate structure to make water provision more efficient and encourage consumers to conserve.
In 1991, the mayor of Los Angeles appointed the 1991-1992 Mayor’s Blue Ribbon Committee to come up with a more efficient water rate design. The committee recommended a citywide two-tier price system incorporating the LRMC into the second tier price. The LRMC for Los Angeles water was calculated by a Technical Advisory Committee (TAC) of economists. The Blue Ribbon Committee also proposed regular adjustments of the initial tier price according to a revenue target set by the city — if excess revenue was generated, the initial tier price could be lowered, and vice versa. This promoted revenue stability. Since this rate structure was meant to address the ongoing drought, the committee’s recommendation included automatic lowering of the threshold between the first and second tiers and automatic increases in the second-tier price during declared water shortages. The second tier price would rise as necessary to balance demand with existing supply.
The rate design was adopted by the Los Angeles City Council in 1992, the last year of the drought. In 1993, however, several residential users voiced dissatisfaction with the new rates. Much of the dissent came from the San Fernando Valley area, where customers had larger lots, more landscaping, and higher temperatures that came with being further inland, and so saw their summer water bills spike. The following autumn, they voted out one of the two City Council members from San Fernando Valley who had supported the Blue Ribbon Committee’s rate design; soon afterwards, a new mayor of Los Angeles was elected with substantial voter support in the San Fernando Valley area.
Without the drought to drive water rate reform, the process was poised to fall prey to political maneuvering. Residents of San Fernando Valley clamored for the new mayor to revoke the LRMC rate structure. The mayor had made new appointments for all positions on the Department of Water and Power (DWP) Board of Commissioners, which had to pass any recommendation made by the Blue Ribbon Committee; the board refused to consider a recommendation for LRMC rates that was not approved by the Committee’s San Fernando Valley representatives. As 1993 came to a close, it looked as though Los Angeles would have to go back to its pre-1992 inefficient water rate design.
Every cloud has a silver lining, and the 1994 earthquake in Northridge, CA, was no different. Apart from its occurrence on a federal holiday, which helped minimize loss of life, the event also delayed the Los Angeles water rate hearings. This gave the committee time to come up with an alternative rate design that was both efficient and politically feasible. They knew, based on the advice of the economists on the TAC, that using the LRMC would be efficient, but they had to do it differently this time so that their rate design would go over with constituents. The committee members, including those from the valley, agreed that a rate design could be considered “fair” if similar customers were paying about the same average price for water and added this to their goals for the water rate structure.
The main balance that the committee had to strike was between large and small consumers. The difference between these two customer categories had been the primary source of discontent under the 1992 rate structure, and no one wanted a repeat performance. In the 1992 rate design, the Los Angeles City Council had somewhat foreseen the potential for friction when they raised the threshold between tiers to 200 percent of median water use to avoid penalizing large water users; however, this had the effect of exempting small water users from actually paying the marginal cost, since many of them stayed firmly below the threshold. The committee determined that the best way to create a rate system that was both as efficient and as equitable as possible would be to separate the residential customer class into subgroups, each with their own water use threshold.
Since other factors also affecting water use, the committee created 64 subgroups with common lot size, temperature, and family size so that they would be more homogenous. This better ensured the fairness of the rate structure. Median water use was calculated for each subgroup, and the drought threshold set at 120 percent of median use for all subgroups (instead of 200 percent). This had the effect of the benefit across small and large users so that it was more equitable. This system is more efficient as well; with thresholds now based on water use within homogenous subgroups of customers, more customers were paying the second tier marginal cost price. As with the previous rate structure, the committee decided that the second tier price would be equal to the LRMC, and the initial price would be adjusted as needed to meet the revenue target.
WATER RATE STRUCTURES 41
58 Case study based on: Hall, D. (2009). Politically feasible, revenue sufficient, and economically efficient municipal water rates. Contemporary Economic Policy 27(4), 539-554, and Hall, D. (2009). Prescriptive public choice: application to residential water rate reform. Contemporary Economic Policy 27(4), 555-565. Roos, M. (1992). The hydrology of the 1987-1992 California drought. State of California Dept. of Water Resources Technical Information Paper.
FULL-COST WATER PRICING GUIDEBOOK FOR SUSTAINABLE COMMUNITY WATER SYSTEMS42
The committee had several goals for their rate structure: revenue stability, economically efficient while encouraging water conservation, and considered fair by all types of customers, which would make the rate politically feasible. When their recommendation was finished, the first two goals had been objectively reached with the use of initial tier price adjustments and the LRMC. However, the committee was cautious in determining politically feasibility. Rather than having the DWP Board of Commissioners and city council look over the recommendation and send it back with requested changes, the mayor’s office asked the two bodies to actually make revisions. This way, the politicians whose positions would be most affected by public reaction to the new rates were able to ensure that the rate structure would go over well with their constituents. Many of the changes made had to do with the number of subgroups and the placement of thresholds within subgroups, as these aspects of the rate design could be altered without significantly impacting efficiency or revenue stability.
This improved rate structure was enacted by the Los Angeles City Council in 1995. It wasn’t the perfect rate design; however, opposition to this rate structure was nowhere near as high as that garnered by the previous rate structure. Dividing the residential customer class into several subgroups with their own water use thresholds allowed customers to know that their water bills are based primarily on the water they and customers similar to them are using. The biggest testament to the political feasibility of this new rate structure is that it has remained in place throughout the last 17 years.
It is rare to see marginal cost pricing implemented for water in the United States, and even rarer to see a marginal cost system in place when there isn’t a drought to create water shortages. Even the Los Angeles water rate system started out as a method of addressing drought—but Los Angeles was able to take their pricing program a step further by making it feasible even under normal weather conditions. The city was successful because officials were able to see firsthand the importance of anticipating public response to any change in water rates. By separating efficiency, revenue stability, and political feasibility objectives into different elements of the rate structure, the Blue Ribbon Committee gave city politicians leeway to alter the rate structure to their needs without affecting the elements that were to fulfill the first two objectives. Thus, Los Angeles was able to implement a marginal cost pricing program that was, to the best of its ability, efficient, equitable and politically feasible.
Other Rate Design ConsiderationsZonal pricingA simple form of zonal, or spatial, pricing is when the municipality charges different rates between internal zones (e.g. inside a city) and external zones (e.g. outside a city). External rates may be higher, since these customers are further away from the city distribution main, so there is an extra cost for pumping, distribution, and even plant construction as the peak load is increased.
Connection charges
A hookup or connection charge can be used to recover capital costs associated with expanding water service to new service areas. Many utilities will charge the customer directly for the cost of installing a connection or tap to the system water main, with an additional charge per billing period based on meter size. The idea is to allocate capital costs to the customers who cause them. For frequent small connections, the connection charge may be standardized, whereas for larger connections, the fees are often customized according to the costs of serving the large user.
Fire charges
There must be sufficient water utility capacity devoted to fire protection, and sometimes this capacity is what determines the peaking factor for the system. Additional charges to all users or particular user classes may include fire protection, since customers benefit from fire protection, and the utility incurs additional costs from providing the protection. Typically, public fire protection is distinguished from private protection, with public protection provided by municipal hydrants and private protection by customer-owned hydrants. Although charges for public fire protection are often covered by the general fund, and therefore provided for by property taxes, they are part of the costs of supplying water.
Conservation pricing Conservation pricing refers to the role that rates play in a conservation program. Demand-side management, or promotion of conservation, has the aim of influencing demand and is typically implemented in a conservation plan. Prior to implementing the demand management program or conservation plan, communities can use demand forecasting for information regarding growth rates and use per customer by customer class, impact of price on water demand, and effects of passive and active conservation measures. There are numerous ways communities can incorporate pricing effects into conservation planning (Figure 22).
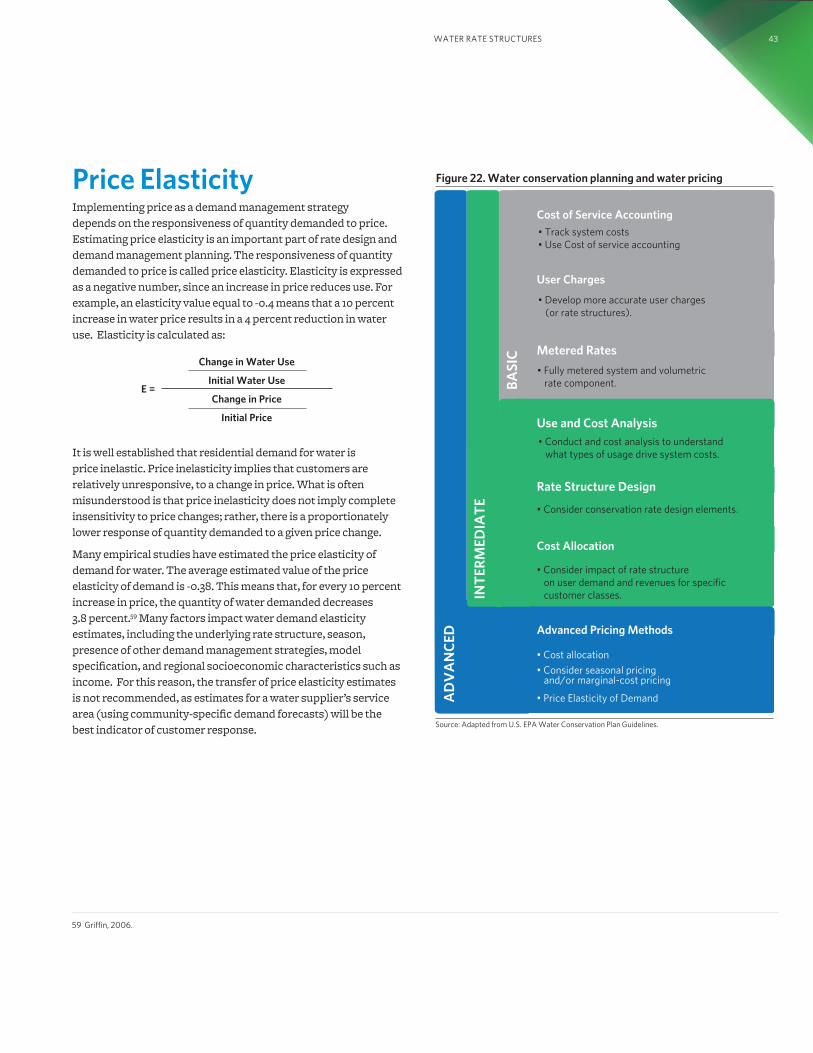
Price ElasticityImplementing price as a demand management strategy depends on the responsiveness of quantity demanded to price. Estimating price elasticity is an important part of rate design and demand management planning. The responsiveness of quantity demanded to price is called price elasticity. Elasticity is expressed as a negative number, since an increase in price reduces use. For example, an elasticity value equal to -0.4 means that a 10 percent increase in water price results in a 4 percent reduction in water use. Elasticity is calculated as:
It is well established that residential demand for water is price inelastic. Price inelasticity implies that customers are relatively unresponsive, to a change in price. What is often misunderstood is that price inelasticity does not imply complete insensitivity to price changes; rather, there is a proportionately lower response of quantity demanded to a given price change.
Many empirical studies have estimated the price elasticity of demand for water. The average estimated value of the price elasticity of demand is -0.38. This means that, for every 10 percent increase in price, the quantity of water demanded decreases 3.8 percent.59 Many factors impact water demand elasticity estimates, including the underlying rate structure, season, presence of other demand management strategies, model specification, and regional socioeconomic characteristics such as income. For this reason, the transfer of price elasticity estimates is not recommended, as estimates for a water supplier’s service area (using community-specific demand forecasts) will be the best indicator of customer response.
E =
Change in Water Use
Initial Water Use
Change in Price
Initial Price
WATER RATE STRUCTURES 43
Cost of Service Accounting
User Charges
Metered Rates
• Track system costs• Use Cost of service accounting
• Develop more accurate user charges (or rate structures).
• Fully metered system and volumetric rate component.
Use and Cost Analysis
Rate Structure Design
Cost Allocation
• Conduct and cost analysis to understand what types of usage drive system costs.
• Consider conservation rate design elements.
• Consider impact of rate structure on user demand and revenues for specific customer classes.
Advanced Pricing Methods
• Cost allocation
• Consider seasonal pricing and/or marginal-cost pricing
• Price Elasticity of DemandAD
VA
NC
ED
BASI
C
INT
ERM
EDIA
TE
Figure 22. Water conservation planning and water pricing
Source: Adapted from U.S. EPA Water Conservation Plan Guidelines.
59 Griffin, 2006.

FULL-COST PRICING GUIDEBOOK FOR LIVABLE COMMUNITIES44
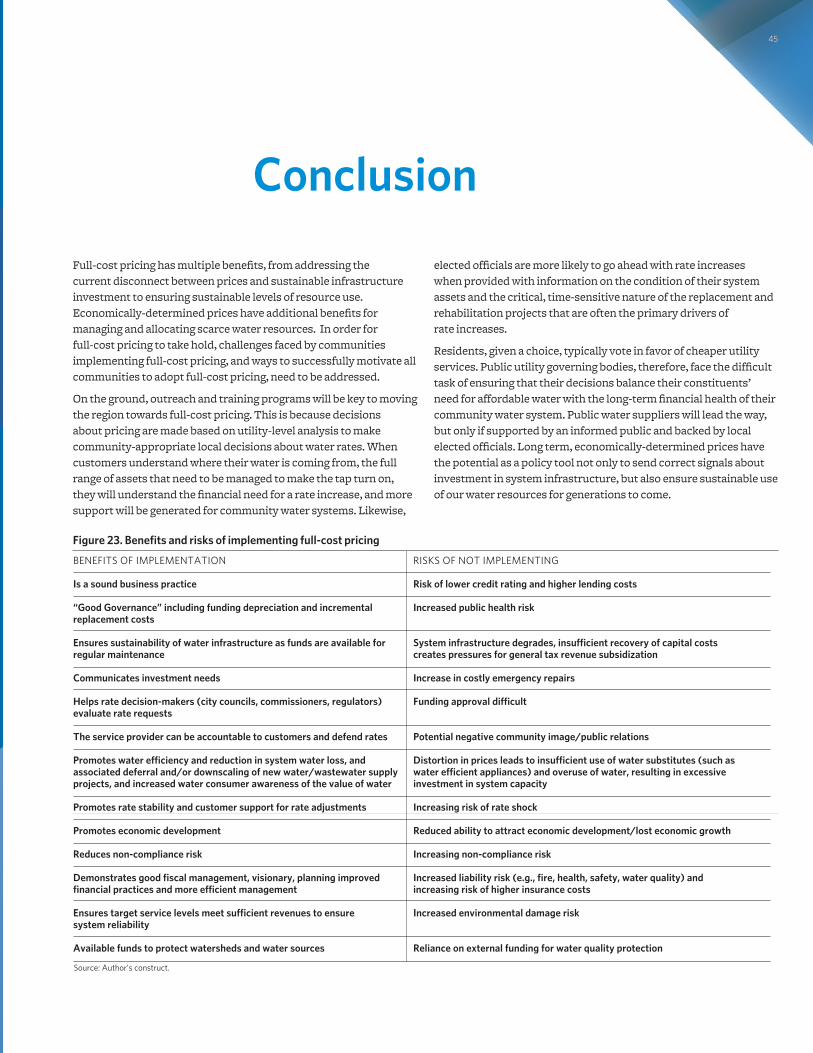
45
Conclusion
45
BENEFITS OF IMPLEMENTATION
Is a sound business practice
“Good Governance” including funding depreciation and incremental replacement costs
Ensures sustainability of water infrastructure as funds are available for regular maintenance
Communicates investment needs
Helps rate decision-makers (city councils, commissioners, regulators) evaluate rate requests
The service provider can be accountable to customers and defend rates
Promotes water efficiency and reduction in system water loss, and associated deferral and/or downscaling of new water/wastewater supply projects, and increased water consumer awareness of the value of water
Promotes rate stability and customer support for rate adjustments
Promotes economic development
Reduces non-compliance risk
Demonstrates good fiscal management, visionary, planning improved financial practices and more efficient management
Ensures target service levels meet sufficient revenues to ensure system reliability
Available funds to protect watersheds and water sources
RISKS OF NOT IMPLEMENTING
Risk of lower credit rating and higher lending costs
Increased public health risk
System infrastructure degrades, insufficient recovery of capital costs creates pressures for general tax revenue subsidization
Increase in costly emergency repairs
Funding approval difficult
Potential negative community image/public relations Distortion in prices leads to insufficient use of water substitutes (such as water efficient appliances) and overuse of water, resulting in excessive investment in system capacity
Increasing risk of rate shock Reduced ability to attract economic development/lost economic growth
Increasing non-compliance risk
Increased liability risk (e.g., fire, health, safety, water quality) and increasing risk of higher insurance costs
Increased environmental damage risk
Reliance on external funding for water quality protection
Source: Author’s construct.
Figure 23. Benefits and risks of implementing full-cost pricing
Full-cost pricing has multiple benefits, from addressing the current disconnect between prices and sustainable infrastructure investment to ensuring sustainable levels of resource use. Economically-determined prices have additional benefits for managing and allocating scarce water resources. In order for full-cost pricing to take hold, challenges faced by communities implementing full-cost pricing, and ways to successfully motivate all communities to adopt full-cost pricing, need to be addressed.
On the ground, outreach and training programs will be key to moving the region towards full-cost pricing. This is because decisions about pricing are made based on utility-level analysis to make community-appropriate local decisions about water rates. When customers understand where their water is coming from, the full range of assets that need to be managed to make the tap turn on, they will understand the financial need for a rate increase, and more support will be generated for community water systems. Likewise,
elected officials are more likely to go ahead with rate increases when provided with information on the condition of their system assets and the critical, time-sensitive nature of the replacement and rehabilitation projects that are often the primary drivers of rate increases.
Residents, given a choice, typically vote in favor of cheaper utility services. Public utility governing bodies, therefore, face the difficult task of ensuring that their decisions balance their constituents’ need for affordable water with the long-term financial health of their community water system. Public water suppliers will lead the way, but only if supported by an informed public and backed by local elected officials. Long term, economically-determined prices have the potential as a policy tool not only to send correct signals about investment in system infrastructure, but also ensure sustainable use of our water resources for generations to come.
FULL-COST PRICING GUIDEBOOK FOR LIVABLE COMMUNITIES46
Appendix: Full-Cost AccountingThe Governmental Accounting Standards Board (GASB) is responsible for establishing standards for the government-owned utilities. Statement No. 34 (GASB 34, 1999) requires government-owned utilities to report the cost of infrastructure assets using one of two methods:
• Depreciation approach: This approach requires government entities to use full accrual accounting — the original cost of capital assets recorded and depreciated. The depreciation approach tends to be preferred by accounting and financial personnel, due to the ease of calculation and the stability of spreading costs from year to year.
• Modified approach: Rather than reporting depreciation expense, government entities establish an account to report the actual required costs of maintaining and replacing assets. Utility managers tend to prefer the modified approach as the actual costs of infrastructure maintenance and replacement needs are better characterized.
The depreciation approach and the modified approach result in different infrastructure cost estimates. A blended approach to reporting asset infrastructure cost under GASB 34 is possible, where the depreciation approach is used for financial statements and the modified approach is used as supplemental reporting information.
As a practical matter, a challenge remains due to resulting discrepancies between book value and calculated asset value. The difference between the recorded book value of the asset and the calculated asset value requires maintenance of two separate accounting books, financial accounting and managerial accounting.
Differences in the treatment of depreciation expense across accounting methods is important in understanding the difference between financial and managerial accounting. Depreciation accounting requires distributing the cost of an asset over its useful life. Financial accounting, which conforms to Generally Accepted Accounting Principles (GAAP) and is used for external financial reporting (including GASB), is based on a historic cost or modified/preservation approach.
Calculation of a depreciation expense based on historical cost accounting has increasingly come under scrutiny, as it may not provide for the necessary maintenance and replacement of the original capital investment since the long-lived nature of water capital means that recorded historic cost is lower than the replacement cost. Use of traditional financial cost accounting methods can therefore lead to underestimation of actual infrastructure maintenance and replacement costs.
4747
Managerial accounting, on the other hand, is based on renewal or replacement cost, and is therefore focused on an analysis of renewal and replacement needs, including long term funding strategies such as rates and costs accounting to make sound managerial decisions. Replacement cost accounting has the potential to provide “… a more meaningful calculation of actual water utility operating expenses and income in order to establish realistic rate structures and to permit capital maintenance.”60 Sustainable systems should know how to use forward-looking accounting methods that consider anticipated costs, as well as asset depreciation and capital improvements.61 Use of managerial accounting methods will therefore ensure a more meaningful estimation of the costs necessary to sustain capital infrastructure.
Sustainable policy experts use the term “full-cost accounting” (FCA) to refer to the sustainability practice of incorporating environmental costs and impacts into decision making. While FCA is often separate from full-cost pricing, it can be used to proactively address potential issues facing the system that would lead to future cost escalations. This practice involves consideration of the environmental impacts of operations, either qualitatively or quantitatively (monetizing the impact by assigning a dollar value). FCA is practiced by entities wishing to:
• Demonstrate a commitment to sustainable development.
• Ensure the long-term water availability given environmental constraints on the resource.
• Ensure sufficient water for long-term economic growth and development.
• Make efficient use of our water, energy, and financial resources.
• Minimize resource consumption, pollution, waste, and environmental damage to ensure livable communities for generations to come.
Clearly, these objectives require considering a longer ‘pay-back period’ than most business entities typically consider. Using FCA does not necessarily mean that estimated values are used as a primary factor in decision making. FCA simply provides information to facilitate more-informed decision making.
CONCLUSION
60 AWWA (1995) op cit.. Industrial Economics, Inc. Cost Accounting and Budgeting for Improved Wastewater Treatment (1998) also discuss the ability of replacement cost accounting to delay capital investment.
61 The absence of full-cost accounting guidelines may deter full-cost pricing implementation.

FULL-COST WATER PRICING GUIDEBOOK FOR SUSTAINABLE COMMUNITY WATER SYSTEMS48
49
Selected Resources and Further Reading
Sustainable Infrastructure Planning and Financing
American Water Works Association (AWWA) A Water Infrastructure Bank and Other Innovations, 2009. Tools to assist water utilities and a policy analysis of a federally-funded water infrastructure bank. Full report can be accessed at: www.awwa.org/files/GovtPublicAffairs/PDF/2010InfraBank.pdf
American Water Works Association (AWWA) M29 Manual: Fundamentals of Water Utility Capital Financing, Third Edition, 2008.
Esri, Inc. ArcGIS Infrastructure Capital Improvement Planning Template www.arcgis.com/home/item.html?id=01eda770e7b14dad9e6df8a43663cace. A downloadable editing map for water and wastewater infrastructure management.
U.S. Department of Energy IWR-MAIN Tool Water Demand Management Suite. apps1.eere.energy.gov/buildings/tools_directory/software.cfm/ID=74/pagename=alpha_list Allows water planners to compare the benefits and costs of water conservation programs compared to supply augmentation.
New Mexico Environmental Finance Center. A.M. Kan Work! An Asset Management and Energy Efficiency Manual, 2012. nmefc.nmt.edu/AssetManagement.php. An interactive manual guiding water and wastewater systems though the process of asset management.
University of North Carolina Environmental Finance Center Capital Planning Resources for Water and Wastewater Utilities. A suite of capital planning resources for creation of a capital plan and asset management plan available at www.efc.unc.edu/projects/capitalplanning.html.
U.S. EPA. Tools for Financing Water Infrastructure. Office of the Chief Financial Officer; Office of Enterprise Technology and Innovation Environmental Finance Staff. March 2007. A compendium of financing mechanisms for communities to promote sustainable infrastructure.
U.S. EPA Two-day Advanced Asset Management Workshop Materials. Full resources available at water.epa.gov/infrastructure/sustain/resources.cfm.
U.S. EPA Check Up Program for Small Systems (CUPPS) An asset management tool for smaller systems. Information available at water.epa.gov/infrastructure/drinkingwater/pws/cupss/index.cfm.
FULL-COST WATER PRICING GUIDEBOOK FOR SUSTAINABLE COMMUNITY WATER SYSTEMS50
Rate Setting
AWWA Principles of Water Rates, Fees, and chargesM1 Manual of Water Supply Practices. 6th Edition 2012. The industry standard on water rate setting.
The National Regulatory Research Institute Cost Allocation and Rate Design for Water Utilities. 1991. A detailed exploration of issues in cost allocation and rate design.
Chesnutt, Thomas, et. al.Designing, Evaluating and Implementing Conservation Rate Structures: A Handbook Sponsored by the California Urban Water Conservation Council July 1997. An examination of rates for conservation planning.
Raftelis, George A. Water and Wastewater Finance and Pricing: A Comprehensive Guide Third Edition, 2005.
University of North Carolina Environmental Finance CenterWater and Wastewater Rates and Fees A suite of resources available at www.efc.unc.edu/rates/ and also Utility Rate Setting for Cost Recovery and Conservation in NC www.efc.unc.edu/projects/NC_ratesetting.htm.
U.S EPA. Office of Water Expert Workshop on Full Cost Pricing of Water and Wastewater Service Michigan State University Institute for Public Utilities Final Summary Report, 2007. Discussion from nationwide experts convened to discuss “full cost pricing” for water and wastewater service.
OrdinancesIllinois Environmental Protection AgencySample Water Charge Ordinance. www.epa.state.il.us/water/forms/pws-sample-ordinance-water-charges.pdf
Ohio Rural Community Assistance ProgramExample Rules and Ordinances Toolkit. www.glrcap.org/ohio
Los Angeles Department of Water and Power Water Rates Ordinance, Shortage Year Water Rates, and Surcharges. www.ladwp.com/ladwp/faces/ladwp/aboutus/a-financesandreports
Value of Water and Water Economics Billings, Bruce R. and C. Vaughan Jones. Forecasting Urban Water Demand. Denver, CO: American Water Works Association, 2008. Coverage of econometric and statistical methods of forecasting water demand.
California Urban Water Conservation Council. Guidelines to Conduct Cost-Effectiveness Analysis of Best Management Practices for Urban Water Conservation. Los Angeles, CA: Californian Urban Water Conservation Council. Prepared by A&N Technical Services, September 1996.
Freeman, A. Myrick IIIThe Measurement of Environmental and Resource Values: Theory and Methods. Resources for the Future, 1993. A summary of economic welfare measurement and benefit calculation.
GeoEconomics Associates IncorporatedEconomic Principles and Concepts as Applied to Municipal Water Utilities Final Report, 2002. A technical presentation of the role of economics in water utility and water resource management.
Griffin, Ronald C. Water Resource Economics: An Analysis of Scarcity, Policies, and Projects 2006 Massachusetts Institute of Technology. A coverage of water resource economics for water professionals.
Hanemann, Michael. The “Economic Conception of Water” in Peter P. Rogers, M. Ramon Llamas and Luis Martinez-Cortina (eds) Water Crisis: Myth or Reality Taylor and Francis, 2006. A brief and readable introduction to water economics.
Moyer, Ellen E. Economics of Leak Detection – A Case Study Approach. Denver, CO: American Water Works Association, 1985. An exploration of the costs and benefits of leak detection.

SECTION TITLE GOES HERE 51
FY13-0010IISG-12-46
Illinois-Indiana Sea Grant Program University of Illinois 374 NSRC, MC-635 1101 West Peabody Drive Urbana, IL 61801
www.iiseagrant.org
233 South Wacker Drive, Suite 800 Chicago, IL 60606
312.454.0400 [email protected] www.cmap.illinois.gov
214 Mumford Hall 1301 W. Gregory M/C 710 Urbana, IL 61801-9015
web.extension.illinois.edu/state