Embed Size (px)
Citation preview

Fulcrum Utility Services LimitedAnnual Report and Accounts 2016
Fulcrum U
tility Services Lim
ited Annual R
eport and Accounts 2016

Fulcrum is the UK’s market leading independent multi-utility infrastructure and services provider and is committed to achieving its aim of being the UK’s most trusted utility services partner.
Stay up to date online:www.fulcrum.co.uk
In this report
Strategic report
01 Highlights
02 2016 in review
04 Fulcrum at a glance
06 Chairman’s statement
08 Strategic report
11 Our strategy
14 Financial report
Corporate governance
16 Board of Directors
16 Executive committee
18 Corporate governance report
20 Remuneration report
21 Group Directors’ report
22 Principal risks and uncertainties
Financial statements
24 Independent auditors’ report
25 Consolidated statement of comprehensive income
26 Consolidated statement of changes in equity
27 Consolidated balance sheet
28 Consolidated cash flow statement
29 Notes to the consolidated financial statements
IBC Advisers
Operating cash flow
£3.8m(2015: £0.8m)
14 15 16
(0.8
)
0.8
3.8
Profit before tax
£4.3m(2015: £0.6m)
14 15 16
(4.5
)
0.6
4.3

• Delivered record profitability
• Generated a positive cash flow
• Cost base further reduced
• Direct delivery model successfully established and embedded
• Secured a 26 month framework contract extension with British Gas
• Won and delivered a £4.0m distillery project
• New electricity and multi-utility contracts won
• Increased pipeline ownership and operation
• Progressive dividend policy introduced
• Launched a Shareshave scheme and new incentive schemes for Fulcrum people
HIGHLIGHTS
Another year of successful delivery
Won Company of the Year 2016 – Gas Industry Awards
ANNUAL REPORT AND ACCOUNTS 2016

2016 IN REVIEW
A year of landmark achievements
In 2016 Fulcrum successfully delivered against its objectives of driving customer service excellence, improving operational efficiency and growing the pipeline estate.
Right:
New dedicated housing division launchedNew team with specialist gas, electricity and water engineers
Left to right: Some of Fulcrum’s dedicated housing team, Lorraine Duffy (Estimating & Projects Manager), Michael Conway (Electrical Design Engineer), Kevin Walpole (Associate Director of Sales), Sarah Matthews (Design Engineer) and Ben Hanson (Design Engineer)
Below:
Left to right: Mick Carter (Major Projects Manager) and Deborah Heary (Business Development Manager) on site at a biogas connection at Welbeck Colliery
26 month contract extension with British Gas securedRead more on page 12
£4.0m Speyside contract won and delivered ahead of scheduleRead more on page 7
New £1.0m electricity infrastructure project securedRead more on page 12
Secured new multi-utility and housing contractsRead more on page 17
First employee Sharesave scheme launched
New biogas and STOR sector contracts wonRead more on page 13
2016 Gas Industry Award winners:• Company of the Year• Manager of the Year
and finalists for:• Leadership • Engineer of the Year• Young Person’s
Achievement
STRATEGIC REPORT
02
FULCRUM UTILITY SERVICES LIMITED

Below:
First brand expanded with FirstElectricity launchNew service for small and one-off electricity connections follows on from a successful first year for the FirstGas division
Left to right: Michael Wood (FirstElectricity Account Executive), Jo Kidd (First Brand Team Leader), Craig Baugh (Head of Marketing and Communications) and Kevin Walpole (Associate Director of Sales)
Profit before tax
£4.3m(2015: £0.6m)Record level
Online-initiated sales
£5.9m(+38%) Fulcrum and FirstGas web reporting (April 2015–March 2016)
RIDDOR incident rate
0.14(2015: 0.0) Fulcrum KPI reporting (April 2015–March 2016)
British Gas “RightFirst Time” performance
97%(+0.5%)British Gas performance reporting (April 2015–March 2016)
Above:
Ian Foster, Manager of the Year 2016, Gas Industry Awards
ANNUAL REPORT AND ACCOUNTS 2016
03

We will achieve our vision by being trusted by our customers to deliver the best service in the industry, to provide value for money and to offer the full range of utility services our customers want.
We are the UK’s market leading independent energy and multi-utility infrastructure provider. We continue to be the only independent utility infrastructure provider covering the whole of Britain.Our breadth of services, coupled with national capability, is unmatched and ranges from the design, installation or alteration of utility services for single-site properties to large and complex multi-site projects.
Read about how we are developing each of our business areas in our strategy on page 11
FULCRUM AT A GLANCE
Fulcrum will be the UK’s most trusted utility services partner
Our track record of excellence and commitment to being the most trusted utility services provider:We have a track record of excellence in customer service, coupled with sector leading credentials, including multiple awards for health and safety and delivery.
In 2016 we were incredibly proud to win Company of the Year and Manager of the Year at the prestigious Gas Industry Awards.
We continue to develop our people, who have the expertise, passion and commitment required to support our customers and provide leading levels of service, whilst at the same time ensuring the very highest of engineering and health and safety standards.
We also continue to build our business around our customers and their needs. We listened to their requirements to develop customer centric, sector leading services delivered in line with our values.
Our mission
What do we do?
What sets us apart?
STRATEGIC REPORT
04
FULCRUM UTILITY SERVICES LIMITED

We will achieve this through:• always delivering a safe, right first time service;
• being a great team that consistently lives according to the Fulcrum values; and
• continuously striving to improve.
Our values:• We put our customers first
• We keep our promises
• We have a can do attitude
• We work as a team
Gas connectionsFulcrum services a complete range of customers and projects, from single-site connections to infrastructure projects of national significance. The business is able to deliver a holistic gas service to its customers by combining connection, disconnection, metering and outlet pipework services.
Dual fuel and multi-utility connectionsFulcrum offers dual fuel and multi-utility solutions for all types of development, allowing its customers to benefit from the efficiencies of a co-ordinated delivery.
Regulated pipeline operationsThrough its subsidiary, Fulcrum Pipelines Limited, Fulcrum is licensed as an Independent Gas Transporter, owning and operating a growing portfolio of gas infrastructure that connects properties to the main UK gas networks. These assets generate income from the transportation of gas between the main regional gas networks and individual properties. Fulcrum Pipelines Limited is regulated by Ofgem as an Independent Gas Transporter.
Full national coverage
Trusted delivery, on time
Projects of any scale
Asset ownership ability
Leading service delivery
End-to-end delivery through a single brand
Multi-utility offering Best value for money
05
ANNUAL REPORT AND ACCOUNTS 2016

CHAIRMAN’S STATEMENT
Our performance in 2016 reflects the benefits of our successful strategy
I am pleased to present the annual report and financial statements for Fulcrum for the year ended 31 March 2016. The Group is reporting a significant profit improvement and increased cash generation. This has been achieved through the successful transition to a direct delivery model and major contract wins.
I am delighted and very proud to report that Fulcrum won Company of the Year at the 2016 Gas Industry Awards, a commendable accolade that recognises the achievements delivered by our strong leadership team, supported by an experienced and committed workforce.
Financial ResultsFor the year ended 31 March 2016 the Group reported profit before tax of £4.3 million (2015: £0.6 million), and underlying EBITDA of £5.3 million (2015: £2.2 million). Revenue for the year was £34.5 million (2015: £33.7 million) which included £4.0 million for the Speyside distillery project. The Group achieved an 8.8% improvement in gross profit margin at 37.6% (2015: 28.8%) reflecting the move to direct delivery, operational efficiencies and an ongoing focus on tendering criteria and subsequent profitability.
Earnings per share for the period were 3.1p per share (2015: 1.8p). The adjusted earnings per share, before crediting deferred tax, was 2.7p (2015: 0.7p). The diluted earnings per ordinary share for the period was 2.7p (2015: 1.6p). The diluted adjusted earnings per share, before crediting deferred tax, was 2.4p (2015: 0.6p).
Net cash inflows before financing activities were £3.8 million (2015: 0.8 million), after the addition of pipeline assets of £1.9 million. At 31 March 2016 the overall net cash position was £8.3 million.
DividendFollowing on from last year’s maiden dividend (0.4p) and this year’s interim dividend (0.3p), the Board is recommending a final dividend for FY2016 of 0.6p per share, making the total dividend 0.9p for FY2016 (2015: 0.4p). The profit and cash generated by infrastructure services, and the transportation income from the growing pipeline asset base, provide confidence in the sustainability and growth of future dividends.
Board and Corporate GovernanceThere have been no changes to the Board during FY2016.
The Board remains focused on strong corporate governance, including nurturing a culture in which our people behave in accordance with our values and the highest standards of ethics and integrity, which is fundamental to building a business that can deliver sustainable, profitable growth. I believe that our commitment to business integrity, safety, sustainability and strong governance is a key strength of our business.
OutlookFulcrum has continued to make excellent progress this year, delivering on our objectives and strategy. The management of direct labour, brought in-house on 1 April 2015, has delivered an improved customer experience with an efficient, integrated, end-to-end operating model. With our robust and scalable operating platform, combined with a sustained focus on customer service excellence, we can look forward to building on recent contract wins and further expanding our multi-utility services.
The Group’s order book and operating cash flow both remain strong and support our strategy for growth. We believe the outlook remains positive and that the Group continues to be well positioned to make further progress in 2017.
Philip HolderNon-executive Chairman7 June 2016
Fulcrum has continued to make excellent progress this year, delivering on our objectives and strategy.”
EBITDA
£5.3m(2015: £2.2m)
Net funds
£8.3m(2015: £5.6m)
STRATEGIC REPORT
06
FULCRUM UTILITY SERVICES LIMITED

07
In July 2015 Fulcrum was awarded a £4.0m contract to install a 13km pipeline to link four distilleries, Tamdhu, Dalmunach, Cardhu and Knockando, located in Speyside, to Scotland’s main gas network.
Awarded by a partnership of three whisky companies who shared the cost of the pipeline, Chivas Brothers, Diageo and Ian Macleod Distillers, the project was successfully completed a month ahead of schedule despite its significant complexity and regularly adverse weather conditions.
The connection to the gas network is now helping reduce the distilleries’ carbon footprints by cutting their reliance on fuel oil and ending the need for its delivery by road tankers during the summer months.
Scotch whisky distilling is a crucial sector for the Speyside economy and this is a significant investment in the infrastructure which underpins our business and an investment in the sustainability of our industry.”Keith Miller, Distilling and Maturation Director, Diageo
Thank you to all of the many parties involved for their friendly co-operation which brought this project to a successful conclusion.”Mike Younger, Finance Director, Ian Macleod Distillers
This is the second gas pipeline project delivered by Fulcrum, which Chivas Brothers has been part of and we look forward to the benefits it will bring our operations.”Gordon Buist, Production Director, Chivas Brothers
£4.0m13km pipeline
Completedone monthahead of schedule
£4.0m distillery gas pipeline completed ahead of schedule
Gas adoption
by FulcrumPipelines
ANNUAL REPORT AND ACCOUNTS 2016

Principal Activities
The Group’s principal activities are the provision of unregulated utility connections and independent gas transportation services in the UK.
The Group designs and project manages utility connections for customers seeking either new connections or the alteration or refurbishment of existing connections. These connections range from simple, single-site alterations to large, complex multi-utility, multi-site new connections. For all projects, the Group’s team of skilled design and engineering staff are required to design the connections to detailed specifications and to ensure the connections are appropriate and comply with extensive health and safety requirements.
The Group comprises two trading subsidiaries:
• Fulcrum Infrastructure Services Limited (providing utility infrastructure and connection services); and
• Fulcrum Pipelines Limited (the licensed owner of the Group’s gas transportation assets).
Chief Executive’s ReviewIn 2016, we successfully delivered on our objectives to drive customer service excellence, improve operational efficiency to reduce costs and grow our pipeline estate. This hard work has delivered a record underlying EBITDA at £5.3 million (2015: £2.2 million) and positive cash generation of £3.8 million before financing activities.
The Group achieved an 8.8% improvement in gross profit margin at 37.6% (2015: 28.8%) in the period. Further to the move to the direct delivery model from 1 April 2015, we have quickly made efficiency improvements in the way our contracts are set up and run. In addition, continued progress has been made in reducing the cost base of the business to ensure that our competitive rates can be sustained in the long term. All costs are subject to rigorous reviews and efficiency savings are continually sought. Overall, overhead levels (excluding exceptional items) have reduced by an incremental £1.0 million (2015: £1.6 million) during the course of the last 12 months. In total, fixed costs of sales plus overheads have reduced from approximately £17 million to £10 million over the past three years.
Safety is paramount in our organisation. Our goal remains for everyone who works with us to return home unharmed at the end of each day, including customers, contractors, employees and the general public. We have improved our recording and investigation of near-misses to ensure that learnings are shared - our employees and contractors are fully empowered to ensure that work is delivered safely.
Trading UpdateIn FY2016, year-on-year revenue increased by £0.8 million or 2.3% to £34.5 million. With the profitable operating platform now established, our focus turns to sales growth. During the period, we simplified our sales approach, combining the sales and design functions into dedicated teams to cover our routes to market: key accounts (including British Gas), major projects, housing and technical sales.
Key accountsFulcrum’s sustained emphasis on customer service excellence and listening to what our customers require have improved our customers’ satisfaction ratings and ensured that we have strong levels of repeat revenues. 64% of our business was generated from customers who have used Fulcrum previously. We have set up a dedicated team to support those customers that provide us with high volumes of repeat business. This team is working with our customers to provide tailored services that meet their specific needs.
In November 2015, we announced a 26 month extension to our framework contract with British Gas, a long standing and valuable client of the Group. The framework contract, to provide gas and now electricity connections and metering services to customers in England, Scotland and Wales, runs until January 2018. This underlines Fulcrum’s reputation as a trusted utility services provider.
STRATEGIC REPORT
Delivering on our objectives
• Successfully integrated end-to-end, fully branded operating model
• Operating efficiency improvements underpinned enhanced profitability
• Dedicated sales teams established
• Developed multi-utility capability
STRATEGIC REPORT
08
FULCRUM UTILITY SERVICES LIMITED

Trading Update continuedMajor projectsOur ability to deliver significant projects was endorsed with the award of a second prestigious contract with Scotland’s whisky industry. The £4.0 million project to install a 13 kilometre pipeline to link four Speyside distilleries to Scotland’s main gas network has delivered a sustainable, efficient and environmentally friendly energy supply for our clients. Despite the complexity of the project, our dedicated teams completed the work one month ahead of schedule.
Fulcrum has continued to win an array of major new gas, electricity and multi-utility contracts, which include:
• a £1.0 million electricity contract to install 4 kilometres of high voltage electricity cabling to a new hospital. The award of this contract follows on from the successful delivery of a £0.2 million contract to install the temporary electricity infrastructure into the hospital, on behalf of British Gas Business;
• the Group’s first contract to deliver infrastructure to a Short Term Operating Reserve (STOR) site. The £0.2 million project was quickly followed by another £0.3 million STOR site contract;
• the Group’s first biogas connection, the installation of a 1.3 kilometre pipeline to connect a £12.0 million biogas plant to the UK distribution network;
• a £0.4 million gas infrastructure project for the new development at Royal Albert Dock for London’s third business district; and
• a £0.2 million dual fuel contract to deliver gas and electricity infrastructure to a new energy centre in Glasgow.
We are confident that major projects present a significant opportunity to grow our sales. Therefore, over the past year, we have doubled the number of business development managers and created two new analyst support roles concentrating on the targeting of large opportunities, all designed to increase our work-winning capability.
HousingOur activity in the housing market has been somewhat limited historically. To penetrate this attractive market, we have created a more cost-effective delivery model for housing and set up a new dedicated team, headed up by an experienced housing sector professional with multi-utility knowledge. We have already secured several significant, multi-utility housing schemes, including:
• a £0.3 million contract on behalf of Lend Lease to deliver the gas infrastructure to a new residential development in Deptford; and
• a £0.2 million gas, electricity and water project for a leading housing developer in the North West.
Technical salesThe multi-skilled technical sales team have the expertise to take sales leads from a myriad of sources and convert the opportunities into customer led projects, with their knowledgeable and joined up design and sales approach.
Within this route to market, our web initiated sales continue to gather momentum, increasing by 38% year-on-year to £5.9 million, now 17% of our total Group revenue. In early 2015, we launched FirstGas, a second online brand, aimed at new and less technically experienced customers. Sales have proven to be positive and incremental to the existing offering. Therefore, in line with the Group’s previously stated aim of growing its electricity and dual fuel offering, the Group launched its third online brand, FirstElectricity, in March 2016. Early enquiries and sales are encouraging.
With our established customer base, clearly focused work-winning teams, trusted delivery and market opportunity, we have a robust platform from which to leverage sales growth.
OperationsThe Group has benefited from the positive impact of an in-house operational delivery model following the transfer in of 99 employees under TUPE on 1 April 2015. We now have direct control of the full operational process from design through to installation across England and Wales. We have successfully transitioned to this branded direct delivery model which has underpinned notable operational efficiencies, benefitting both the customers’ experience and our profitability. The introduction of tablet devices to all teams has enabled field engineers and operatives to maintain real-time project records and offer a more responsive delivery. Low cost mobile applications have been developed by Fulcrum’s IT team to share work instructions and site surveys, as well as upload health and safety audits directly into the core system. After engaging with our teams and listening to their suggestions, several more tailored applications are planned in the months ahead.
We have also delivered on our strategy to build our multi-utility capability and we now have several in-house teams trained to deliver the recently won electric contracts. This end-to-end, fully branded operating model creates an agile and responsive platform to deliver continued growth through a multi-skilled workforce and customer-focused operation. This model is a key differentiator and further enhances our customer service led, national, broad offering.
Left: Louise McCaughey (Diageo), Stevie McGill (Operations Business Development Manager), Martin Donnachie and David MacInnes (Chivas Brothers) at Dalmunach Distillery, which is jointly benefitting from the new £4.0m gas pipeline delivered by Fulcrum
ANNUAL REPORT AND ACCOUNTS 2016
09

STRATEGIC REPORT continued
Operations continuedThe challenge to continuously improve the way we do things has reduced our cost base by an incremental £1.0 million year-on-year which, together with turnaround/transition activities completed in previous financial years, represents a combined cost reduction of £7.0 million over the past three years. In order to maintain competitive advantage, we will continually challenge existing working practices and resources to ensure that the business model is efficient and lean. Our cost of delivery across all functions (direct, indirect and support) will be rigorously and continually tested to drive improved levels of sales orders won and sustainable profitability.
PipelinesWe continue to build our estate of pipeline assets, increasing our owned portfolio of domestic, industrial and commercial assets by £1.9 million in FY2016 to a total net book value of £9.4 million at 31 March 2016. The annualised gas transportation income has grown to £1.2 million and, with the low costs to serve, this annuity income stream represents a secure and profitable element of the Group’s future financial stability.
To accelerate the growth of our asset base and hence increase shareholder value, we have created an Asset Growth Manager role. In addition to Fulcrum owning and operating the assets built by our infrastructure services division, the Asset Growth Manager is approaching other utility infrastructure providers without independent gas transportation licences to acquire the pipelines that they build for a cash consideration. Also, the expansion of housing activity will grow the pipeline estate by using cash to unlock significant domestic asset values on larger sites. We will pursue both of these incremental routes as part of our strategy to further enhance this valuable, long-term future income stream.
PeopleThe talent and dedication of our employees and co-operation with our customers are our key success factors. It is our people who win new contracts and are responsible for delivering on stakeholders’ expectations. They are also the ones whose behaviour and actions demonstrate our values in practice.
Our enduring commitment to workforce development has been recognised at the prestigious Gas Industry Awards with our Operations Director, Ian Foster, winning Manager of the Year for the role he has played in Fulcrum’s transformation. Training and development continue at pace across the Group – our field engineers have joined the “Leading The Way” leadership development programme; the senior team have received leadership training focused on driving superior performance; and teams are now trained to design electrical installations and install electric cable. Sustained investment will continue to be made to underpin employee engagement and continuous learning. We also actively review and manage our succession plans.
The introduction of Fulcrum’s first Save As You Earn share scheme had a 60% participation rate; our employees are clearly keen to be part of the future value creation.
Going ConcernAs highlighted in the Financial Review, the Group had net funds at 31 March 2016 of £8.3 million (2015: 5.6 million). Also, the Group has an undrawn revolving credit facility of £4.0 million.
As a matter of course, financial forecasts are regularly prepared and these are reviewed and adopted by the Board. These forecasts are subject to “stress testing” with appropriate sensitivity analysis and scenario planning to ensure that any adverse impact can be managed and mitigated such that the business can continue to operate within its existing financing facilities.
The Group’s forecasts and projections, after taking account of sensitivity analysis of changes in trading performance and corresponding mitigating actions, show that the Group has adequate cash resources for the foreseeable future.
Therefore, after making enquiries, the Directors have a reasonable expectation that the Group has adequate resources to continue in operational existence for the foreseeable future. Accordingly, they continue to adopt the going concern basis in preparing the annual report and financial statements.
OutlookFulcrum continues to deliver on its strategy and has made excellent progress over the period. The talent of our people, together with the scalable and profitable operating platform that has been created, have enabled significant and diverse contract wins. We are now striving for sales growth across all of our routes to both the gas and electricity markets and driving a continuous improvement ethos to deliver incremental operating efficiencies. This approach will combine to enhance long-term future profitability and cash generation.
We continue to move forward at pace with confidence for the future as we remain on course to deliver value to all our stakeholders by being the UK’s most trusted utility services partner.
Martin DonnachieChief Executive Officer7 June 2016
STRATEGIC REPORT
10
FULCRUM UTILITY SERVICES LIMITED

OUR STRATEGY
A targeted growth strategy
Robust and scalable operating platform with a sustained focus on customer service excellence
Fulcrum continues to deliver on its strategy and has made excellent progress over the period. We are now:
• striving for sales growth across all of our routes to both the gas and electricity markets; and
• driving a continuous improvement ethos to deliver incremental operating efficiencies.
We continue to move forward at pace with confidence for the future.
• Nurturing profitable relationships with repeat customers
• Customer service excellence
• Improved customer satisfaction levels
• British Gas contract extended to 2018; now includes electricity
• £1.0m electricity contract won
• Account growth through trusted delivery
• Sustained emphasis on customer service excellence
• Increasing the number of multi-utility contracts won
• National sales force
• Ability to deliver significant projects anywhere in mainland UK
• Increased investment in team
• New gas, electricity and multi-utility contracts won
• Secured contracts for major developments across the UK
• Expanding the pipeline of new opportunities
• Increasing the number of multi-utility contracts won
• Cost effective delivery model
• Asset ownership ability
• New housing division
• In-house gas, electricity and water experts
• New housing and multi-utility contracts secured
• Increasing housing activity by using cash to unlock large asset values
• Prominent online visibility
• Responsive, customer led technical sales service
• 38% YOY online sales growth
• Launch of third brand, FirstElectricity
• Continued investment in search engine optimisation to stimulate more growth
• Joined up, added value online services
Delivered through Priorities for 2016/17Progress in 2015/16
Major projects
Key accounts
Housing
Technical sales
11
ANNUAL REPORT AND ACCOUNTS 2016

In November 2015 Fulcrum secured a 26 month extension to its contract with British Gas to 2018. In addition to gas infrastructure, the contract now also includes the provision of electricity infrastructure to British Gas Business customers in England, Scotland and Wales.
This extension validates the investments Fulcrum has made to support its customers and demonstrates the excellent relationships that have been cultivated between both businesses. Fulcrum project engineers, designers and site operatives work incredibly closely with British Gas, which ensures leading levels of project delivery and customer service.
26 monthframework contract extension from December 2015
Electricity infrastructure added to existing contract
26 month, dual fuel framework contract extension with British Gas
Fulcrum is a reliable partner to our business and our customers. We’re pleased to extend our contract win then by 26 months and include electricity infrastructure services, which means we can offer our customers more options to suit their needs.”
James Bennett, Director of Connections & Metering, British Gas Business
£1.0m electricity infrastructure contract for new hospital
£1.0melectricity infrastructure contract
4kmof high voltage electricity cabling
In partnership with British Gas, Fulcrum secured a significant £1.0m contract involving the new £588 million Midland Metropolitan Hospital in Birmingham, awarded by infrastructure and support services group Carillion.
The £1.0m contract for Fulcrum, starting in summer 2016, comprises the installation of four kilometres of high voltage electricity cabling as part of the development of the 670-bed hospital. The award of this significant contract follows on from the successful delivery of a £0.2m contract to install the temporary electricity infrastructure into the hospital, on behalf of British Gas.
This significant project demonstrates the excellent partnership that we have forged with Fulcrum with our collaboration proving to be responsive and flexible in providing high quality service delivery within demanding timescales and budgets.”
Richard Butler, Business Relationship Manager, British Gas Connections and Metering
STRATEGIC REPORT
12
FULCRUM UTILITY SERVICES LIMITED

13
Fulcrum diversifies services to support power generation
Utilising expertise in the delivery of utility infrastructure across Britain, Fulcrum has entered the renewables sector to provide pipelines which connect biogas plants to the UK gas distribution network. This new service sees Fulcrum’s installation process reversed to enable energy produced by biogas generators to be fed into the UK network.
Fulcrum secured and delivered its first biogas contract shortly after entering the market, with the installation of a 1.3km gas pipeline to connect a £12.0m biogas plant to the UK distribution network at Welbeck Colliery.
Another significant milestone in Fulcrum’s diversification strategy has been entry into the Short Term Operating Reserve (STOR) market, again quickly securing contracts which are worth a combined total of more than £0.6m.
The first three projects, which have been commissioned by Kingsnorth Power, Wednesbury Power and Pen Y Fan Power, will provide improved infrastructure to gas-fired electricity generators.
These sites convert gas into electricity in order to supply the national electricity network with reserve power during times of peak demand.
Above:
Left to right: Deborah Heary (Business Development Manager) and Mick Carter (Major Projects Manager) on site at Welbeck Colliery
1.3kmbiogas pipeline installation
£0.6mof STOR contracts secured
3projects commissioned
13
ANNUAL REPORT AND ACCOUNTS 2016

RevenueRevenue improved by £0.8 million or 2.3% to £34.5 million (2015: £33.7 million) including £4.0 million for the Speyside distillery project. Revenues from infrastructure services amounted to £33.4 million (2015: £32.9 million), and £1.1 million (2015: £0.8 million) from pipeline operations.
Profit and performanceGross profit is up by £3.3 million to £13.0 million (2015: £9.7 million), with the gross profit margin increasing by 8.8% to 37.6% (2015: 28.8%) benefiting from the efficiencies gained by changing the project delivery operating model and ongoing selective bidding.
A sustained focus on continuous improvement and changes to the operating model have delivered incremental overhead savings over the period, whilst simultaneously investing in our work-winning approach.
Share based payment charges of £0.3 million (2015: £0.1 million) associated with the Group’s equity based option schemes were booked in the year. During FY2016, the previous schemes in operation achieved the performance criteria and the full scheme charges were accelerated to reflect this fact. New schemes were introduced in March 2016 and had minimal impact on the FY2016 charge.
There was a minimal exceptional charge in the year compared to £0.5 million in the prior year. Exceptional items relate to the costs associated with changing the operating model and reassessment of dilapidations costs.
Underlying EBITDA for the period has more than doubled to £5.3 million (2015: £2.2 million) and profit before tax has increased by £3.7 million to £4.3 million (2015: £0.6 million), a record for the Group.
Earnings per share Basic earnings per share from continuing operations, before charging exceptional items, was 3.1p (2015: 1.8p), significantly up on the prior year. On a statutory basis, the diluted basic profit per ordinary share from continuing operations was 2.7p (2015: 1.6p).
FINANCIAL REPORT
Significant improvement in profitability and cash generation
Year ended31 March 2016
£m
Year ended31 March 2015
£m
Year on yearchange
£m
Revenue 34.5 33.7 0.8
Gross profit 13.0 9.7 3.3
Gross margin 37.6% 28.8% 8.8%
Underlying EBITDA* 5.3 2.2 3.1
Profit before tax 4.3 0.6 3.7
Net funds 8.3 5.6 2.7
* Earnings before interest, tax, depreciation, amortisation, share based payments and exceptional items.• Underlying EBITDA significantly increased by 141% or £3.1m to £5.3m
• PBT up £3.7m to £4.3m
• Net cash generated from operations of £3.8m
• Net funds up £2.7m to £8.3m
• Total dividends up 125% to 0.9p per share (2015: 0.4p)
• Additions to pipeline assets of £1.9m (2015: £1.7m)
The financial results for the year to 31 March 2016 reflect another excellent year for our business. We successfully integrated an end-to-end, fully branded operating model and delivered associated operational efficiencies; secured the new British Gas contract to 2018; continued to challenge and reduce the overhead levels and simultaneously generated a positive cash inflow. These actions combined to improve the profit before tax by £3.7 million to £4.3 million (2015: £0.6 million). The underlying financial performance, together with a comparison with the previous year, are summarised in the table below:
STRATEGIC REPORT
14
FULCRUM UTILITY SERVICES LIMITED

Dividends During the year, the Company paid a maiden dividend for the full financial year 2015 of 0.4p per share and a FY2016 interim dividend of 0.3p per share. Total cash outflow in respect of dividends was £1.1 million (2015: £nil).
The Board remains confident in the ongoing cash generation for the business and has proposed a final dividend, subject to shareholder approval at the Annual General Meeting, of 0.6p per share (2015: 0.4p per share) producing a total dividend for the year of 0.9p per share (2015: 0.4p per share).
This final dividend is expected to be paid on 28 October 2016 to shareholders on the register on 30 September 2016 with an ex-dividend date of 29 September 2016.
Cash generated by infrastructure services, combined with the financial security of a growing pipeline asset base, provides confidence in the sustainability and growth of future dividends.
Taxation Deferred tax assets totalling £3.2 million have been recognised at 31 March 2016 (2015: £2.7 million). £0.7 million was utilised against the Group’s taxable profits of £3.6 million and an additional £0.5 million of deferred tax asset was recognised, after consideration of future levels of profitability. The total accumulated losses brought forward from prior periods amounted to approximately £21.4 million.
Deferred tax liabilities totalling £0.7 million have been recognised at 31 March 2016 (2015: £0.6 million) in respect of the revaluation of the industrial and commercial pipeline assets. There is currently no intention to sell these assets and the Group expects to recover their value through use therefore no tax is currently expected to be payable in respect of the revaluation.
Tangible assetsCapital expenditure for the period amounted to £2.0 million (2015: £1.7 million), principally in respect of the addition to pipeline assets, £1.9 million (2015: £1.6 million).
Cash generation With the move to the direct delivery model during the year, a new supply chain function was swiftly established and successfully integrated. Working capital has been tightly managed throughout the period and produced a positive operating cash flow from trading activities of £3.8 million (2015: £0.8 million).
At 31 March 2016, the Group had net funds of £8.3 million (2015: £5.6 million), a £2.7 million increase against the prior period, after the addtions to our pipeline estate and supply chain integration.
Bank facilitiesIn November 2015, the Group agreed a new (undrawn) three year revolving credit facility for £4.0 million with the Group’s bankers, Lloyds Banking Group, to replace the previous (undrawn) invoice discounting facility. The cash at bank and added financial security with the revolving credit facility both position the Group with sufficient funds to facilitate our growth plans and adequate access to cash to cover its contractual obligations.
The revolving credit facility remains undrawn and the Group has complied with all of the associated financial covenants.
Balance sheetTotal net assets at 31 March 2016 were £5.8 million (2015: £1.1 million) and included intangible assets of £2.6 million (2015: £2.8 million).
Financial risksThe main financial risks faced by the Group are credit risk and liquidity risk. The Directors regularly review and agree policies for managing these risks.
Credit risk arises from cash and cash equivalents and credit exposure to the Group’s customers. Over half of the Group’s customers pay in advance of works commencing, with the remaining profile consisting of established large businesses. It is considered that the failure of any single counterparty would not materially impact the financial wellbeing of the Group, other than one customer, for which the risk of failure is considered to be minimal based on current market conditions and performance.
Liquidity risk is the risk that the Group will not be able to meet its financial obligations as they fall due. The Board is responsible for ensuring that the Group has sufficient liquidity to meet its financial liabilities as they fall due without incurring unacceptable losses or risking damage to the Group and does so by monitoring cash flow forecasts and budgets. The Group holds a combination of short and medium-term deposits and a £4.0 million revolving credit facility committed to November 2018. These cash deposits and committed facilities are deemed to be sufficient to meet projected liquidity requirements.
Martin Harrison Chief Financial Officer7 June 2016
Operating cash flow
£3.8m(2015: £0.8m)
(0.8
)
0.8
3.8
Profit before tax
£4.3m(2015: £0.6m) 14 15 16
(4.5
)
0.6
4.3
14 15 16
ANNUAL REPORT AND ACCOUNTS 2016
15

BOARD OF DIRECTORS
A strong leadership team
Philip Holder (aged 67)ChairmanPhilip has over 30 years’ experience in the utilities sector. From 1997 to March 2007, Philip was Managing Director of East Surrey Holdings, the mid-cap water and gas utilities business. Until March 2010, Philip was full time Operational Adviser to The Infrastructure Partnership.
Other appointments
He is also an Operational Adviser to Harwood Private Equity, which manages the Trident Private Equity funds. Philip is also currently a Non-executive Director of Dee Valley Group.
Martin Harrison (aged 46)Chief Financial OfficerMartin has experience gained from a range of senior finance leadership roles from within the infrastructure services and construction products sectors. Prior to joining Fulcrum, he was Divisional Finance Director of Lafarge Tarmac Contracting from 2010 to 2014 with financial responsibility for the UK and Middle East markets. Previously, Martin spent three years with KPMG working on merger and acquisitions transactions and corporate restructuring projects and 11 years with Saint Gobain/BPB plc. Martin is a member of the Institute of Chartered Accountants in England and Wales.
Martin Donnachie (aged 46)Chief Executive OfficerMartin has extensive experience gained from a range of interim leadership roles and, prior to that, 12 years of experience in the house building and construction services sectors. He was Divisional Managing Director of the successful affordable housing division of Rok plc from 2007 until 2010. Previously, he held Managing Director roles at George Wimpey plc, Morris Homes Limited and AEA Technology plc. Martin is a Chartered Accountant and in his early career he held a series of finance roles.
Stephen Gutteridge (aged 61)Non-executive DirectorStephen has over 35 years’ experience in energy and utilities, beginning with Shell in marketing and oil trading. In 1988 he joined Amerada Hess, managing its oil trading and its UK gas businesses. From 1992 to 1997 he was Managing Director of Supply at Seeboard plc. Stephen held Executive and Non-executive positions in Ferguson International, the International Petroleum Exchange and CORGI. He was Chairman of Star Energy, a UK oil and gas storage operator from IPO through to its acquisition by Petronas; Chairman of President Petroleum; a Non-executive Director and Chairman of TQ Group, which was successfully sold to Pearson in 2011 and Chairman of Nighthawk Energy.
Other appointments
He is currently a Non-executive Director of BCA Marketplace.
From left to right:
Paul Dickinson, People Director; Kevin Walpole, Associate Director of Sales;Carly Gilchrist, Head of Commercial & Operations Support; Martin Donnachie, Chief Executive Officer; Martin Harrison, Chief Financial Officer; andIan Foster, Operations Director
EXECUTIVE COMMITTEE
FULCRUM UTILITY SERVICES LIMITED
16
CORPORATE GOVERNANCE

Factoids to be approved
Amongst a number of significant contracts secured in the year, Fulcrum was appointed to deliver gas infrastructure projects at three of the UK’s most prestigious redevelopments – Royal Albert Dock, Chelsea Barracks and Battersea Power Station.
• At Royal Albert Dock, a £0.4m project will see the installation of new gas infrastructure.
• For the Chelsea Barracks project, Fulcrum will design and construct a £0.4m gas infrastructure for a mixed use development, including a new Energy Centre.
• The £0.2m Battersea Power Station contract involves the installation of new gas mains infrastructure to feed an initial phase of the £8.0bn redevelopment.
All three significant gas infrastructures will be adopted, owned and operated by Fulcrum Pipelines after their construction, adding to Fulcrum’s growing asset base.
Fulcrum is supporting housing development in Liverpool by delivering a full multi-utility scheme to over 100 new build properties as part of the regeneration of the area and on behalf of a leading house builder.
The project will see the installation of approximately 1.5km of utility infrastructure, including gas, water and electricity connections to each of the new homes. Once constructed, Fulcrum Pipelines will adopt and own the gas infrastructure feeding the properties.
Multi-utility installation contract for leading house builder
Fulcrum lands three major London infrastructure schemes
Gas adoption
by FulcrumPipelines
106plot housing development
Fullgas, electricity and water infrastructure
Gas adoption
by FulcrumPipelines
17
ANNUAL REPORT AND ACCOUNTS 2016

CORPORATE GOVERNANCE REPORT
Committed to high standards of corporate governanceGovernance structure
The BoardPhilip Holder (Chairman)
Martin Donnachie
Martin Harrison
Stephen Gutteridge
Audit CommitteePhilip Holder (Chairman)
Stephen Gutteridge
Remuneration CommitteeStephen Gutteridge (Chairman)
Philip Holder
Statement by the Directors on compliance with the Code of Best PracticeAs an AIM listed company, Fulcrum Utility Services Limited is not required to comply with the provisions of the UK Corporate Governance Code (“the Combined Code”) that applies to companies with a premium London Stock Exchange listing. However, the Board recognises the importance and value of good corporate governance procedures and accordingly have selected those elements of the Combined Code that they consider relevant and appropriate to the Group, given its size and structure. An overview of the Group’s corporate governance procedures is given opposite.
The BoardThe Group is controlled through a Board of Directors, which at 31 March 2016 comprised a Non-executive Chairman, two Executive Directors and one other Non-executive Director, for the proper management of the Company and the Group. The Chairman is Philip Holder and the Chief Executive Officer is Martin Donnachie.
Of the Non-executive Board members, Philip Holder and Stephen Gutteridge are considered to be independent. The Board operates both formally, through Board and committee meetings, and informally, through regular contact amongst Directors and senior executives. There is a schedule of matters that are specifically referred to the Board for its decision, including approval of interim and annual financial results, setting and monitoring of strategy and examining acquisition possibilities. The Board is supplied with information in a timely manner, in a form and quality appropriate to enable it to discharge its duties.
The Directors can obtain independent professional advice at the Group’s expense in the performance of their duties as Directors.
18
FULCRUM UTILITY SERVICES LIMITEDCORPORATE GOVERNANCE

Board CommitteesThe Board Committees comprise the Audit Committee and the Remuneration Committee.
Audit CommitteeThe Chairman of the Audit Committee is Philip Holder; Stephen Gutteridge is the other Non-executive member. No one other than the Audit Committee’s Chairman and Non-executive member is entitled to be present at a meeting of the Audit Committee but the Group’s external auditors together with the Chief Executive Officer and the Chief Financial Officer are also invited to attend the meetings.
The Audit Committee operates under terms of reference agreed with the Board and meets at least twice a year. The Audit Committee considers the adequacy and effectiveness of the risk management and control systems of the Group. It reviews the scope and results of the external audit, its cost effectiveness and the objectivity of the auditors. It also reviews, prior to publication, the interim results, the preliminary announcement and the annual report and financial statements.
Remuneration CommitteeThe Chairman of the Remuneration Committee is Stephen Gutteridge with Philip Holder as the other Non-executive member. The committee
meets periodically as required and is responsible for overseeing the policy regarding executive remuneration and for approving the remuneration packages for the Group’s Executive Directors and management including all personnel receiving a salary exceeding £100,000 per annum (2015: salary exceeding £75,000). It is also responsible for reviewing incentive schemes for the Group as a whole.
Nominations CommitteeAs the Board is small, there is and will be no separate Nominations Committee and the appointment of new Directors is considered by the Board as a whole.
Shareholder communicationThe Board is committed to maintaining good communication with shareholders. The Executive Directors maintain a regular dialogue with the analysts and institutional investors to discuss the Group’s performance and future prospects.
The Group responds formally to all queries and requests for information from existing and prospective shareholders. In addition, the Group seeks to regularly update shareholders through stock exchange announcements and wider press releases on its activities.
The Annual General Meeting will provide an opportunity for shareholders to address questions to the Chairman and the Board directly. Published information, including regulatory news, is available on the Group’s website, www.fulcrumutilityserviceslimited.co.uk.
Risk management and internal controls The Directors are responsible for the Group’s system of internal control and for reviewing its effectiveness, whilst the role of management is to implement Board policies on risk management and control. It should be recognised that the Group’s system of internal control is designed to manage, rather than eliminate, the risk of failure to achieve the Group’s business objectives and can only provide reasonable, and not absolute, assurance against material misstatement or loss.
The Group operates a series of controls to meet its needs. These controls include, but are not limited to, a clearly defined organisational structure, written policies, a comprehensive annual strategic planning and budgeting process and detailed monthly reporting.
The annual budget is approved by the Board as part of its normal responsibilities. In addition, the budget figures are regularly reforecast to facilitate the Board’s understanding of the Group’s overall position throughout the year and this reforecast is reported to the Board in addition to the reporting of actual results during the year.
The Audit Committee receives reports from management and the external auditors concerning the system of internal control and any material control weaknesses. Any significant risk issues are referred to the Board for consideration.
The Board has considered the need for an internal audit function, but has concluded that, at this stage in the Group’s development, the internal control systems in place are appropriate for the size and complexity of the Group.
Board and committee meeting attendanceThe table below sets out the attendance at Board and committee meetings by presence or by telephone of individual Directors:
FullBoard
AuditCommittee
RemunerationCommittee
Martin Donnachie 11 of 11 2 of 2 8 of 8
Stephen Gutteridge 11 of 11 2 of 2 8 of 8
Philip Holder 11 of 11 2 of 2 6 of 8
Martin Harrison 11 of 11 2 of 2 6 of 8
19
ANNUAL REPORT AND ACCOUNTS 2016

REMUNERATION REPORTFOR THE YEAR ENDED 31 MARCH 2016
Remuneration CommitteeThe Remuneration Committee reviews the performance of each Executive Director and sets the scale and structure of their remuneration and the basis of their service agreement with due regard to the interests of shareholders. To ensure that the Group’s remuneration practices are market competitive, the committee takes advice from various independent sources.
The Board determines the remuneration of each of the Non-executive Directors with the support of external professional advice if required. No Director participates in any discussion regarding his own remuneration.
Policy on Executive Directors’ remunerationThe policy of the Board is to provide an executive remuneration package designed to attract, motivate, reward and retain the Executive Directors. The aim of the Group’s remuneration policy is to ensure that the key Executives are appropriately rewarded for their individual contribution to the Group’s performance, commensurate with their duties and responsibilities.
The Remuneration Committee believes that shareholders’ interests are best served by providing Executives with remuneration packages which have a significant emphasis on performance related pay, through long-term incentive schemes. The Board considers that packages of this nature are consistent with prevailing practice and are necessary to retain and reward Executives of the calibre the Group requires.
The main components of Executive Directors’ remuneration, which can be mirrored with certain senior executives, are basic salary, annual performance related bonus and share options.
Basic annual salaryEach Executive Director’s basic salary is reviewed regularly by the committee. In deciding upon an appropriate level of remuneration, the committee believes that the Group should offer levels of base pay that reflects individual responsibilities compared to similar jobs in comparable companies.
Annual bonus paymentsThe committee establishes the objectives that must be met for an annual cash bonus to be paid. Currently these objectives relate to year-on-year growth in EBITDA and sales order margin.
Share option incentivesThe Group operates Enterprise Management Incentive (EMI) plans, an Employee Shareholder Status (ESS) plan, a Growth Share Scheme (GSS) plan and a SAYE scheme (see note 20). The committee has responsibility for supervising the schemes and the grant of share options under the schemes.
Additional benefitsEach Executive Director receives private medical insurance and life assurance cover, pension contributions and a company car or car allowance. Each Non-executive Director receives life assurance cover from 1 January 2016.
Directors’ interests in share options
EMIEMI
(Unapproved) ESS GSS
Martin Donnachie 3,571,414 428,586 3,567,988 1,473,000
Martin Harrison 3,000,000 – 2,172,719 957,000
Directors’ emolumentsThe remuneration of each of the Directors for the year ended 31 March 2016 is set out as follows:
Salary, feesand bonus
£’000
Otherbenefits
£’000Pension
£’000
2016total
£’000
2015total
£’000
Executive
Martin Donnachie 271 2 12 285 259
Martin Harrison 172 2 8 182 85*
Non-executive
Philip Holder 64 – – 64 60
Stephen Gutteridge 32 – – 32 30
Total 539 4 20 563 434
* Martin Harrison was appointed on 29 September 2014; as such 2015 remuneration represents six months.
20
FULCRUM UTILITY SERVICES LIMITEDCORPORATE GOVERNANCE
GROUP DIRECTORS’ REPORTFOR THE YEAR ENDED 31 MARCH 2016
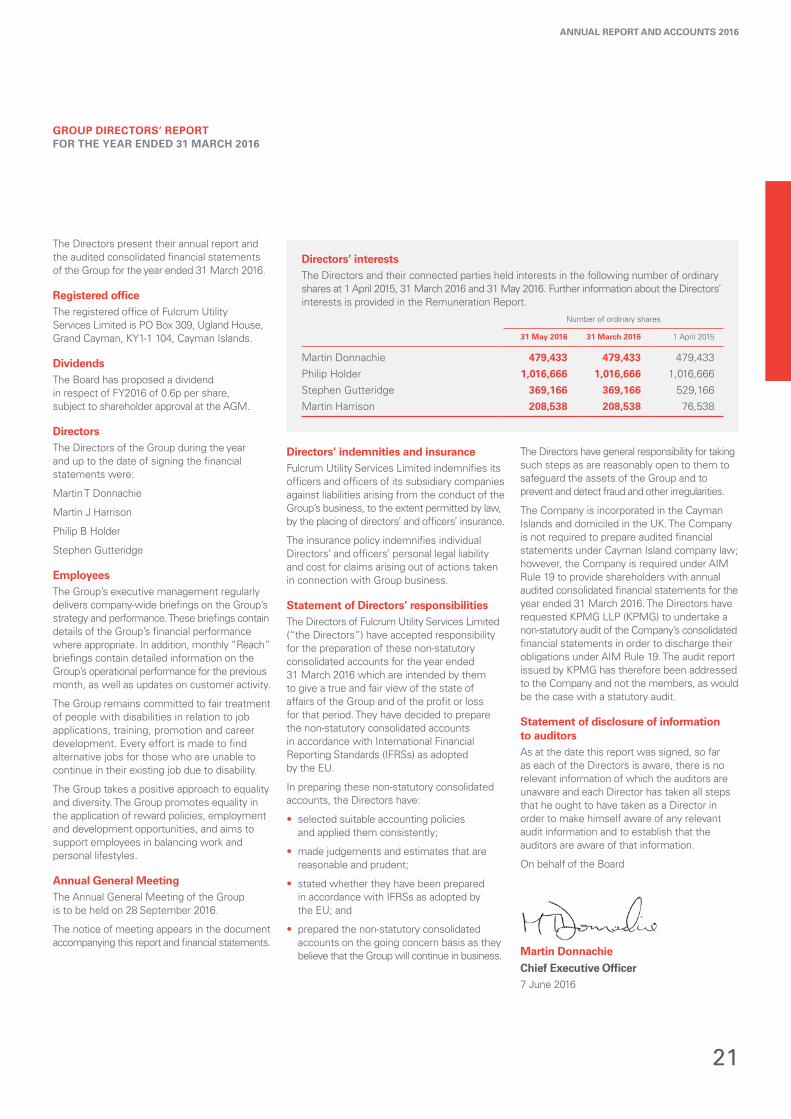
The Directors present their annual report and the audited consolidated financial statements of the Group for the year ended 31 March 2016.
Registered officeThe registered office of Fulcrum Utility Services Limited is PO Box 309, Ugland House, Grand Cayman, KY1-1 104, Cayman Islands.
DividendsThe Board has proposed a dividend in respect of FY2016 of 0.6p per share, subject to shareholder approval at the AGM.
DirectorsThe Directors of the Group during the year and up to the date of signing the financial statements were:
Martin T Donnachie
Martin J Harrison
Philip B Holder
Stephen Gutteridge
EmployeesThe Group’s executive management regularly delivers company-wide briefings on the Group’s strategy and performance. These briefings contain details of the Group’s financial performance where appropriate. In addition, monthly “Reach” briefings contain detailed information on the Group’s operational performance for the previous month, as well as updates on customer activity.
The Group remains committed to fair treatment of people with disabilities in relation to job applications, training, promotion and career development. Every effort is made to find alternative jobs for those who are unable to continue in their existing job due to disability.
The Group takes a positive approach to equality and diversity. The Group promotes equality in the application of reward policies, employment and development opportunities, and aims to support employees in balancing work and personal lifestyles.
Annual General MeetingThe Annual General Meeting of the Group is to be held on 28 September 2016.
The notice of meeting appears in the document accompanying this report and financial statements.
Directors’ indemnities and insuranceFulcrum Utility Services Limited indemnifies its officers and officers of its subsidiary companies against liabilities arising from the conduct of the Group’s business, to the extent permitted by law, by the placing of directors’ and officers’ insurance.
The insurance policy indemnifies individual Directors’ and officers’ personal legal liability and cost for claims arising out of actions taken in connection with Group business.
Statement of Directors’ responsibilitiesThe Directors of Fulcrum Utility Services Limited (“the Directors”) have accepted responsibility for the preparation of these non-statutory consolidated accounts for the year ended 31 March 2016 which are intended by them to give a true and fair view of the state of affairs of the Group and of the profit or loss for that period. They have decided to prepare the non-statutory consolidated accounts in accordance with International Financial Reporting Standards (IFRSs) as adopted by the EU.
In preparing these non-statutory consolidated accounts, the Directors have:
• selected suitable accounting policies and applied them consistently;
• made judgements and estimates that are reasonable and prudent;
• stated whether they have been prepared in accordance with IFRSs as adopted by the EU; and
• prepared the non-statutory consolidated accounts on the going concern basis as they believe that the Group will continue in business.
The Directors have general responsibility for taking such steps as are reasonably open to them to safeguard the assets of the Group and to prevent and detect fraud and other irregularities.
The Company is incorporated in the Cayman Islands and domiciled in the UK. The Company is not required to prepare audited financial statements under Cayman Island company law; however, the Company is required under AIM Rule 19 to provide shareholders with annual audited consolidated financial statements for the year ended 31 March 2016. The Directors have requested KPMG LLP (KPMG) to undertake a non-statutory audit of the Company’s consolidated financial statements in order to discharge their obligations under AIM Rule 19. The audit report issued by KPMG has therefore been addressed to the Company and not the members, as would be the case with a statutory audit.
Statement of disclosure of information to auditorsAs at the date this report was signed, so far as each of the Directors is aware, there is no relevant information of which the auditors are unaware and each Director has taken all steps that he ought to have taken as a Director in order to make himself aware of any relevant audit information and to establish that the auditors are aware of that information.
On behalf of the Board
Martin DonnachieChief Executive Officer7 June 2016
Directors’ interestsThe Directors and their connected parties held interests in the following number of ordinary shares at 1 April 2015, 31 March 2016 and 31 May 2016. Further information about the Directors’ interests is provided in the Remuneration Report.
Number of ordinary shares
31 May 2016 31 March 2016 1 April 2015
Martin Donnachie 479,433 479,433 479,433
Philip Holder 1,016,666 1,016,666 1,016,666
Stephen Gutteridge 369,166 369,166 529,166
Martin Harrison 208,538 208,538 76,538
21
ANNUAL REPORT AND ACCOUNTS 2016

PRINCIPAL RISKS AND UNCERTAINTIES
The Board considers risk assessment, identification of mitigating actions and internal control to be fundamental to achieving the Group’s strategic objectives. The Corporate Governance Report on pages 18 and 19 describes the systems and processes through which the Directors manage and mitigate risks. The Board recognises that the nature and scope of the risks can change and so regularly reviews the risks faced by the Group as well as the systems and processes in place to mitigate them. The principal risks to achieving the Group’s objectives are set out below:
Description Mitigating actions Risk change
Growth and strategy execution
It is possible that the growth of the business could take longer than expected, or that the anticipated improvements in financial performance may not be realised in full.
To mitigate this risk, the Group operates comprehensive annual strategic planning and budgeting processes together with regular financial reforecasts. Detailed monthly reporting and analysis of actual performance against the business plan ensures that corrective actions can be taken on a timely basis if necessary.
No change
Dependence on key executives and personnel
In common with many smaller companies, the Group’s future success is substantially dependent upon recruiting, retaining and motivating key executives with relevant industry experience.
The Group has put in place suitable executive and senior management incentive schemes linked to the successful delivery of our strategy. Appropriate staff development programmes are in place to assess, manage and develop the leadership skills of all staff throughout the organisation. In addition, a regular talent management/succession planning exercise is completed for the key members of our teams.
No change
Risks relating to operating in a competitive market
The business strategy relies fundamentally on the ability to increase revenues and ensuring that the cost base is kept under control. However, the markets in which the Group operates are competitive. The Group faces significant competition, including from organisations that may be larger and/or have greater capital resources.
The Group cannot predict the pricing or promotional activities of its competitors or their effect on its ability to market and sell its services. In order to ensure that its services remain competitive, the Group may be required to reduce its prices as a result of price reductions by its competitors. This could adversely affect the Group’s results.
There are no assurances that the strength of the Group’s competitors will not improve or that the Group will win any additional market share from its competitors, or maintain its existing market share. Existing and/or increased competition could adversely affect the Group’s market share and materially affect its business, financial condition and operating results.
These risks are managed through the corporate planning and review processes as outlined in the growth and strategy execution section above.
No change
Risks relating to the gas connections market
Operating in the gas industry carries with it inherent risks, such as reliance on ageing infrastructure, potential injury to, or loss of, human life or equipment, as well as the risk of downtime or low productivity caused by weather interruptions or equipment failures. Losses could result from litigation or interruption of the Group’s business should these risks materialise.
There are also associated regulatory risks relating to the Group’s reliance on a number of different licences which it requires in order to carry out the design and project management of connections to gas pipelines. In addition, Fulcrum Pipelines Limited is specifically licensed by Ofgem as an Independent Gas Transporter (IGT). This brings with it the risk that the regulatory environment could change, which may have a direct and significant impact on the Group’s regulated activities.
The Group seeks to reduce the risk of losses arising from these circumstances through careful planning, robust operational guidelines and the sharing of risk with client and supplier organisations and by putting in place suitable insurance arrangements.
No change
22
FULCRUM UTILITY SERVICES LIMITEDCORPORATE GOVERNANCE

Description Mitigating actions Risk change
Reliance on key customersA relatively small number of long-term commercial contracts exist between the Group and its customers.
The relationship between the Group and many of its customers is not regulated by a contract. Instead, the majority of the Group’s business with customers is based on purchase orders and an acceptance by customers of the Group’s standard terms and conditions.
The drive for customer service excellence will help to promote repeat customer revenues, further complemented by our established national position with a broad service offering and in-house design and build expertise.
No change
Reliance on significant suppliers
The physical works required to install gas connections managed by the Group have historically been carried out by an alliance subcontract partner on behalf of the Group. The move to the in-house management of operational delivery from 1 April 2015 has eliminated this reliance on the alliance partner. The Group does continue to rely upon one nominated subcontractor for the operational delivery in the South of England and as such the Group is exposed to the risk that the financial performance of this supplier may fluctuate or deteriorate in the future and that this could have an adverse impact on the operational or financial performance of the Group.
In order to manage this risk, the Group will regularly and jointly review the performance of the subcontractor against the contract and will implement a suite of defined key performance indicators (KPIs).
No change
Continuity of financing facilities
In November 2015, the business entered into a revolving credit facility which replaced the asset backed financing agreement with Lloyds Bank plc. At the year end, this facility was not utilised.
Sustained improvement in financial performance, the provision of regular management information and maintaining good working relationships with the Group’s bankers will remain important in the future.
No change
Changing mix of sales
A changing mix of new contract sales, moving away from payments in advance toward credit terms, may place a strain on working capital as the volume of credit sales increases.
In granting commercial credit terms, careful attention is paid to the timing of cash receipts and payments over the period of contract delivery. Where necessary, a deposit is requested from customers prior to commencing work and invoicing milestones with customers are matched where possible to the invoicing patterns with contractors.
No change
Management of financial resources including liquidity risk and capital risk management
Disclosure of all the treasury risks can be found in note 25 to the financial statements.
No change
23
ANNUAL REPORT AND ACCOUNTS 2016

INDEPENDENT AUDITORS’ REPORT TO FULCRUM UTILITY SERVICES LIMITED
We have audited the non-statutory consolidated accounts of Fulcrum Utility Services Limited for the year ended 31 March 2016 set out on pages 25 to 44. These non-statutory consolidated accounts have been prepared for the reasons set out in note 1 to the non-statutory consolidated accounts and on the basis of the financial reporting framework of International Financial Reporting Standards (IFRSs) as adopted by the EU.
Our report has been prepared for the Group solely in connection with the preparation by the Directors of non-statutory consolidated financial statements prepared to support compliance with the AIM Rules for Companies (“AIM Rules”). It has been released to the Group on the basis that our report shall not be copied, referred to or disclosed, in whole (save for the Group’s own internal purposes) or in part, without our prior written consent.
Our report was designed to meet the agreed requirements of the Group determined by the Group’s needs at the time. Our report should not therefore be regarded as suitable to be used or relied on by any party wishing to acquire rights against us other than the Group for any purpose or in any context. Any party other than the Group who obtains access to our report or a copy and chooses to rely on our report (or any part of it) will do so at its own risk. To the fullest extent permitted by law, KPMG LLP will accept no responsibility or liability in respect of our report to any other party.
Respective responsibilities of directors and auditor As explained more fully in the Directors’ Responsibilities Statement set out on page 21, the directors are responsible for the preparation of the non-statutory consolidated accounts, which are intended by them to give a true and fair view. Our responsibility is to audit, and express an opinion on, the non-statutory accounts in accordance with the terms of our engagement letter dated 30 November 2015 and International Standards on Auditing (UK and Ireland). Those standards require us to comply with the Auditing Practices Board’s Ethical Standards for Auditors.
Scope of the audit of the non-statutory accounts An audit involves obtaining evidence about the amounts and disclosures in the non-statutory accounts sufficient to give reasonable assurance that the non-statutory accounts are free from material misstatement, whether caused by fraud or error. This includes an assessment of: whether the accounting policies are appropriate to the Group and Group’s circumstances and have been consistently applied and adequately disclosed; the reasonableness of significant accounting estimates made by the Directors; and the overall presentation of the non-statutory accounts.
In addition we read all the financial and non-financial information in the annual report to identify material inconsistencies with the audited non-statutory accounts and to identify any information that is apparently materially incorrect based on, or materially inconsistent with, the knowledge acquired by us in the course of performing the audit. If we become aware of any apparent material misstatements or inconsistencies we consider the implications for our report.
Opinion on non-statutory accounts In our opinion the non-statutory accounts:
• give a true and fair view of the state of the Group’s affairs as at 31 March 2016 and of its profit for the year then ended; and
• have been properly prepared in accordance with IFRSs as adopted by the EU.
David Morrittfor and on behalf of KPMG LLPChartered Accountants1 Sovereign Square, Sovereign Street, Leeds, LS1 4DA7 June 2016
24
FULCRUM UTILITY SERVICES LIMITEDFINANCIAL STATEMENTS

CONSOLIDATED STATEMENT OF COMPREHENSIVE INCOMEFOR THE YEAR ENDED 31 MARCH 2016
Notes
Year ended 31 March
2016£’000
Year ended 31 March
2015£’000
Revenue 3 34,505 33,739
Cost of sales (21,520) (24,009)
Gross profit 12,985 9,730
Administrative expenses (8,748) (9,081)
Operating profit 5 4,237 649
Analysed as:
EBITDA before share based payments and exceptional items 5,301 2,235
Equity-settled share based payment charges 20 (314) (74)
Exceptional items 4 (4) (500)
Depreciation and amortisation 10,11 (746) (1,012)
4,237 649
Finance income 31 6
Finance expense (10) (49)
Profit before taxation 4,258 606
Taxation 7 476 2,196
Profit for the period attributable to equity holders of the parent 4,734 2,802
Other comprehensive income
Items that will never be reclassified to profit:
Revaluation of property, plant and equipment 23 694 –
Deferred tax on items that will never be reclassified to profit or loss 7 (64) –
Total comprehensive income for the year 5,364 2,802
Profit per share attributable to the owners of the business
Basic 9 3.1p 1.8p
Diluted 9 2.7p 1.6p
25
ANNUAL REPORT AND ACCOUNTS 2016

CONSOLIDATED STATEMENT OF CHANGES IN EQUITY
Notes
Sharecapital£’000
Sharepremium
£’000
Revaluationreserve
£’000
Retainedearnings
£’000
Totalequity£’000
Balance at 1 April 2014 154 16,182 2,449 (20,569) (1,784)
Profit for the year – – – 2,802 2,802
Transactions with equity shareholders
Equity-settled share based payment 20 – – – 74 74
Balance at 31 March 2015 154 16,182 2,449 (17,693) 1,092
Profit of the year 24 – – – 4,734 4,734
Revaluation surplus 23 – – 708 – 708
Revaluation reserve transfer 23 – – (14) 14 –
Deferred tax liability 7,23 – – (64) – (64)
Transactions with equity shareholders
Equity-settled share based payment 20 – – – 314 314
Dividends 8,22 – (1,087) – – (1,087)
Issue of new shares 21,22 2 138 – – 140
Balance at 31 March 2016 156 15,233 3,079 (12,631) 5,837
26
FULCRUM UTILITY SERVICES LIMITEDFINANCIAL STATEMENTS

CONSOLIDATED BALANCE SHEET
Notes
31 March2016
£’000
31 March2015
£’000
Non-current assets
Property, plant and equipment 10 9,480 7,508
Intangible assets 11 2,597 2,837
Deferred tax assets 7 3,210 2,734
15,287 13,079
Current assets
Inventories 12 1,403 1,289
Trade and other receivables 13 6,663 3,840
Cash and cash equivalents 14,17 8,323 5,746
16,389 10,875
Total assets 31,676 23,954
Current liabilities
Trade and other payables 15 (25,065) (21,847)
Borrowings 16 – (168)
Provisions 18 (98) (235)
(25,163) (22,250)
Non-current liabilities
Deferred tax liabilities 7 (676) (612)
(676) (612)
Total liabilities (25,839) (22,862)
Net assets 5,837 1,092
Equity
Share capital 21 156 154
Share premium 22 15,233 16,182
Revaluation reserve 23 3,079 2,449
Retained earnings 24 (12,631) (17,693)
Total equity 5,837 1,092
The financial statements were approved by the Board of Directors on 7 June 2016 and were signed on its behalf by:
Martin HarrisonChief Financial Officer
27
ANNUAL REPORT AND ACCOUNTS 2016

CONSOLIDATED CASH FLOW STATEMENT
Notes
Year ended 31 March
2016£’000
RestatedYear ended
31 March2015
£’000
Cash flows from operating activities
Profit before tax for the year 4,258 606
Adjustments for:
Depreciation 10 447 490
Amortisation of intangible assets 11 299 522
(Profit)/loss on disposal of property, plant and equipment 5 (1) 9
Capitalisation of pipeline assets 10 (1,886) (1,622)
Finance income (31) (6)
Finance expense 10 49
Equity-settled share based payment charges 20 314 74
Exceptional items 4 4 500
(Increase)/decrease in trade and other receivables 13 (2,823) 1,506
(Increase)/decrease in inventories 12 (114) 685
Increase/(decrease) in trade and other payables 15 3,448 (398)
Decrease in provisions for exceptional items 18 (137) (1,643)
Cash inflow from operating activities 3,788 772
Interest received 31 6
Interest paid (7) (46)
Net cash inflow from operating activities 3,812 732
Cash flows from investing activities
Additions to tangibles 10 (56) (32)
Additions to intangibles 11 (59) –
Net cash outflow from investing activities (115) (32)
Cash flows from financing activities
Dividends paid 8 (1,087) –
Proceeds from issue of share capital 22 138 –
Repayment of finance lease liabilities (171) (280)
Net cash outflow from financing activities (1,120) (280)
Increase in net cash and cash equivalents 2,577 420
Cash and cash equivalents at 1 April 2015 5,746 5,326
Cash and cash equivalents at 31 March 2016 14,17 8,323 5,746
The prior year figures have been restated to reclassify pipeline additions as a non-cash movement, as the addition represents the valuation attributed to the asset as adopted by Fulcrum Pipelines.
28
FULCRUM UTILITY SERVICES LIMITEDFINANCIAL STATEMENTS

NOTES TO THE CONSOLIDATED FINANCIAL STATEMENTS
1. Accounting policiesThe principal accounting policies adopted in the preparation of these financial statements are set out below.
Reporting entityFulcrum Utility Services Limited (“the Company”) is incorporated in the Cayman Islands and domiciled in the UK. The ordinary shares are traded on AIM on the London Stock Exchange. The consolidated financial statements of the Company for the year ended 31 March 2016 comprise the Company and its subsidiaries (together referred to as “the Group”).
Statement of complianceUnder Cayman Island company law, the Company is not required to prepare audited financial statements; however, the Company is required under AIM Rule 19 to provide shareholders with audited consolidated financial statements for the year ended 31 March 2016. There is no requirement to provide parent company information so this has not been presented.
The financial statements have been prepared in accordance with International Financial Reporting Standards (IFRS) as endorsed by the EU and International Financial Reporting Interpretations Committee (IFRIC) interpretations.
Basis of preparationThe financial statements have been prepared on the historical cost basis except for the revaluation of certain non-current assets. Historical cost is generally based on the fair value of the consideration given in exchange for assets.
Going concernThe Group’s business activities, together with the factors likely to affect future development, performance and position, are set out in the Strategic Report on pages 8 to 11. The financial position of the Group, its cash flows, liquidity position and borrowing facilities are described in the Financial Report on pages 14 and 15. In addition, note 25 to the financial statements includes the Group’s processes for managing its capital and its exposure to credit and liquidity risks.
As at 31 March 2016 the Group had net assets of £5.8 million (2015: £1.1 million), including cash of £8.3 million (2015: £5.7 million) as set out in the consolidated balance sheet on page 27 and an unused revolving credit facility of £4.0 million (2015: £4.0 million), and so would be in a position to pay its obligations as they arise. In the year ended 31 March 2016, the Group generated a profit of £4.7 million and had net cash inflows of £2.6 million.
The Group’s forecasts and projections, after taking account of sensitivity analysis of changes in trading performance and corresponding mitigating actions, show that the Group has adequate cash resources for the foreseeable future. As a consequence, the Directors have a reasonable expectation that the Group has adequate resources to fund its operations for the foreseeable future. Accordingly, they continue to adopt the going concern basis in preparing the Group financial statements.
Basis of consolidationSubsidiaries are entities controlled by the Company. The Group controls an entity when exposed to, or has rights to, variable returns from its involvement with the entity and has the ability to affect those returns through its power over the entity. In assessing control the Group takes into consideration potential voting rights that are currently exercisable. The acquisition date is the date on which control is transferred to the acquirer. The financial statements of subsidiaries are included in the consolidated financial statements from the date that control commences until the date that control ceases. All Intra-group transactions, balances and expenses are eliminated on consolidation.
Accounting estimates and judgementsThe preparation of financial statements in conformity with IFRS requires management to make judgements, estimates and assumptions that affect the application of accounting policies and the reported amounts of assets, liabilities, income and expenses. Actual results could differ from these estimates. Estimates and underlying assumptions are reviewed on an ongoing basis. Revisions to accounting estimates are recognised in the period in which the estimates are revised and in any future periods affected.
Information about significant areas of estimation uncertainty in applying accounting policies that have the most significant effect on the amounts recognised in the consolidated financial statements is included in the following areas:
Goodwill
The Group tests annually whether tangible and intangible fixed assets have suffered any impairment, based on discounted future cash flows of the assets and the total business of the Group. These calculations require the use of estimates, as detailed in note 11.
Pipeline assets
Recognition and valuation of the pipeline assets including whether any of the assets have suffered impairment.
Revenue recognition
For longer projects the stage of completion of the works is assessed when considering recognition of revenue. Use of this percentage completion method requires the Group to estimate the services performed to date as a proportion of the total services to be performed.
Share based payments
Valuation of share based payment.
29
ANNUAL REPORT AND ACCOUNTS 2016

NOTES TO THE CONSOLIDATED FINANCIAL STATEMENTS continued
1. Accounting policies continuedProperty, plant and equipmentProperty, plant and equipment excluding pipelines are stated at cost less accumulated depreciation and accumulated impairment losses.
Pipeline assets are initially recognised at fair value in accordance with IFRIC18. Assets are revalued annually with changes in the fair value accounted through the revaluation reserve.
Leases in which the Group assumes substantially all the risks and rewards of ownership of the leased asset are classified as finance leases. Where land and buildings are held under leases the accounting treatment of the land is considered separately from that of the buildings. Leased assets acquired by way of finance lease are stated at an amount equal to the lower of their fair value and the present value of the minimum lease payments at inception of the lease, less accumulated depreciation and less accumulated impairment losses. Payments made under operating leases are recognised in profit or loss on a straight-line basis over the term of the lease. Minimum lease payments made under finance leases are apportioned between the finance expense and the reduction of the outstanding liability. The finance expense is allocated to each period so as to produce a constant periodic rate of interest on the remaining balance of the liability.
Depreciation is recognised on a straight-line basis over the estimated useful lives of each part of an item of property, plant and equipment. Leased assets are depreciated over the shorter of the lease term and their useful lives unless it is reasonably certain that the Group will obtain ownership by the end of the lease term. The estimated useful lives are as follows:
Pipelines 20–40 years
Fixtures and fittings 2 and 5 years
Computer equipment 3 and 5 years
Depreciation methods, useful lives and residual values are reviewed at each balance sheet date.
Business combinationsAll business combinations are accounted for by applying the acquisition method. Business combinations are accounted for using the acquisition method as at the acquisition date, which is the date on which control is transferred to the Group.
Acquisitions on or after 1 January 2010
For acquisitions on or after 1 January 2010, the Group measures goodwill at the acquisition date as:
• the fair value of the consideration transferred; plus
• the recognised amount of any non-controlling interests in the acquiree; plus
• the fair value of the existing equity interest in the acquiree; less
• the net recognised amount (generally fair value) of the identifiable assets acquired and liabilities assumed.
When the excess is negative, a bargain purchase gain is recognised immediately in profit or loss. Costs related to the acquisition, other than those associated with the issue of debt or equity securities, are expensed as incurred.
GoodwillGoodwill is stated at cost less any accumulated impairment losses. Goodwill is allocated to cash-generating units and is not amortised but is tested annually for impairment. In respect of equity-accounted investees, the carrying amount of goodwill is included in the carrying amount of the investment in the investee.
Other intangible assets Other intangible assets that are acquired by the Group are stated at cost less accumulated amortisation and accumulated impairment losses.
Amortisation of software is recognised in the income statement on a straight-line basis over the estimated useful life of five years.
30
FULCRUM UTILITY SERVICES LIMITEDFINANCIAL STATEMENTS

1. Accounting policies continuedImpairmentFinancial assets (including receivables)
A financial asset not carried at fair value through profit or loss is assessed at each reporting date to determine whether there is objective evidence that it is impaired. A financial asset is impaired if objective evidence indicates that a loss event has occurred after the initial recognition of the asset, and that the loss event had a negative effect on the estimated future cash flows of that asset that can be estimated reliably.
An impairment loss in respect of a financial asset measured at amortised cost is calculated as the difference between its carrying amount and the present value of the estimated future cash flows discounted at the asset’s original effective interest rate. Interest on the impaired asset continues to be recognised through the unwinding of the discount. When a subsequent event causes the amount of impairment loss to decrease, the decrease in impairment loss is reversed through profit or loss.
Non-financial assets
The carrying amounts of the Group’s non-financial assets, other than inventories and deferred tax assets, are reviewed at each reporting date to determine whether there is any indication of impairment. If any such indication exists, then the asset’s recoverable amount is estimated. For goodwill, and intangible assets that have indefinite useful lives or that are not yet available for use, the recoverable amount is estimated each year at the same time.
The recoverable amount of an asset or cash-generating unit is the greater of its value in use and its fair value less costs to sell. In assessing value in use, the estimated future cash flows are discounted to their present value using a pre-tax discount rate that reflects current market assessments of the time value of money and the risks specific to the asset. For the purpose of impairment testing, assets that cannot be tested individually are grouped together into the smallest group of assets that generates cash inflows from continuing use that are largely independent of the cash inflows of other assets or groups of assets (“the cash-generating unit”). The goodwill acquired in a business combination, for the purpose of impairment testing, is allocated to cash-generating units, or CGU. Subject to an operating segment ceiling test, for the purposes of goodwill impairment testing, CGUs to which goodwill has been allocated are aggregated so that the level at which impairment is tested reflects the lowest level at which goodwill is monitored for internal reporting purposes. Goodwill acquired in a business combination is allocated to groups of CGUs that are expected to benefit from the synergies of the combination.
An impairment loss is recognised if the carrying amount of an asset or its CGU exceeds its estimated recoverable amount. Impairment losses are recognised in profit or loss. Impairment losses recognised in respect of CGUs are allocated first to reduce the carrying amount of any goodwill allocated to the units, and then to reduce the carrying amounts of the other assets in the unit (or group of units) on a pro-rata basis.
An impairment loss in respect of goodwill is not reversed. In respect of other assets, impairment losses recognised in prior periods are assessed at each reporting date for any indications that the loss has decreased or no longer exists. An impairment loss is reversed if there has been a change in the estimates used to determine the recoverable amount. An impairment loss is reversed only to the extent that the asset’s carrying amount does not exceed the carrying amount that would have been determined, net of depreciation or amortisation, if no impairment loss had been recognised.
InventoriesWork in progress is valued at the lower of cost and net realisable value. Net realisable value is the estimated selling price in the ordinary course of business less applicable costs to complete and variable selling expenses.
Employee benefitsPension plans
The Group operates a defined contribution pension plan for the benefit of its employees under which the company pays a fixed contribution into a separate entity and will have no legal or constructive obligation to pay further amounts. Contributions are recognised in the income statement as they become payable in accordance with the rules of the scheme.
Short-term benefits
Short-term employee benefit obligations are measured on an undiscounted basis and are expensed as the related service is provided. A liability is recognised for the amount expected to be paid under short-term cash bonus or profit-sharing plans if the Group has a present legal or constructive obligation to pay this amount as a result of past service provided by the employee and the obligation can be estimated reliably.
31
ANNUAL REPORT AND ACCOUNTS 2016

NOTES TO THE CONSOLIDATED FINANCIAL STATEMENTS continued
1. Accounting policies continuedEmployee benefits continuedShare based payment transactions
Share based payment arrangements in which the Group receives goods or services as consideration for its own equity instruments are accounted for as equity-settled share based payment transactions, regardless of how the equity instruments are obtained by the Group.
The grant date fair value of share based payment awards granted to employees is recognised as an employee expense, with a corresponding increase in equity, over the period that the employees become unconditionally entitled to the awards. The fair value of the options granted is measured using an option valuation model, taking into account the terms and conditions upon which the options were granted. The amount recognised as an expense is adjusted to reflect the actual number of awards for which the related service and non-market vesting conditions are expected to be met, such that the amount ultimately recognised as an expense is based on the number of awards that do meet the related service and non-market performance conditions at the vesting date. For share based payment awards with non-vesting conditions, the grant date fair value of the share based payment is measured to reflect such conditions and there is no true-up for differences between expected and actual outcomes.
No cash-settled share based payment awards have been granted to employees.
ProvisionsA provision is recognised in the balance sheet when the Group has a present legal or constructive obligation as a result of a past event that can be reliably measured and it is probable that an outflow of economic benefits will be required to settle the obligation.
RevenueUtility infrastructure and gas connection activities are recognised as “services revenue”. The majority of projects are completed in a short timeframe and, as such, revenue is recognised on project completion. For longer projects, where the outcome of a contract can be estimated reliably, revenue and costs are recognised by reference to the stage of completion of the contract activity at the reporting date. This is normally measured by the proportion that contracts costs incurred for work performed to date bear to the estimated total contract costs, except where this would not be representative of the stage of completion. Variations in contract work, claims and incentive payments are recognised only to the extent that the amount can be measured reliably and its receipt is considered probable. Where the outcome of a contract cannot be estimated reliably, contract revenue is recognised to the extent of contract costs incurred where it is probable they will be recoverable. When it is probable that total contract costs will exceed total contract revenue, the total expected loss is recognised as an expense immediately. Services revenue is recognised excluding VAT and other indirect taxes. An accrual is made for services revenue in respect of work completed where invoices are yet to be generated. When payment is received in advance of the provision of services, these receipts are recorded as deferred income.
Conveyance of gas is recognised as “transportation revenue” from the date the meter is connected and made available for use and is based on gas volumes.
Exceptional itemsExceptional items are those that in management’s judgement need to be disclosed separately by virtue of their size or incidence in order to provide greater visibility of the underlying results of the business and which management believes provide additional meaningful information in relation to ongoing operational performance.
TaxationTax on the profit or loss for the year comprises current and deferred tax. Tax is recognised in the income statement except to the extent that it relates to items recognised directly in equity, in which case it is recognised in equity.
Current tax is the expected tax payable or receivable on the taxable income or loss for the year, using tax rates enacted or substantively enacted at the balance sheet date, and any adjustment to tax payable in respect of previous years.
Deferred tax is provided on temporary differences between the carrying amounts of assets and liabilities for financial reporting purposes and the amounts used for taxation purposes. The following temporary differences are not provided for: the initial recognition of goodwill; the initial recognition of assets or liabilities that affect neither accounting nor taxable profit other than in a business combination; and differences relating to investments in subsidiaries to the extent that they will probably not reverse in the foreseeable future. The amount of deferred tax provided is based on the expected manner of realisation or settlement of the carrying amount of assets and liabilities, using tax rates enacted or substantively enacted at the balance sheet date. A deferred tax asset is recognised only to the extent that it is probable that future taxable profits will be available against which the temporary difference can be utilised.
32
FULCRUM UTILITY SERVICES LIMITEDFINANCIAL STATEMENTS

1. Accounting policies continuedClassification of financial instruments issued by the GroupFollowing the adoption of IAS 32, financial instruments issued by the Group are treated as equity only to the extent that they meet the following two conditions:
• they include no contractual obligations upon the Group to deliver cash or other financial assets or to exchange financial assets or financial liabilities with another party under conditions that are potentially unfavourable to the Group; and
• where the instrument will or may be settled in the Company’s own equity instruments, it is either a non-derivative that includes no obligation to deliver a variable number of the Company’s own equity instruments or is a derivative that will be settled by the Company’s exchanging a fixed amount of cash or other financial assets for a fixed number of its own equity instruments.
To the extent that this definition is not met, the proceeds of issue are classified as a financial liability. Where the instrument so classified takes the legal form of the Company’s own shares, the amounts presented in these financial statements for called-up share capital and share premium account exclude amounts in relation to those shares.
Non-derivative financial instrumentsNon-derivative financial instruments comprise investments in equity and debt securities, trade and other receivables, cash and cash equivalents, loans and borrowings, and trade and other payables.
Trade and other receivablesTrade and other receivables are recognised initially at fair value. Subsequent to initial recognition they are measured at amortised cost using the effective interest method, less any impairment losses.
Trade and other payablesTrade and other payables are recognised initially at fair value. Subsequent to initial recognition they are measured at amortised cost using the effective interest method.
Cash and cash equivalentsCash and cash equivalents comprise cash balances and call deposits. Bank overdrafts that are repayable on demand and form an integral part of the Group’s cash management are included as a component of cash and cash equivalents for the purpose only of the cash flow statement.
Interest-bearing borrowingsInterest-bearing borrowings are recognised initially at fair value less attributable transaction costs. Subsequent to initial recognition, interest-bearing borrowings are stated at amortised cost using the effective interest method, less any impairment losses.
Changes in accounting policy and disclosuresNew standards, amendments and interpretations that are in issue but not yet effective
The following adopted IFRSs have been issued but have not been applied by the Group in these financial statements. Their adoption is not expected to have a material effect on the financial statements unless otherwise indicated.
• IFRS 9: Financial Instruments (effective date 1 January 2018)
• IFRS 14: Regulatory Deferral Accounts (effective date 1 January 2016)
• IFRS 15: Revenue from Contract with Customers (effective date 1 January 2017)
• IFRS 16: Leases (effective date 1 January 2019)
• Annual Improvements to IFRSs – 2012–2014 Cycle (effective date 1 January 2016)
The adoption of IFRS 15 and IFRS 16 may have an impact on the financial statements when introduced, however, a detailed analysis of the effect is not yet possible. The adoption of other standards is not expected to have a material effect on the financial statements.
33
ANNUAL REPORT AND ACCOUNTS 2016

NOTES TO THE CONSOLIDATED FINANCIAL STATEMENTS continued
2. Operating segmentsThe Board has been identified as the Chief Operating Decision Maker (CODM) as defined under IFRS 8: Operating Segments. The Directors consider there to be two operating segments, infrastructure services and pipelines. Fulcrum’s Infrastructure Services provides utility infrastructure and connections services and the pipeline business comprises both the ownership of gas infrastructure assets and the safe and efficient conveyance of gas through its gas transportation networks. Gas transportation services are provided under the IGT licence granted from Ofgem during June 2007.
The information provided to the Board includes management accounts comprising operating profit before exceptional items for each segment and other financial and non-financial information used to manage the business on a consolidated basis.
Year ended 31 March 2016 Year ended 31 March 2015
InfrastructureServices
£’000Pipelines
£’000Total Group
£’000
InfrastructureServices
£’000Pipelines
£’000Total Group
£’000
Reportable segment revenue 33,445 1,060 34,505 32,901 838 33,739
Underlying EBITDA 4,829 472 5,301 1,930 305 2,235
Share based payment charge (314) – (314) (74) – (74)
Depreciation and amortisation (522) (224) (746) (777) (235) (1,012)
Reportable segment operating profit before exceptional items 3,993 248 4,241 1,079 70 1,149
Exceptional items (4) – (4) (500) – (500)
Reporting segment operating profit 3,989 248 4,237 579 70 649
Finance income 25 6 31 4 2 6
Finance expense (10) – (10) (49) – (49)
Profit before tax 4,004 254 4,258 534 72 606
The Group derives all of its revenue from the UK and all of the Group’s customers are based in the UK. Revenues from the largest customer of the Group’s Infrastructure Services segment represent £6.4 million or 18.7% (2015: £6.0 million or 17.7%) of the Group’s total revenues for the period. In addition, the Speyside distillery project contributed £4.0 million of revenue this year.
3. RevenueYear ended
31 March2016
£’000
Year ended 31 March
2015£’000
Services revenue 33,445 32,901
Transportation revenue 1,060 838
Total revenue 34,505 33,739
4. Exceptional itemsYear ended
31 March2016
£’000
Year ended 31 March
2015£’000
Relocation and property costs (122) (402)
Restructuring costs and provisions 126 902
4 500
Relocation and property costs arose as a result of a reassessment of dilapidation costs associated with moving the Group’s head office from Rotherham to Sheffield in 2011.
Restructuring costs relate to employee and other costs associated with changing the operating model.
34
FULCRUM UTILITY SERVICES LIMITEDFINANCIAL STATEMENTS

5. Operating profitIncluded in operating profit are the following charges:
Year ended 31 March
2016£’000
Year ended 31 March
2015£’000
Amortisation of intangible assets 299 522
Depreciation of property, plant and equipment: owned 263 304
Depreciation of property, plant and equipment: leased 172 186
Operating leases – plant and machinery 689 250
Operating leases – land and buildings 208 173
(Profit)/loss on disposal of property, plant and equipment (1) 9
Amounts receivable by the auditors, KPMG LLP, and their associates in respect of:
Auditors’ remuneration:
Audit of the Group financial statements 46 21
Amounts receivable by auditors and their associates in respect of:
– Audit of financial statements of subsidiaries of the Company 14 34
– Taxation compliance services 10 13
– Other tax advisory services 8 –
– Other services pursuant to legislation – 16
6. Staff numbers and costsYear ended
31 March2016
£’000
Year ended31 March
2015£’000
Wages and salaries 8,766 4,627
Social security costs 840 531
Other pension costs 269 304
Share based payments 314 74
10,189 5,536
Payroll costs set out above exclude staff severance costs resulting from the Group’s strategy to realign its cost base. These costs have been treated as exceptional and are disclosed in note 4.
The average monthly number of persons employed by the Group (including Directors) during the period, analysed by category, was as follows:
Number of employees 2016 2015
Operational 99 12Support 97 117
196 129
Details of the remuneration, share options and pension entitlement of the Directors are included in the Remuneration Report on pages 20 and 21.
35
ANNUAL REPORT AND ACCOUNTS 2016

NOTES TO THE CONSOLIDATED FINANCIAL STATEMENTS continued
7. TaxationYear ended
31 March2016
£’000
Year ended 31 March
2015£’000
Current tax – –Deferred tax 476 2,196
Total tax credit 476 2,196
Deferred tax has been recognised in respect of tax losses carried forward that are expected to be utilised against future taxable profits. Reductions in the UK corporation tax rate from 23% to 21% (effective from 1 April 2014) and 20% (effective from 1 April 2015) were substantively enacted on 2 July 2013. Further reductions to 19% (effective from 1 April 2017) and to 18% (effective 1 April 2020) were substantively enacted on 26 October 2015. The deferred tax assets at balance sheet date has been calculated based on these rates.
An additional reduction to 17% (effective from 1 April 2020) was announced in the Budget on 16 March 2016. The impact of the change in rate in 2020 does not have a significant impact on the deferred tax balance due to the planned utilisation of the tax losses.
The Group has a further £21.0 million (2015: £21.4 million) of tax losses of which a deferred tax asset of £3.2 million has been recognised. During the period £0.7million of the deferred tax asset was utilised against taxable profits, with an additional £0.5 million deferred tax asset being recognised.
Reconciliation of effective tax rateYear ended
31 March2016
£’000
Year ended 31 March
2015£’000
Profit before taxation 4,258 606
Tax using the UK corporation tax rate of 20% (2015: 21%) (853) (127)Non-deductible expenses (74) (19)Capital allowances in excess of depreciation – 108Utilisation of tax losses – 38Effect of change in rate of corporation tax 130 –Recognition of tax effect of previously unrecognised tax losses 1,273 2,196
Total tax credit 476 2,196
The Group incurred corporation tax profits in the period of approximately £3.6 million (2015: £0.2 million).
Movement in deferred tax balances31 March 2016 31 March 2015
Deferred tax assets
£’000
Deferred tax liabilities
£’000
Deferred tax assets
£’000
Deferred tax liabilities
£’000
At 1 April 2015 2,734 (612) 538 (612)Recognised in profit or loss
Tax losses carried forward 606 – 2,196 –Effect of change in rate of corporation tax (130) – – –Recognised in other comprehensive income
Effect of change in rate of corporation tax – 61 – –Revaluation of property, plant and equipment – (125) – –
At 31 March 2016 3,210 (676) 2,734 (612)
36
FULCRUM UTILITY SERVICES LIMITEDFINANCIAL STATEMENTS

8. DividendsYear ended
31 March2016
£’000
Year ended 31 March
2015£’000
2015 dividend of 0.4p per share 619 –
2016 interim dividend of 0.3p per share 468 –
1,087 –
After the balance sheet date, a final dividend of 0.6p per qualifying ordinary share was proposed by the Directors. The dividends have not been provided for.
9. Earnings per share (EPS)Basic earnings per share have been calculated by dividing the profit attributable to shareholders by the weighted average number of ordinary shares in issue during the period, which were 155,062,292 (2015: 154,306,667). Diluted earnings per share is calculated by dividing the profit attributable to ordinary shareholders by the weighted average number of ordinary shares in issue adjusted to assume conversion of all potentially dilutive ordinary shares from the start of the year, providing a figure of 177,810,228 (2015: 182,252,209). The earnings per share from continued operations were as follows:
Profit per share
Year ended 31 March
2016£’000
Year ended 31 March
2015£’000
Basic 3.1p 1.8p
Adjusted basic 2.7p 0.7p
Diluted basic 2.7p 1.6p
Diluted adjusted basic 2.4p 0.6p
The calculation of the basic and diluted earnings per share is based upon the following data:
Profit for the period
Year ended 31 March
2016£’000
Year ended 31 March
2015£’000
Profit for the period attributable to shareholders 4,734 2,802
Add exceptional items 4 500
Less deferred tax asset recognised (476) (2,196)
Adjusted profit for the period attributable to shareholders 4,262 1,106
37
ANNUAL REPORT AND ACCOUNTS 2016

NOTES TO THE CONSOLIDATED FINANCIAL STATEMENTS continued
10. Property, plant and equipment
Pipelines£’000
Fixtures and fittings£’000
Computer equipment
£’000Total
£’000
Cost
At 1 April 2014 5,929 193 1,029 7,151
Additions 1,622 – 32 1,654
Reinstatement 350 125 – 475
Disposals – – (311) (311)
At 31 March 2015 7,901 318 750 8,969
Additions 1,886 50 6 1,942
Disposals – – (2) (2)
At 31 March 2016 9,787 368 754 10,909
Accumulated depreciation
At 1 April 2014 (36) (124) (638) (798)
Depreciation charge for the period (236) (40) (214) (490)
Reinstatement (350) (125) – (475)
Disposals – – 302 302
At 31 March 2015 (622) (289) (550) (1,461)
Depreciation charge for the period (224) (43) (180) (447)
Revaluation 478 – – 478
Disposals – – 1 1
At 31 March 2016 (368) (332) (729) (1,429)
Net book value
At 31 March 2016 9,419 36 25 9,480
At 31 March 2015 7,279 29 200 7,508
At 1 April 2014 5,893 69 391 6,353
The last external valuation of the pipeline assets was performed during the financial year ended 31 March 2014. The valuation performed for the year ended 31 March 2016 was completed internally and based on the same principals as the external valuation. When performing the valuation, Management have used judgement in assessing the key assumptions used in the valuation model including asset life and occupancy rates. The valuation technique used is classified as a Level 3 fair value (based on unobservable inputs) under IFRS 13 and the pipeline assets are the only financial assets that are held at fair value in the financial statements. Within the £1,886,000 additions in the year is £230,000 which has been included within the revaluation reserve.
At 31 March 2016 the net book value of leased plant and equipment was £nil (2015: £172,000).
38
FULCRUM UTILITY SERVICES LIMITEDFINANCIAL STATEMENTS

11. Intangible assetsGoodwill
£’000Software
£’000Total
£’000
Cost
At 1 April 2014 2,225 2,388 4,613
Disposals – (94) (94)
At 31 March 2015 2,225 2,294 4,519
Additions – 59 59
At 31 March 2016 2,225 2,353 4,578
Accumulated amortisation and impairment
At 1 April 2014 – (1,254) (1,254)
Amortisation for the period – (522) (522)
Disposals – 94 94
At 31 March 2015 – (1,682) (1,682)
Amortisation for the period – (299) (299)
At 31 March 2016 – (1,981) (1,981)
Net book value
At 31 March 2016 2,225 372 2,597
At 31 March 2015 2,225 612 2,837
At 1 April 2014 2,225 1,134 3,359
Goodwill brought forward at the start of the year relates to the acquisition of Fulcrum Group Holdings Limited on 8 July 2010. The carrying amount of the intangible asset is allocated across cash-generating units (CGUs). All of the goodwill held by the Group is considered to fall in the CGU of Infrastructure Services. The recoverable amount of goodwill has been calculated with reference to its value in use.
The Group prepares cash flow forecasts derived from the most recent three year financial budgets approved by management and extrapolated for three years using a conservative estimated growth rate of 1.5%. The key assumptions of this calculation are shown below:
Year ended31 March
2016
Year ended31 March
2015
Period on which management approved forecasts are based 3 years 3 years
Growth rate applied beyond approved forecast period 1.5% 1.5%
Discount rate 7.1% 11.0%
No reasonable possible change in the assumptions noted above would lead to an impairment charge being required.
39
ANNUAL REPORT AND ACCOUNTS 2016
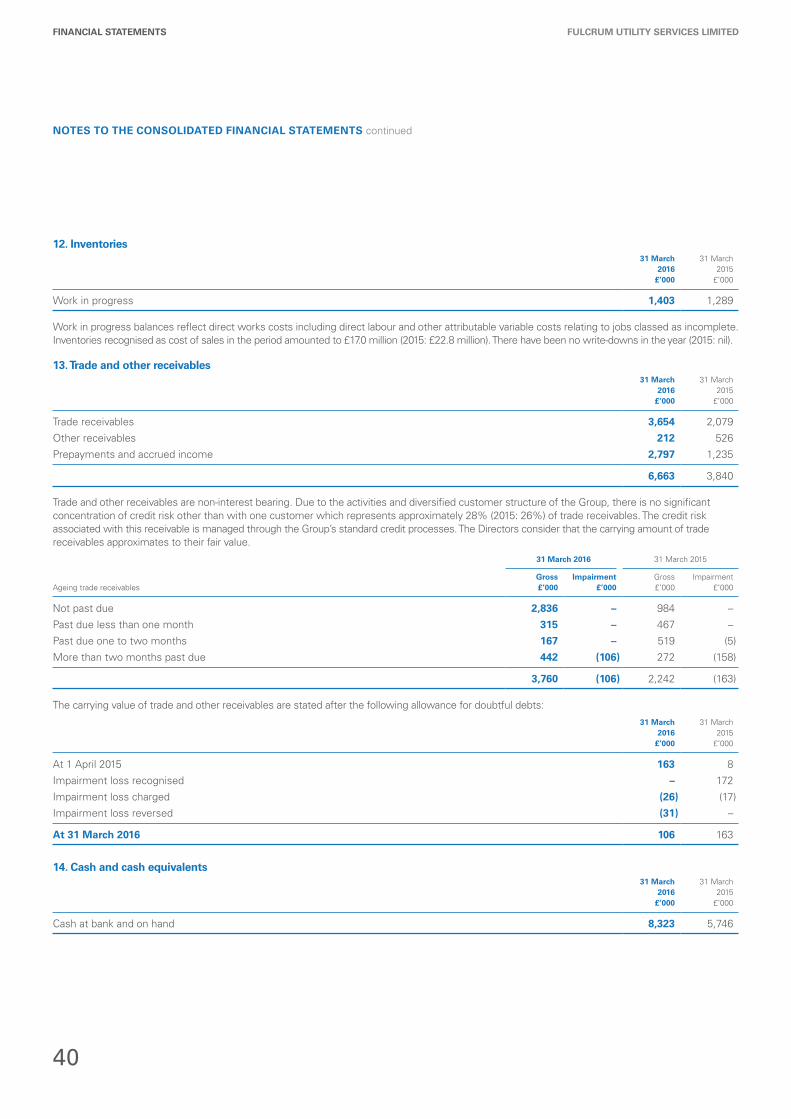
NOTES TO THE CONSOLIDATED FINANCIAL STATEMENTS continued
12. Inventories31 March
2016£’000
31 March2015
£’000
Work in progress 1,403 1,289
Work in progress balances reflect direct works costs including direct labour and other attributable variable costs relating to jobs classed as incomplete. Inventories recognised as cost of sales in the period amounted to £17.0 million (2015: £22.8 million). There have been no write-downs in the year (2015: nil).
13. Trade and other receivables31 March
2016£’000
31 March2015
£’000
Trade receivables 3,654 2,079
Other receivables 212 526
Prepayments and accrued income 2,797 1,235
6,663 3,840
Trade and other receivables are non-interest bearing. Due to the activities and diversified customer structure of the Group, there is no significant concentration of credit risk other than with one customer which represents approximately 28% (2015: 26%) of trade receivables. The credit risk associated with this receivable is managed through the Group’s standard credit processes. The Directors consider that the carrying amount of trade receivables approximates to their fair value.
31 March 2016 31 March 2015
Ageing trade receivablesGross£’000
Impairment£’000
Gross£’000
Impairment£’000
Not past due 2,836 – 984 –
Past due less than one month 315 – 467 –
Past due one to two months 167 – 519 (5)
More than two months past due 442 (106) 272 (158)
3,760 (106) 2,242 (163)
The carrying value of trade and other receivables are stated after the following allowance for doubtful debts:
31 March2016
£’000
31 March2015
£’000
At 1 April 2015 163 8
Impairment loss recognised – 172
Impairment loss charged (26) (17)
Impairment loss reversed (31) –
At 31 March 2016 106 163
14. Cash and cash equivalents31 March
2016£’000
31 March2015
£’000
Cash at bank and on hand 8,323 5,746
40
FULCRUM UTILITY SERVICES LIMITEDFINANCIAL STATEMENTS

15. Trade and other payables31 March
2016£’000
31 March2015
£’000
Trade payables 2,068 813
Accruals and deferred income 20,568 19,883
Other payables 2,429 1,151
25,065 21,847
Of the £20.6 million accruals and deferred income, £13.7 million (2015: £12.6 million) relates to deferred income. Deferred income represents contracted sales for which services to customers will be provided in future periods.
16. BorrowingsThe Group repaid its obligations under finance lease in August 2015 (2015: £168,000) and had no borrowings at 31 March 2016 (2015: £nil). In November 2015, the Group secured a £4.0 million revolving credit facility (£1.0 million plus an accordion option of £3.0 million) which remains undrawn. This replaces the previous £4.0 million (unused) invoice discounting facility.
17. Reconciliation to net funds31 March
2016£’000
31 March2015
£’000
Cash and cash equivalents 8,323 5,746
Finance lease liabilities – (168)
Net funds 8,323 5,578
18. Provisions
Restructuring provisions
31 March2016
£’000
31 March2015
£’000
At 1 April 2015 235 1,378
Utilised during the period (141) (1,643)
Provision created/(released) during the period 4 500
At 31 March 2016 98 235
The restructuring provision relates to the costs of vacated Group properties and dilapidations. It is classified as current as it is expected to be fully utilised within 12 months of the balance sheet date.
19. Pension benefitsThe Group operates a defined contribution pension plan; the total expense relating to this plan in the current year was £268,502 (2015: £304,257).
41
ANNUAL REPORT AND ACCOUNTS 2016

NOTES TO THE CONSOLIDATED FINANCIAL STATEMENTS continued
20. Share based paymentsDetails of the existing and schemes granted in the year and the inputs that were entered into the Monte Carlo valuation model are provided below:
Existing option plansEMI 2014 option plan EMI 2015 option plan EMI 2015 option plan ESS 2015 option plan
Grant date 12 February 2014 19 January 2015 27 March 2015 27 March 2015
Number of options 11,550,000* 5,006,335 946,430 9,513,845
Exercise price 7.00p 7.75p 10.88p 14.00p
Vesting criteria Average share priceof 12.0p over
20 consecutiveworking days
Average share priceof 12.75p over
20 consecutiveworking days
Average share priceof 15.88p over
20 consecutiveworking days
Average share priceof 24.0p over
20 consecutiveworking days
Volatility 40.80% 30.00% 29.30% 29.30%
Dividend yield nil nil nil nil
Option life 3 years 3 years 3 years 3 years
Annual risk free rate 1.12% 0.74% 0.41% 0.41%
Outstanding at the beginning of the year 6,850,000** 5,006,335 946,430 9,513,845
Exercised during the year (1,074,000) (601,335) – (260,000)
Outstanding at the end of the year 5,776,000 4,405,000 946,430 9,253,845
Exercisable at the end of the year 5,776,000 4,405,000 946,430 9,253,845
* Includes 428,586 unapproved options held by Martin Donnachie.
** 4,700,000 options lapsed in the prior year.
The fair value of the options granted, was 1.7p per option. The Management Participation scheme lapsed in the year.
Option plans granted in the year GSS 2016 option plan EMI 2016 option plan SAYE 2016 option plan
Grant date 7 March 2016 7 March 2016 3 February 2016
Number of options 3,913,000 3,243,149 2,678,416
Exercise price 28.125p 28.125p 22.1p
Vesting criteria Average share priceof 40.0p over
20 consecutiveworking days
Average share priceof 40.0p over
20 consecutiveworking days
Maturity date of1 March 2019
Volatility 56.60% 56.60% 56.60%
Dividend yield 2.49% 2.49% 2.49%
Expected life 1 year* 1 year* 3 years
Annual risk free rate 0.45% 0.45% 0.45%
Outstanding at the beginning of the year – – –
Granted during the year 3,913,000 3,243,149 2,678,416
Outstanding at the end of the year 3,913,000 3,243,149 2,678,416
Exercisable at the end of the year – – –
* The life of the GSS and EMI schemes issued in the year is 3 years. Management have assessed the expected life of these options to be 1 year.
The fair value of the options granted, was 2.8p per option.
No cash-settled share based payment awards have been granted to employees.
The volatility was determined by calculating the historic volatility of the Group’s share price since the Group’s listing on AIM in December 2009.
The expected useful life used in the model has been adjusted, based on best estimates, to reflect exercise restrictions and behavioural considerations.
In the year, the Group recognised total expense before tax of £314,000 (2015: £74,000) in relation to equity-settled share based payment transactions in the statement of comprehensive income. These options have been credited against retained earnings reserve.
42
FULCRUM UTILITY SERVICES LIMITEDFINANCIAL STATEMENTS

21. Share capital31 March
2016£’000
31 March2015
£’000
Authorised
500,000,000 ordinary shares of £0.001 each 500 500
Allotted, issued and fully paid
156,387,862 (2015: 154,306,667) ordinary shares of £0.001 each 156 154
22. Share premium31 March
2016£’000
31 March2015
£’000
At 1 April 2015 16,182 16,182
Dividends paid (1,087) –
Shares issued 138 –
At 31 March 2016 15,233 16,182
23. Revaluation reserve31 March
2016£’000
31 March2015
£’000
At 1 April 2015 2,449 2,449
Revaluation in the period 708 –
Revaluation reserve transfer (14) –
Recognition of deferred tax liability (64) –
At 31 March 2016 3,079 2,449
24. Retained earnings31 March
2016£’000
31 March2015
£’000
At 1 April 2015 (17,693) (20,569)
Retained profit in the period 4,734 2,802
Revaluation reserve transfer 14 –
Equity-settled share based payment transactions 314 74
At 31 March 2016 (12,631) (17,693)
43
ANNUAL REPORT AND ACCOUNTS 2016
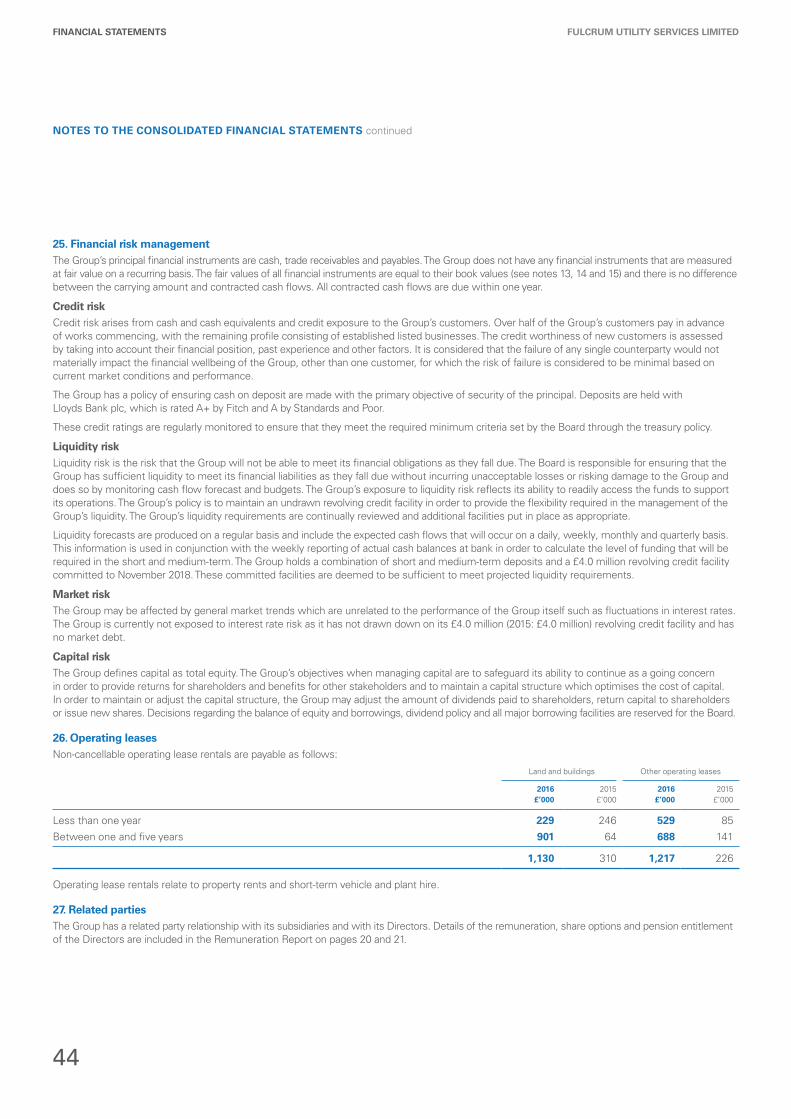
NOTES TO THE CONSOLIDATED FINANCIAL STATEMENTS continued
25. Financial risk managementThe Group’s principal financial instruments are cash, trade receivables and payables. The Group does not have any financial instruments that are measured at fair value on a recurring basis. The fair values of all financial instruments are equal to their book values (see notes 13, 14 and 15) and there is no difference between the carrying amount and contracted cash flows. All contracted cash flows are due within one year.
Credit risk Credit risk arises from cash and cash equivalents and credit exposure to the Group’s customers. Over half of the Group’s customers pay in advance of works commencing, with the remaining profile consisting of established listed businesses. The credit worthiness of new customers is assessed by taking into account their financial position, past experience and other factors. It is considered that the failure of any single counterparty would not materially impact the financial wellbeing of the Group, other than one customer, for which the risk of failure is considered to be minimal based on current market conditions and performance.
The Group has a policy of ensuring cash on deposit are made with the primary objective of security of the principal. Deposits are held with Lloyds Bank plc, which is rated A+ by Fitch and A by Standards and Poor.
These credit ratings are regularly monitored to ensure that they meet the required minimum criteria set by the Board through the treasury policy.
Liquidity risk Liquidity risk is the risk that the Group will not be able to meet its financial obligations as they fall due. The Board is responsible for ensuring that the Group has sufficient liquidity to meet its financial liabilities as they fall due without incurring unacceptable losses or risking damage to the Group and does so by monitoring cash flow forecast and budgets. The Group’s exposure to liquidity risk reflects its ability to readily access the funds to support its operations. The Group’s policy is to maintain an undrawn revolving credit facility in order to provide the flexibility required in the management of the Group’s liquidity. The Group’s liquidity requirements are continually reviewed and additional facilities put in place as appropriate.
Liquidity forecasts are produced on a regular basis and include the expected cash flows that will occur on a daily, weekly, monthly and quarterly basis. This information is used in conjunction with the weekly reporting of actual cash balances at bank in order to calculate the level of funding that will be required in the short and medium-term. The Group holds a combination of short and medium-term deposits and a £4.0 million revolving credit facility committed to November 2018. These committed facilities are deemed to be sufficient to meet projected liquidity requirements.
Market risk The Group may be affected by general market trends which are unrelated to the performance of the Group itself such as fluctuations in interest rates. The Group is currently not exposed to interest rate risk as it has not drawn down on its £4.0 million (2015: £4.0 million) revolving credit facility and has no market debt.
Capital risk The Group defines capital as total equity. The Group’s objectives when managing capital are to safeguard its ability to continue as a going concern in order to provide returns for shareholders and benefits for other stakeholders and to maintain a capital structure which optimises the cost of capital. In order to maintain or adjust the capital structure, the Group may adjust the amount of dividends paid to shareholders, return capital to shareholders or issue new shares. Decisions regarding the balance of equity and borrowings, dividend policy and all major borrowing facilities are reserved for the Board.
26. Operating leasesNon-cancellable operating lease rentals are payable as follows:
Land and buildings Other operating leases
2016£’000
2015£’000
2016£’000
2015£’000
Less than one year 229 246 529 85
Between one and five years 901 64 688 141
1,130 310 1,217 226
Operating lease rentals relate to property rents and short-term vehicle and plant hire.
27. Related partiesThe Group has a related party relationship with its subsidiaries and with its Directors. Details of the remuneration, share options and pension entitlement of the Directors are included in the Remuneration Report on pages 20 and 21.
44
FULCRUM UTILITY SERVICES LIMITEDFINANCIAL STATEMENTS
Design Portfolio is committed to planting trees for every corporate communications project, in association with Trees for Cities.
ADVISERS
Nominated adviser and brokerCenkos Securities PLC6.7.8 Tokenhouse Yard London EC2R 7AS
Financial PR adviserCapital Market Communications (Camarco) Limited107 Cheapside London EC2V 6DN
AuditorKPMG LLP1 Sovereign Square Sovereign Street Leeds LS1 4DA
Solicitors to the Company as to English lawWeightmans LLP100 Old Hall Street Liverpool L3 9QJ
Solicitors to the Company as to Cayman Islands lawMaples and Calder11th Floor 200 Aldersgate Street London EC1A 4HD
RegistrarsCapita Registrars (Guernsey) LimitedLongue Hougue House St. Sampson Guernsey GY2 4JN Channel Islands
BankersLloyds Banking Group1st Floor 14 Church Street Sheffield S1 1HP
GROUP TRADING COMPANIES
Utility Infrastructure Provider (UIP)Fulcrum Infrastructure Services Limited
Independent Gas Transporter (IGT)Fulcrum Pipelines Limited
Group Shared Service ProviderFulcrum Group Holdings Limited

Fulcrum2 Europa View Sheffield Business Park Sheffield South Yorkshire S9 1XH
Tel: 03330 146 466 Email: [email protected]
Websites: www.fulcrum.co.uk www.fulcrumutilityserviceslimited.co.uk www.firstgasconnections.co.uk www.firstelectricityconnections.co.uk
Fulcrum U
tility Services Lim
ited Annual R
eport and Accounts 2016

Fulcrum U
tility Services Lim
ited Annual R
eport and Accounts 2016