Embed Size (px)
Citation preview
Egypt’s Post Revolution Development Path
From A Dynamic Economy Wide Model“A Three-Year Economic Recovery Plan”
Motaz KhorshidProfessor, Cairo University
Former Minister of Higher Education and State for Scientific Research
Cairo, EgyptMobile: + (20122)2440988
Tel. Work: + (202)33358241Mail: [email protected]
Asaad El- SadekPh.D. Student
Faculty of Computers and Information Cairo University, Cairo, Egypt
Mail: [email protected]
The international Conference on Economic Modeling (EcoMod14)
16 -18 July, 2014Bali, Indonesia
Abstract
1
The Egyptian revolution broke out in January 25, 2011, a revolution that sparked the
national movements in the Arab world and impressed the world as a model of an
unprecedented popular peaceful uprising included all the spectrums of Egypt’s
society. The revolution addressed corruption and tyranny and lift the banner of
freedom, justice and democracy. In June 30, 2012 Mohamed Morsi was elected as a
president of Egypt for a mandate of 4 years. Despite people’s aspiration for a better
future, the continuation of the political instability, social injustice and economic
problems during the year following the election have generated an increased feeling
of insecurity and discontent. In June 2013, the Egyptian people decided to rebel
against the unsatisfactory performance of the new political regime and succeeded to
isolate the president with a support from the national military force.
Since January revolution of 2011 and during the following transition period, Egypt
continued to witness a considerable slowdown of its economic activity, a drop in
domestic and foreign direct investments, a sizable decline in industrial production, a
notable deterioration in foreign reserves and foreign exchange revenues and a
growing government budget deficit. In 2014, Egypt’s socioeconomic indicators are
still showing a declining trend reflected in; i) less than 2 percent increase in GDP
coupled with a stagnated per capita real income, ii) an investment rate fluctuating
around 16% of GDP compared to 22% in 2008, iii) a continuing low rate of national
savings, iv) a sizable decline in the foreign direct investment flows - which amounted
to about 2 billion US Dollars per year, compared to an average of 13 billion dollars
during the 1990 decade and the begin of the current century, v) a critical
unemployment situation, especially among youth and educated women with an
average unemployment rate of more than 13% compared to 9% or less five years
ago, vi) a high poverty rate accounting to more than 25% of the total population
compared to less than 17% at the beginning of the third millennium, vii) a continuing
budget deficit and unprecedented levels of domestic public debts exceeding 80
percent of GDP in June 2013, viii) A trade deficit in the current account of the
balance of payments showing a continuous declining trend and ix) an upward rising
trend of inflation derived by the prevailing increase in the state budget deficit.
2
Against this background, the Egyptian Cabinet approved in 28/08/2013 an urgent
plan to stimulate the economy during the period from July 2014 until June 2017 (3
years). The overall objectives of this short/medium term plan is to achieve a GDP
growth rate between 5% and 7% and reduce the unemployment rate to less than
9%, which represents the rate prevailed before January 25, 2011. The plan primarily
depends on improving investments environment by relying on private, public and
foreign direct investments (FDI). The plan suggests also an increased role of
government in revitalizing the economy, with respect to investment spending, public
consumption and employment strategy.
To support the development and follow up of the three year stimulating plan of the
Egyptian economy and to formulate alternative socioeconomic development policies
and scenarios related to investment allocation and government spending policies, a
three-sector five-institution economy wide model is constructed and implemented.
The developed model reflects the structural features of the Egyptian economy and
its modes of functioning and it is implemented using the general algebraic modeling
system (GAMS) software. The Planning model is viewed as a consistent economy
wide analytical tool following the general equilibrium tradition. To ensure the
generation of the future path of the economy, it is equipped with a set of dynamic
adjustment mechanisms. The development planning accounting framework of the
model represents a Social accounting matrix (SAM) with three productive activities
(primary, industrial and services activities), six institutions (urban and rural
households, private and public corporations, and general government) and the
outside world. Domestic institutions have both current and capital accounts. Factors
of production include labor and capital services. Labor factors (or compensation of
employees) are broken down by economic activity (private, public and government
labor) and household area (urban and rural areas). Capital services include both
public and private accounts. Commodities are composed of domestic, imported,
exported and composite goods and services (merging domestically produced with
imported goods) with each of them divided into primary, industry and services
activities. Gross fixed capital formation is composed of private (households and
private companies) and public (government and public enterprises) investments as
3
well as foreign direct investments (FDI). Government accounts disaggregate tax
income into direct, indirect taxes and subsidies. Finally, the rest of the world account
includes exports, imports, net transfers from abroad (in the form of worker’s
remittances, investment income, foreign direct investments and other current
transfers).
The purposes of the paper are: (1) to assess the economic impact of the revolution
and highlight the principal economy wide challenges facing the Egyptian economy,
(2) to develop the accounting framework, economic rationale and mathematical
structure of the economy wide model used to test the development policies of the
stimulating plan, (3) to use the developed model to simulate the behavior of the
economy under the selected development choices of the three year plan with the
purpose of identifying appropriate policy measures needed to achieve the purposes
of the three-year economic recovery program.
Despite the short/medium term nature of the planning period, the results show that
a sizable increase in annual growth rate of investment spending from 7.4 to 13
percent coupled with similar growth in government spending ranging from 5 to 7
percent per annum as well as an appropriate policies for attracting foreign direct
investments (FDI), would significantly improve the growth prospects of real GDP.
Based on the results of model, GDP is expected to increase from 3.4 percent in the
reference path to around 4.7 percent when the stimulating scenario is applied. It
should be noted however that, the failure to achieve a growth rate that exceeds 5
percent annually – based on the objectives of the recovery plan - is due to the
negative impact of the selected stimulating policies on Egypt’s trade balance or net
exports. Export promotion measures would be strongly requested in this respect to
overcome this difficulty. Finally, the adopted three-year recovery plan succeeds to
improve the per capita indicators and the welfare measures of Egyptians as well as
to reduce the average unemployment rate from 13 percent in 2013/14 to around 9.9
percent in 2016/17.
4
Based on the above rationale, the paper is organized around seven sections. After
this introductory part, the next two sections describe the post revolution economic
performance and outline the accounting framework of the model. Sections four
briefly describes the economic rationale, overall structure and disaggregation level of
the model as well as the policy measures amenable to analysis based on its
structure. Section five summarizes the components of the plan scenarios to be
tested by the model. The sixth section describes the results and summarizes the
main findings of applying the three year stimulating plan with special emphasis on
the capacity to reach the planned targets and the feasibility of the selected policy
measures to the Egyptian context. The final section includes the references.
Post revolution economic performance
Since January 2011 revolution, the Egyptian economy is witnessing a significant
decline in its overall performance [14, 15, 16]. The evolution of the rate of economic
growth over the three years - following the outbreak of the January 25 th revolution-
displays a deteriorating performance. The rate of GDP growth in real term collapsed
from a peak value of 7.2% in 2007/2008 to just 2.1% in 2012/2013 because of the
political stress and security unrest resulting generally in adverse consequences on
economic and development performance. The growth rates of most of economic
sectors followed the same declining pattern of the economy. However, on the
positive side, the fiscal year 2012/2013 witnessed a significant increase in the rate of
real growth (6.6%) in the tourism sector, compared to the year immediately
following the revolution (-5.9%). This is mainly attributed to the decision of a lot of
countries, led by Germany to ease degrees of travel warning to Egypt. The
construction sector also saw a notable growth during the same year (5.9%) as the
work in many of the giant real estate projects have resumed. On the negative side, in
2012/2013 there was a decline in the income from Suez Canal (-3.8%) because of the
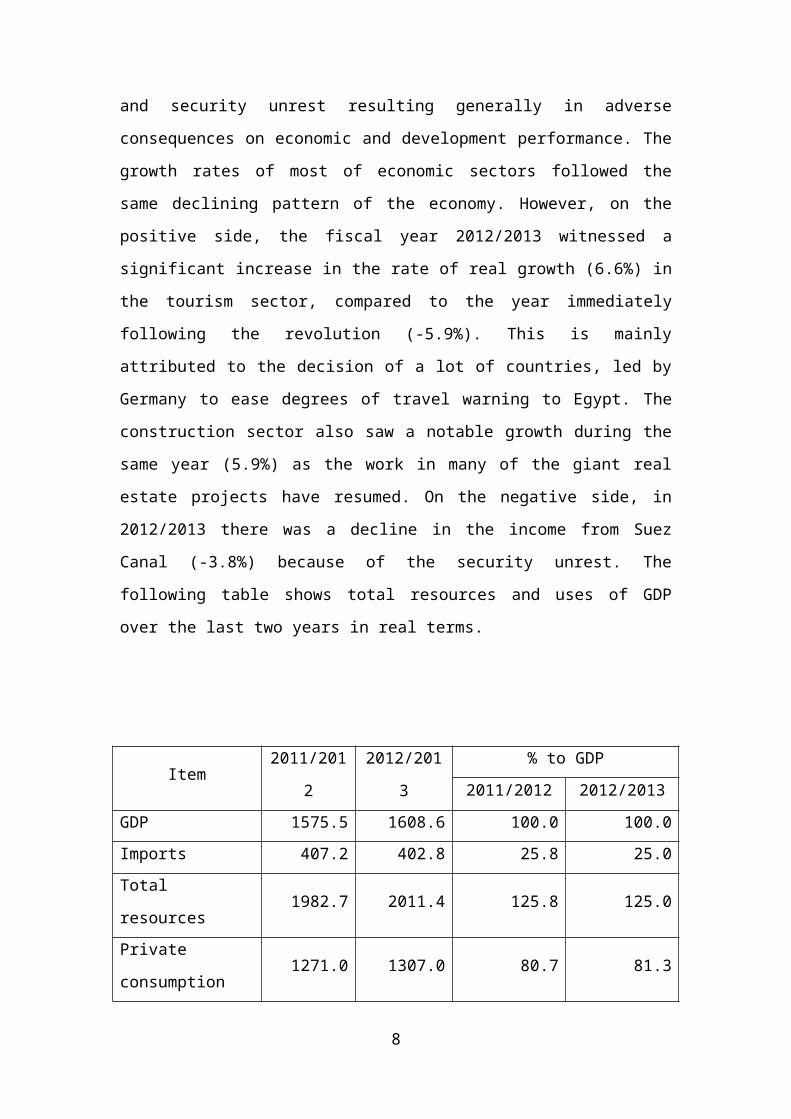
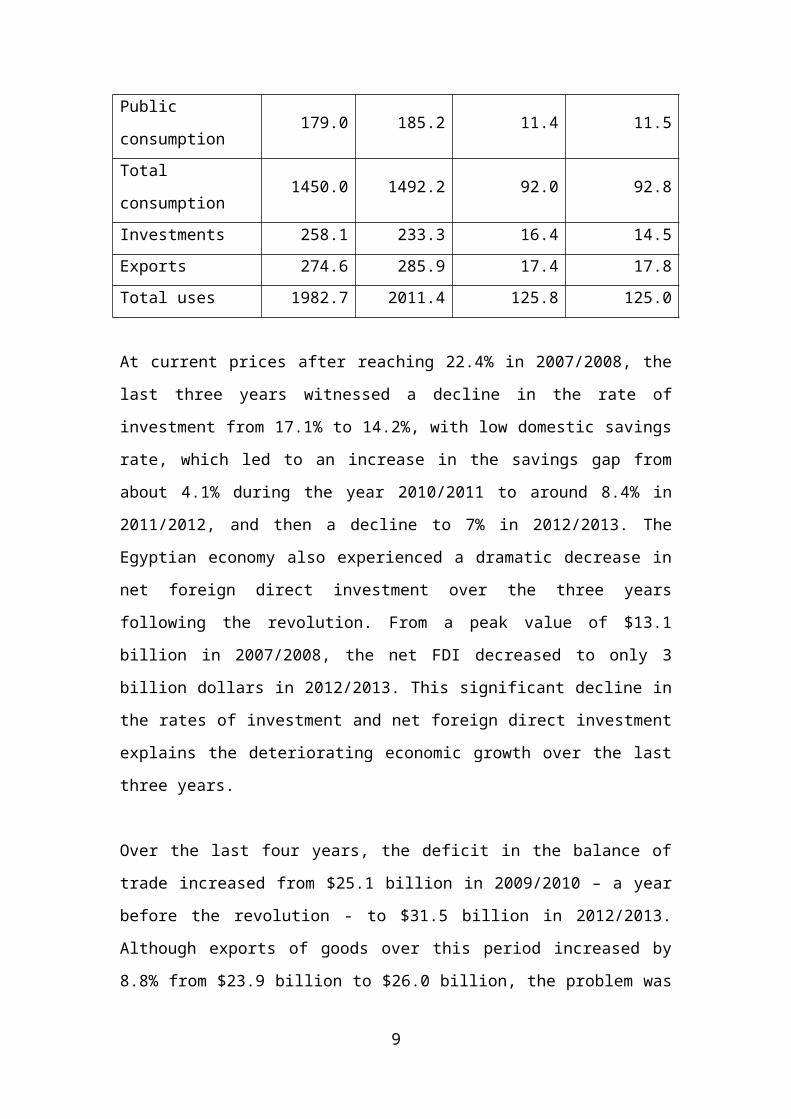
security unrest. The following table shows total resources and uses of GDP over the
last two years in real terms.
5
Item 2011/2012 2012/2013% to GDP
2011/2012 2012/2013
GDP 1575.5 1608.6 100.0 100.0
Imports 407.2 402.8 25.8 25.0
Total resources 1982.7 2011.4 125.8 125.0
Private
consumption1271.0 1307.0 80.7 81.3
Public consumption 179.0 185.2 11.4 11.5
Total consumption 1450.0 1492.2 92.0 92.8
Investments 258.1 233.3 16.4 14.5
Exports 274.6 285.9 17.4 17.8
Total uses 1982.7 2011.4 125.8 125.0
At current prices after reaching 22.4% in 2007/2008, the last three years witnessed a
decline in the rate of investment from 17.1% to 14.2%, with low domestic savings
rate, which led to an increase in the savings gap from about 4.1% during the year
2010/2011 to around 8.4% in 2011/2012, and then a decline to 7% in 2012/2013.
The Egyptian economy also experienced a dramatic decrease in net foreign direct
investment over the three years following the revolution. From a peak value of $13.1
billion in 2007/2008, the net FDI decreased to only 3 billion dollars in 2012/2013.
This significant decline in the rates of investment and net foreign direct investment
explains the deteriorating economic growth over the last three years.
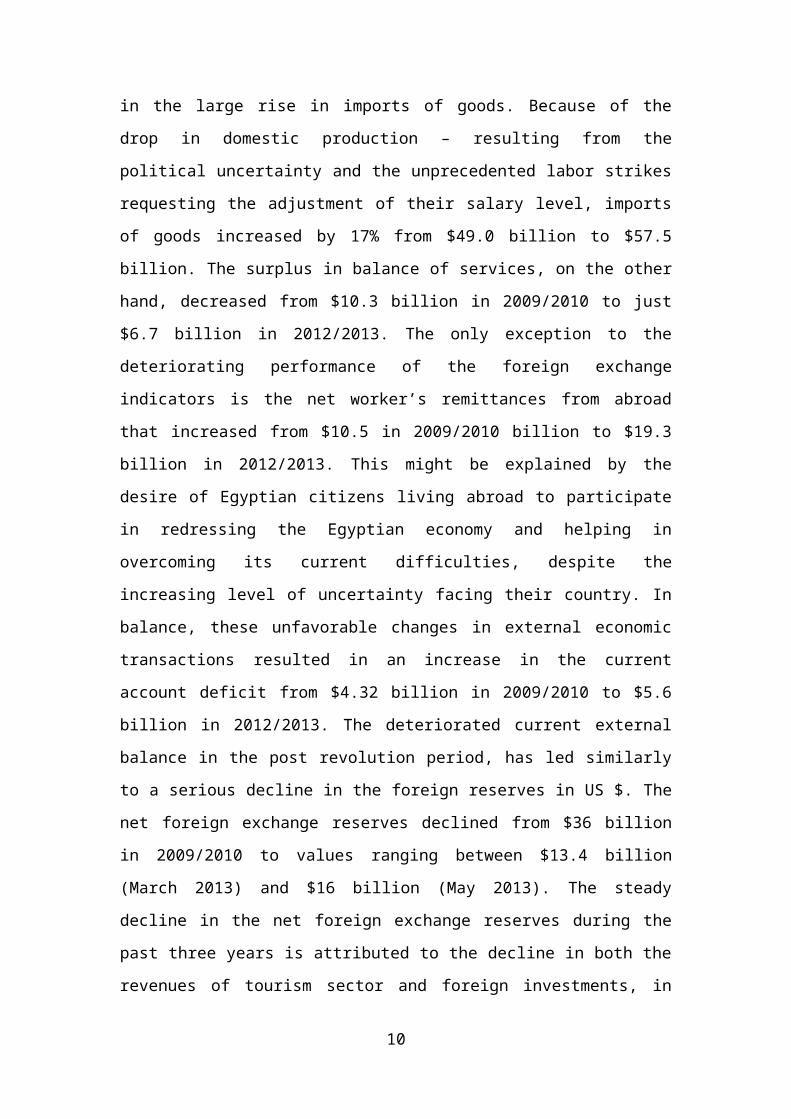
Over the last four years, the deficit in the balance of trade increased from $25.1
billion in 2009/2010 – a year before the revolution - to $31.5 billion in 2012/2013.
Although exports of goods over this period increased by 8.8% from $23.9 billion to
$26.0 billion, the problem was in the large rise in imports of goods. Because of the
drop in domestic production – resulting from the political uncertainty and the
unprecedented labor strikes requesting the adjustment of their salary level, imports
of goods increased by 17% from $49.0 billion to $57.5 billion. The surplus in balance
of services, on the other hand, decreased from $10.3 billion in 2009/2010 to just
$6.7 billion in 2012/2013. The only exception to the deteriorating performance of
6
the foreign exchange indicators is the net worker’s remittances from abroad that
increased from $10.5 in 2009/2010 billion to $19.3 billion in 2012/2013. This might
be explained by the desire of Egyptian citizens living abroad to participate in
redressing the Egyptian economy and helping in overcoming its current difficulties,
despite the increasing level of uncertainty facing their country. In balance, these
unfavorable changes in external economic transactions resulted in an increase in the
current account deficit from $4.32 billion in 2009/2010 to $5.6 billion in 2012/2013.
The deteriorated current external balance in the post revolution period, has led
similarly to a serious decline in the foreign reserves in US $. The net foreign
exchange reserves declined from $36 billion in 2009/2010 to values ranging between
$13.4 billion (March 2013) and $16 billion (May 2013). The steady decline in the net
foreign exchange reserves during the past three years is attributed to the decline in
both the revenues of tourism sector and foreign investments, in addition to the use
of international reserves to finance imports and to prevent the deterioration in the
value of the Egyptian pound.
Despite the declining economic growth since the outbreak of the revolution,
consumer spending in current prices continues to occupy a large proportion of GDP.
Final consumption expenditure at current prices reached during the year 2012/2013
LE1.6 billion, which represents 92.8% of GDP at current prices, compared to LE1.0
billion in 2009/2010, equivalent to 85.7% of GDP at current prices. With the decline
in investments and net exports, the increase in final consumption is still the main
source of economic growth.
The impact of January revolution on the deficit of general government budget was
considerable. During the financial year 2012/2013, total deficit in the state budget
reached LE240 billion compared to LE 98 billion in 2009/2010 - the year before the
revolution, with a 145% Increase. This resulted in an increase in public debt. Total
domestic public debt reached to LE1404.7 billion in 2012/2013, representing 81% of
GDP at current prices compared to LE 663.8 billion in 2009/2010, representing 55%
of the GDP at the same year. Foreign debts have also become a problem, increased
from $34.4 billion in June 2011 to $43.2 billion in July 2010, an increase of 25.6%.
7
Finally, the slowdown of Egypt’s economic activity has aggravated the
unemployment problem since the unemployment rate increased from 9 percent
during the two years preceding the revolution to around 13.3% in 2012/2013. It also
resulted in 8% inflation.
The Accounting Framework of the Model
The accounting structure and parameters of the model is broken down into two main
components; a) an aggregate social accounting matrix (SAM) constructed for the year
2008-09 to support the within-period static part of the model [1,6,9,19] and b) a non
SAM socioeconomic indicators needed to adjust the inter-period module ensuring the
dynamic path of the economy.
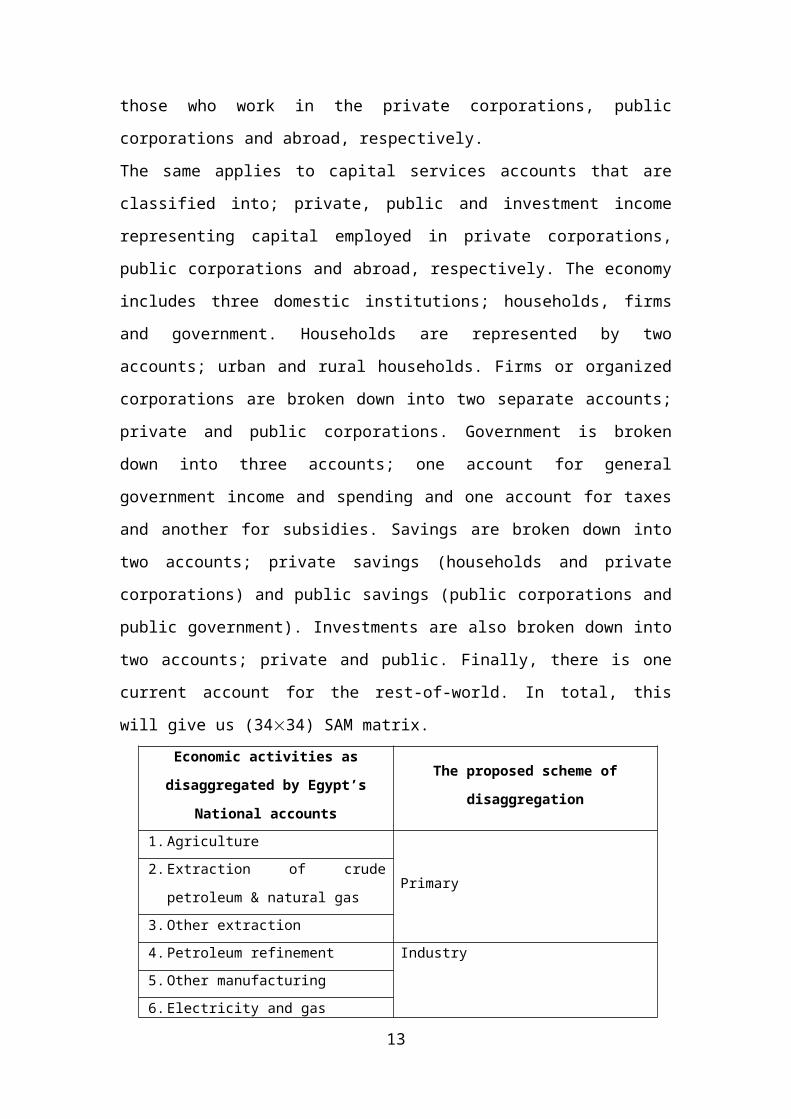
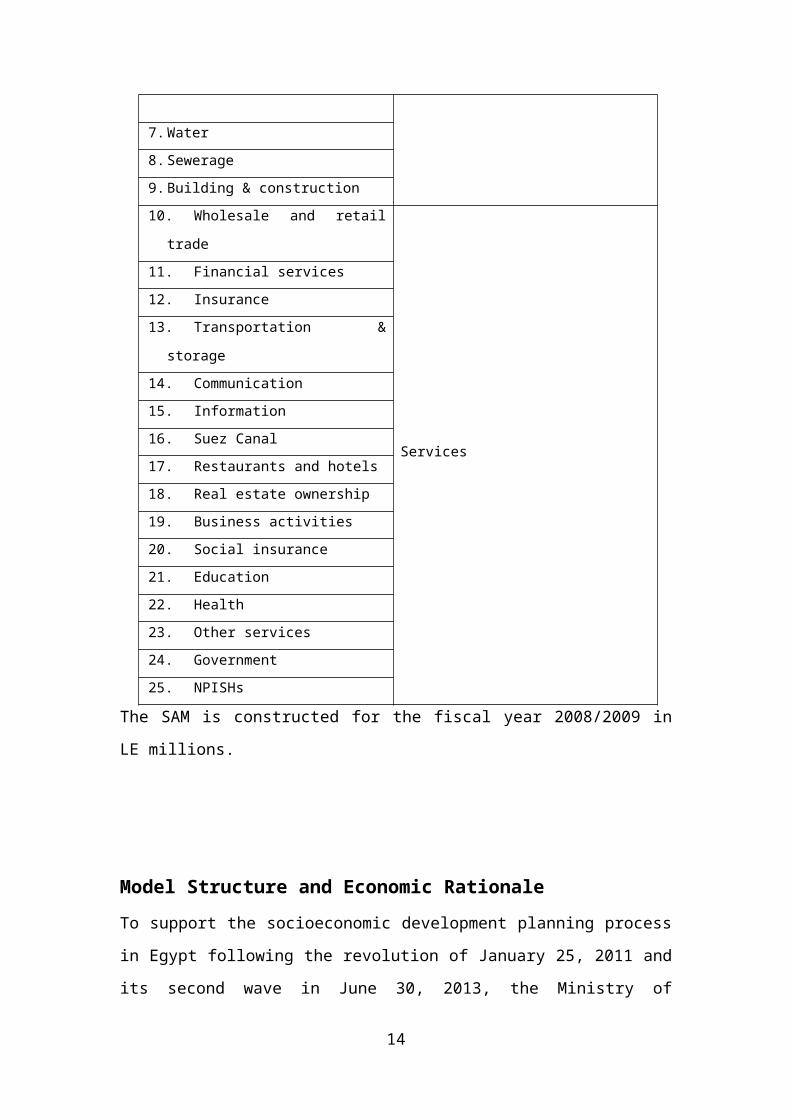
In this specific SAM, activities are broken down into three distinctive accounts;
primary, industry and services. This classification is the one adopted in the
International Standard Industrial Classification of all economic activities (ISIC),
Revision 4 [9]. The disaggregated three productive activities of the SAM are shown in
the table below. Commodities are classified into; composite, domestic, imported and
exported with each bundle of commodities broken down into primary, industry and
services. Factors are represented in the SAM by two groups of accounts; labor
compensation accounts and capital services accounts. Labor compensation accounts
are broken down by economic activity into; private, public and net worker remittances
representing those who work in the private corporations, public corporations and
abroad, respectively.
The same applies to capital services accounts that are classified into; private, public
and investment income representing capital employed in private corporations, public
corporations and abroad, respectively. The economy includes three domestic
institutions; households, firms and government. Households are represented by two
accounts; urban and rural households. Firms or organized corporations are broken
down into two separate accounts; private and public corporations. Government is
broken down into three accounts; one account for general government income and
spending and one account for taxes and another for subsidies. Savings are broken
down into two accounts; private savings (households and private corporations) and
public savings (public corporations and public government). Investments are also
8
broken down into two accounts; private and public. Finally, there is one current
account for the rest-of-world. In total, this will give us (3434) SAM matrix.
Economic activities as disaggregated by
Egypt’s National accounts The proposed scheme of disaggregation
1. Agriculture
Primary2. Extraction of crude petroleum &
natural gas
3. Other extraction
4. Petroleum refinement
Industry
5. Other manufacturing
6. Electricity and gas
7. Water
8. Sewerage
9. Building & construction
10.Wholesale and retail trade
Services
11.Financial services
12.Insurance
13.Transportation & storage
14.Communication
15.Information
16.Suez Canal
17.Restaurants and hotels
18.Real estate ownership
19.Business activities
20.Social insurance
21.Education
22.Health
23.Other services
24.Government
25.NPISHs
The SAM is constructed for the fiscal year 2008/2009 in LE millions.
Model Structure and Economic Rationale
9
To support the socioeconomic development planning process in Egypt following
the revolution of January 25, 2011 and its second wave in June 30, 2013, the
Ministry of Planning (MOP) developed two socioeconomic plans. A 10-year long
term plan to capture both the recovery period needed to reach the normal
performance of the economy and analyze as well its growth prospects in the post
recovery period up to 2021/22 [12]. This long term plan mainly adopts a
comprehensive set of policy measures with a target to double the real per capita
income as a way to improve the living standards of the Egyptian citizens.
Furthermore, to overcome the short/medium term difficulties resulting from the
devastating impact of the revolution, the government of Egypt decided to adopt a
three-year recovery plan to stimulate the economy in order to accelerate the
return back to its normal functioning [18]. To achieve this short term objective, a
three-sector five-institution medium term economy wide model was
constructed, implemented and used to formulate and test alternative
socioeconomic development options and scenarios. The constructed model
reflects the structural features of the Egyptian economy along with its modes of
functioning and it is implemented using the general algebraic modeling system
(GAMS) software [7,10 ,11,12].
The model is particularly designed to project Egypt’s socioeconomic indicators
and assess the impact of alternative policy measures and external conditions
such as: (1) Investment spending policies reflected in the private and public
gross fixed capital formation, (2) foreign direct investment (FDI) flows needed to
complement domestic investments in supporting the growth prospects of the
economy, (3) government spending policies such as government wage bill and
employment policy, final consumption spending as well as public transfers to
domestic and foreign institutions, (4) government fiscal policy including various
taxes and subsidies, (5) export promotion and subsidy policy, (6) total factors
productivity and labor efficiency policies, (7) external balance policies reflected
in changes in investment income from abroad, worker remittances, interest on
foreign assets and other foreign transfers from abroad , (8) wage rate and
commodity pricing policies and (9) alternative population, labor force and
unemployment reduction policies.
10
The development planning model represents an economy with three productive
activities (primary, industrial and services activities), six institutions (urban and
rural households, private and public corporations, and general government) and
the outside world. Domestic institutions have both current and capital accounts.
Factors of production include labor and capital services. Labor factors (or
compensation of employees) are broken down by economic activity (private,
public and government labor) and household area (urban and rural). Capital
services include both public and private accounts. The markets of goods and
services in the model are composed of domestic, imported, exported and
composite commodities (merging domestic with imported goods), with each of
them divided into primary, industry and services. Gross capital formation is
composed of private (households and private companies) and public
(government and public enterprises) investments as well as foreign direct
investments (FDI). Government account disaggregates net tax income into direct
and indirect taxes and subsidies. Finally, the rest of the world account includes
net transfers from abroad in the form of worker’s remittances, investment
income, foreign direct investments, current transfers to domestic institutions as
well as imports and exports of goods and services.
The Planning model is viewed as a consistent economy wide simulation model
equipped with a set of dynamic adjustment mechanisms to ensure the
generation of the medium to long term path of the economy [2, 3, 4, 5]. Most of
the model structural parameters are computed from the SAM where as the
behavior parameters are based on estimates of other models and similar studies
for Egypt. The model represents an economy with an investment/saving
macroeconomic closure rule that treats public and private gross fixed capital
formations as exogenous variables, gross savings as an endogenous variable
depending on institutional income and expenditure patterns and the foreign
savings that clear the macroeconomic system. Production sectors apply a
flexible price clearing mechanisms with an imperfect substitution between
domestic and imported goods (Armington Elasticity function). Distribution of
gross output between domestic sales and exports is based on a constant
11
elasticity of transformation (CET) function. Transfers from the rest of the world
are fixed in foreign currency whereas transfers of the domestic institutions to
the outside world are a function of their disposable income. World prices and
interest on foreign assets are determined exogenously in the model. Exports of
commodities are computed as the equilibrium quantity between supply of and
demand for exported goods and services. The ratio of domestic to world price of
commodity and the elasticity of trade determine world demand for exports.
Government income is composed of direct and indirect taxes, public enterprises
transferred operating surplus and transfers from domestic and foreign
institutions. Government final consumption spending is fixed in real term and
public savings are computed as a residual. Households and companies
expenditures are computed as a fixed share of their nominal income and
household final consumption spending is computed by a linear expenditure
system (LES) . The model is equipped with institutional capital flows matrix that
balances exogenous investments with savings and capital transfers. Given
market imperfection and high unemployment rates, wage rates are fixed within
period but change between periods based on employment and wage policy.
Natural growth rate of population and labor participation policies are used to
dynamically adjust population and labor force size between periods. The
dynamic adjustment of capital stock between periods - by production activity –
is based on the initial capital stock, gross fixed capital formation in real term and
the consumption of fixed capital. Similar dynamic adjustment mechanisms are
derived for investment income from abroad and foreign direct investments
(FDI).
Development of the recovery Plan Scenarios
Based on the Egyptian Cabinet decision in 28/08/2013 to implement a short-term
recovery plan with the objective of stimulating the economic performance during
the period from July 2014 until June 2017 (3 years), a set of experiments – based on
the constructed model – is designed and tested. Given the official plan document,
These experiments assume –– that overall objectives of the medium-term plan is to
achieve on the one hand a GDP real growth rate between 5% and 7% and reduce on
the other hand the unemployment rate to less than 9%, which represents the
12
rate prevailed before January 25, 2011. In order to meet these short-term
targets, a comprehensive development scenario is formulated with the following
policy measures:
(i) Increase the growth rate of private, public and foreign direct
investments (FDI) spending during the coming three years up to 2016/17.
It is assumed that the Egyptian authorities will succeed to revitalize FDI
with respect to both the public and private sectors. This effort would
result in an average annual increase of FDI ranging from 12 to 14 percent
during the plan three years. Furthermore, public and private gross fixed
capital formation – in real term – are assumed to reach an average annual
growth of 10 and 15 percent respectively, compared to only 5 and 9
percent in the reference path (or business as usual). These figures are
estimated considering the prevailing investment capacity of Egypt as well
as government effort to mobilize the needed resources.
(ii) The plan suggests also an increase in the role of government to revitalize
the economy, with respect to government current expenditures and
transfers as well as employment strategy. In this respect, government
wage bill and purchases of goods and services in real term are assumed to
increase respectively by 5 and 7 percent in the stimulating scenario
compared to only 2.5 and 4.5 percent considering the reference path
assumptions. In addition, the stimulating scenario suggests an increase in
government transfers to domestic institution (households and business
sectors) to allow for further activation of the domestic demand for
commodities.
Given the above assumptions, the constructed model was used to compare the
performance of the Egyptian economy up to 2016/17 in light of the assumption of
the reference path and the stimulating (or recovery) scenarios.
Experimental Results and Basic Findings
13
The model results corresponding to the reference path and the stimulating scenarios
during the period (2013/14 -2016/17) is summarized in three tables:
a) Table (1) records the changes in the sources of financing the growth of
GDP. It shows the uses (or applications) of GDP in real term up to
2016/17 which is the terminal year of the short/medium term plan. In
the table, consumption and investment is broken down into private and
public spending. When net exports (exports less imports) are included,
the uses of GDP are completely identified. Note here that the table
records the annual growth rate of the plan target year (from 2015/16 to
2016/17) as well as the structural changes in the components of GDP
(uses as a percent of GDP).
b) Table (2) summarizes the changes in real GDP during the planning period
broken down into private, government and public sectors. It can be used
then to measure the contribution of each production sector to GDP. The
table shows also other important economic welfare indicators such as
per-capita GDP, GNP and household consumption.
c) Since reducing the unemployment rate represents a major policy option
in the three-year plan – or any other policy exercise in Egypt – table (3)
shows the impact of alternative scenarios on labor supply and demand
divided into private, public and government workers. These indicators
are used also to determine the unemployment level at the end of the
planning period or equivalently the target year (2016/17).
Growth Prospects:
Given the assumptions of alternative development scenarios, the structural and
behavioral features of the Egyptian economy reflected in the constructed medium
term planning model and the projected socioeconomic indicators up to the target
year (2016/17), the following analytical results and concluding remarks can be
delineated:
1. If the government succeeds to mobilize its available resources for enhancing
public sector investment opportunities and attracting foreign direct
14
investments to finance public enterprises, and assuming that it will succeed
also to adopt various policy measures to encourage private investor and
enterprises - with special reference to their participation in national
development programs and support to youth projects - Egypt will be in a
position to accelerate economic growth, reduce its financial and commercial
resource gaps, face labor market structural imbalances and improve the
welfare level of citizens.
2. It should be noted however that the selected policy measures need to
respect Egypt’s feasibility limits reflected in its structural rigidities and
prevailing distortions. Furthermore, in many instances, policy means can
have contradicting effects. For example, a surge in investment spending
would contribute to enhancing economic growth via its positive impact on
capital stock and return on capital, but it might however lead to an increase
in the demand for imports of investment goods and then contribute to
reducing the growth prospects of GDP. On the other hand, an increase in
private and government consumption spending would normally have positive
impact on GDP growth as a component of its uses. Further increase of
consumption spending would lead meanwhile to reducing the part of the
domestic production that can be directed to exports which is a factor
contributing to reducing GDP growth and negatively affecting external
balance.
3. Keeping the above economic rationale in mind, table (1) shows that annual
growth rate of Real GDP in 2016/17 increases from 3.4 percent in the
reference path to around 4.7 when the stimulating scenario is adopted. The
enhanced investment performance (average annual growth rate is assumed
to increase from 7.4 to around 13 percent) and the improved government
final consumption (annual growth rate is assumed to increase from 2.8 to 5.7
percent on the average), are the major factors for achieving the growth of
GDP in real term. The table shows also the negative impact on GDP growth in
2016/17 resulting from the increase in the growth of imports from 6.1
percent in the reference path to around 9.9 percent when the stimulating
scenario is adopted. It reflects also the stagnated performance of exports
15
with an average growth rate that does not exceed 1.3 to 1.6 percent on the
average. This finding suggests that the stimulating policy package should
include – in addition to investment, FDI and government spending policies –
an export measures.
4. Table (2) shows the contribution of the production sectors to the growth of
GDP in real term evaluated at factor cost. According to the stimulating
scenario, the private sector appears on top of the list with respect to its
contribution to the growth of GDP (5.4 percent growth rate of private sector
GDP in 2016/17). Because the general government GDP is composed mainly
of real wage bill, its growth rate is reflected directly in the labor market
functioning and unemployment rate.
Structural Changes
Given the short period of analysis (2013/14 – 2016/17), one would expect that the
structural changes in the economy resulting from the tested scenarios are limited.
The sizable increase in investment and government spending might result however
in some changes in the structure of GDP. This is true with respect to total investment
spending and demand for imports. In table(1), gross investment spending as a
percent of GDP in 2016/17 increased from 25% in the reference path scenario to
around 29% when adopting the stimulating scenario. Similarly, imports as a percent
of GDP increased considerably from 34% to 38% as a result of applying the
stimulation package.
16
Table (1) Uses of GDP in real term Ec
onomic
Indicators
(Real Term)
Base year (2013/14) Development Scenarios
Indicator Structure
(%)
Reference Path Stimulating Scenario
2013/14
Target year
2016/17
Target year
Growth
(%)
GDP
Structure
(%)
Growt
h (%)
GDP
Structure
(%)
Private
Consumption880,058 73 997,247 4.0 75 1022,476 5.1 75
Public
Consumption145,007 12 157,486 2.8 12 170,618 5.7 13
Total
Consumption 1025,065 85 1154,733 3.8 87 1193,094 5.2 88
Private
Investments145,313 12 189,678 9.3 14 218,624 15.0 16
Public
Investments 128,863 11 149,993 5.0 11 170,085 10.0 13
Total
Investments 274,176 23 338,711 7.4 25 388,709 12.8 29
Exports288,654 24 296,314 1.6 22 291,682 1.3 21
(-) Imports375,520 32 463,833 6.1 34 510,462 9.9 38
GDP uses
(Market Price)1212,375 100% 1325,925 3.4 100% 1363,023 4.7 100%
17
Table (2) GDP break down by sector and per capita indicators
Economic Indicators
Base yearDevelopment Scenarios
(2013/14
)
GDP
Structur
e
(%)
Reference Path Stimulating Scenario
2016/17
Target year
2016/17
Target year
Growt
h (%)
GDP
Structur
e
(%)
Growth
(%)
GDP
Structur
e
(%)
Private GDP714,821 62 793,488 4.1 63 814,190 5.4 62
Public GDP322,864 28 344,504 2.5 27 350,902 3.4 27
Government GDP120,268 10 129,010 2.4 10 139,225 5.0 11
GDP Sources
(at factor cost)1157,952 100% 1267,002 3.5 100
1304,31
74.8 100
Pre-Capita GDP
(Real Term)14,247 - 14,625 1.13 - 15,049 1.8 -
Pre-Capita GDP
(Nominal)22,397 - 25,061 3.96 - 27,056 6.9 -
Pre-Capita GNP22,738 - 25,457 3.99 - 27,451 6.9 -
Per-Capita
Household
Consumption
16616 - 18677 4.1 - 20017 6.8 -
Table (3) Labor Supply, Demand and unemployment ratePopulation/Labor Indicators
(Thousands)
Stimulating Scenario
2013/14 2014/15 2015/16 2016/17
Population Size85,096 86,883 88,708 90,571
Labor Force Supply30,209 30,409 31,491 32,605
Labor Demand26,248 26,708 27,900 29,361
Unemployment Rate (%)13.11 12.17 11.40 9.95
Labor Demand by sector:
- Private
- Public
- Government
18,786
795
6,667
19,056
796
6,856
19,883
818
7,199
20,956
846
7,559
18
Per Capita Indicators
In the context of this study, per capita indicators can serve two purposes; i)
Economic growth adjusted by population size and ii) welfare level of citizens. Per
capita GDP in real term slightly increases from LE 14,625 in the reference path to LE
15,049 in 2016/17 due to the adoption of the stimulating policies. The impact on per
capita GDP and GNP in nominal term is clearer. The average annual growth rates of
per-capita GDP in nominal term witness a sizable increase from 3.96% to 6.9% when
applying the stimulation package. Furthermore, the implementation of the
stimulation scenario produces a significantly positive effect on the per capita
household consumption with an absolute increase from LE 18,677 to LE 20,017 in
2016/17.
Labor Market and Unemployment
The impact of the stimulating scenario on supply of and demand for labor services as
well as unemployment rate is shown in table (3). When carrying on the modeling
experiments, we assumed no changes between the reference path and the
stimulating scenario with respect to population size and supply of labor force. The
demand for labor services is meanwhile affected by the economic policy measures
included in the stimulating scenario. On the average, the demand for labor – which
reflects in a way the job opportunities offered by the productive sectors of the
economy – increases by around 4 percent per annum resulting in a growth of
demand from 26,248 thousand laborers in 2013/14 to around 29, 361 thousands in
2016/17. As a direct consequence, unemployment rates decreases from 13.11
percent in 2013/14 to around 9.95 percent which represents approximately the pre-
revolution performance (the prevailing official unemployment rate in 2010 was
around 9 percent). Table (3) shows also the breakdown of labor demand by
production sector. Given the short term nature of the analysis, the impact on
demand for labor is felt in the private and government sectors more the public
enterprises. The discussion of this point needs some micro analysis that goes beyond
the scope of this study. Based on the results of the model, average annual growth
rate of demand for labor has increased by 3.85% and 4.4% in the private and
19
government sector, respectively. The demand for labor in public enterprises
increases only by 2.14% per annum on the average.
References
[1] Aboul-Einein, S. and Motaz Khorshid (2009) “A Social Accounting Matrix
to Assess the Strategies for achieving the Millennium Development Goal in
Egypt” Unpublished Working Paper, Regional Project for Assessing Development
Strategies to Achieve the Millennium Development Goals in the Arab region,
UNDP-RBAS, UN-DESA and World Bank.
[2] Dervis, K., J. De Melo and S. Robinson (1982) “General equilibrium
Models for Development policy.” Cambridge University Press, New York.
[3] Drud, A., W. Grais and G. Pyatt (1986) “Macroeconomic Modeling Based
on Social Accounting Principles. “Journal of Policy modeling. Vol. 8. No.
1:111-145.
[4] Khorshid, M. (1994) “A Dynamic Multi-sector Economy-wide Model for
Egypt: Database, Structure and Policy Analysis.” The IBK Papers. The
Industrial Bank of Kuwait. No. 41: 1-68.
[5] Khorshid, M. (1996) "A Multi-sector Population Economy-wide
Simulation Model for Egypt" Finance and Industry. The Industrial Bank of
Kuwait, No. 12: 39-155.
[6] Khorshid M. (2002) “Issue-Oriented Social Accounting Matrices for Development
Policy: Experience from the Middle East and North Africa Region”, The proceedings
of the 14th International Conference on Input-Output Techniques, Montreal,
Canada, October 10-15.
[7] Khorshid M . (2003) "Alternative Socioeconomic Development Scenarios for
Egypt: Results from an Economy-Wide Simulation Model", published by the
20
Economic Research Forum (ERF) for the Arab Countries, Iran and Turkey,
December.
[8] Khorshid M. (2008) "Social Accounting Matrices for Modeling and Policy Analysis-
Development Issues from the Middle East" Proceedings of the International
Conference on Policy Modeling, Berlin, Germany, July 2-4.
[9] Khorshid, M. and A. El-Sadek (2010) "An ICT Economy Wide Interaction Social
Accounting Matrix for Egypt – Structure, Economic Rationale and Analytical
Indicators" Proceedings of the International Conference on Policy Modeling,
EcoMod10, Istanbul, Turkey, July 7-10.
[10] Khorshid M. and A. El sadek (2011) "An ICT Economy Interaction Model
for Egypt – Impact on Growth and Productivity" Proceedings of the
International Conference on Economic Policy Modeling (EcoMod11),
Azores, Portugal, June 27-29.
[11] Khorshid M. and A. El sadek (2012) "A multi-sector ICT Economy
Interaction Model For Egypt – The Path to Information Society" Proceedings of
the International Conference on Economic Policy Modeling (EcoMod12),
Seville, Spain, July 4-6.
[12] Khorshid M. and A. El sadek (2013) "Egypt’s Post Revolution
Development Path From A Dynamic Economy Wide Model – A Goal Seeking
Analysis" Proceedings of the International Conference on Economic Policy
Modeling (EcoMod12), Prague, July 1-3.
[13] Ministry of Planning and International Co-operation (2010), "Strategic
Framework for Socio-economic Development Plan until 2022", Ministry of
Planning and International Co-operation, Cairo.
[14] Ministry of Planning and International Co-operation (2011), "Follow up
report – 2010/2011", Ministry of Planning and International Co-operation,
Cairo.
21
[15] Ministry of Planning and International Co-operation (2012), "Follow up
report – 2011/2012", Ministry of Planning and International Co-operation,
Cairo.
[16] Ministry of Planning and International Co-operation (2013), "Follow up
report – 2012/2013", Ministry of Planning and International Co-operation,
Cairo.
[17] Ministry of Planning and International Co-operation (2009), "National
Accounts 2008/2009", Ministry of Planning and International Co-operation,
Cairo.
[18] Ministry of Planning and International Co-operation (2013), "An urgen
plan for economic recovery", Ministry of Planning and International Co-
operation, Cairo.
[19] Pyatt, G. and J. Round (1985), "Social Accounting Matrices: A Basis for
Planning, World Bank Publication.", Washington, D.C.
22