Embed Size (px)
Citation preview
Fujiku
ra Ltd. A
NN
UA
L REPO
RT 2016
Fujiku
ra Ltd. A
NN
UA
L REPO
RT 2016
2 Fujikura Annual Report 2016 Fujikura Annual Report 2016 3
“Tsunagu”Technology
Fujikura Group Corporate Philosophy
MissionThe Fujikura Group will contribute to the creation of value for customers by using “Tsunagu” (the Japanese word meaning “connecting”) technologies.
Vision• Fujikura’svisionistobecomethemosttrustedpartnerinthemarketandtopositively
impact our communities and our customers by delivering superior solutions. •Wewillbeaworldleaderinourmarketsbyemploying“Tsunagu”technologiesandby
continuously developing innovative and useful products and solutions. •WithinFujikura,eachindividualwillstrivetocontributeasaleaderandthereby
develop a team that truly differentiates Fujikura in the global market.
Core ValuesCustomer Satisfaction “Are you winning customer’s satisfaction?”
Change “Are you willing to take up challenges to drive progress?”
Collaboration “As a Fujikura associate, are you striving to work together to deliver the best possible result and to fulfill your capability and potential?”
Behavior Standards• Alwaysconsiderthecustomerfirst.Makecustomersatisfactionyourhighestpriority.• Considerwhattoacceptandwhattoreject.• Identifyanddemonstratecleargoals.• Stayaheadofemergingtechnologiesandconnectpeopleandsolutionstothe
communities we serve.• Chooseyouractionsbasedonfacts.
“Tsunagu” Technology ................................................... 2
At a Glance ..................................................................... 4
Financial Highlight ......................................................... 6
President’s Message ....................................................... 8
2015 Mid-term Business Plan Review .......................... 11
2020 Mid-term Business Plan ....................................... 12
Company Profile ........................................................... 16
Recognized as IEEE Milestone ...................................... 23
New Business Development ......................................... 24
Research Topics for Future Growth .............................. 26
Table of ContentsCorporate Social Responsibility ................................... 28
Board of Directors, Auditors and Officers .................... 32
Corporate Governance ................................................. 33
Risks ............................................................................. 35
Financial Section .......................................................... 37
Management Discussion & Analysis ............................. 38
Financial Review ........................................................... 40
Global Network ............................................................ 70
Main Consolidated Subsidiaries/Investor Information ... 71
Japan41China
21
EMEA22
Asia & Oceania
22 Americas36
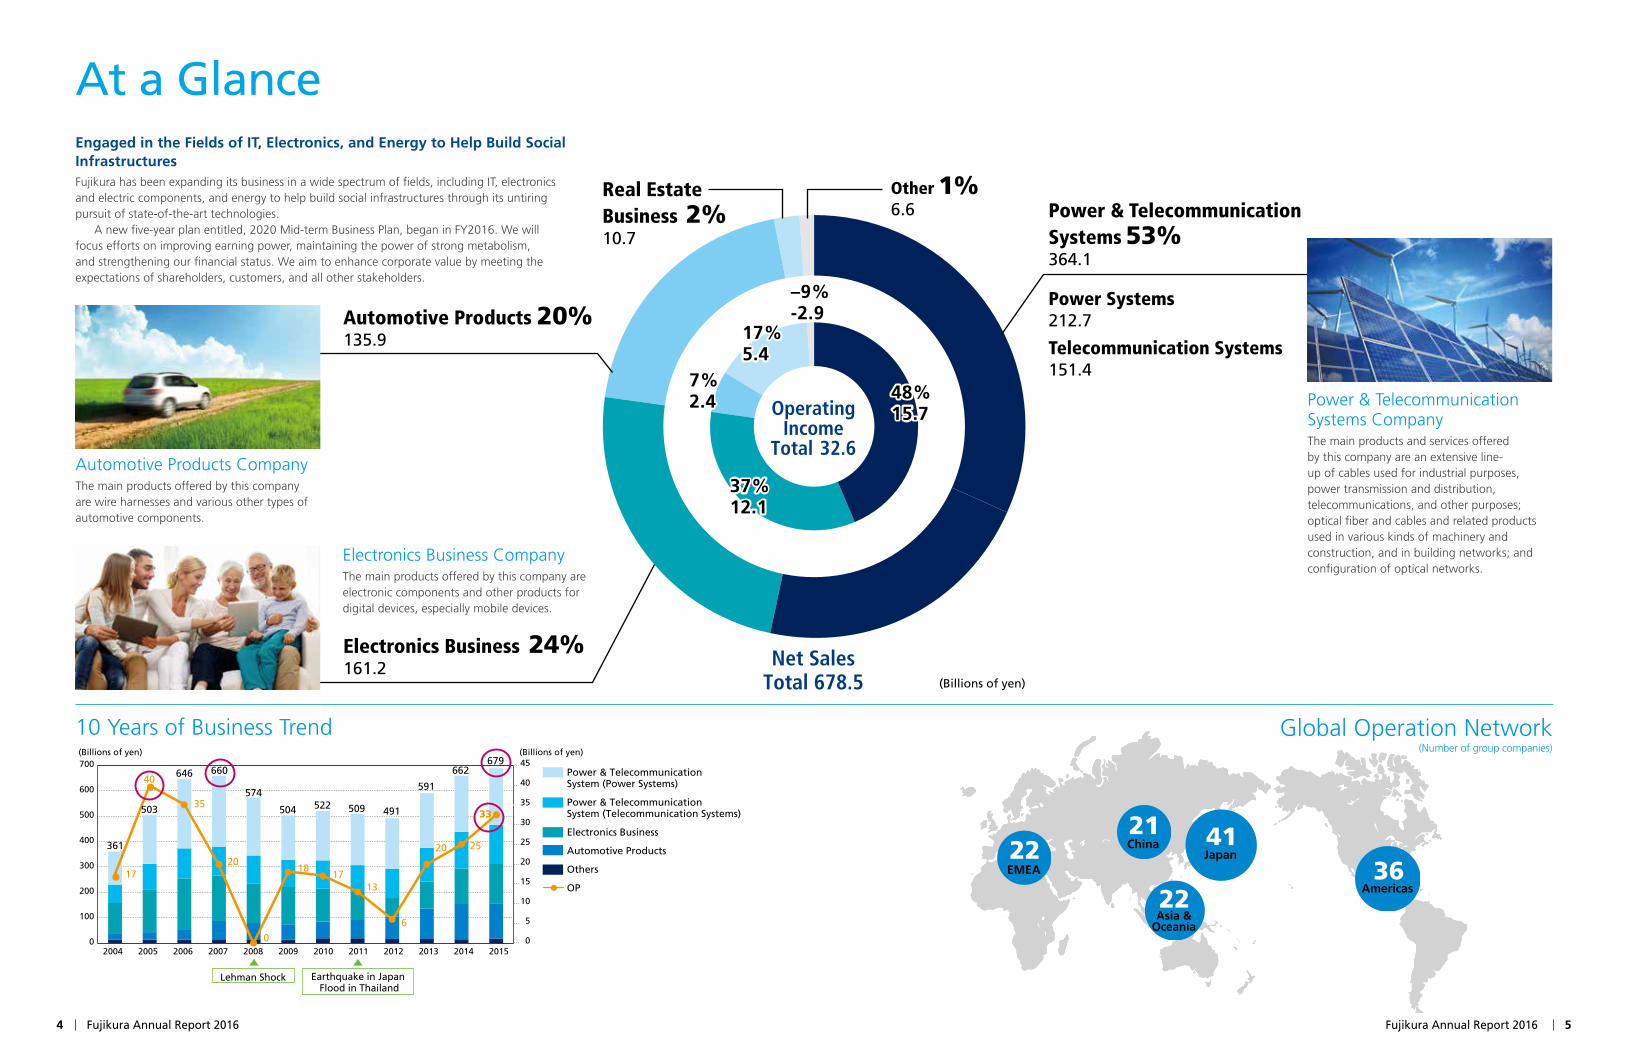
Net SalesTotal 678.5
Electronics Business 24%161.2
(Billions of yen)
Automotive Products 20%135.9
Real EstateBusiness 2%10.7
Other 1%6.6 Power & Telecommunication
Systems 53%364.1
Power Systems212.7
Telecommunication Systems151.4
48%15.748%15.7
37%12.137%12.1
7%2.47%2.4
17%5.417%5.4
–9%-2.9–9%-2.9
OperatingIncome
Total 32.6
Power & Telecommunication Systems Company The main products and services offered by this company are an extensive line-up of cables used for industrial purposes, power transmission and distribution, telecommunications, and other purposes; optical fiber and cables and related products used in various kinds of machinery and construction, and in building networks; and configuration of optical networks.
Global Operation Network(Number of group companies)
10 Years of Business Trend
Automotive Products CompanyThe main products offered by this company are wire harnesses and various other types of automotive components.
0
100
200
300
400
500
600
700
0
5
10
15
20
25
30
35
40
45
2004 2005 2006 2007 2008
Lehman Shock Earthquake in Japan Flood in Thailand
2009 2010 2011 2012 2013 2014 2015
361
503
(Billions of yen) (Billions of yen)
17
40
35
20
0
1817
13
6
20 25
646 660
574
504 522 509 491
591
662679
Power & Telecommunication System (Power Systems)
Power & Telecommunication System (Telecommunication Systems)
Electronics Business
Automotive Products
Others
OP
33
Engaged in the Fields of IT, Electronics, and Energy to Help Build Social InfrastructuresFujikura has been expanding its business in a wide spectrum of fields, including IT, electronics and electric components, and energy to help build social infrastructures through its untiring pursuit of state-of-the-art technologies.
A new five-year plan entitled, 2020 Mid-term Business Plan, began in FY2016. We will focus efforts on improving earning power, maintaining the power of strong metabolism, and strengthening our financial status. We aim to enhance corporate value by meeting the expectations of shareholders, customers, and all other stakeholders.
Electronics Business CompanyThe main products offered by this company are electronic components and other products for digital devices, especially mobile devices.
4 Fujikura Annual Report 2016 Fujikura Annual Report 2016 5
At a Glance
Millions ofyen
Thousands ofU.S. dollars
FY2011 FY2012 FY2013
For the Year
Net Sales
Results Improved
Operating Income 20,345 25,075 289,753
Capital Expenditures 25,463 24,637 283,955
At Year-End
¥537,281 ¥577,567 $4,907,459
Total Net Assets
Total Assets
207,242 234,527 1,935,544
Number of Employees 53,409 52,452
Per Share Data
Net Income (Loss)—Primary ¥9.99 ¥37.93 $0.33
Net Income—Fully Diluted – – – – –
Cash Dividends 6.00
13,383 6,499
30,980 54,594
¥489,479 ¥528,900
184,235 204,771
50,463 52,409
¥ (17.28) ¥8.65
5.00 5.00 7.00 0.07
Operating Income, Ratio of Operating Income to Net SalesNet Sales by Segment FY 2015
Capital Expenditures, Research and Development Expenses
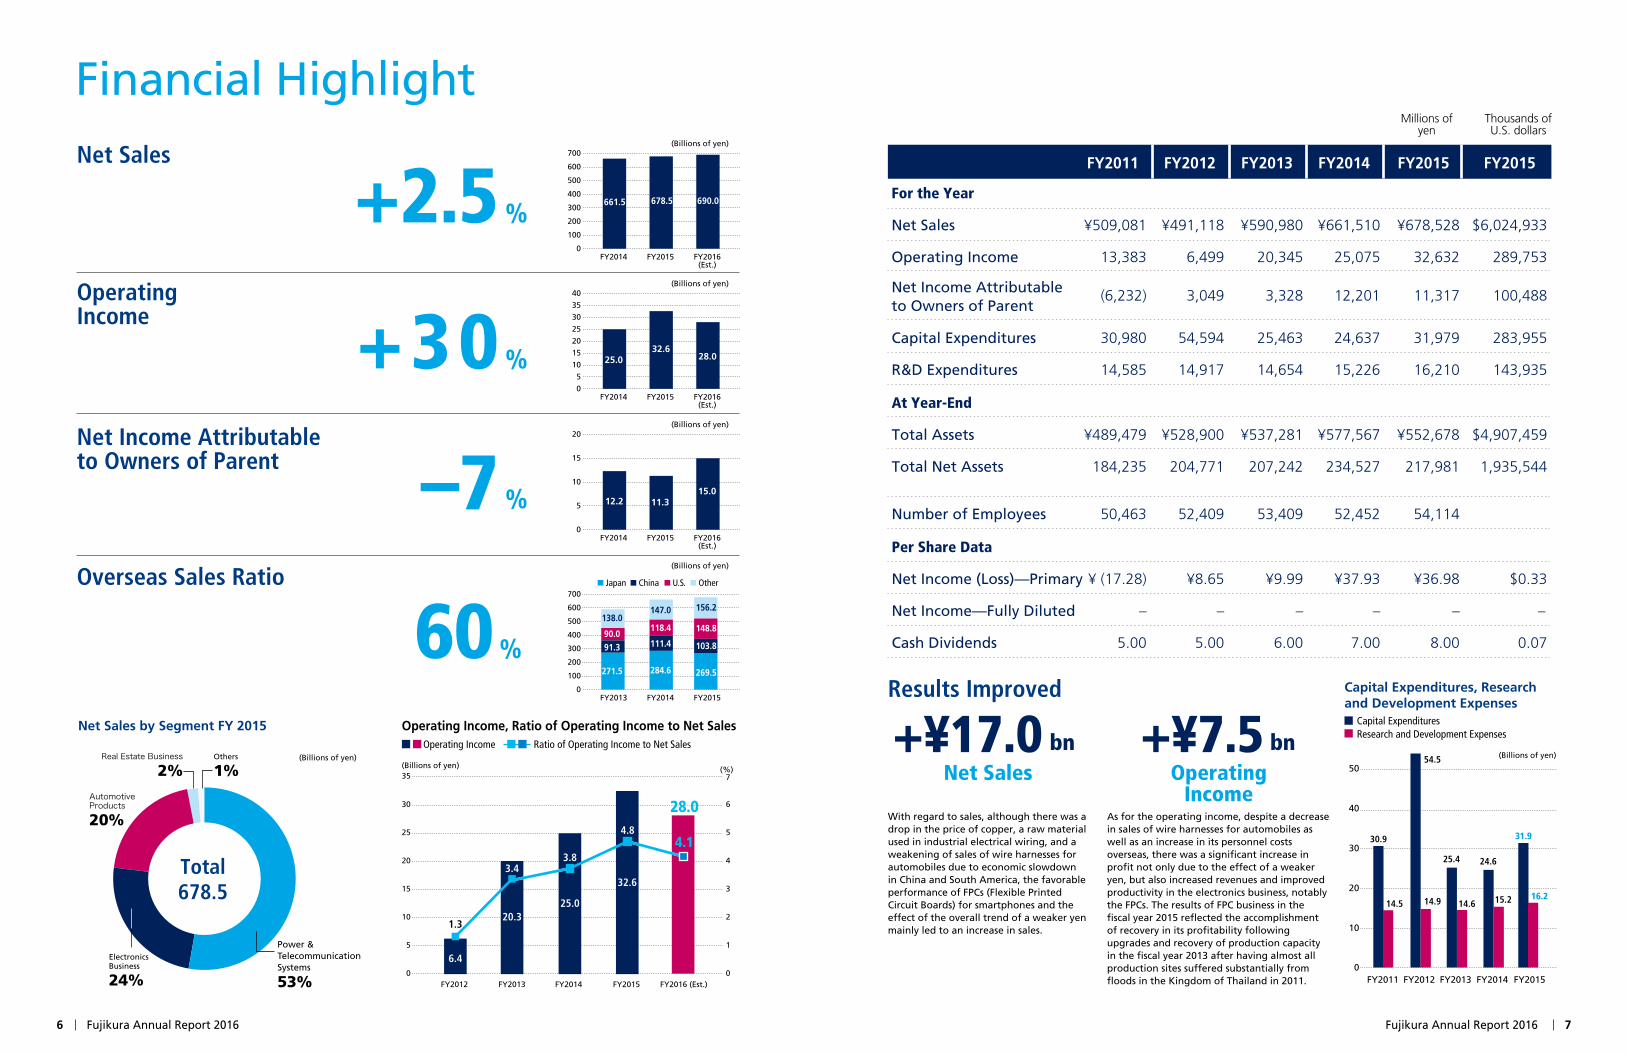
With regard to sales, although there was a drop in the price of copper, a raw material used in industrial electrical wiring, and a weakening of sales of wire harnesses for automobiles due to economic slowdown in China and South America, the favorable performance of FPCs (Flexible Printed Circuit Boards) for smartphones and the effect of the overall trend of a weaker yen mainly led to an increase in sales.
As for the operating income, despite a decrease in sales of wire harnesses for automobiles as well as an increase in its personnel costs overseas, there was a significant increase in profit not only due to the effect of a weaker yen, but also increased revenues and improved productivity in the electronics business, notably the FPCs. The results of FPC business in the fiscal year 2015 reflected the accomplishment of recovery in its profitability following upgrades and recovery of production capacity in the fiscal year 2013 after having almost all production sites suffered substantially from floods in the Kingdom of Thailand in 2011.
+¥17.0 Net Sales
+¥7.5Operating
Income
bn bn
+2.5%
FY2014 FY2015
(Billions of yen)(Billions of yen)
(Billions of yen)
5
10
25
30
15
20
1
2
5
3
4
0 0
6
735
FY2012 FY2013
6.4
1.3
FY2015
25.0
3.8
FY2014
20.3
3.4
FY2016 (Est.)
32.6
4.8
28.0
4.1
(%)
Operating Income Ratio of Operating Income to Net Sales
Japan China U.S. Other
Net Sales ¥590,980 ¥661,510 $6,024,933
Net Income Attributableto Owners of Parent
3,328 12,201 100,488
R&D Expenditures 14,654 15,226
32,632
31,979
¥552,678
217,981
54,114
¥36.98
–
8.00
FY2015
¥678,528
11,317
16,210 143,935
¥509,081 ¥491,118
(6,232) 3,049
14,585 14,917
Real Estate Business
2%Others
1%AutomotiveProducts
20%
ElectronicsBusiness
24%
Power &TelecommunicationSystems
53%
10
0
20
30
40
50
FY2014 FY2015
24.6
15.2
(Billions of yen)
FY2011 FY2012 FY2013
30.9
54.5
14.5
31.9
16.214.9
25.4
14.6
Capital ExpendituresResearch and Development Expenses
FY2016(Est.)
FY2014 FY2015
Operating Income +30%
%
Net Income Attributableto Owners of Parent –7Overseas Sales Ratio
60%
Total678.5
0
100
200
300
400
500
600
700
(Billions of yen)
FY2016(Est.)
FY2014 FY20150
5
10
15
20
25
30
35
40
25.032.6
28.0
661.5 678.5 690.0
(Billions of yen)
(Billions of yen)
FY2016(Est.)
FY2014 FY20150
5
10
15
20
12.2 11.315.0
FY2015FY2013 FY20140
100
200
300
400
500
600
700
271.5
91.390.0
138.0
284.6
111.4
118.4
147.0
269.5
103.8
148.8
156.2
6 Fujikura Annual Report 2016 Fujikura Annual Report 2016 7
Financial Highlight
We want to become a company that holds future promise and will continue into the future based on high earning power and the power of strong metabolism. In quantitative terms, we achieved 80% of the 2015 Mid-term Business Plan. Our goal is to become a company with even greater earning power during the 2020 Mid-term Business Plan. We simultaneously want to transform into a company with sound financial status. The plan for 2016 is consequently the launching point for the 2020 Mid-term Business Plan that we will work to achieve over the next five years. A team approach is important in order to achieve this goal, and we want to be meticulous in preparations so we can guide the company to certain success in achieving the 2020 Mid-term Business Plan.
In 2011, the initial year of the 2015 Mid-term Business Plan, the Great East Japan Earthquake occurred on March 11, and the great floods in the Kingdom of Thailand occurred that fall. The floods in Thailand were a particularly unprecedented disaster, flooding 9 of our 11 sites in Thailand. This caused severe damage to the production capacity of the Electronics Business Company.
We also managed to achieve our goal of commercializing the fiber laser business, one of Fujikura’s initiatives in new business areas targeted at the future.
During the course of the 2015 Mid-term Business Plan, we achieved growth in both sales and income for four consecutive periods after hitting bottom in 2012 as a result of the impact suffered in 2011 from the abovementioned disasters. We were also able to achieve roughly 80% of the goal set for the operating margin in the final year of the 2015 Mid-term Business Plan, giving us a real sense of having recovered our earning power in our core business.
Ordinary income increased on the back of foreign exchange translation gains from the weak yen and an increase in demand for the Electronics Business Company products. (Income grew even with the foreign exchange gains excluded.) Net income declined as a result of extraordinary losses posted on structural reforms.
(Billions of yen)
FY2014 FY2015 Change
Net Sales 661.5 678.5 +17.0
Operating Income 25.0 32.6 +7.6
Ordinary Income 21.0 24.6 +3.6
Net Income Attributable to the Parent Company 12.2 11.3 -0.9
(Billions of yen)
2015 Mid-term Plan FY2015 Results
Total Company Net Sales Ratio of Operating Income to Net Sales Net Sales Ratio of Operating
Income to Net Sales
Total Company 650.0 6.3% 678.5 4.8%
Excluding New Businesses Not Incorporated in the 2015 Mid-term Plan
671.9 5.3%
The ratio of operating income to net sales in the final year of the 2015 Mid-term Business Plan achieved roughly 80% of the goal.
During the initial year of the 2020 Mid-term Business Plan, we will continue to work on “improving earning power” and “the power of strong metabolism,” the basic policy of the 2015 Mid-term Business Plan. We will also take definitive action on issues that surfaced. We intend to push forward steadfastly on the following four key measures to become a perpetually sustainable company driven by improving earning power and the power of a strong metabolism.
FY2015 Results, the Final Year of the 2015 Mid-term Plan
Main Direction/A Brief Statement on the Mid-term Plan
Reflecting Back on the Completion of the 2015 Mid-term Business Plan
Comparison to the 2015 Mid-term Plan
Key Measures in the 2020 Mid-term Business Plan
Fujikura Annual Report 2016 9
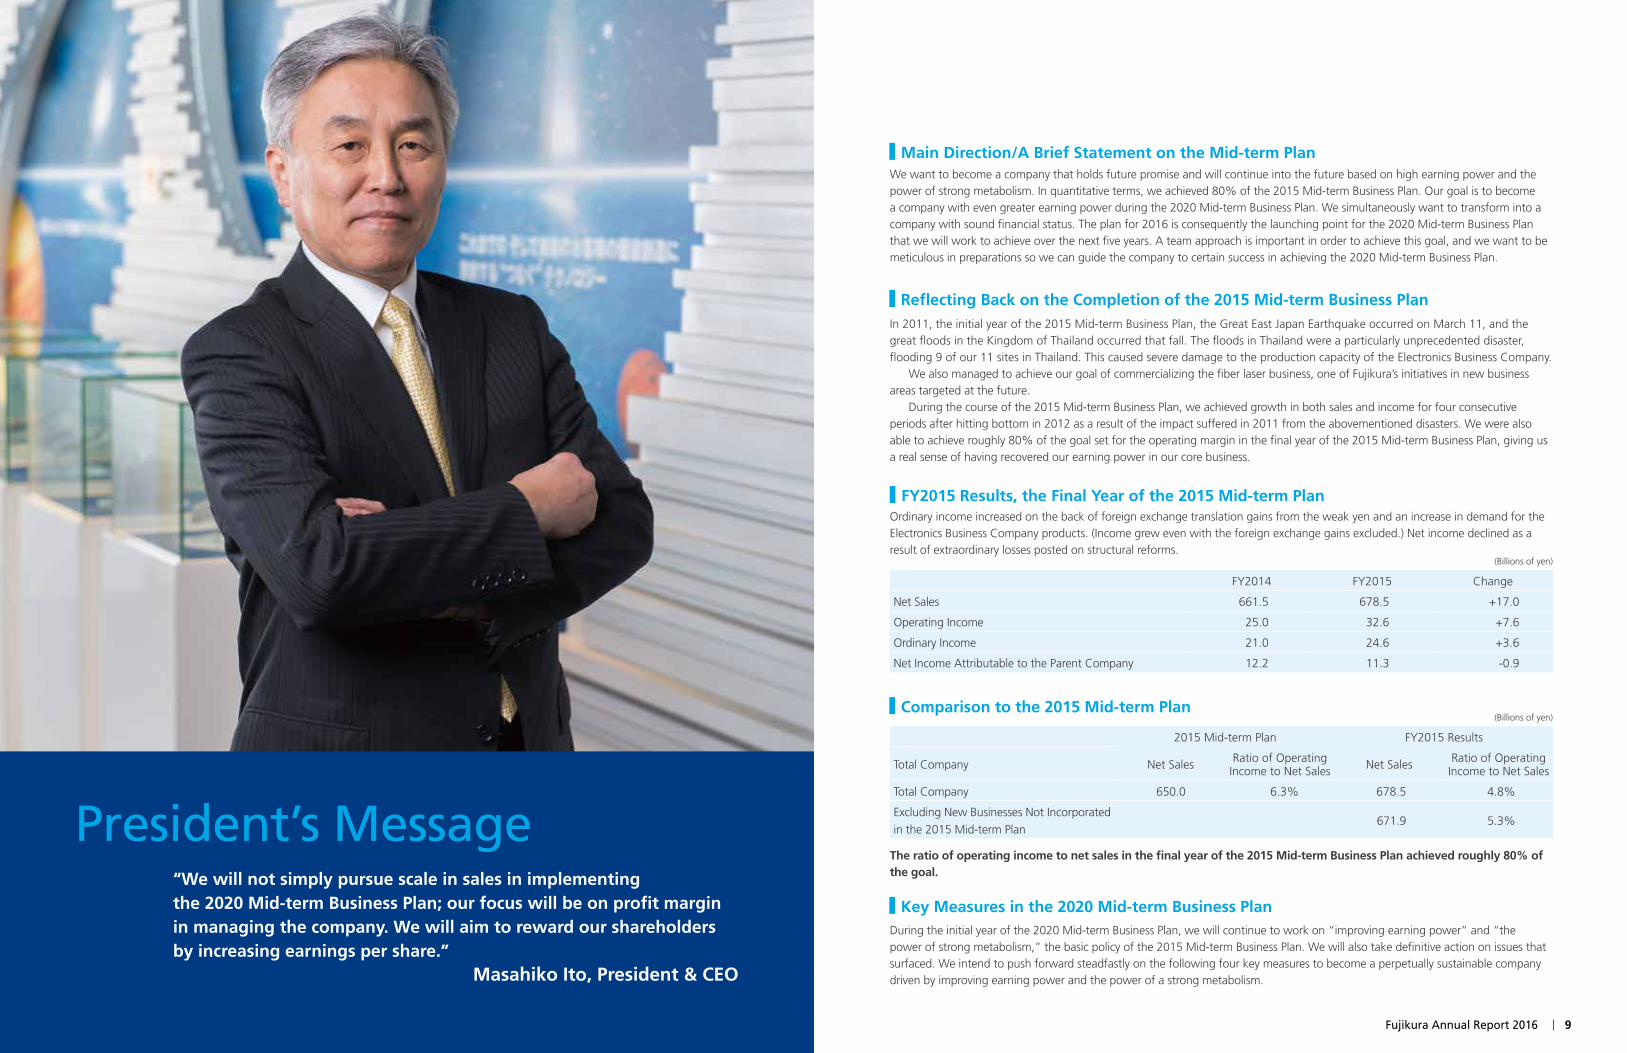
“We will not simply pursue scale in sales in implementing the 2020 Mid-term Business Plan; our focus will be on profit margin in managing the company. We will aim to reward our shareholders by increasing earnings per share.”
Masahiko Ito, President & CEO
President’sMessage
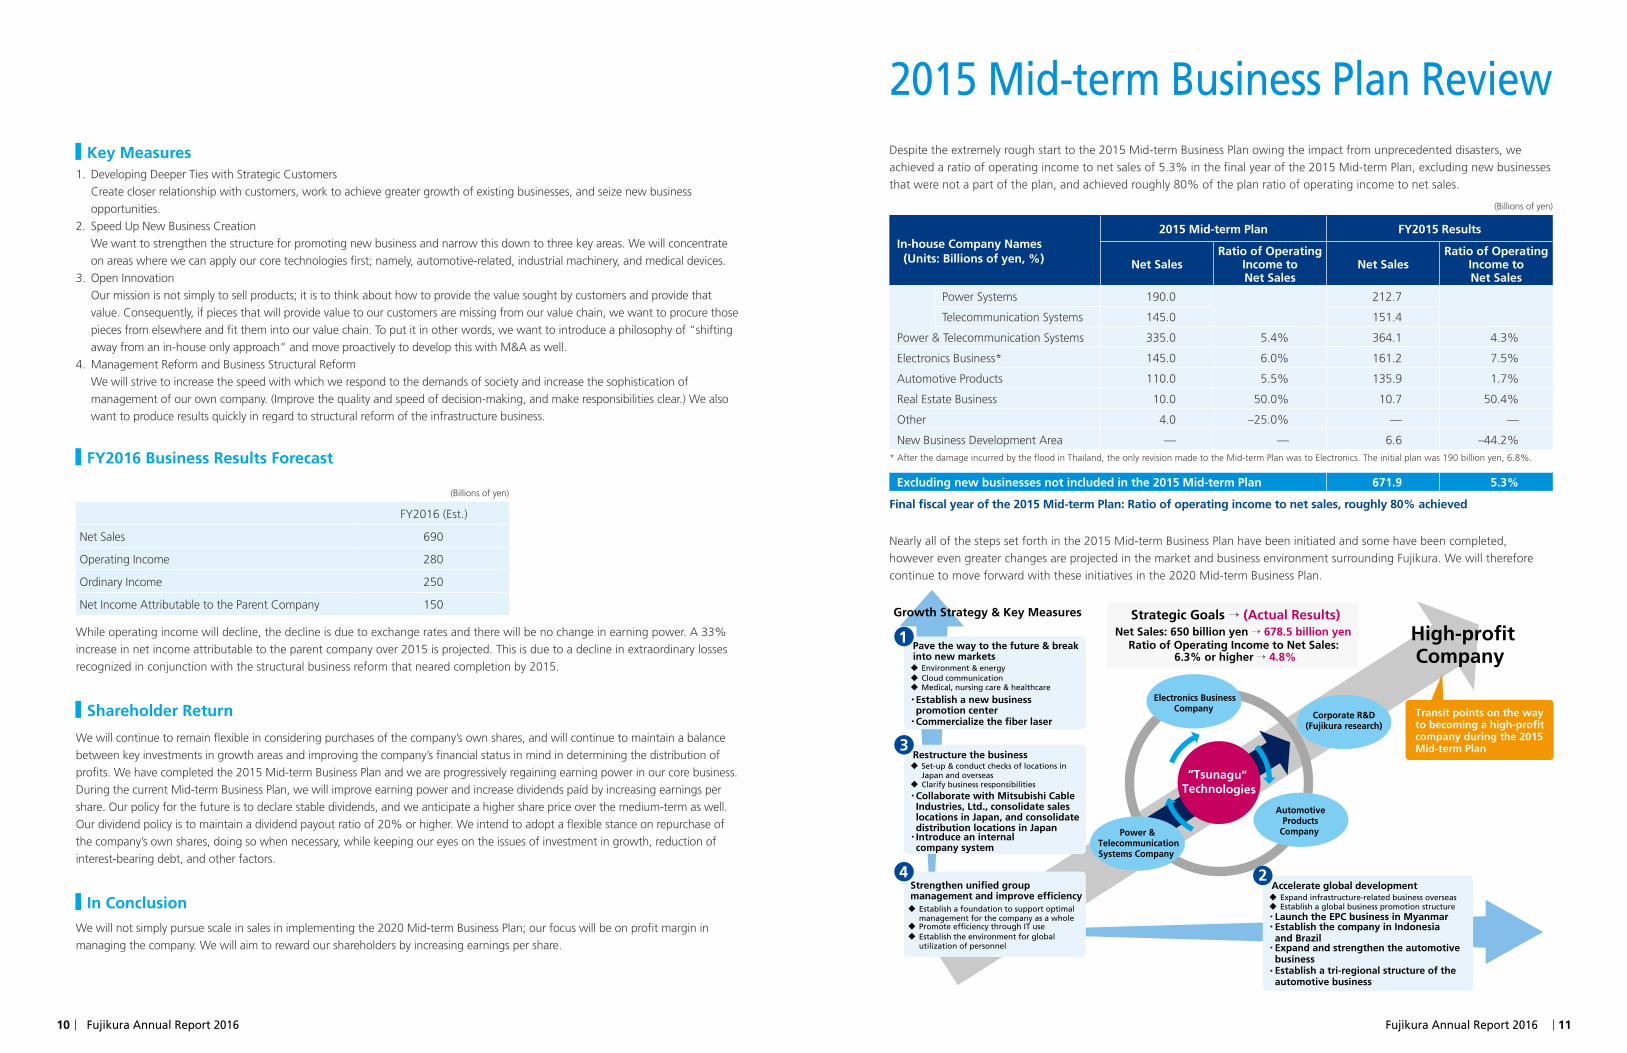
Despite the extremely rough start to the 2015 Mid-term Business Plan owing the impact from unprecedented disasters, we achieved a ratio of operating income to net sales of 5.3% in the final year of the 2015 Mid-term Plan, excluding new businesses that were not a part of the plan, and achieved roughly 80% of the plan ratio of operating income to net sales.
Nearly all of the steps set forth in the 2015 Mid-term Business Plan have been initiated and some have been completed, however even greater changes are projected in the market and business environment surrounding Fujikura. We will therefore continue to move forward with these initiatives in the 2020 Mid-term Business Plan.
1
3
4 2
Transit points on the way to becoming a high-profit company during the 2015 Mid-term Plan
High-profitCompany
Strategic Goals � (Actual Results) Net Sales: 650 billion yen � 678.5 billion yen
Ratio of Operating Income to Net Sales: 6.3% or higher � 4.8%
Growth Strategy & Key Measures
Restructure the businessSet-up & conduct checks of locations inJapan and overseas Clarify business responsibilities
Accelerate global development
Pave the way to the future & breakinto new markets
Environment & energy Cloud communicationMedical, nursing care & healthcare
Expand infrastructure-related business overseasEstablish a global business promotion structure
Corporate R&D(Fujikura research)
Strengthen unified group management and improve efficiency
Establish a foundation to support optimalmanagement for the company as a whole Promote efficiency through IT useEstablish the environment for globalutilization of personnel
Collaborate with Mitsubishi CableIndustries, Ltd., consolidate saleslocations in Japan, and consolidatedistribution locations in Japan
Introduce an internalcompany system
Establish a new business promotion center
Commercialize the fiber laser
Launch the EPC business in Myanmar
Establish the company in Indonesia and Brazil
Expand and strengthen the automotive business Establish a tri-regional structure of the automotive business
Power & TelecommunicationSystems Company
Electronics BusinessCompany
AutomotiveProducts
Company
“Tsunagu” Technologies
1. Developing Deeper Ties with Strategic Customers Create closer relationship with customers, work to achieve greater growth of existing businesses, and seize new business
opportunities.2. Speed Up New Business Creation We want to strengthen the structure for promoting new business and narrow this down to three key areas. We will concentrate
on areas where we can apply our core technologies first; namely, automotive-related, industrial machinery, and medical devices.3. Open Innovation Our mission is not simply to sell products; it is to think about how to provide the value sought by customers and provide that
value. Consequently, if pieces that will provide value to our customers are missing from our value chain, we want to procure those pieces from elsewhere and fit them into our value chain. To put it in other words, we want to introduce a philosophy of “shifting away from an in-house only approach” and move proactively to develop this with M&A as well.
4. Management Reform and Business Structural Reform We will strive to increase the speed with which we respond to the demands of society and increase the sophistication of
management of our own company. (Improve the quality and speed of decision-making, and make responsibilities clear.) We also want to produce results quickly in regard to structural reform of the infrastructure business.
(Billions of yen)
FY2016 (Est.)
Net Sales 690
Operating Income 280
Ordinary Income 250
Net Income Attributable to the Parent Company 150
While operating income will decline, the decline is due to exchange rates and there will be no change in earning power. A 33% increase in net income attributable to the parent company over 2015 is projected. This is due to a decline in extraordinary losses recognized in conjunction with the structural business reform that neared completion by 2015.
We will continue to remain flexible in considering purchases of the company’s own shares, and will continue to maintain a balance between key investments in growth areas and improving the company’s financial status in mind in determining the distribution of profits. We have completed the 2015 Mid-term Business Plan and we are progressively regaining earning power in our core business. During the current Mid-term Business Plan, we will improve earning power and increase dividends paid by increasing earnings per share. Our policy for the future is to declare stable dividends, and we anticipate a higher share price over the medium-term as well. Our dividend policy is to maintain a dividend payout ratio of 20% or higher. We intend to adopt a flexible stance on repurchase of the company’s own shares, doing so when necessary, while keeping our eyes on the issues of investment in growth, reduction of interest-bearing debt, and other factors.
We will not simply pursue scale in sales in implementing the 2020 Mid-term Business Plan; our focus will be on profit margin in managing the company. We will aim to reward our shareholders by increasing earnings per share.
Key Measures
FY2016 Business Results Forecast
Shareholder Return
In Conclusion
10 Fujikura Annual Report 2016 Fujikura Annual Report 2016 11
2015Mid-termBusinessPlanReview
(Billions of yen)
In-house Company Names (Units: Billions of yen, %)
2015 Mid-term Plan FY2015 Results
Net SalesRatio of Operating
Income to Net Sales
Net SalesRatio of Operating
Income to Net Sales
Power Systems 190.0 212.7
Telecommunication Systems 145.0 151.4
Power & Telecommunication Systems 335.0 5.4% 364.1 4.3%
Electronics Business* 145.0 6.0% 161.2 7.5%
Automotive Products 110.0 5.5% 135.9 1.7%
Real Estate Business 10.0 50.0% 10.7 50.4%
Other 4.0 –25.0% — —
New Business Development Area — — 6.6 –44.2%* After the damage incurred by the flood in Thailand, the only revision made to the Mid-term Plan was to Electronics. The initial plan was 190 billion yen, 6.8%.
Excluding new businesses not included in the 2015 Mid-term Plan 671.9 5.3%
Final fiscal year of the 2015 Mid-term Plan: Ratio of operating income to net sales, roughly 80% achieved
The new five-year business plan begins in FY2016.We intend to accomplish the plan with firm resolve, basically pursuing the same goals throughout the five
year period.We recognize that improving earning power and the power of strong metabolism as the assets of utmost
importance in maintaining well-balanced momentum, not only in achieving the goals of the 2020 Mid-term Business Plan, but also the one after that, and on into the future. We will accomplish this 2020 Mid-term Business Plan based on these two key concepts.
12 Fujikura Annual Report 2016 Fujikura Annual Report 2016 13
Goalsofthe2020Mid-termBusinessPlan
GrowthStrategyandKeyMeasuresWe have adopted the following growth strategy to achieve the goals of the Mid-term plan.
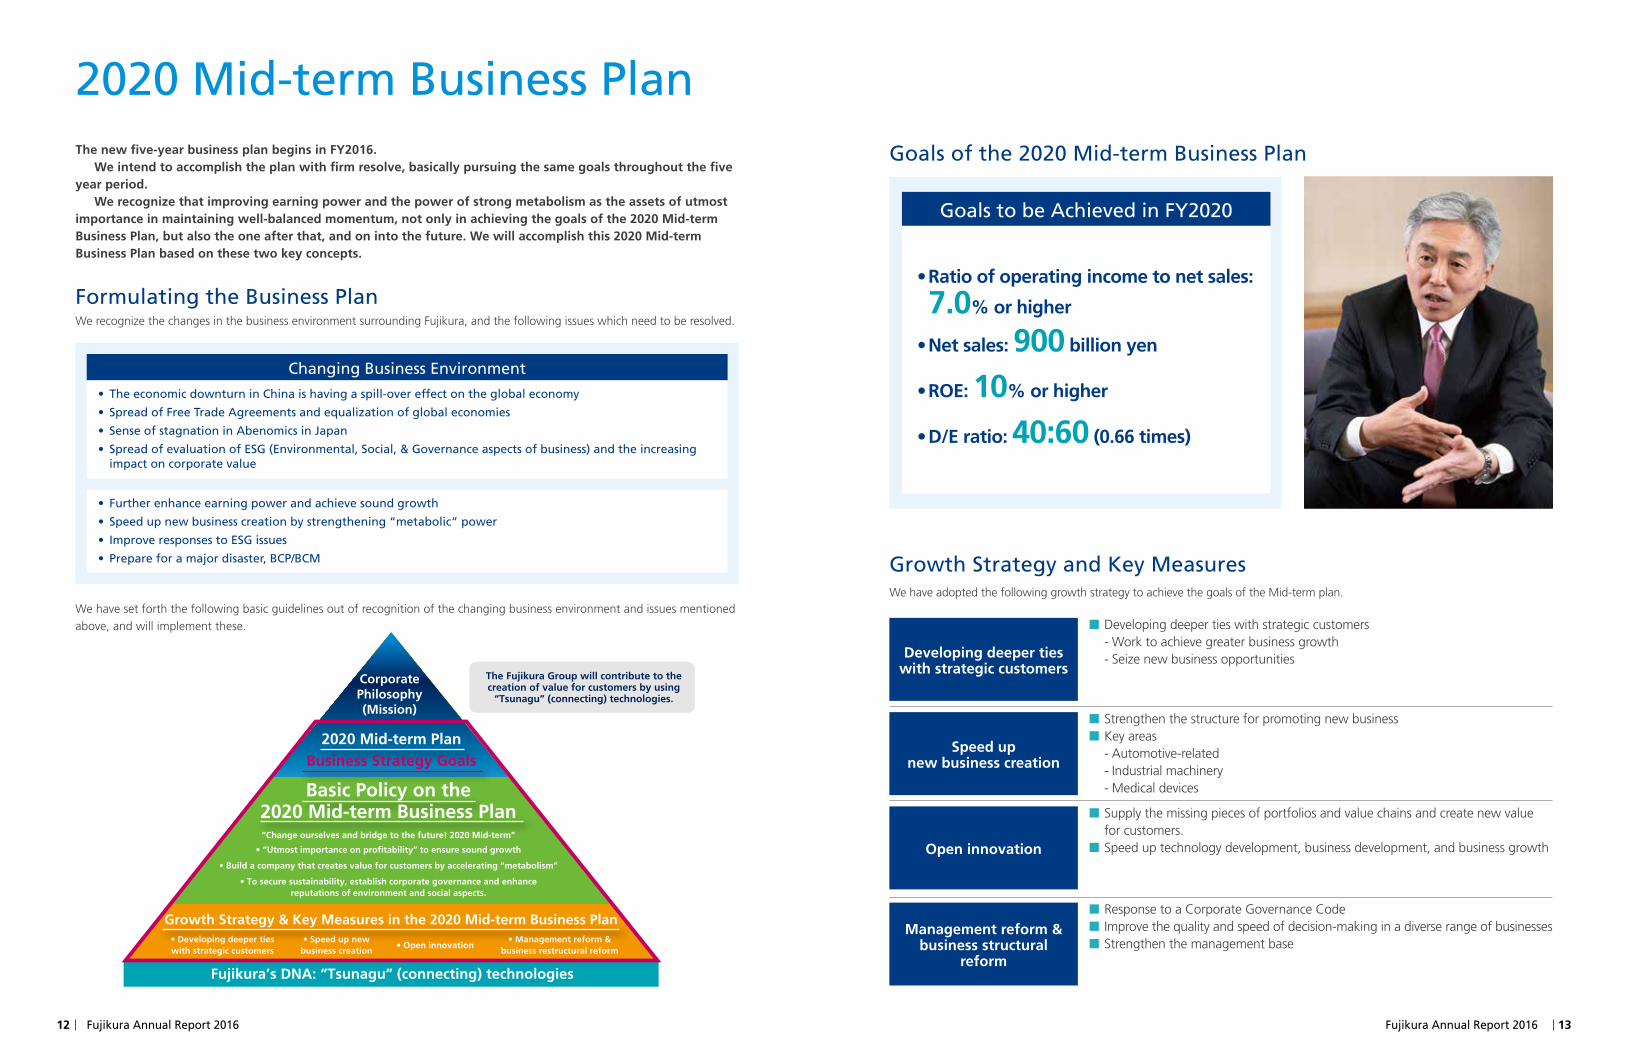
Goals to be Achieved in FY2020
Developing deeper tieswith strategic customers
Speed upnew business creation
Open innovation
Management reform & business structural
reform
•Ratio of operating income to net sales:
7.0% or higher
•Net sales: 900 billion yen
•ROE: 10% or higher
•D/E ratio: 40:60 (0.66 times)
■■ Developing deeper ties with strategic customers - Work to achieve greater business growth - Seize new business opportunities
■■ Strengthen the structure for promoting new business■■ Key areas
- Automotive-related - Industrial machinery - Medical devices
■■ Supply the missing pieces of portfolios and value chains and create new value for customers.■■ Speed up technology development, business development, and business growth
■■ Response to a Corporate Governance Code■■ Improve the quality and speed of decision-making in a diverse range of businesses■■ Strengthen the management base
2020Mid-termBusinessPlan
FormulatingtheBusinessPlanWe recognize the changes in the business environment surrounding Fujikura, and the following issues which need to be resolved.
ChangingBusinessEnvironment
• TheeconomicdownturninChinaishavingaspill-overeffectontheglobaleconomy
• SpreadofFreeTradeAgreementsandequalizationofglobaleconomies
• SenseofstagnationinAbenomicsinJapan
• SpreadofevaluationofESG(Environmental,Social,&Governanceaspectsofbusiness)andtheincreasingimpact on corporate value
• Further enhance earning power and achieve sound growth
• Speedupnewbusinesscreationbystrengthening“metabolic”power
• ImproveresponsestoESGissues
• Prepareforamajordisaster,BCP/BCM
• Developing deeper ties with strategic customers
• Speed up new business creation
• Open innovation• Management reform &
business restructural reform
Fujikura’s DNA: “Tsunagu” (connecting) technologies
The Fujikura Group will contribute to the creation of value for customers by using
“Tsunagu” (connecting) technologies.
Growth Strategy & Key Measures in the 2020 Mid-term Business Plan
Corporate Philosophy(Mission)
2020 Mid-term PlanBusiness Strategy Goals
Basic Policy on the 2020 Mid-term Business Plan“Change ourselves and bridge to the future! 2020 Mid-term”
• “Utmost importance on profitability” to ensure sound growth
• Build a company that creates value for customers by accelerating “metabolism”
• To secure sustainability, establish corporate governance and enhance reputations of environment and social aspects.
We have set forth the following basic guidelines out of recognition of the changing business environment and issues mentioned above, and will implement these.
0
100
200
300
400
500
0
4
8212.7 213.3
225.0
435.0364.1364.1 363.3363.3
151.4 150.0210.0
FY2015Results
FY2016Est.
FY2020Goal
4.3 3.4
7.1
Net Sales
(Billions of yen)
(%)
Power systemsTelecommunication SystemsRatio of Operating Income to Net Sales
0
50
100
150
200
250
300
0
4
8
29.2
30.650.0
34.826.1161.2
25.0265.0
97.2 123.4 190.0
FY2015Results
FY2016Est.
FY2020Goal
7.5
5.06.8
Net Sales
(Billions of yen)
(%)
ConnectorsOther
FPC
Ratio of Operating Income to Net Sales
180.1
0
50
100
150
200
0
3
6
135.9 131.4 5.4
180.0
FY2015Results
FY2016Est.
FY2020Goal
1.7
2.9
Net Sales(Billions of yen) (%)
Ratio of Operating Income to Net Sales
0
600
800
1,000
4
2
6
8
678.5 690.0
810.0
900.0
4.8 4.1
6.27.0
FY2015Results
FY2016Est.
FY2018 FY2020Goal
(%) (Billions of yen)
Net Sales Ratio of Operating Income to Net Sales
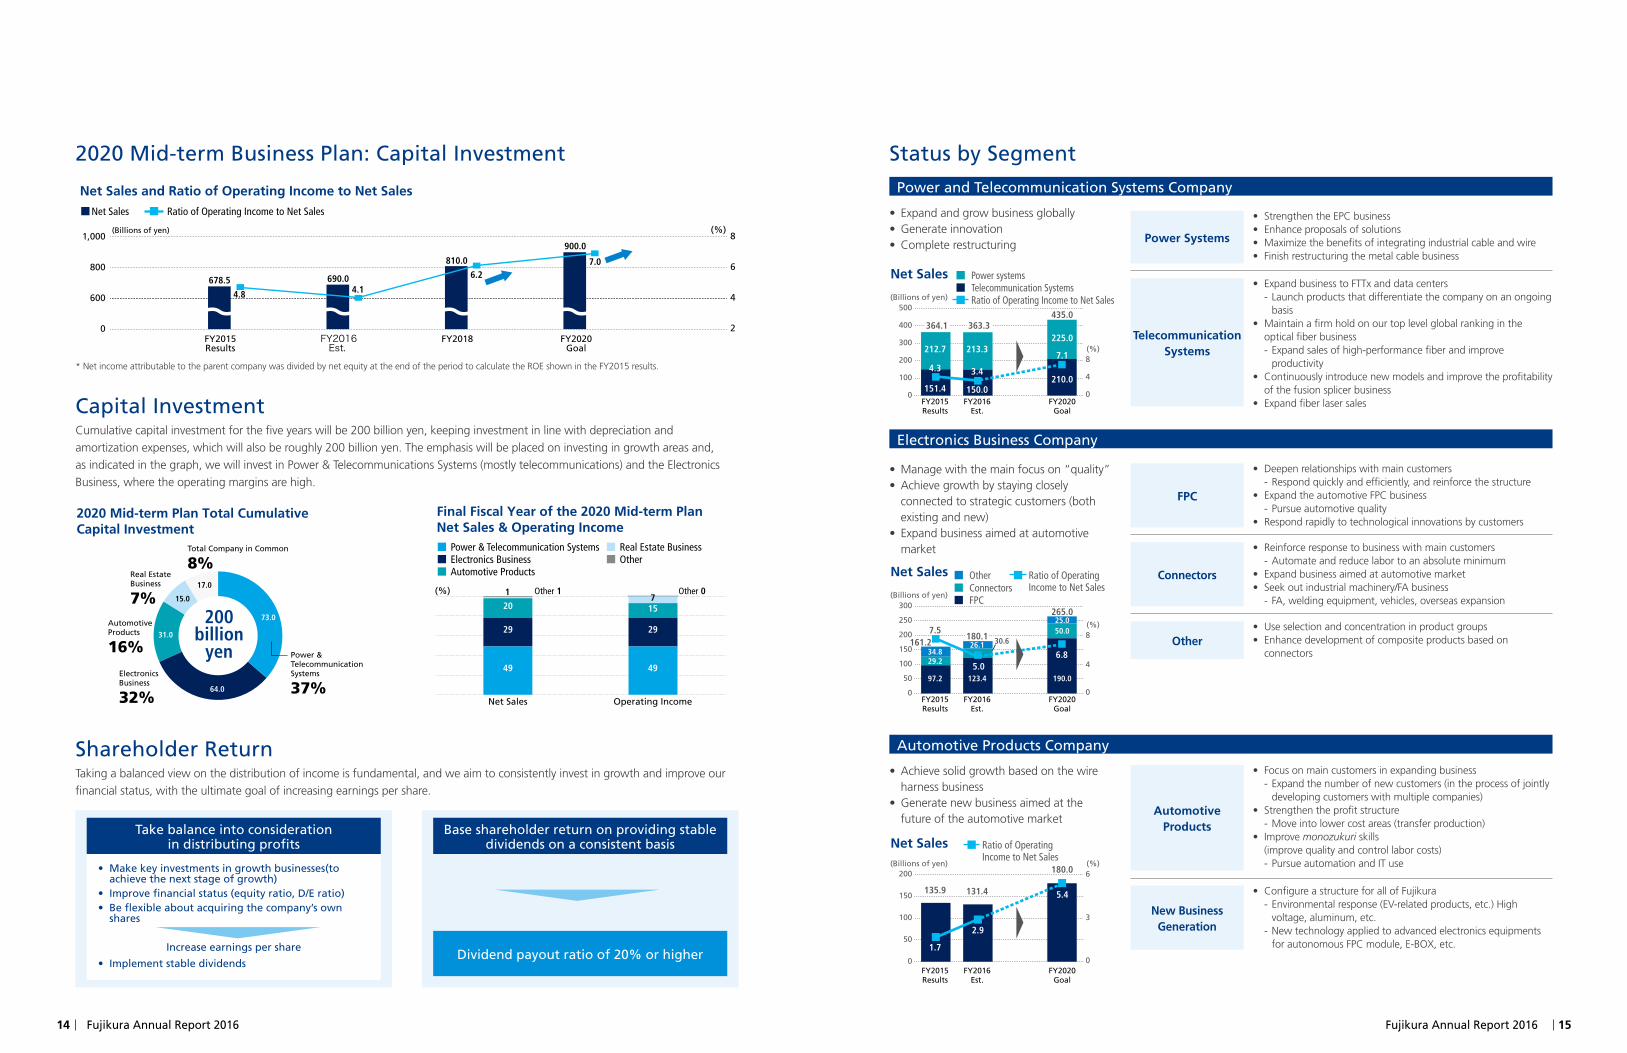
Net Sales and Ratio of Operating Income to Net Sales
* Net income attributable to the parent company was divided by net equity at the end of the period to calculate the ROE shown in the FY2015 results.
14 Fujikura Annual Report 2016 Fujikura Annual Report 2016 15
StatusbySegment
PowerandTelecommunicationSystemsCompany
ElectronicsBusinessCompany
AutomotiveProductsCompany
Power Systems
FPC
Automotive Products
Telecommunication Systems
Connectors
Other
New Business Generation
• Strengthen the EPC business• Enhance proposals of solutions• Maximize the benefits of integrating industrial cable and wire• Finish restructuring the metal cable business
• Deepen relationships with main customers - Respond quickly and efficiently, and reinforce the structure
• Expand the automotive FPC business - Pursue automotive quality
• Respond rapidly to technological innovations by customers
• Focus on main customers in expanding business - Expand the number of new customers (in the process of jointly developing customers with multiple companies)
• Strengthen the profit structure - Move into lower cost areas (transfer production)
• Improve monozukuri skills (improve quality and control labor costs) - Pursue automation and IT use
• Expand business to FTTx and data centers - Launch products that differentiate the company on an ongoing basis
• Maintain a firm hold on our top level global ranking in the optical fiber business - Expand sales of high-performance fiber and improve productivity
• Continuously introduce new models and improve the profitability of the fusion splicer business
• Expand fiber laser sales
• Reinforce response to business with main customers - Automate and reduce labor to an absolute minimum
• Expand business aimed at automotive market• Seek out industrial machinery/FA business
- FA, welding equipment, vehicles, overseas expansion
• Use selection and concentration in product groups• Enhance development of composite products based on
connectors
• Configure a structure for all of Fujikura - Environmental response (EV-related products, etc.) High voltage, aluminum, etc.
- New technology applied to advanced electronics equipments for autonomous FPC module, E-BOX, etc.
• Expand and grow business globally•Generate innovation•Complete restructuring
•Manage with the main focus on “quality”•Achieve growth by staying closely
connected to strategic customers (both existing and new)
• Expand business aimed at automotive market
•Achieve solid growth based on the wire harness business
•Generate new business aimed at the future of the automotive market
2020Mid-termBusinessPlan:CapitalInvestment
CapitalInvestmentCumulative capital investment for the five years will be 200 billion yen, keeping investment in line with depreciation and amortization expenses, which will also be roughly 200 billion yen. The emphasis will be placed on investing in growth areas and, as indicated in the graph, we will invest in Power & Telecommunications Systems (mostly telecommunications) and the Electronics Business, where the operating margins are high.
ShareholderReturnTaking a balanced view on the distribution of income is fundamental, and we aim to consistently invest in growth and improve our financial status, with the ultimate goal of increasing earnings per share.
• Makekeyinvestmentsingrowthbusinesses(toachieve the next stage of growth)
• Improvefinancialstatus(equityratio,D/Eratio)• Beflexibleaboutacquiringthecompany’sown
shares
Increaseearningspershare
• Implementstabledividends
200billion
yen Power &TelecommunicationSystems
37%ElectronicsBusiness
32%
AutomotiveProducts
16%
Real Estate Business
7%
Total Company in Common
8%
73.0
31.0
15.0
17.0
64.0
2020 Mid-term Plan Total Cumulative Capital Investment
Final Fiscal Year of the 2020 Mid-term PlanNet Sales & Operating Income
(%)
Net Sales Operating Income
49
29
157
Other 1 Other 01
49
29
20
Power & Telecommunication SystemsElectronics BusinessAutomotive Products
Real Estate BusinessOther
Dividendpayoutratioof20%orhigher
Take balance into consideration indistributingprofits
Baseshareholderreturnonprovidingstabledividends on a consistent basis
Hideyuki Hosoya SeniorVicePresident&MemberoftheBoard
Fujikura Annual Report 2016 1716 Fujikura Annual Report 2016
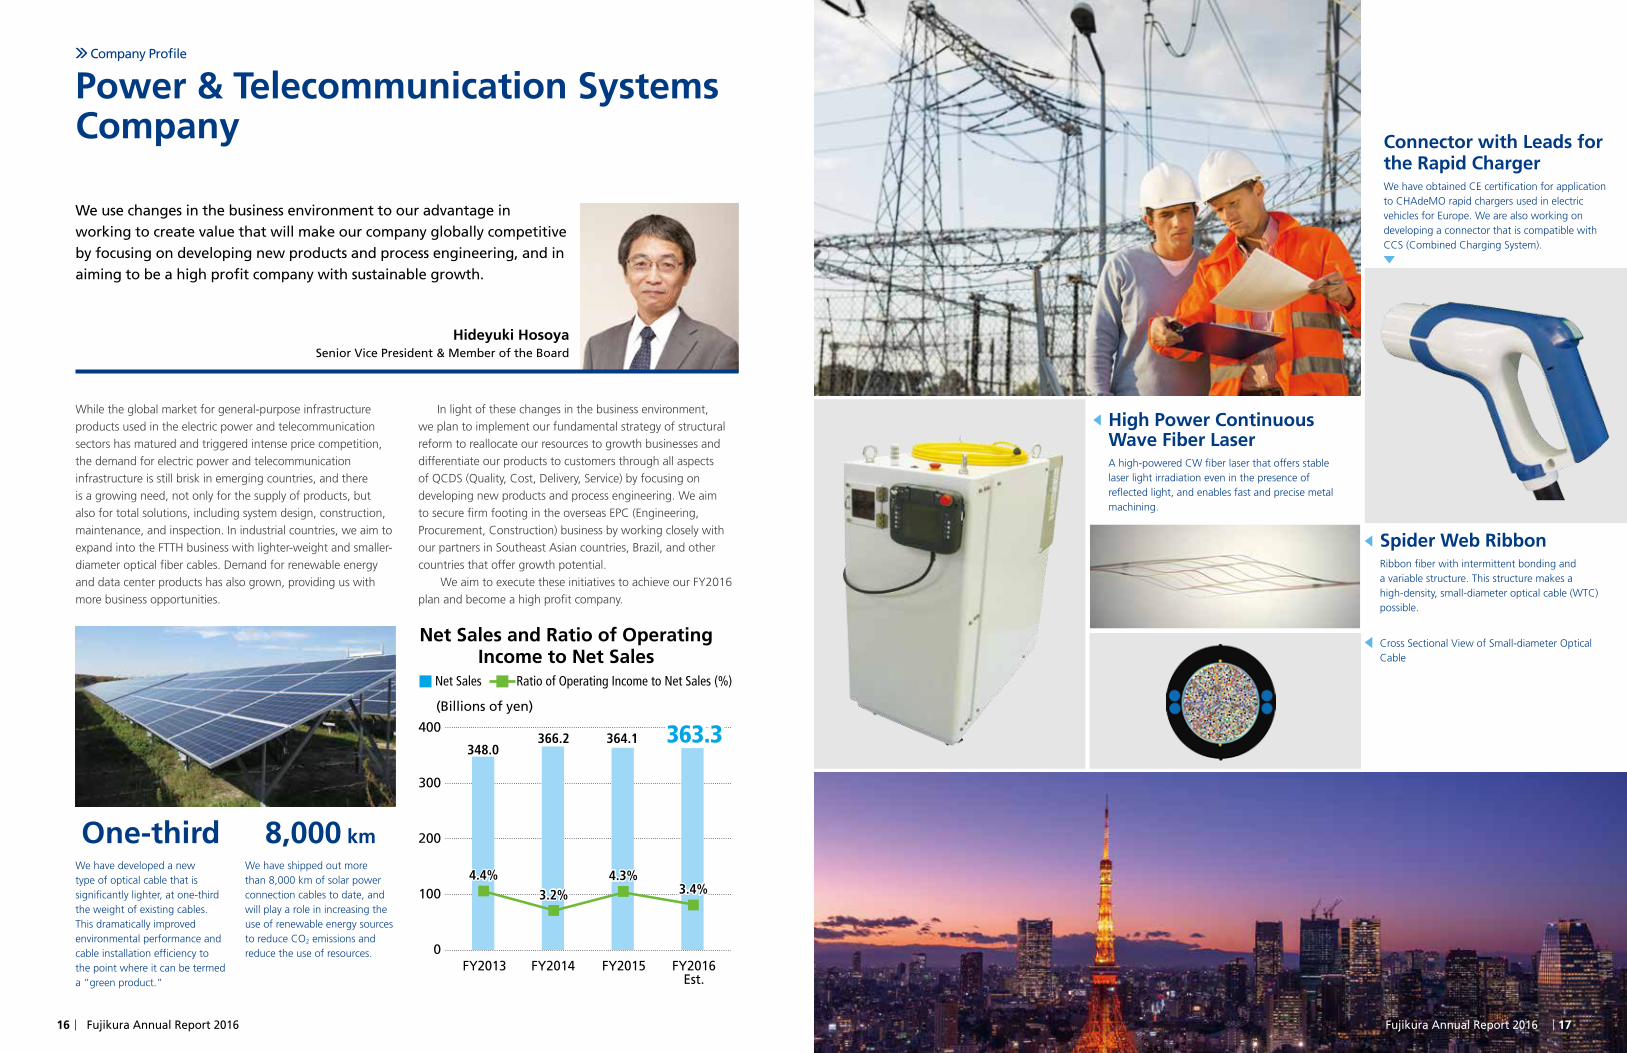
Connector with Leads for the Rapid ChargerWe have obtained CE certification for application to CHAdeMO rapid chargers used in electric vehicles for Europe. We are also working on developing a connector that is compatible with CCS (Combined Charging System).
High Power Continuous Wave Fiber LaserA high-powered CW fiber laser that offers stable laser light irradiation even in the presence of reflected light, and enables fast and precise metal machining.
Spider Web RibbonRibbon fiber with intermittent bonding and a variable structure. This structure makes a high-density, small-diameter optical cable (WTC) possible.
Cross Sectional View of Small-diameter Optical Cable
Weusechangesinthebusinessenvironmenttoouradvantageinworking to create value that will make our company globally competitive byfocusingondevelopingnewproductsandprocessengineering,andinaimingtobeahighprofitcompanywithsustainablegrowth.
While the global market for general-purpose infrastructure products used in the electric power and telecommunication sectors has matured and triggered intense price competition, the demand for electric power and telecommunication infrastructure is still brisk in emerging countries, and there is a growing need, not only for the supply of products, but also for total solutions, including system design, construction, maintenance, and inspection. In industrial countries, we aim to expand into the FTTH business with lighter-weight and smaller-diameter optical fiber cables. Demand for renewable energy and data center products has also grown, providing us with more business opportunities.
In light of these changes in the business environment, we plan to implement our fundamental strategy of structural reform to reallocate our resources to growth businesses and differentiate our products to customers through all aspects of QCDS (Quality, Cost, Delivery, Service) by focusing on developing new products and process engineering. We aim to secure firm footing in the overseas EPC (Engineering, Procurement, Construction) business by working closely with our partners in Southeast Asian countries, Brazil, and other countries that offer growth potential.
We aim to execute these initiatives to achieve our FY2016 plan and become a high profit company.
Net Sales and Ratio of OperatingIncome to Net Sales
(Billions of yen)
FY2013 FY2014
366.2 364.1
FY2015 FY2016Est.
348.0
Net Sales Ratio of Operating Income to Net Sales (%)
0
100
200
300
400
3.4%3.4%4.4%4.4%
3.2%3.2%4.3%4.3%
363.3363.3
Power & Telecommunication Systems Company
One-thirdWe have developed a new type of optical cable that is significantly lighter, at one-third the weight of existing cables.This dramatically improved environmental performance and cable installation efficiency to the point where it can be termed a “green product.”
8,000 kmWe have shipped out more than 8,000 km of solar power connection cables to date, and will play a role in increasing the use of renewable energy sources to reduce CO2 emissions and reduce the use of resources.
CompanyProfile
Fujikura Annual Report 2016 1918 Fujikura Annual Report 2016
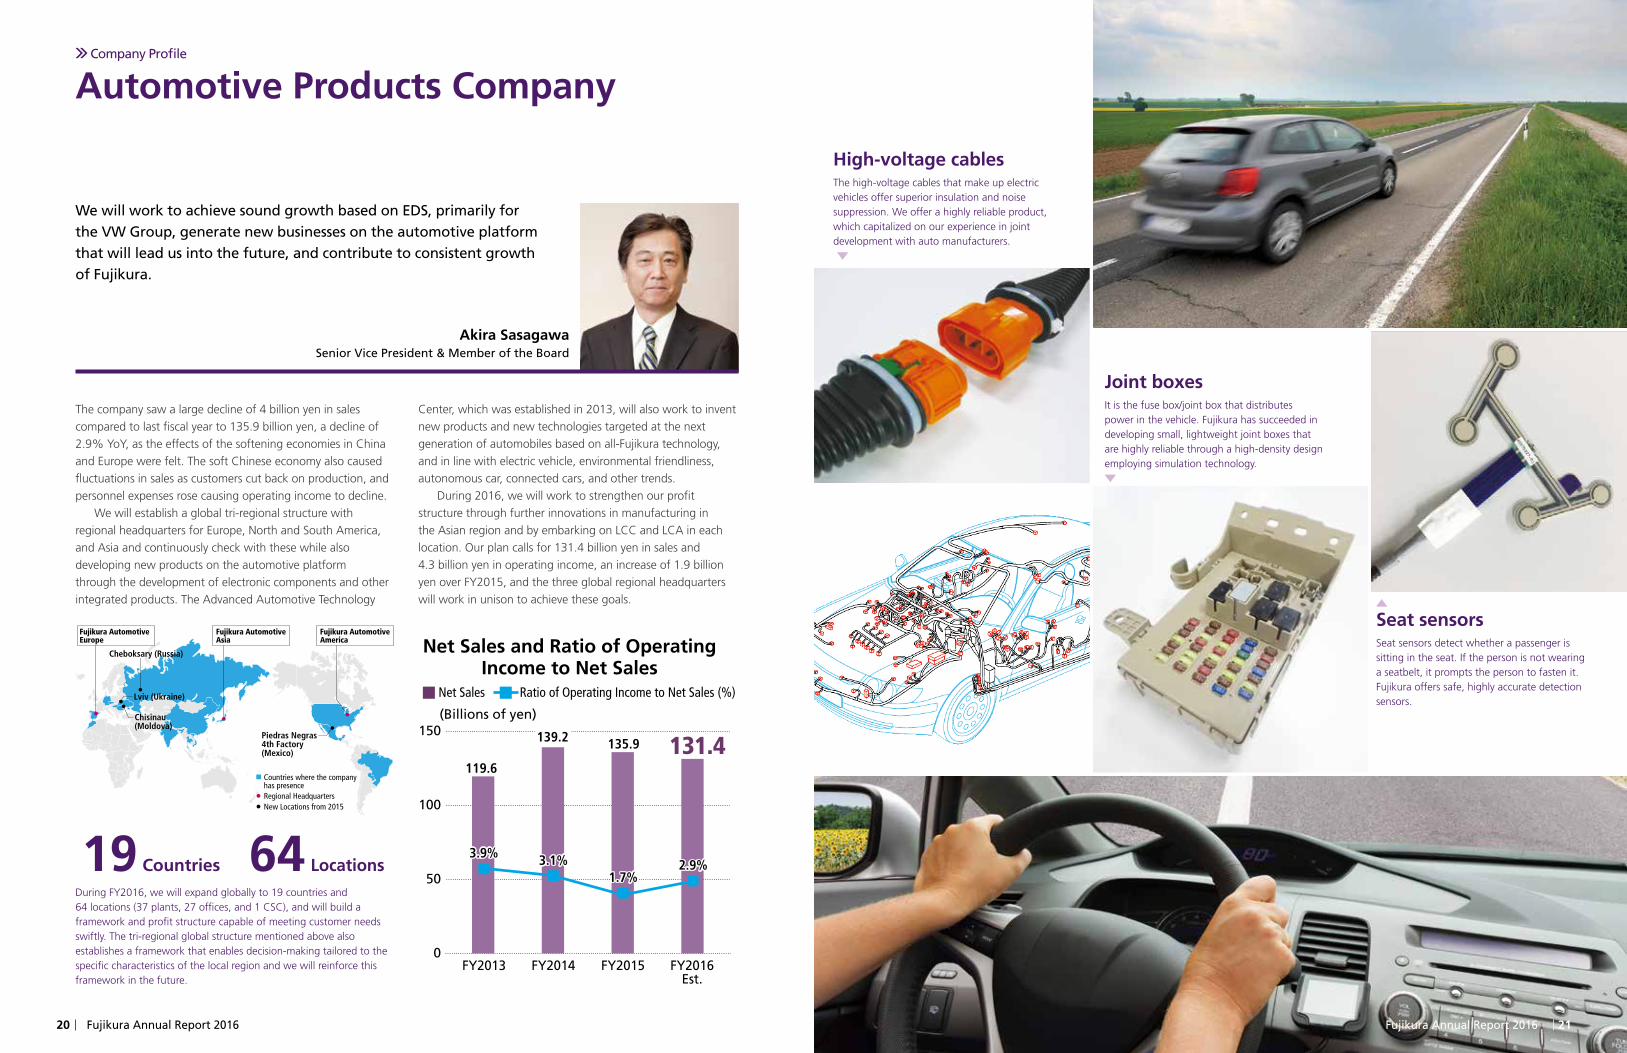
USB 3.1 Type C Cable AssembliesA USB 3.1 Type C cable is needed to achieve transmission at even higher speeds than the existing USB 3.0 cables.Fujikura is working to develop USB 3.1 Type C cable assemblies using high-frequency, high-speed cable technology.
Integrally Molded Harnesses with Connectors for Industrial NetworkUse of an O-ring in the plug connector completely prevents intrusion of contaminants such as water droplets, dust, and particulates when fitting it to the opposing jack connector (IP67 specifications for protection against dust and water).Because Fujikura can supply integrally molded cable harnesses incorporating connectors, the additional work involved in wiring connections can be omitted.We have also developed products to meet the recent steady increase in demand for phthalate-free products.
High-Frequency, High-Speed Transmission Cable MaterialsFujikura handles all types of FPC, connectors, electronic wires, and other cable materials used internally and between electronic devices and suitable for high-frequency, high-speed transmission. We are able to suggest products that offer a combination of Serial ATA connectors, Serial ATA harnesses, and FPC, among other products.We provide optimal design and manufacturing by combining such cable material products, based on what the customer has requested.
No. of locations in Thailand:
11
Electronics Business CompanyCompanyProfile
Takeaki Kitajima SeniorVicePresident&MemberoftheBoard
WehaveovercomethechallengesofthefloodintheKingdomof Thailand and fully recovered in FY2015. FY2016 will be the launching point for new growth.
FY2015 was positioned as the second phase of recovery. We targeted a full recovery in profits, redoubled efforts to promote automation and improve manufacturing, improved cost competitiveness, and achieved sales of 161.2 billion yen and 12.1 billion yen in operating income. Our main plant suffered catastrophic damage from the flooding in the Kingdom of Thailand and we struggled with major losses, but the entire Fujikura group worked in unison to achieve recovery and we brought income back into the black in FY2014, recovered the trust of our customers, and were able to again make a major contribution to income for the entire company. FY2015 marked the year of full recovery for the electronics business.
FY2016 is positioned as an important year for launching Fujikura on the road to new growth. We will expand
business that is closely connected to our main customers and keep quality at the core in managing our business. We will strengthen our R&D capabilities and combine core technologies to achieve further growth in existing businesses and create new businesses as well. The company will continue to vigorously engage in efforts to automate and improve production with a sense of urgency in order to achieve greater cost competitiveness at manufacturing locations. Our plan calls for 180.1 billion yen in sales and 9 billion yen in operating income in FY2016, and the entire company will work together to achieve our goal.
180.1161.2
(Billions of yen)
FY2013 FY2014
140.4
FY2015 FY2016Est.
107.4
0
60
120
180
–3.1%–3.1%4.9%4.9%
7.5%7.5%5.0%5.0%
Net Sales and Ratio of OperatingIncome to Net Sales
Net Sales Ratio of Operating Income to Net Sales (%)
No. of employees in Thailand:
22,000
Thailand Operation Map
Electronics:FETL: FujikuraElectronics (Thailand) Ltd.
Connector:DDK/T: DDK (Thailand) Ltd.
<Ayutthaya>- FETL Headquarter- FETL Ayutthaya
Factory 1
<Lamphun>- FETL Lamphun
Factory 1
<Kabinburi>- FETL Kabinburi
Factory 1
<Prachinburi>- FETL Prachinburi
Factory 1
<Bangkok>- FETL Sales office
<Navanakorn>- FETL Navanakorn
Factory 1- FETL Navanakorn
Factory 2- FETL Navanakorn
Factory 3- DDK/T Factory 1- DDK/T Factory 2
Lamphun
Ayutthaya
Pathumthani
Bangkok
Prachinburi
Kabinburi
The operations in Thailand, which form the core of the business, consist of 11 locations with the addition of the Kabin Buri plant which was started up after the floods as part of the BCP response. When production is at peak levels, we employ 22,000 people, including temporary employees. We have also been using people from Myanmar since last year due to the labor shortage in Thailand.
Fujikura Annual Report 2016 2120 Fujikura Annual Report 2016
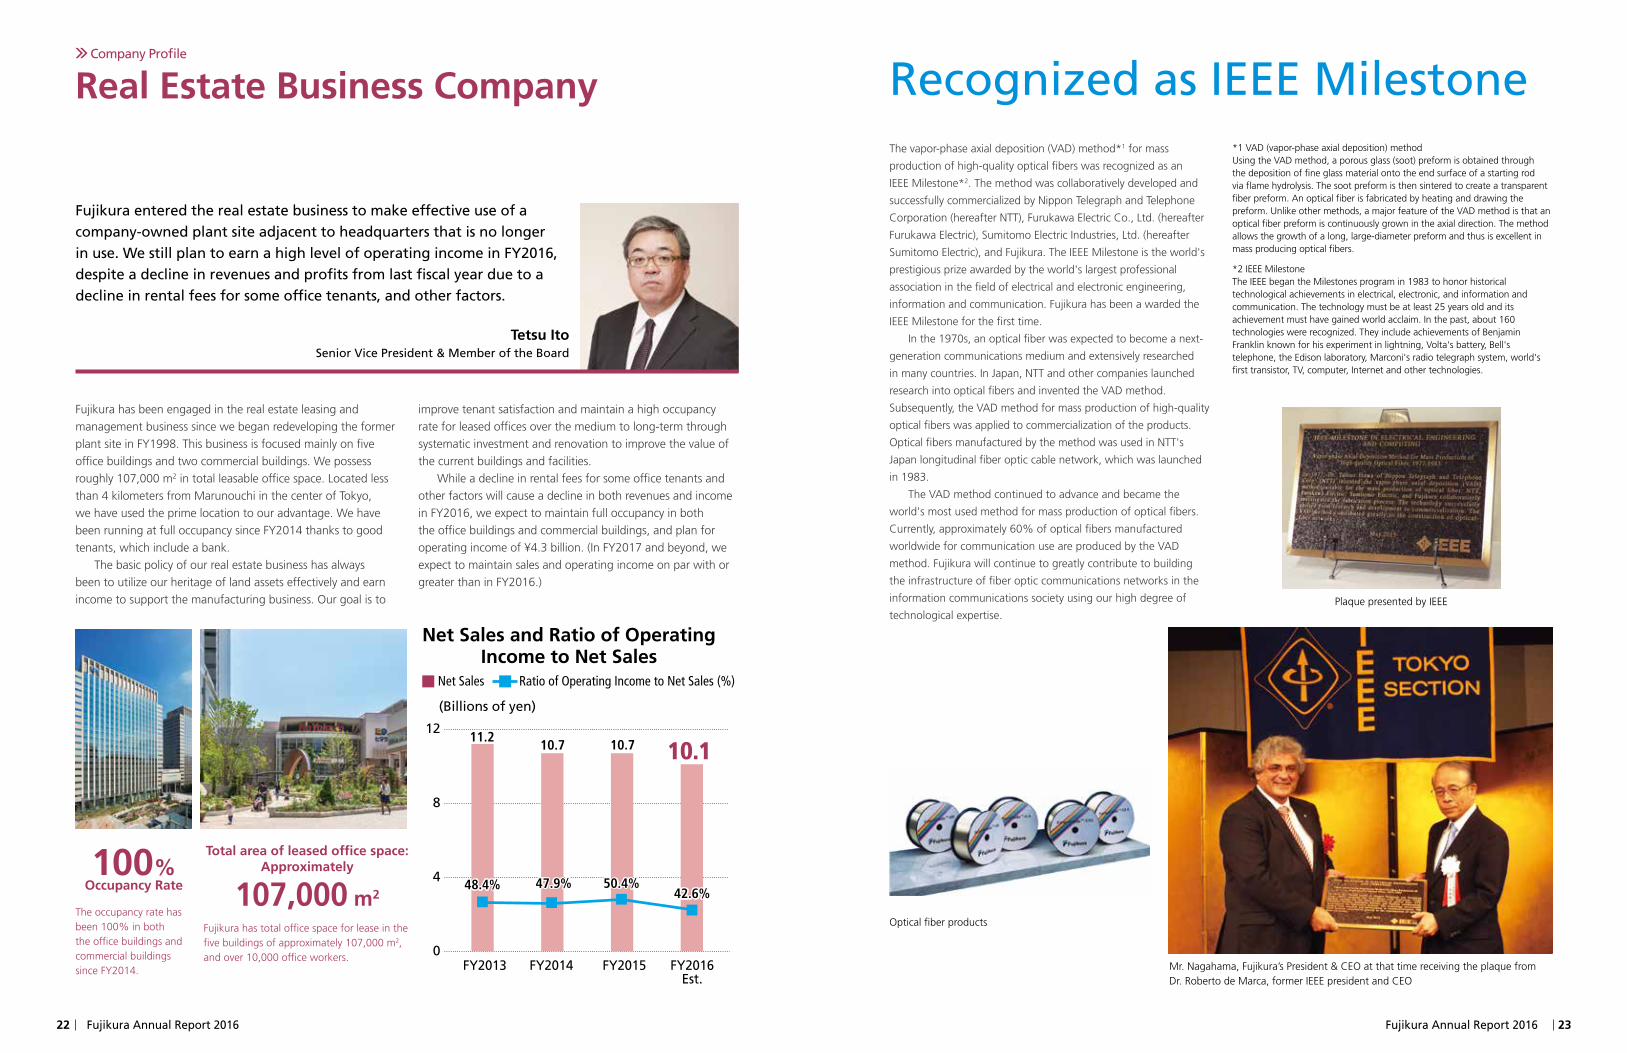
High-voltage cablesThe high-voltage cables that make up electric vehicles offer superior insulation and noise suppression. We offer a highly reliable product, which capitalized on our experience in joint development with auto manufacturers.
Joint boxesIt is the fuse box/joint box that distributes power in the vehicle. Fujikura has succeeded in developing small, lightweight joint boxes that are highly reliable through a high-density design employing simulation technology.
Seat sensorsSeat sensors detect whether a passenger is sitting in the seat. If the person is not wearing a seatbelt, it prompts the person to fasten it. Fujikura offers safe, highly accurate detection sensors.
Automotive Products CompanyCompanyProfile
Akira Sasagawa SeniorVicePresident&MemberoftheBoard
WewillworktoachievesoundgrowthbasedonEDS,primarilyfortheVWGroup,generatenewbusinessesontheautomotiveplatformthatwillleadusintothefuture,andcontributetoconsistentgrowthof Fujikura.
The company saw a large decline of 4 billion yen in sales compared to last fiscal year to 135.9 billion yen, a decline of 2.9% YoY, as the effects of the softening economies in China and Europe were felt. The soft Chinese economy also caused fluctuations in sales as customers cut back on production, and personnel expenses rose causing operating income to decline.
We will establish a global tri-regional structure with regional headquarters for Europe, North and South America, and Asia and continuously check with these while also developing new products on the automotive platform through the development of electronic components and other integrated products. The Advanced Automotive Technology
Center, which was established in 2013, will also work to invent new products and new technologies targeted at the next generation of automobiles based on all-Fujikura technology, and in line with electric vehicle, environmental friendliness, autonomous car, connected cars, and other trends.
During 2016, we will work to strengthen our profit structure through further innovations in manufacturing in the Asian region and by embarking on LCC and LCA in each location. Our plan calls for 131.4 billion yen in sales and 4.3 billion yen in operating income, an increase of 1.9 billion yen over FY2015, and the three global regional headquarters will work in unison to achieve these goals.
19 Countries 64 Locations
FY2013 FY2014 FY2015 FY2016Est.
119.6
0
50
100
150
3.9%3.9% 3.1%3.1% 2.9%2.9%1.7%1.7%
131.4131.4135.9139.2139.2
Net Sales and Ratio of OperatingIncome to Net Sales
Net Sales Ratio of Operating Income to Net Sales (%)
(Billions of yen)
During FY2016, we will expand globally to 19 countries and 64 locations (37 plants, 27 offices, and 1 CSC), and will build a framework and profit structure capable of meeting customer needs swiftly. The tri-regional global structure mentioned above also establishes a framework that enables decision-making tailored to the specific characteristics of the local region and we will reinforce this framework in the future.
Fujikura AutomotiveAmerica
Fujikura AutomotiveAsia
Fujikura AutomotiveEurope
Cheboksary (Russia)
Countries where the company has presenceRegional Headquarters
Piedras Negras4th Factory(Mexico)
Chisinau(Moldova)
Lviv (Ukraine)
New Locations from 2015
22 Fujikura Annual Report 2016 Fujikura Annual Report 2016 23
The vapor-phase axial deposition (VAD) method*1 for mass
production of high-quality optical fibers was recognized as an
IEEE Milestone*2. The method was collaboratively developed and
successfully commercialized by Nippon Telegraph and Telephone
Corporation (hereafter NTT), Furukawa Electric Co., Ltd. (hereafter
Furukawa Electric), Sumitomo Electric Industries, Ltd. (hereafter
Sumitomo Electric), and Fujikura. The IEEE Milestone is the world's
prestigious prize awarded by the world's largest professional
association in the field of electrical and electronic engineering,
information and communication. Fujikura has been a warded the
IEEE Milestone for the first time.
In the 1970s, an optical fiber was expected to become a next-
generation communications medium and extensively researched
in many countries. In Japan, NTT and other companies launched
research into optical fibers and invented the VAD method.
Subsequently, the VAD method for mass production of high-quality
optical fibers was applied to commercialization of the products.
Optical fibers manufactured by the method was used in NTT's
Japan longitudinal fiber optic cable network, which was launched
in 1983.
The VAD method continued to advance and became the
world's most used method for mass production of optical fibers.
Currently, approximately 60% of optical fibers manufactured
worldwide for communication use are produced by the VAD
method. Fujikura will continue to greatly contribute to building
the infrastructure of fiber optic communications networks in the
information communications society using our high degree of
technological expertise.
*1 VAD (vapor-phase axial deposition) methodUsing the VAD method, a porous glass (soot) preform is obtained through the deposition of fine glass material onto the end surface of a starting rod via flame hydrolysis. The soot preform is then sintered to create a transparent fiber preform. An optical fiber is fabricated by heating and drawing the preform. Unlike other methods, a major feature of the VAD method is that an optical fiber preform is continuously grown in the axial direction. The method allows the growth of a long, large-diameter preform and thus is excellent in mass producing optical fibers.
*2 IEEE MilestoneThe IEEE began the Milestones program in 1983 to honor historical technological achievements in electrical, electronic, and information and communication. The technology must be at least 25 years old and its achievement must have gained world acclaim. In the past, about 160 technologies were recognized. They include achievements of Benjamin Franklin known for his experiment in lightning, Volta's battery, Bell's telephone, the Edison laboratory, Marconi's radio telegraph system, world's first transistor, TV, computer, Internet and other technologies.
RecognizedasIEEEMilestone
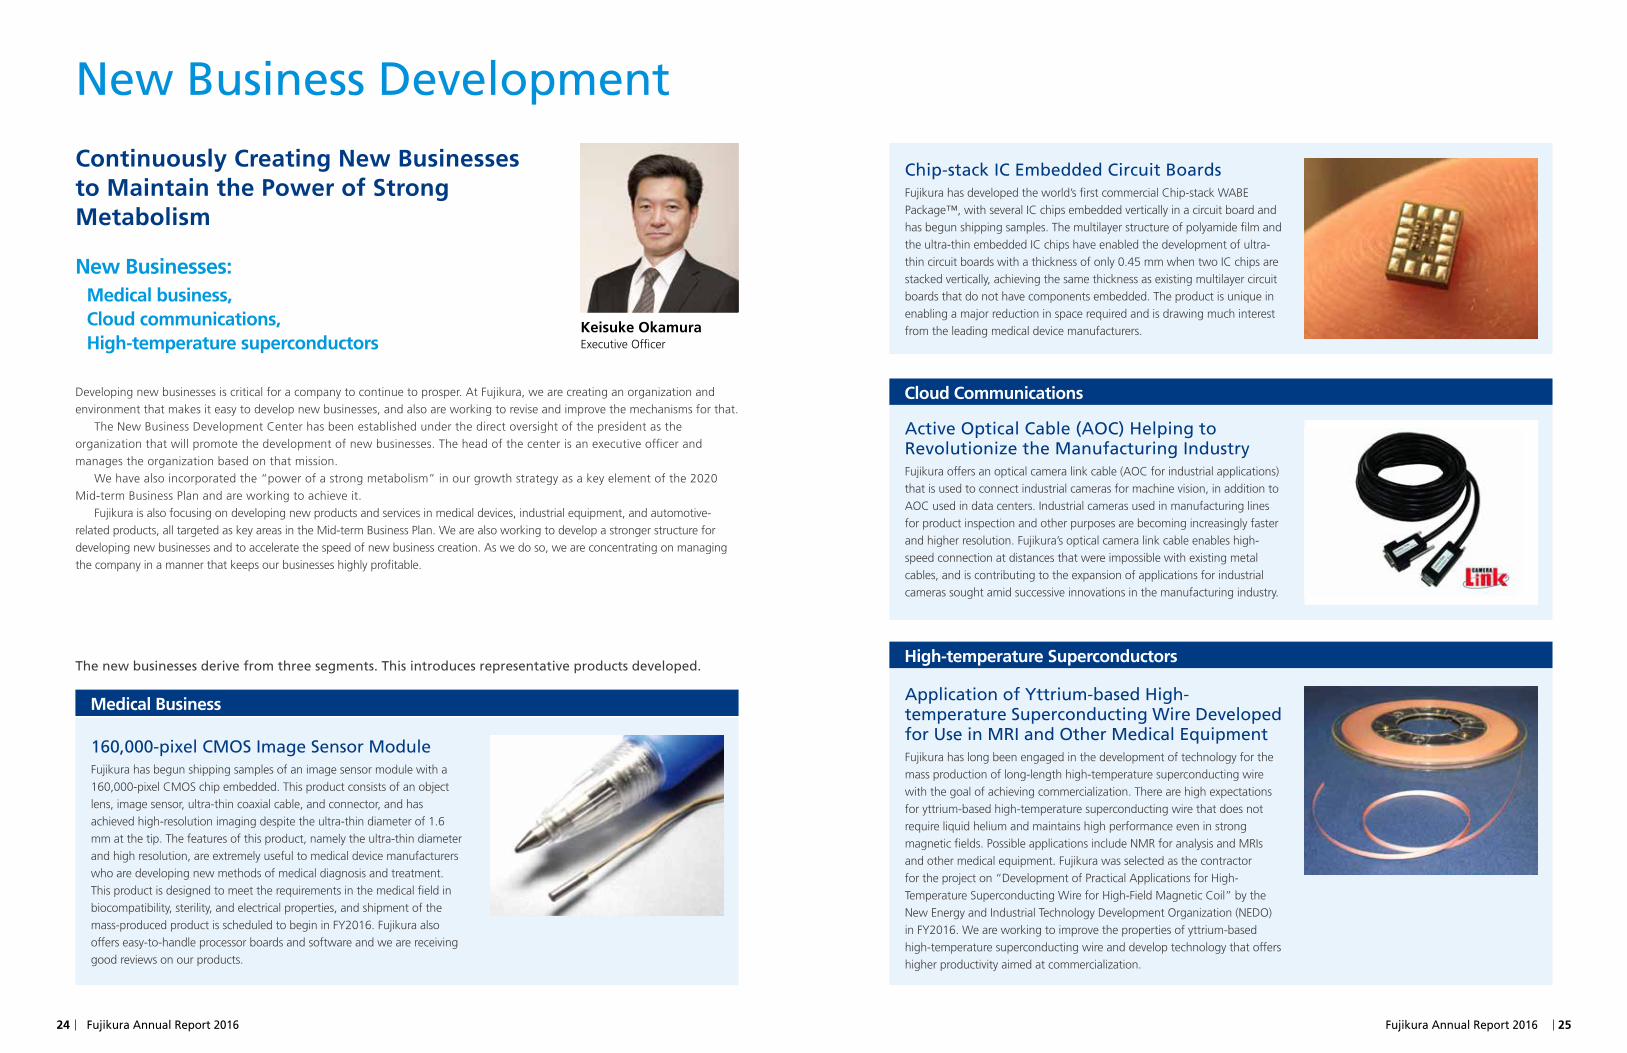
Plaque presented by IEEE
Mr. Nagahama, Fujikura’s President & CEO at that time receiving the plaque from Dr. Roberto de Marca, former IEEE president and CEO
Optical fiber products
Fujikura has been engaged in the real estate leasing and management business since we began redeveloping the former plant site in FY1998. This business is focused mainly on five office buildings and two commercial buildings. We possess roughly 107,000 m2 in total leasable office space. Located less than 4 kilometers from Marunouchi in the center of Tokyo, we have used the prime location to our advantage. We have been running at full occupancy since FY2014 thanks to good tenants, which include a bank.
The basic policy of our real estate business has always been to utilize our heritage of land assets effectively and earn income to support the manufacturing business. Our goal is to
improve tenant satisfaction and maintain a high occupancy rate for leased offices over the medium to long-term through systematic investment and renovation to improve the value of the current buildings and facilities.
While a decline in rental fees for some office tenants and other factors will cause a decline in both revenues and income in FY2016, we expect to maintain full occupancy in both the office buildings and commercial buildings, and plan for operating income of ¥4.3 billion. (In FY2017 and beyond, we expect to maintain sales and operating income on par with or greater than in FY2016.)
Real Estate Business CompanyCompanyProfile
Tetsu Ito SeniorVicePresident&MemberoftheBoard
Fujikura entered the real estate business to make effective use of a company-ownedplantsiteadjacenttoheadquartersthatisnolongerinuse.WestillplantoearnahighlevelofoperatingincomeinFY2016,despiteadeclineinrevenuesandprofitsfromlastfiscalyearduetoadeclineinrentalfeesforsomeofficetenants,andotherfactors.
100% Occupancy Rate
The occupancy rate has been 100% in both the office buildings and commercial buildings since FY2014.
Total area of leased office space: Approximately
107,000 m2
Fujikura has total office space for lease in the five buildings of approximately 107,000 m2, and over 10,000 office workers.
10.1
(Billions of yen)
10.710.711.2
0
4
8
12
48.4%48.4% 47.9%47.9% 50.4%50.4%42.6%42.6%
FY2013 FY2014 FY2015 FY2016Est.
Net Sales and Ratio of OperatingIncome to Net Sales
Net Sales Ratio of Operating Income to Net Sales (%)
24 Fujikura Annual Report 2016 Fujikura Annual Report 2016 25
Chip-stackICEmbeddedCircuitBoardsFujikura has developed the world’s first commercial Chip-stack WABE Package™, with several IC chips embedded vertically in a circuit board and has begun shipping samples. The multilayer structure of polyamide film and the ultra-thin embedded IC chips have enabled the development of ultra-thin circuit boards with a thickness of only 0.45 mm when two IC chips are stacked vertically, achieving the same thickness as existing multilayer circuit boards that do not have components embedded. The product is unique in enabling a major reduction in space required and is drawing much interest from the leading medical device manufacturers.
ActiveOpticalCable(AOC)HelpingtoRevolutionizetheManufacturingIndustryFujikura offers an optical camera link cable (AOC for industrial applications) that is used to connect industrial cameras for machine vision, in addition to AOC used in data centers. Industrial cameras used in manufacturing lines for product inspection and other purposes are becoming increasingly faster and higher resolution. Fujikura’s optical camera link cable enables high-speed connection at distances that were impossible with existing metal cables, and is contributing to the expansion of applications for industrial cameras sought amid successive innovations in the manufacturing industry.
ApplicationofYttrium-basedHigh-temperatureSuperconductingWireDevelopedforUseinMRIandOtherMedicalEquipmentFujikura has long been engaged in the development of technology for the mass production of long-length high-temperature superconducting wire with the goal of achieving commercialization. There are high expectations for yttrium-based high-temperature superconducting wire that does not require liquid helium and maintains high performance even in strong magnetic fields. Possible applications include NMR for analysis and MRIs and other medical equipment. Fujikura was selected as the contractor for the project on “Development of Practical Applications for High-Temperature Superconducting Wire for High-Field Magnetic Coil” by the New Energy and Industrial Technology Development Organization (NEDO) in FY2016. We are working to improve the properties of yttrium-based high-temperature superconducting wire and develop technology that offers higher productivity aimed at commercialization.
Cloud Communications
High-temperature Superconductors
NewBusinessDevelopment
Continuously Creating New Businesses to Maintain the Power of Strong Metabolism
Developing new businesses is critical for a company to continue to prosper. At Fujikura, we are creating an organization and environment that makes it easy to develop new businesses, and also are working to revise and improve the mechanisms for that.
The New Business Development Center has been established under the direct oversight of the president as the organization that will promote the development of new businesses. The head of the center is an executive officer and manages the organization based on that mission.
We have also incorporated the “power of a strong metabolism” in our growth strategy as a key element of the 2020 Mid-term Business Plan and are working to achieve it.
Fujikura is also focusing on developing new products and services in medical devices, industrial equipment, and automotive-related products, all targeted as key areas in the Mid-term Business Plan. We are also working to develop a stronger structure for developing new businesses and to accelerate the speed of new business creation. As we do so, we are concentrating on managing the company in a manner that keeps our businesses highly profitable.
160,000-pixelCMOSImageSensorModuleFujikura has begun shipping samples of an image sensor module with a 160,000-pixel CMOS chip embedded. This product consists of an object lens, image sensor, ultra-thin coaxial cable, and connector, and has achieved high-resolution imaging despite the ultra-thin diameter of 1.6 mm at the tip. The features of this product, namely the ultra-thin diameter and high resolution, are extremely useful to medical device manufacturers who are developing new methods of medical diagnosis and treatment. This product is designed to meet the requirements in the medical field in biocompatibility, sterility, and electrical properties, and shipment of the mass-produced product is scheduled to begin in FY2016. Fujikura also offers easy-to-handle processor boards and software and we are receiving good reviews on our products.
Keisuke OkamuraExecutive Officer
New Businesses: Medical business, Cloud communications, High-temperature superconductors
Medical Business
The new businesses derive from three segments. This introduces representative products developed.
Research and Development ExpensesResearch and Development Expenses by Segment (Billions of yen)
(Billions of yen)
FY2012FY2011 FY2013 FY2015FY2014
Automotive Products
1.4
ElectronicsBusiness
4.1
Power &TelecommunicationSystems
10.6
Total16.2
0
5
10
15
20
14.5 14.9 14.6 15.2 16.2
26 Fujikura Annual Report 2016 Fujikura Annual Report 2016 27
Advanced Technology Laboratory In addition to developing materials that form the foundation of Fujikura, we have been conducting cutting-edge research on energy conservation and renewable energy sources, specifically on the development of functional single crystals, dye-sensitized solar cells, and high-temperatures superconducting wires. In the electronics field, our laboratory has been focusing on developing advanced technologies which include R&D for future technologies such as sensors, printed wiring boards, and high functional printed electronics. In response to the acceleration of technological innovation in telecommunication, we have also been promoting R&D on next-generation optical fibers, optical devices and optical modules, fiber laser technologies, and other applications.
Intellectual Property Center The Center protects advanced technologies developed by Fujikura through the acquisition of intellectual property rights, and supports global business expansion of the Fujikura group through strategic action on intellectual property to strengthen the patent position of our technologies.
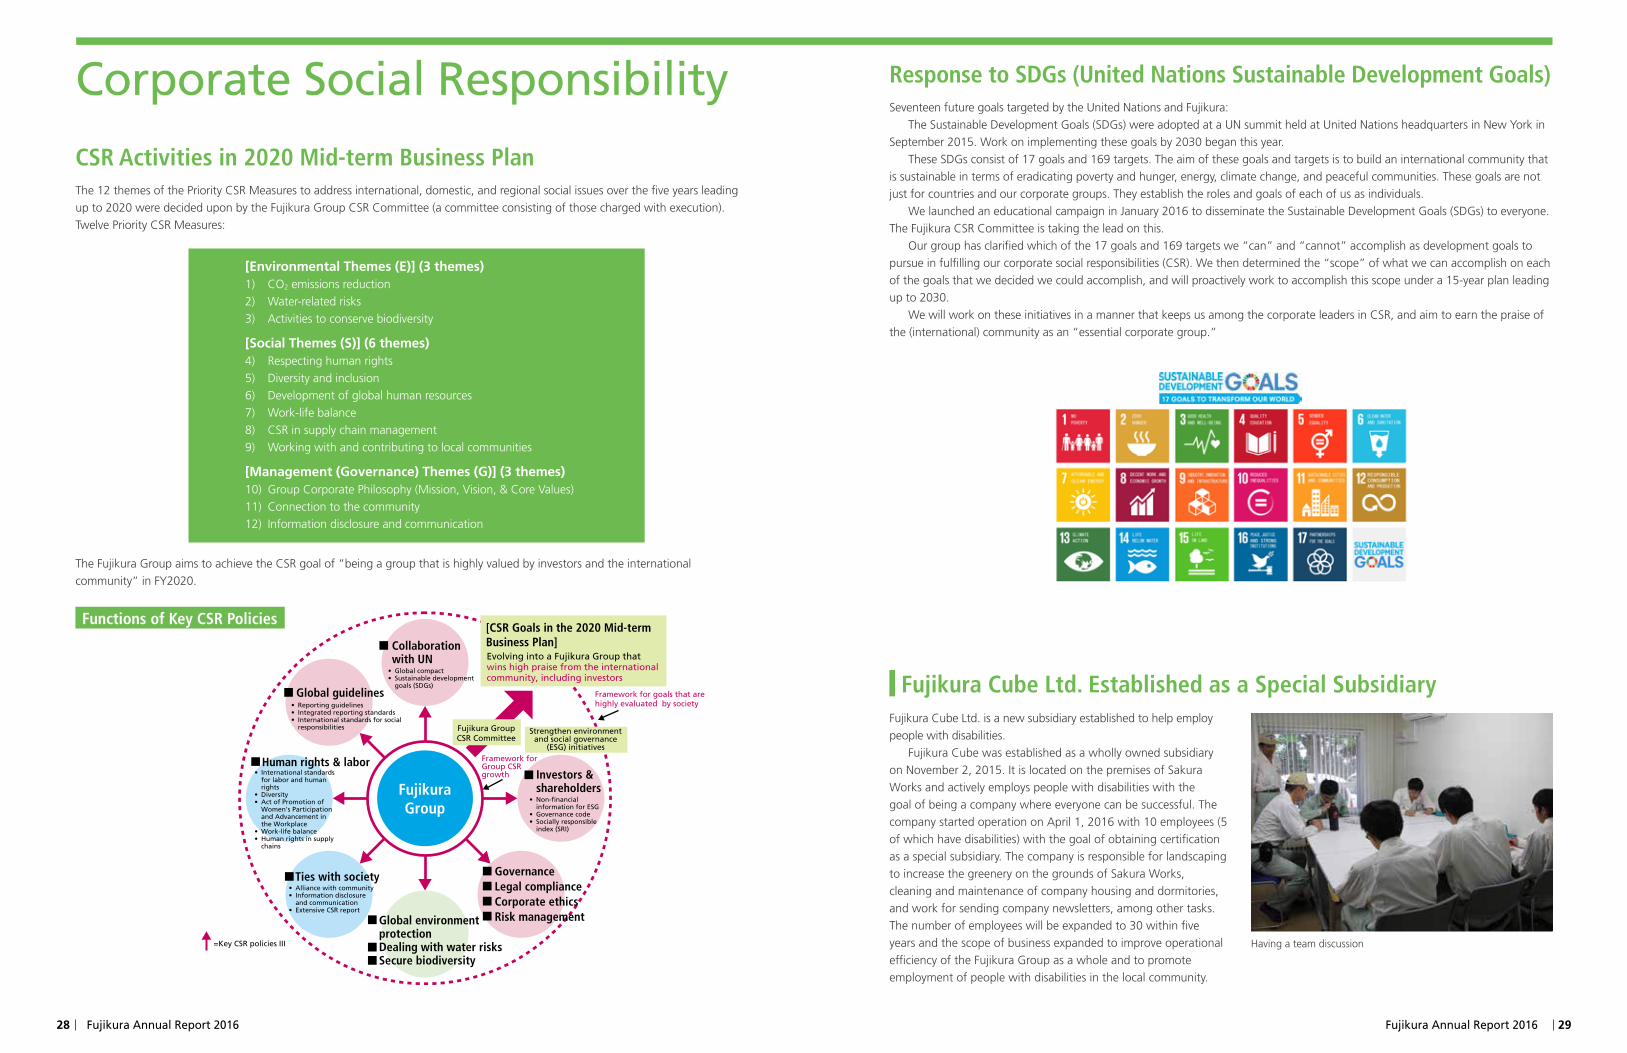
19-core Multicore FiberOne candidate for surpassing the limitations on transmission capacity of existing optical fiber is multicore fiber. A joint Japanese-EU initiative achieved the PDM-16QAM transmission over more than 1,600 km using 32 core fibers in FY2015. Moreover, a National Institute of Information and Communications Technology (NICT) sponsored research initiative also succeeded in producing few mode multicore fiber with 114 space division multiplexing (6 modes x 19 cores).
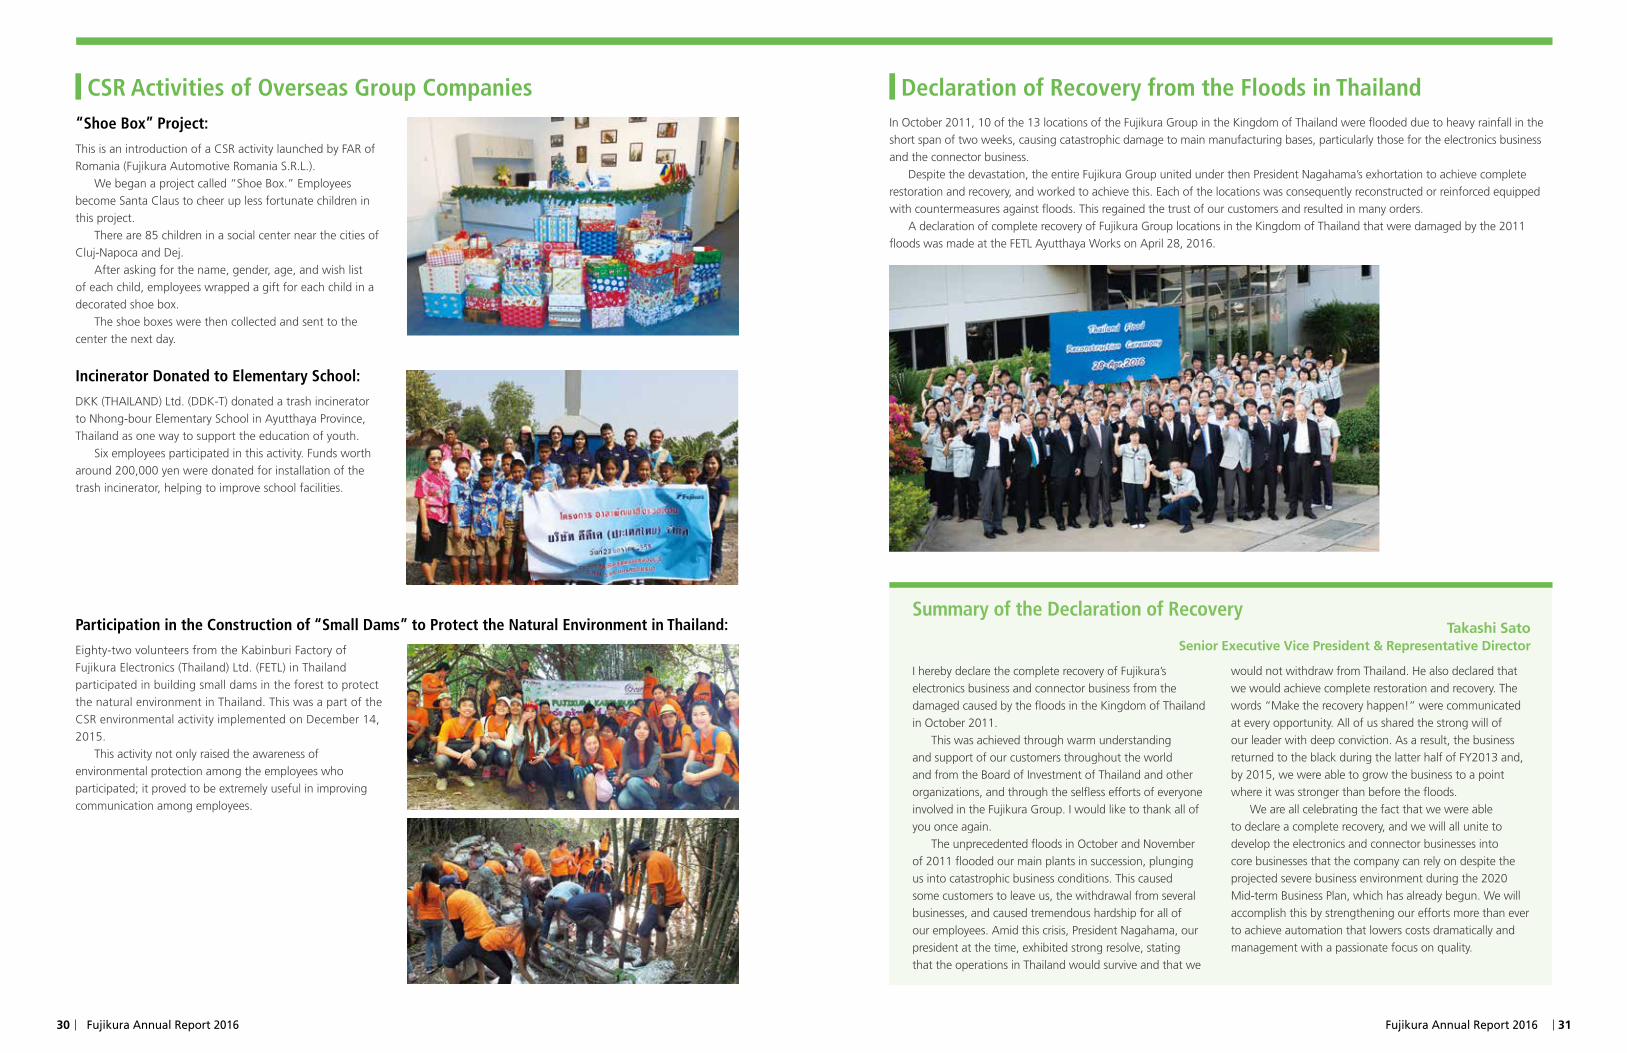
Millimeter-wave Bandpass FilterRecently, millimeter-wave technologies are attracting much attention for applications on ultrahigh speed wireless communication, vehicle radar, etc. By applying flexible liquid crystal polymer and ultralow loss silica as substrate, Fujikura is developing some key technologies in millimeter-wave devices such as antennas, filters and packaging technology. For example, a bandpass filter realized in silica-based post-wall waveguide shows a fairly good filtering performance with extremely low-loss.
Research Fields
Marker
RESEARCH TOPICS FOR FUTURE GROWTHResearch Topics for Future GrowthQ: How will R&D be incorporated into the 2020 Mid-term
Business Plan?
A: During the 2020 Mid-term Business Plan, we will concentrate investment of R&D resources in the three key domains of optical, electronic components, and electric wire and cable, which form the core technology base that supports “Tsunagu,” technologies. We will work to expand into areas peripheral to our core technology base while also reinforcing the underlying technology that makes up our technical base further. We will secure the technological superiority of our “Tsunagu” technologies as we also engage in R&D in areas surrounding these technologies.
Based on our “Tsunagu” technologies, Fujikura will develop new products and businesses that anticipate changes in society and customer needs in the five business domains of telecommunication, electronics, energy, automotive products, and medical devices & industrial equipment, and will accelerate the metabolism of Fujikura.
We will keep an eye on global trends in technology and work to introduce R&D themes in a timely manner by building a global research structure. We will also proactively pursue open innovation, making use of external technology to the maximum extent possible. Human resources form the very foundation of research and development and we will strive to utilize global human resources as we also concentrate on developing human resources who are capable of viewing R&D from the perspective of commercial potential.
Akira WadaSenior Vice President & Member of the Board
Medical & IndustrialEquipment
Tele
com
mun
icat
ion
Electronics
Energy
AutomotiveProducts
Fiberlasers Image
fibers
FPC Optical
Fiber Opticalconnectors
Optical fusion splicer Optical fiberline components
Optical devices
Optical fibers Optical Cables
Membrane SW Millimeter wavemodules
PlanarWiring
Heat pipes Sensors
Connectors Electronic wires
High-temperature superconductors
Automotivewire harnesses Coaxial cable
Industrialwiring
Embedded PCB
ElectronicComponents Optical
ElectricalWire & Cable
28 Fujikura Annual Report 2016 Fujikura Annual Report 2016 29
Response to SDGs (United Nations Sustainable Development Goals)Seventeen future goals targeted by the United Nations and Fujikura:
The Sustainable Development Goals (SDGs) were adopted at a UN summit held at United Nations headquarters in New York in September 2015. Work on implementing these goals by 2030 began this year.
These SDGs consist of 17 goals and 169 targets. The aim of these goals and targets is to build an international community that is sustainable in terms of eradicating poverty and hunger, energy, climate change, and peaceful communities. These goals are not just for countries and our corporate groups. They establish the roles and goals of each of us as individuals.
We launched an educational campaign in January 2016 to disseminate the Sustainable Development Goals (SDGs) to everyone. The Fujikura CSR Committee is taking the lead on this.
Our group has clarified which of the 17 goals and 169 targets we “can” and “cannot” accomplish as development goals to pursue in fulfilling our corporate social responsibilities (CSR). We then determined the “scope” of what we can accomplish on each of the goals that we decided we could accomplish, and will proactively work to accomplish this scope under a 15-year plan leading up to 2030.
We will work on these initiatives in a manner that keeps us among the corporate leaders in CSR, and aim to earn the praise of the (international) community as an “essential corporate group.”
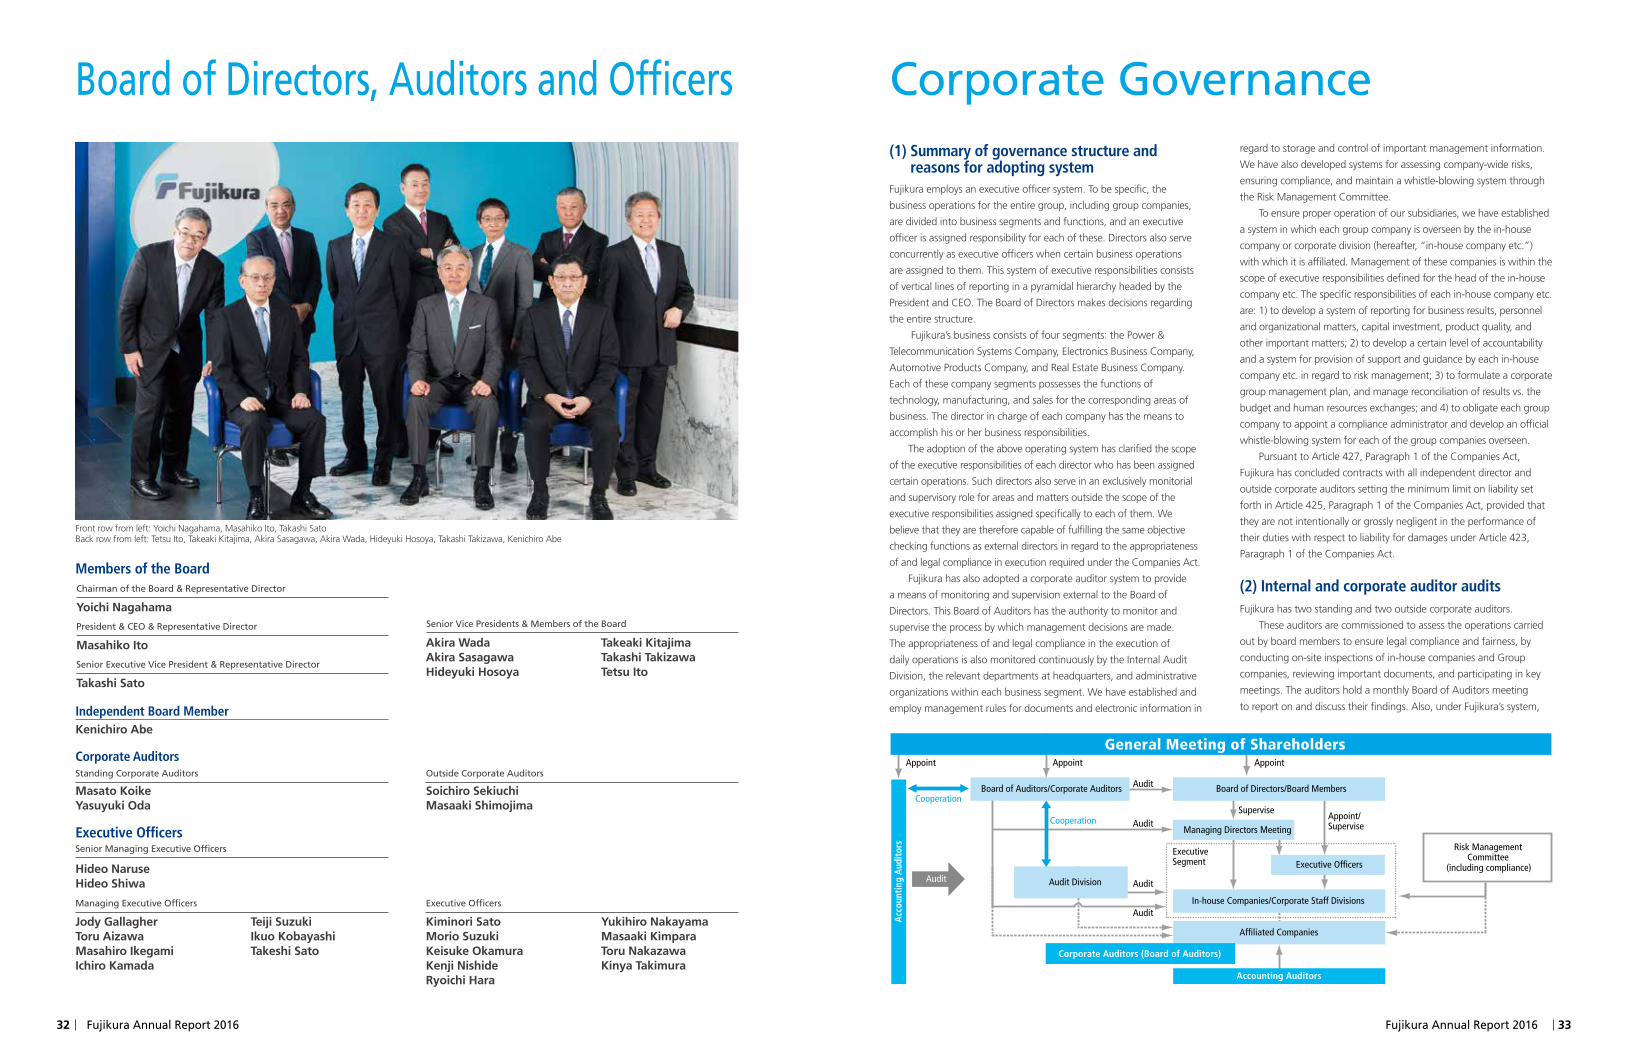
Fujikura Cube Ltd. Established as a Special SubsidiaryFujikura Cube Ltd. is a new subsidiary established to help employ people with disabilities.
Fujikura Cube was established as a wholly owned subsidiary on November 2, 2015. It is located on the premises of Sakura Works and actively employs people with disabilities with the goal of being a company where everyone can be successful. The company started operation on April 1, 2016 with 10 employees (5 of which have disabilities) with the goal of obtaining certification as a special subsidiary. The company is responsible for landscaping to increase the greenery on the grounds of Sakura Works, cleaning and maintenance of company housing and dormitories, and work for sending company newsletters, among other tasks. The number of employees will be expanded to 30 within five years and the scope of business expanded to improve operational efficiency of the Fujikura Group as a whole and to promote employment of people with disabilities in the local community.
Having a team discussion
CSR Activities in 2020 Mid-term Business Plan
CorporateSocialResponsibility
Human rights & labor
Global guidelines
Collaboration with UN
GovernanceLegal complianceCorporate ethicsRisk management
Investors & shareholders
Ties with society
Fujikura GroupCSR Committee
Strengthen environmentand social governance
(ESG) initiatives
[CSR Goals in the 2020 Mid-term Business Plan]
FujikuraGroup
Framework for Group CSR growth
=Key CSR policies III
Functions of Key CSR Policies
Evolving into a Fujikura Group that wins high praise from the international community, including investors
• Global compact• Sustainable development
goals (SDGs)
• Reporting guidelines• Integrated reporting standards• International standards for social
responsibilities
• International standards for labor and human rights
• Diversity• Act of Promotion of
Women's Participation and Advancement in the Workplace
• Work-life balance• Human rights in supply
chains
• Alliance with community• Information disclosure
and communication• Extensive CSR report
Global environment protectionDealing with water risksSecure biodiversity
• Non-financial information for ESG
• Governance code• Socially responsible
index (SRI)
Framework for goals that are highly evaluated by society
The 12 themes of the Priority CSR Measures to address international, domestic, and regional social issues over the five years leading up to 2020 were decided upon by the Fujikura Group CSR Committee (a committee consisting of those charged with execution).Twelve Priority CSR Measures:
[Environmental Themes (E)] (3 themes)1) CO2 emissions reduction2) Water-related risks 3) Activities to conserve biodiversity
[Social Themes (S)] (6 themes)4) Respecting human rights5) Diversity and inclusion6) Development of global human resources7) Work-life balance8) CSR in supply chain management9) Working with and contributing to local communities
[Management (Governance) Themes (G)] (3 themes)10) Group Corporate Philosophy (Mission, Vision, & Core Values)11) Connection to the community12) Information disclosure and communication
The Fujikura Group aims to achieve the CSR goal of “being a group that is highly valued by investors and the international community” in FY2020.
30 Fujikura Annual Report 2016 Fujikura Annual Report 2016 31
Declaration of Recovery from the Floods in ThailandIn October 2011, 10 of the 13 locations of the Fujikura Group in the Kingdom of Thailand were flooded due to heavy rainfall in the short span of two weeks, causing catastrophic damage to main manufacturing bases, particularly those for the electronics business and the connector business.
Despite the devastation, the entire Fujikura Group united under then President Nagahama’s exhortation to achieve complete restoration and recovery, and worked to achieve this. Each of the locations was consequently reconstructed or reinforced equipped with countermeasures against floods. This regained the trust of our customers and resulted in many orders.
A declaration of complete recovery of Fujikura Group locations in the Kingdom of Thailand that were damaged by the 2011 floods was made at the FETL Ayutthaya Works on April 28, 2016.
Summary of the Declaration of Recovery Takashi Sato
Senior Executive Vice President & Representative Director
I hereby declare the complete recovery of Fujikura’s electronics business and connector business from the damaged caused by the floods in the Kingdom of Thailand in October 2011.
This was achieved through warm understanding and support of our customers throughout the world and from the Board of Investment of Thailand and other organizations, and through the selfless efforts of everyone involved in the Fujikura Group. I would like to thank all of you once again.
The unprecedented floods in October and November of 2011 flooded our main plants in succession, plunging us into catastrophic business conditions. This caused some customers to leave us, the withdrawal from several businesses, and caused tremendous hardship for all of our employees. Amid this crisis, President Nagahama, our president at the time, exhibited strong resolve, stating that the operations in Thailand would survive and that we
would not withdraw from Thailand. He also declared that we would achieve complete restoration and recovery. The words “Make the recovery happen!” were communicated at every opportunity. All of us shared the strong will of our leader with deep conviction. As a result, the business returned to the black during the latter half of FY2013 and, by 2015, we were able to grow the business to a point where it was stronger than before the floods.
We are all celebrating the fact that we were able to declare a complete recovery, and we will all unite to develop the electronics and connector businesses into core businesses that the company can rely on despite the projected severe business environment during the 2020 Mid-term Business Plan, which has already begun. We will accomplish this by strengthening our efforts more than ever to achieve automation that lowers costs dramatically and management with a passionate focus on quality.
CSR Activities of Overseas Group Companies“Shoe Box” Project:
Incinerator Donated to Elementary School:
Participation in the Construction of “Small Dams” to Protect the Natural Environment in Thailand:
This is an introduction of a CSR activity launched by FAR of Romania (Fujikura Automotive Romania S.R.L.).
We began a project called “Shoe Box.” Employees become Santa Claus to cheer up less fortunate children in this project.
There are 85 children in a social center near the cities of Cluj-Napoca and Dej.
After asking for the name, gender, age, and wish list of each child, employees wrapped a gift for each child in a decorated shoe box.
The shoe boxes were then collected and sent to the center the next day.
DKK (THAILAND) Ltd. (DDK-T) donated a trash incinerator to Nhong-bour Elementary School in Ayutthaya Province, Thailand as one way to support the education of youth.
Six employees participated in this activity. Funds worth around 200,000 yen were donated for installation of the trash incinerator, helping to improve school facilities.
Eighty-two volunteers from the Kabinburi Factory of Fujikura Electronics (Thailand) Ltd. (FETL) in Thailand participated in building small dams in the forest to protect the natural environment in Thailand. This was a part of the CSR environmental activity implemented on December 14, 2015.
This activity not only raised the awareness of environmental protection among the employees who participated; it proved to be extremely useful in improving communication among employees.
32 Fujikura Annual Report 2016 Fujikura Annual Report 2016 33
(1) Summary of governance structure and reasons for adopting system
Fujikura employs an executive officer system. To be specific, the
business operations for the entire group, including group companies,
are divided into business segments and functions, and an executive
officer is assigned responsibility for each of these. Directors also serve
concurrently as executive officers when certain business operations
are assigned to them. This system of executive responsibilities consists
of vertical lines of reporting in a pyramidal hierarchy headed by the
President and CEO. The Board of Directors makes decisions regarding
the entire structure.
Fujikura’s business consists of four segments: the Power &
Telecommunication Systems Company, Electronics Business Company,
Automotive Products Company, and Real Estate Business Company.
Each of these company segments possesses the functions of
technology, manufacturing, and sales for the corresponding areas of
business. The director in charge of each company has the means to
accomplish his or her business responsibilities.
The adoption of the above operating system has clarified the scope
of the executive responsibilities of each director who has been assigned
certain operations. Such directors also serve in an exclusively monitorial
and supervisory role for areas and matters outside the scope of the
executive responsibilities assigned specifically to each of them. We
believe that they are therefore capable of fulfilling the same objective
checking functions as external directors in regard to the appropriateness
of and legal compliance in execution required under the Companies Act.
Fujikura has also adopted a corporate auditor system to provide
a means of monitoring and supervision external to the Board of
Directors. This Board of Auditors has the authority to monitor and
supervise the process by which management decisions are made.
The appropriateness of and legal compliance in the execution of
daily operations is also monitored continuously by the Internal Audit
Division, the relevant departments at headquarters, and administrative
organizations within each business segment. We have established and
employ management rules for documents and electronic information in
regard to storage and control of important management information.
We have also developed systems for assessing company-wide risks,
ensuring compliance, and maintain a whistle-blowing system through
the Risk Management Committee.
To ensure proper operation of our subsidiaries, we have established
a system in which each group company is overseen by the in-house
company or corporate division (hereafter, “in-house company etc.”)
with which it is affiliated. Management of these companies is within the
scope of executive responsibilities defined for the head of the in-house
company etc. The specific responsibilities of each in-house company etc.
are: 1) to develop a system of reporting for business results, personnel
and organizational matters, capital investment, product quality, and
other important matters; 2) to develop a certain level of accountability
and a system for provision of support and guidance by each in-house
company etc. in regard to risk management; 3) to formulate a corporate
group management plan, and manage reconciliation of results vs. the
budget and human resources exchanges; and 4) to obligate each group
company to appoint a compliance administrator and develop an official
whistle-blowing system for each of the group companies overseen.
Pursuant to Article 427, Paragraph 1 of the Companies Act,
Fujikura has concluded contracts with all independent director and
outside corporate auditors setting the minimum limit on liability set
forth in Article 425, Paragraph 1 of the Companies Act, provided that
they are not intentionally or grossly negligent in the performance of
their duties with respect to liability for damages under Article 423,
Paragraph 1 of the Companies Act.
(2) Internal and corporate auditor auditsFujikura has two standing and two outside corporate auditors.
These auditors are commissioned to assess the operations carried
out by board members to ensure legal compliance and fairness, by
conducting on-site inspections of in-house companies and Group
companies, reviewing important documents, and participating in key
meetings. The auditors hold a monthly Board of Auditors meeting
to report on and discuss their findings. Also, under Fujikura’s system,
Board of Auditors/Corporate Auditors Board of Directors/Board Members
Managing Directors Meeting
Executive Officers
Risk ManagementCommittee
Audit
Audit
Audit
SuperviseAppoint/Supervise
AppointAppointAppoint
Audit
Audit
Cooperation
Cooperation
ExecutiveSegment
(including compliance)
In-house Companies/Corporate Staff Divisions
Affiliated Companies
Accounting Auditors
General Meeting of Shareholders
Acco
untin
g Au
dito
rs
Corporate Auditors (Board of Auditors)
Audit Division
CorporateGovernance
ChairmanoftheBoard&RepresentativeDirector
Yoichi Nagahama
President&CEO&RepresentativeDirector
Masahiko Ito
SeniorExecutiveVicePresident&RepresentativeDirector
Takashi Sato
SeniorVicePresidents&MembersoftheBoard
StandingCorporateAuditors
Masato KoikeYasuyuki Oda
OutsideCorporateAuditors
Soichiro SekiuchiMasaaki Shimojima
Jody GallagherToru AizawaMasahiro IkegamiIchiro Kamada
Teiji SuzukiIkuo KobayashiTakeshi Sato
Hideo NaruseHideo Shiwa
Kiminori SatoMorio SuzukiKeisuke OkamuraKenji NishideRyoichi Hara
Yukihiro NakayamaMasaaki KimparaToru NakazawaKinya Takimura
Akira WadaAkira SasagawaHideyuki Hosoya
Takeaki KitajimaTakashi TakizawaTetsu Ito
Kenichiro Abe
Members of the Board
Corporate Auditors
Executive Officers
ManagingExecutiveOfficers
SeniorManagingExecutiveOfficers
ExecutiveOfficers
Independent Board Member
Front row from left: Yoichi Nagahama, Masahiko Ito, Takashi SatoBack row from left: Tetsu Ito, Takeaki Kitajima, Akira Sasagawa, Akira Wada, Hideyuki Hosoya, Takashi Takizawa, Kenichiro Abe
BoardofDirectors,AuditorsandOfficers
Risks
34 Fujikura Annual Report 2016 Fujikura Annual Report 2016 35
Risks that could potentially have an adverse impact to the business performance, share price, and financial health of the Fujikura Group are discussed below. It should be noted that the risks involved with the forward-looking statements herein are those identified by the Fujikura Group in its securities report filed with the Ministry of Finance (submitted on June 29, 2016).
(1) Demand trends Given that our products are mainly used in infrastructures or are components used in finished consumer goods, our business performance is, almost without fail, impacted by economic cycles. In addition, capital expenditure trends in various markets and changes in consumer purchasing attitudes are also factors that impact our performance.
(2) Fluctuations in foreign exchange rates We carry out currency hedging strategies within the scope of actual demand to minimize, to the best of our ability, the negative impact that currency rate fluctuations have on foreign-currency denominated sales. There is possibility of an adverse impact to earnings due to exchange rate fluctuations, as we cannot always fully avert exchange rate risks. Moreover, Group operations include the manufacturing and sales of products overseas, primarily in Asia. Accordingly, the earnings, expenses, assets, and other items denominated in local currencies, are translated into yen when we create our consolidated financial statements. Depending on the foreign exchange rates at the time, although these accounting items retain their value in local currencies, there is a possibility value will be eroded after conversion into yen.
(3) Fluctuations in materials costsCopper is the main material used in Group products. Copper prices fluctuate mainly depending on shifts in international supply-demand trends. A sharp change in copper price cannot always be readily reflected in product prices. Consequently, there is a possibility that a pronounced upshot in copper prices could impact the Group’s business performance.
(4) Product defectsThe Fujikura Group carries out the manufacturing of various products in accordance with strict product quality control standards. Nonetheless, there is no guarantee that we will never experience a product defect or that quality complaints will not arise further out. We have product liability insurance but there is no assurance that this policy will cover all of our liability costs in the end. Serious complaints and product
defects that lead to product liability cases trigger considerable costs and have a grave impact on how society evaluates the Group. The adverse impact connected with this includes the possibility of a decline in sales.
(5) RegulationsThe regulations in the markets in which we operate apply to our business activities. There are a number of regulations, including government approval and authorization for businesses and investments, regulations and taxes on business transactions and trade, regulations controlling financial transactions, and environmental restrictions. The Fujikura Group carries out its business activities in compliance with these regulations. Going forward, the business activities of our Group could potentially be limited, should it become difficult to comply with laws and ordinances after key revisions have been made or if tougher restrictions are put in place. We anticipate a rise in costs to remain in compliance with these regulations. This will potentially have an adverse impact on Group earnings.
(6) Lawsuits, legal action by regulatory authorities, and other legal procedures
In performing our business activities, the Fujikura Group is at risk of lawsuits, legal action by regulatory authorities, and other legal issues. Potential risks include damage complaints stemming from lawsuits, legal action by regulatory authorities, other legal issues, fines being imposed by regulatory authorities, and restrictions placed on business operations. Lawsuits, legal action by regulatory authorities, and other legal procedures pose a potential risk to the Group’s businesses, earnings, and financial health.
(7) Political and economic trends We conduct our Power & Telecommunication Systems Company, Electronics Business Company and Automotive Products Company at home and abroad. Consequently, political unrest and other conditions, mainly in the countries in which we operate, could possibly have a negative impact on our business performance.
(8) Interest rate fluctuations Our financing takes into account a balance between the demand for capital, the climate in financial markets, and procurement methods. A rise in interest rates translates into a rise in interest payments. Accordingly, we view the rise in interest rates as a potential risk to our business performance.
standing corporate auditors can attend and voice their opinions at key
meetings, such as the Managing Directors Meeting, where decisions on
business operations are discussed. Auditors’ duties are not limited to
legal compliance activities as they are also guaranteed participation in
management activities, such as Board of Director meetings. In addition,
regular meetings are held with executive officers to exchange opinions
and opportunities are provided for auditors to request information.
The Audit Division was set up as a dedicated internal audit entity.
In FY2015, the division conducted audits of five divisions (mainly sales
and marketing divisions) and ten Group companies. The Audit Division
also routinely exchanges audit information with the corporate auditors.
Also, when necessary, audit operations at the Audit Division are carried
out under the guidance and direction of the corporate auditors and
audit results are reported on a regular basis to the corporate auditors.
At the start of every fiscal year, accounting auditors provide an
explanation of their audit plans to corporate auditors. The accounting
auditors report the results of their quarterly and fiscal year-end audits,
versus the plan at the start of the year, to the corporate auditors.
Moreover, to facilitate an adequate exchange of opinions, corporate
auditors hold discussions several times a year with accounting auditors
to confer on details, the audit system, and other issues.
Lastly, Mr. Oda has accumulated many years of experience in
the Finance and Accounting Division of our company and possesses
considerable knowledge of finance and accounting. Mr. Masaaki
Shimojima was appointed as an outside corporate auditor. He held a
key position at a major city bank for many years and is well-versed in
finance and accounting.
(3) Independent board member and outside corporate auditors
As of the release of this report, Fujikura has one independent board
member, Mr. Kenichiro Abe, and two outside corporate auditors, Mr.
Soichiro Sekiuchi and Mr. Masaaki Shimojima. Mr. Kenichiro Abe,
an independent board member, is a certified public accountant.
Owing to his highly specialized expertise, he is qualified to serve
as an independent board member, which requires he maintain an
independent status.
He is capable of effectively carrying out the duties of a board
member, given his ample knowledge of corporate management
gleaned from many years working as an accounting auditor for
numerous companies. We note that he was previously a Representative
Partner at PricewaterhouseCoopers Aarata, which is our accounting
firm, but left the company in June 2012. He was not an audit partner
for Fujikura while at PricewaterhouseCoopers Aarata.
Mr. Soichiro Sekiuchi, an outside corporate auditor, is a publicly
certified attorney. Given his highly specialized skills, he is qualified to
serve as an outside auditor, which requires he maintain an independent
status. He is capable of effectively carrying out the duties of an auditor,
given that he is widely knowledgeable in corporate management,
owing to his long career handling corporate legal matters. He has
no vested interest in the Company and is independent from the
management of Fujikura.
Mr. Masaaki Shimojima has considerable knowledge in finance
and accounting, as discussed above in (2) Internal audits and corporate
auditor’s audits. He is also well-versed and has great insight into
corporate management, is capable of objectively carrying out an audit
of our management, and is deemed able to assess the qualifications
of management. Mr. Shimojima previously was an executive officer
at Sumitomo Mitsui Banking Corporation, which is one of Fujikura’s
main banks, but retired in June 2003. The Fujikura Group’s borrowings
from Sumitomo Mitsui Banking Corporation stood at JPY 32,136
million as of March 31, 2015. This is marginal compared with our total
outstanding borrowings. There is no risk of a conflict of interest with
Fujikura’s general shareholders. It should be noted that Mr. Shimojima
has no vested interest in Fujikura.
Fujikura does not have its own independent status criteria or policy
for appointing independent board members or outside corporate
auditors. The Company references the following assessment standards
concerning the independence of independent board members as
stipulated by the Tokyo Stock Exchange, when appointing independent
board members and outside corporate auditors.
(Summary of criteria for determining the independence of independent
board members stipulated by the Tokyo Stock Exchange)
The party is not eligible should any of the following conditions (a. to
e.) apply.
a. A person who executes business for the company’s parent company
or a fellow subsidiary
b. A person or board member/executive officer of a company with
which said company is a major business partner or board member/
executive officer of a major business partner of the said company
c. A consultant, accounting professional or legal professional receiving
a large amount of money and other assets, other than board
member/auditor compensation, from the company
d. A person who met any of the above criteria recently
e. Close relatives of a person to whom any of the following (a) to (c)
applies:
(a) A person mentioned in a. to d. above
(b) A person who executes business for the company or a subsidiary
of the company
(c) A person who met the criteria in (b) recently
As outside corporate auditors, Mr. Sekiuchi and Mr. Shimojima are
responsible for assessing the legal compliance and fairness of business
operations executed by board members by conducting on-site
inspections of divisions and Group companies, reviewing important
documents, and participating in Board of Director meetings. They also
work together with the standing corporate auditors by reporting and
discussing their findings at monthly Board of Auditors meetings. The
outside corporate auditors also receive materials related to meetings of
the Board of Directors and Board of Auditors in advance.
The Audit Division, which is a dedicated internal audit entity,
provides adequate support to outside corporate auditors, mainly by
appropriately conveying information on internal audits.
36 Fujikura Annual Report 2016 Fujikura Annual Report 2016 37
38 Management Discussion & Analysis
40 Financial Review40 ConsolidatedBalanceSheets
42 ConsolidatedStatementsofIncome
43 ConsolidatedStatementsof ComprehensiveIncome
46 ConsolidatedStatementsofCashFlows
47 NotestotheConsolidatedFinancial Statements
68 IndependentAuditor’sReport
FinancialSection(9) Intellectual properties
We protect our proprietary technologies with patents and other intellectual property rights. At the same time, we are very cautious not to infringe on the intellectual property rights of a third party. However, during the diversification of product structure and manufacturing technologies, and the expansion of our business operations overseas, there is a possibility that our products could inadvertently breach the intellectual property rights of rival products. In this case, we would inevitably have to halt sales and implement corrective measures, such as changing our product design. Also, a third party could infringe upon our intellectual property rights but due to the differences in laws in other countries, there is a possibility our rights would not be adequately protected. In light of this, we view this as another potential risk to our business activities and performance.
(10) Information leakThe Group possesses a substantial amount of private individual and sensitive information related to its business activities. We are doing our utmost to maintain the confidentiality of this information. However, we cannot rule out the possibility of this information being leaked externally due to some unexpected incident. This type of information leak would potentially damage our image and result in compensation for damages, which in turn would have a negative impact on Group earnings and financial health.
(11) Disaster risk
The Fujikura Group has a number of factories in Japan and overseas. In the event our production facilities are destroyed due to a natural disaster at one of our factory locations, including wind and water damage due to a large-scale earthquake or typhoon, it is likely that our capacity utilization would decline due to suspended operations and expenses would increase due to reflecting facilities repairs. Natural disaster would potentially have a negative impact on the Fujikura Group’s production system, its financial health, and earnings.
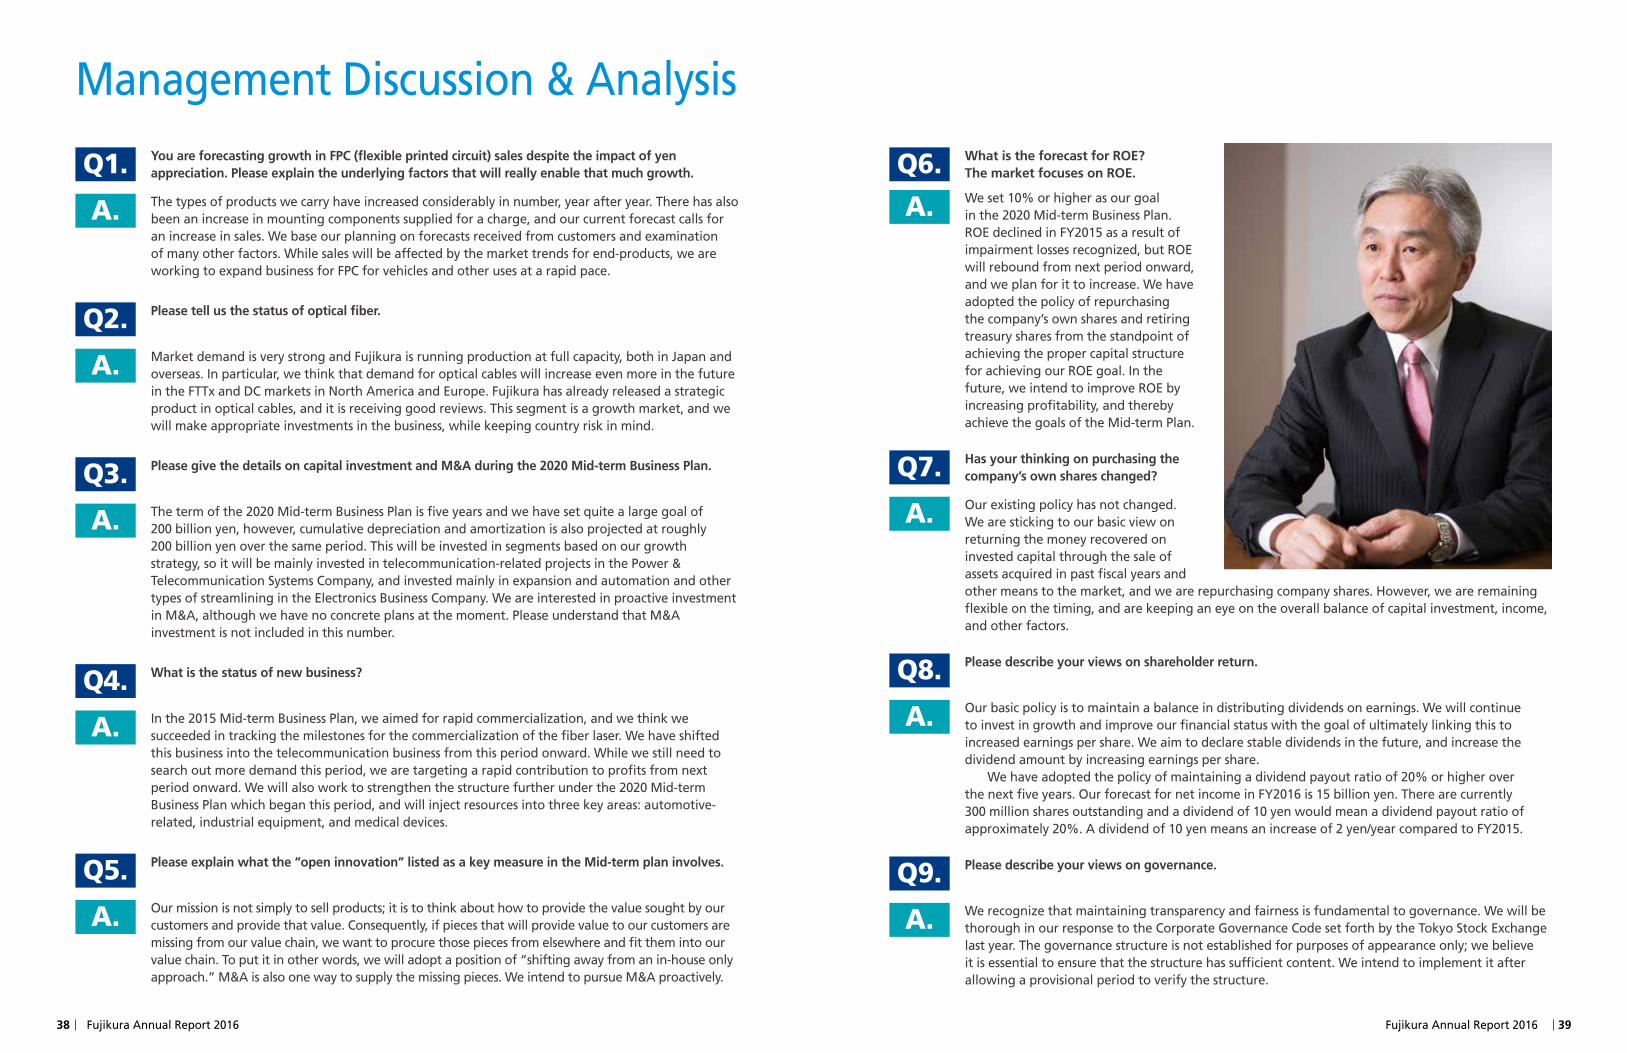
ManagementDiscussion&Analysis
38 Fujikura Annual Report 2016 Fujikura Annual Report 2016 39
Q6. What is the forecast for ROE? The market focuses on ROE.
A. Weset10%orhigherasourgoalinthe2020Mid-termBusinessPlan.ROEdeclinedinFY2015asaresultofimpairmentlossesrecognized,butROEwillreboundfromnextperiodonward,andweplanforittoincrease.Wehaveadopted the policy of repurchasing thecompany’sownsharesandretiringtreasury shares from the standpoint of achieving the proper capital structure forachievingourROEgoal.Inthefuture,weintendtoimproveROEbyincreasingprofitability,andtherebyachievethegoalsoftheMid-termPlan.
Q7. Has your thinking on purchasing the company’s own shares changed?
A. Our existing policy has not changed. Wearestickingtoourbasicviewonreturning the money recovered on invested capital through the sale of assetsacquiredinpastfiscalyearsandothermeanstothemarket,andwearerepurchasingcompanyshares.However,weareremainingflexibleonthetiming,andarekeepinganeyeontheoverallbalanceofcapitalinvestment,income,and other factors.
Q8. Please describe your views on shareholder return.
A. Ourbasicpolicyistomaintainabalanceindistributingdividendsonearnings.Wewillcontinuetoinvestingrowthandimproveourfinancialstatuswiththegoalofultimatelylinkingthistoincreasedearningspershare.Weaimtodeclarestabledividendsinthefuture,andincreasethedividend amount by increasing earnings per share.
Wehaveadoptedthepolicyofmaintainingadividendpayoutratioof20%orhigheroverthenextfiveyears.OurforecastfornetincomeinFY2016is15billionyen.Therearecurrently300 million shares outstanding and a dividend of 10 yen would mean a dividend payout ratio of approximately20%.Adividendof10yenmeansanincreaseof2yen/yearcomparedtoFY2015.
Q9. Please describe your views on governance.
A. Werecognizethatmaintainingtransparencyandfairnessisfundamentaltogovernance.WewillbethoroughinourresponsetotheCorporateGovernanceCodesetforthbytheTokyoStockExchangelast year. The governance structure is not established for purposes of appearance only; we believe itisessentialtoensurethatthestructurehassufficientcontent.Weintendtoimplementitafterallowing a provisional period to verify the structure.
Q1. You are forecasting growth in FPC (flexible printed circuit) sales despite the impact of yen appreciation. Please explain the underlying factors that will really enable that much growth.
A. Thetypesofproductswecarryhaveincreasedconsiderablyinnumber,yearafteryear.Therehasalsobeenanincreaseinmountingcomponentssuppliedforacharge,andourcurrentforecastcallsforanincreaseinsales.Webaseourplanningonforecastsreceivedfromcustomersandexaminationofmanyotherfactors.Whilesaleswillbeaffectedbythemarkettrendsforend-products,weareworkingtoexpandbusinessforFPCforvehiclesandotherusesatarapidpace.
Q2. Please tell us the status of optical fiber.
A. MarketdemandisverystrongandFujikuraisrunningproductionatfullcapacity,bothinJapanandoverseas.Inparticular,wethinkthatdemandforopticalcableswillincreaseevenmoreinthefutureintheFTTxandDCmarketsinNorthAmericaandEurope.Fujikurahasalreadyreleasedastrategicproductinopticalcables,anditisreceivinggoodreviews.Thissegmentisagrowthmarket,andwewillmakeappropriateinvestmentsinthebusiness,whilekeepingcountryriskinmind.
Q3. Please give the details on capital investment and M&A during the 2020 Mid-term Business Plan.
A. Thetermofthe2020Mid-termBusinessPlanisfiveyearsandwehavesetquitealargegoalof200 billionyen,however,cumulativedepreciationandamortizationisalsoprojectedatroughly200 billion yen over the same period. This will be invested in segments based on our growth strategy,soitwillbemainlyinvestedintelecommunication-relatedprojectsinthePower&TelecommunicationSystemsCompany,andinvestedmainlyinexpansionandautomationandothertypesofstreamliningintheElectronicsBusinessCompany.WeareinterestedinproactiveinvestmentinM&A,althoughwehavenoconcreteplansatthemoment.PleaseunderstandthatM&Ainvestment is not included in this number.
Q4. What is the status of new business?
A. Inthe2015Mid-termBusinessPlan,weaimedforrapidcommercialization,andwethinkwesucceededintrackingthemilestonesforthecommercializationofthefiberlaser.Wehaveshiftedthisbusinessintothetelecommunicationbusinessfromthisperiodonward.Whilewestillneedtosearchoutmoredemandthisperiod,wearetargetingarapidcontributiontoprofitsfromnextperiodonward.Wewillalsoworktostrengthenthestructurefurtherunderthe2020Mid-termBusinessPlanwhichbeganthisperiod,andwillinjectresourcesintothreekeyareas:automotive-related,industrialequipment,andmedicaldevices.
Q5. Please explain what the “open innovation” listed as a key measure in the Mid-term plan involves.
A. Our mission is not simply to sell products; it is to think about how to provide the value sought by our customersandprovidethatvalue.Consequently,ifpiecesthatwillprovidevaluetoourcustomersaremissingfromourvaluechain,wewanttoprocurethosepiecesfromelsewhereandfitthemintoourvaluechain.Toputitinotherwords,wewilladoptapositionof“shiftingawayfromanin-houseonlyapproach.”M&Aisalsoonewaytosupplythemissingpieces.WeintendtopursueM&Aproactively.
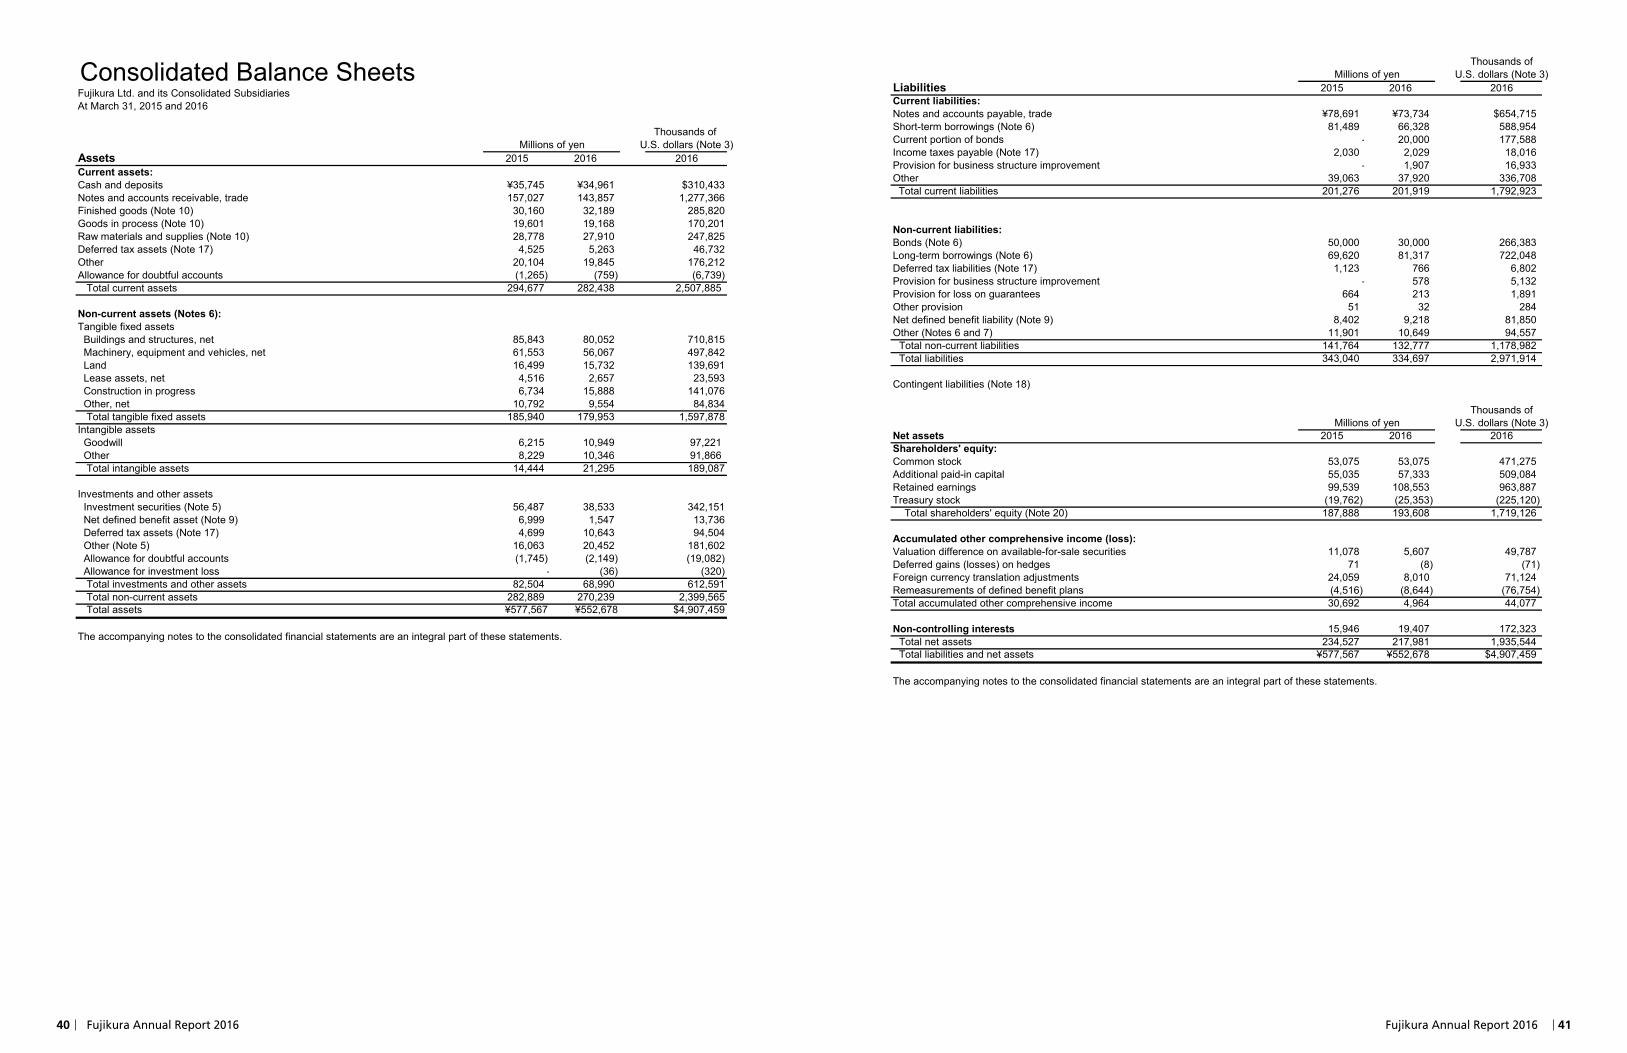
40 Fujikura Annual Report 2016 Fujikura Annual Report 2016 41
Thousands ofMillions of yen U.S. dollars (Note 3)
Liabilities 2015 2016 2016Current liabilities:Notes and accounts payable, trade ¥78,691 ¥73,734 $654,715Short-term borrowings (Note 6) 81,489 66,328 588,954Current portion of bonds - 20,000 177,588Income taxes payable (Note 17) 2,030 2,029 18,016Provision for business structure improvement - 1,907 16,933Other 39,063 37,920 336,708 Total current liabilities 201,276 201,919 1,792,923
Non-current liabilities:Bonds (Note 6) 50,000 30,000 266,383Long-term borrowings (Note 6) 69,620 81,317 722,048Deferred tax liabilities (Note 17) 1,123 766 6,802Provision for business structure improvement - 578 5,132Provision for loss on guarantees 664 213 1,891Other provision 51 32 284Net defined benefit liability (Note 9) 8,402 9,218 81,850Other (Notes 6 and 7) 11,901 10,649 94,557
Total non-current liabilities 141,764 132,777 1,178,982Total liabilities 343,040 334,697 2,971,914
Contingent liabilities (Note 18)
Thousands ofMillions of yen U.S. dollars (Note 3)
Net assets 2015 2016 2016Shareholders' equity:Common stock 53,075 53,075 471,275Additional paid-in capital 55,035 57,333 509,084Retained earnings 99,539 108,553 963,887Treasury stock (19,762) (25,353) (225,120) Total shareholders' equity (Note 20) 187,888 193,608 1,719,126
Accumulated other comprehensive income (loss):Valuation difference on available-for-sale securities 11,078 5,607 49,787Deferred gains (losses) on hedges 71 (8) (71)Foreign currency translation adjustments 24,059 8,010 71,124Remeasurements of defined benefit plans (4,516) (8,644) (76,754)Total accumulated other comprehensive income 30,692 4,964 44,077
Non-controlling interests 15,946 19,407 172,323Total net assets 234,527 217,981 1,935,544Total liabilities and net assets ¥577,567 ¥552,678 $4,907,459
The accompanying notes to the consolidated financial statements are an integral part of these statements.
Consolidated Balance SheetsFujikura Ltd. and its Consolidated Subsidiaries At March 31, 2015 and 2016
Thousands of Millions of yen U.S. dollars (Note 3)
Assets 2015 2016 2016Current assets:Cash and deposits ¥35,745 ¥34,961 $310,433Notes and accounts receivable, trade 157,027 143,857 1,277,366Finished goods (Note 10) 30,160 32,189 285,820Goods in process (Note 10) 19,601 19,168 170,201Raw materials and supplies (Note 10) 28,778 27,910 247,825Deferred tax assets (Note 17) 4,525 5,263 46,732Other 20,104 19,845 176,212Allowance for doubtful accounts (1,265) (759) (6,739) Total current assets 294,677 282,438 2,507,885
Non-current assets (Notes 6):Tangible fixed assets Buildings and structures, net 85,843 80,052 710,815 Machinery, equipment and vehicles, net 61,553 56,067 497,842 Land 16,499 15,732 139,691 Lease assets, net 4,516 2,657 23,593 Construction in progress 6,734 15,888 141,076 Other, net 10,792 9,554 84,834 Total tangible fixed assets 185,940 179,953 1,597,878Intangible assets Goodwill 6,215 10,949 97,221 Other 8,229 10,346 91,866 Total intangible assets 14,444 21,295 189,087
Investments and other assets Investment securities (Note 5) 56,487 38,533 342,151 Net defined benefit asset (Note 9) 6,999 1,547 13,736 Deferred tax assets (Note 17) 4,699 10,643 94,504 Other (Note 5) 16,063 20,452 181,602 Allowance for doubtful accounts (1,745) (2,149) (19,082) Allowance for investment loss - (36) (320) Total investments and other assets 82,504 68,990 612,591 Total non-current assets 282,889 270,239 2,399,565 Total assets ¥577,567 ¥552,678 $4,907,459
The accompanying notes to the consolidated financial statements are an integral part of these statements.

42 Fujikura Annual Report 2016 Fujikura Annual Report 2016 43
Consolidated Statements of Comprehensive IncomeFujikura Ltd. and its Consolidated Subsidiaries For the Years Ended March 31, 2015 and 2016
Thousands of Millions of yen U.S. dollars (Note 3)
2015 2016 2016Profit ¥13,324 ¥12,549 $111,428Other comprehensive income Valuation difference on available-for-sale securities 4,493 (5,409) (48,029) Deferred gains (losses) on hedges 123 (13) (115) Foreign currency translation adjustments 18,489 (16,314) (144,859) Remeasurements of defined benefit plans, net of taxes 213 (4,185) (37,160) Share of other comprehensive income of associates accounted for using equity method 849 (508) (4,511) Other comprehensive income (Note 14) 24,169 (26,431) (234,692)Comprehensive income 37,493 (13,881) (123,255)(Breakdown) Comprehensive income attributable to owners of parent 35,245 (14,410) (127,952) Comprehensive income attributable to non-controlling interests ¥2,248 ¥529 $4,697
The accompanying notes to the consolidated financial statements are an integral part of these statements.
Consolidated Statements of IncomeFujikura Ltd. and its Consolidated Subsidiaries For the Years Ended March 31, 2015 and 2016
Thousands of Millions of yen U.S. dollars (Note 3)
2015 2016 2016Net sales ¥661,510 ¥678,528 $6,024,933Cost of sales (Notes 8, 9 and 10) 547,359 551,920 4,900,728Gross profit 114,150 126,607 1,124,196Selling, general and administrative expenses (Notes 8 and 9):Packing and transportation expenses 17,254 16,592 147,327Personnel expenses 35,625 39,623 351,829Other 36,195 37,758 335,269Total selling, general and administrative expenses 89,075 93,974 834,434 Operating income 25,075 32,632 289,753
Non-operating income:Interest income 271 227 2,016Dividend income 1,077 1,210 10,744Foreign exchange gains 883 134 1,190Reversal for product repair expenses 222 313 2,779Other 1,173 838 7,441Total non-operating income 3,627 2,725 24,196Non-operating expenses:Interest expenses 3,016 2,783 24,711Share of loss of entities accounted for using equity method 343 2,918 25,910Litigation expenses 1,426 1,389 12,334Other 2,834 3,635 32,277Total non-operating expenses 7,620 10,727 95,250 Ordinary income 21,082 24,629 218,691Extraordinary gains:Gain on sales of investment securities 128 2,420 21,488Gain on sales of fixed assets (Note 11) 705 325 2,886Gain on bargain purchase 817 - -Gain on refunds of retirement benefit trust (Note 12) 576 - -Other 23 - -Total extraordinary gains 2,250 2,745 24,374Extraordinary losses:Business structure improvement expenses (Note 13) 276 7,801 69,268Litigation settlement - 1,155 10,256Other 2,820 1,227 10,895Total extraordinary losses 3,097 10,183 90,419 Income before income taxes 20,235 17,191 152,646
Income taxes (Note 17):Current 7,381 8,711 77,349Deferred (471) (4,069) (36,130)Total income taxes 6,910 4,641 41,209Profit 13,324 12,549 111,428Profit attributable to non-controlling interests 1,123 1,232 10,939
Profit attributable to owners of parent ¥12,201 ¥11,317 $100,488
The accompanying notes to the consolidated financial statements are an integral part of these statements.
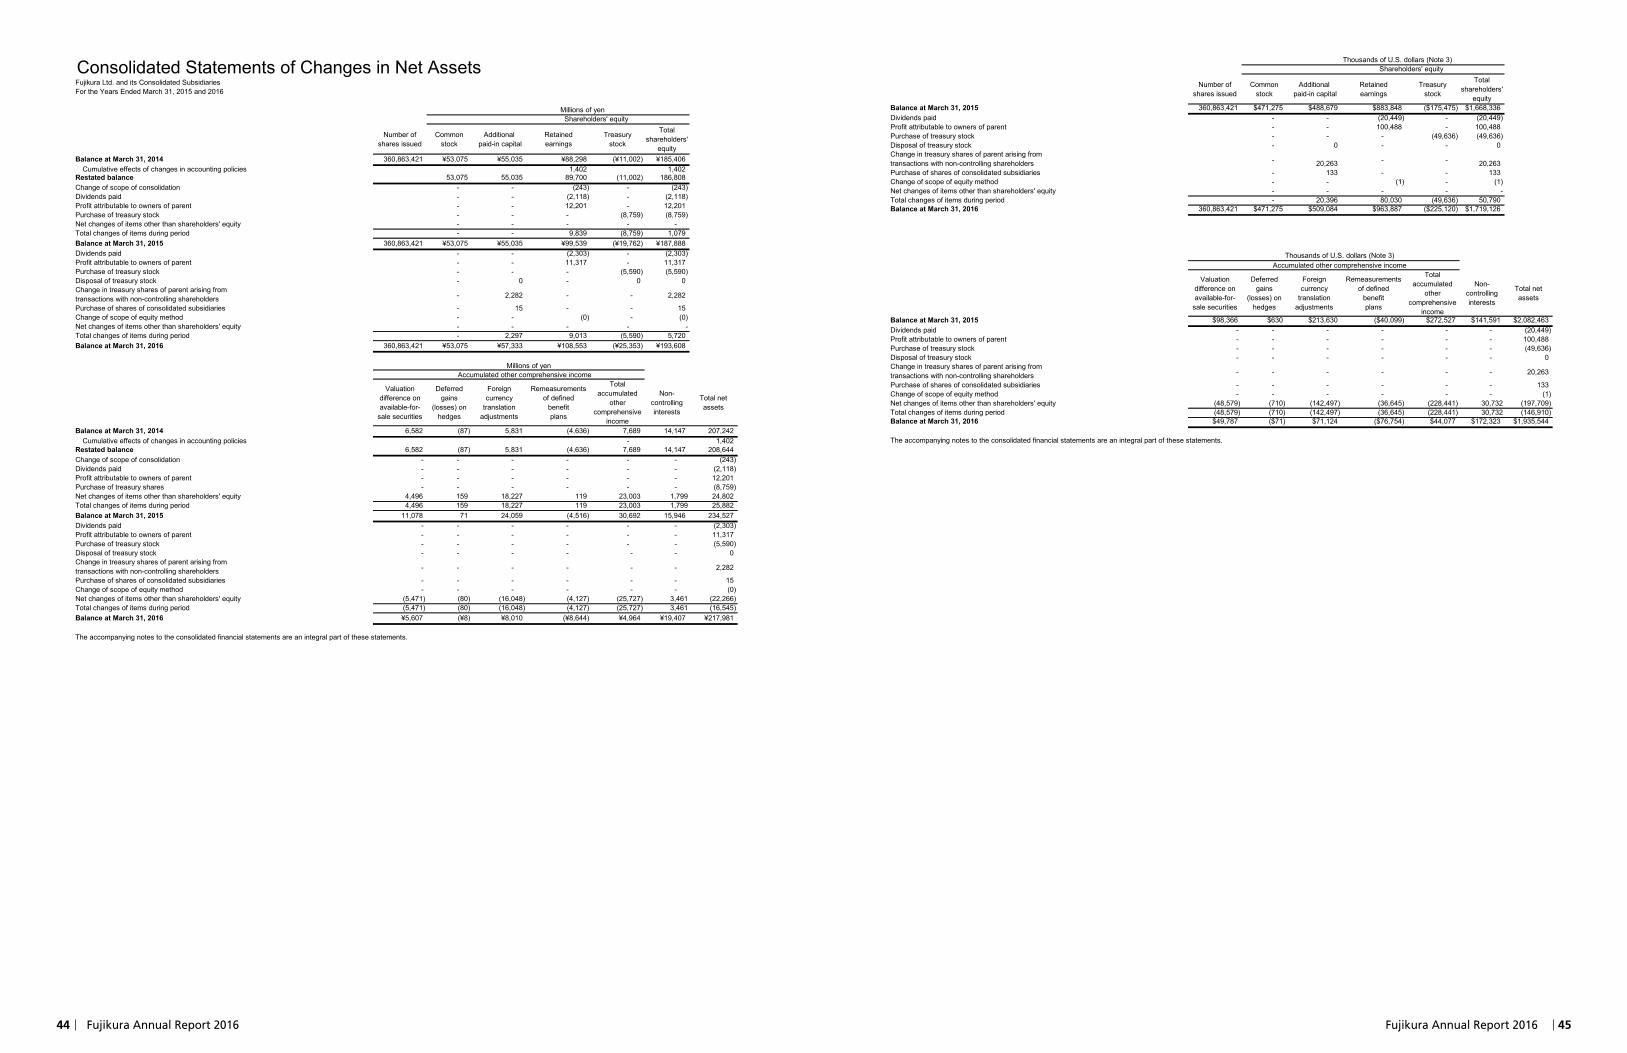
44 Fujikura Annual Report 2016 Fujikura Annual Report 2016 45
Thousands of U.S. dollars (Note 3) Shareholders' equity
Number ofshares issued
Commonstock
Additional paid-in capital
Retainedearnings
Treasurystock
Totalshareholders'
equityBalance at March 31, 2015 360,863,421 $471,275 $488,679 $883,848 ($175,475) $1,668,336Dividends paid - - (20,449) - (20,449)Profit attributable to owners of parent - - 100,488 - 100,488Purchase of treasury stock - - - (49,636) (49,636)Disposal of treasury stock - 0 - - 0Change in treasury shares of parent arising fromtransactions with non-controlling shareholders - 20,263 - - 20,263Purchase of shares of consolidated subsidiaries - 133 - - 133Change of scope of equity method - - (1) - (1)Net changes of items other than shareholders' equity - - - - -Total changes of items during period - 20,396 80,030 (49,636) 50,790Balance at March 31, 2016 360,863,421 $471,275 $509,084 $963,887 ($225,120) $1,719,126
Thousands of U.S. dollars (Note 3) Accumulated other comprehensive income
Valuationdifference onavailable-for-
sale securities
Deferredgains
(losses) onhedges
Foreigncurrency
translationadjustments
Remeasurementsof defined
benefitplans
Totalaccumulated
othercomprehensive
income
Non-controllinginterests
Total netassets
Balance at March 31, 2015 $98,366 $630 $213,630 ($40,099) $272,527 $141,591 $2,082,463Dividends paid - - - - - - (20,449)Profit attributable to owners of parent - - - - - - 100,488Purchase of treasury stock - - - - - - (49,636)Disposal of treasury stock - - - - - - 0Change in treasury shares of parent arising fromtransactions with non-controlling shareholders - - - - - - 20,263
Purchase of shares of consolidated subsidiaries - - - - - - 133Change of scope of equity method - - - - - - (1)Net changes of items other than shareholders' equity (48,579) (710) (142,497) (36,645) (228,441) 30,732 (197,709)Total changes of items during period (48,579) (710) (142,497) (36,645) (228,441) 30,732 (146,910)Balance at March 31, 2016 $49,787 ($71) $71,124 ($76,754) $44,077 $172,323 $1,935,544
The accompanying notes to the consolidated financial statements are an integral part of these statements.
Consolidated Statements of Changes in Net AssetsFujikura Ltd. and its Consolidated Subsidiaries For the Years Ended March 31, 2015 and 2016
Millions of yen Shareholders' equity
Number ofshares issued
Commonstock
Additional paid-in capital
Retainedearnings
Treasurystock
Totalshareholders'
equityBalance at March 31, 2014 360,863,421 ¥53,075 ¥55,035 ¥88,298 (¥11,002) ¥185,406 Cumulative effects of changes in accounting policies 1,402 1,402Restated balance 53,075 55,035 89,700 (11,002) 186,808Change of scope of consolidation - - (243) - (243)Dividends paid - - (2,118) - (2,118)Profit attributable to owners of parent - - 12,201 - 12,201Purchase of treasury stock - - - (8,759) (8,759)Net changes of items other than shareholders' equity - - - - -Total changes of items during period - - 9,839 (8,759) 1,079Balance at March 31, 2015 360,863,421 ¥53,075 ¥55,035 ¥99,539 (¥19,762) ¥187,888Dividends paid - - (2,303) - (2,303)Profit attributable to owners of parent - - 11,317 - 11,317Purchase of treasury stock - - - (5,590) (5,590)Disposal of treasury stock - 0 - 0 0Change in treasury shares of parent arising fromtransactions with non-controlling shareholders - 2,282 - - 2,282
Purchase of shares of consolidated subsidiaries - 15 - - 15Change of scope of equity method - - (0) - (0)Net changes of items other than shareholders' equity - - - - -Total changes of items during period - 2,297 9,013 (5,590) 5,720Balance at March 31, 2016 360,863,421 ¥53,075 ¥57,333 ¥108,553 (¥25,353) ¥193,608
Millions of yen Accumulated other comprehensive income
Valuationdifference onavailable-for-
sale securities
Deferredgains
(losses) onhedges
Foreigncurrency
translationadjustments
Remeasurementsof defined
benefitplans
Totalaccumulated
othercomprehensive
income
Non-controllinginterests
Total netassets
Balance at March 31, 2014 6,582 (87) 5,831 (4,636) 7,689 14,147 207,242 Cumulative effects of changes in accounting policies - 1,402Restated balance 6,582 (87) 5,831 (4,636) 7,689 14,147 208,644Change of scope of consolidation - - - - - - (243)Dividends paid - - - - - - (2,118)Profit attributable to owners of parent - - - - - - 12,201Purchase of treasury shares - - - - - - (8,759)Net changes of items other than shareholders' equity 4,496 159 18,227 119 23,003 1,799 24,802Total changes of items during period 4,496 159 18,227 119 23,003 1,799 25,882Balance at March 31, 2015 11,078 71 24,059 (4,516) 30,692 15,946 234,527Dividends paid - - - - - - (2,303)Profit attributable to owners of parent - - - - - - 11,317Purchase of treasury stock - - - - - - (5,590)Disposal of treasury stock - - - - - - 0Change in treasury shares of parent arising fromtransactions with non-controlling shareholders - - - - - - 2,282
Purchase of shares of consolidated subsidiaries - - - - - - 15Change of scope of equity method - - - - - - (0)Net changes of items other than shareholders' equity (5,471) (80) (16,048) (4,127) (25,727) 3,461 (22,266)Total changes of items during period (5,471) (80) (16,048) (4,127) (25,727) 3,461 (16,545)Balance at March 31, 2016 ¥5,607 (¥8) ¥8,010 (¥8,644) ¥4,964 ¥19,407 ¥217,981
The accompanying notes to the consolidated financial statements are an integral part of these statements.

46 Fujikura Annual Report 2016 Fujikura Annual Report 2016 47
Notes to the Consolidated Financial StatementsFujikura Ltd. and its Consolidated SubsidiariesFor the years ended March 31, 2015 and 2016
1. Basis of PresentationAccounting principles
The accompanying Consolidated Financial Statements of Fujikura Ltd. (the "Company") and its consolidated subsidiaries (together, the "Companies")are prepared on the basis of accounting principles generally accepted in Japan, which are different in certain respects, application and disclosure requirements, from International Financial Reporting Standards, and are prepared by the Company as required by the Financial Instruments and Exchange Act of Japan.The Company adopted the "Practical Solution on Unification of Accounting Policies Applied to Foreign Subsidiaries for Consolidated FinancialStatements" (Accounting Standard Board of Japan ("ASBJ") PITF No. 18, Mar 26, 2015) and "Practical Solution on Unification of Accounting Policies Applied to Associates Accounted for Using the Equity Method" (PITF No. 24, March 10, 2008) and made necessary adjustments for the preparation of the Consolidated Financial Statements.In preparing the Consolidated Financial Statements, certain reclassification and presentation adjustments have been made to the Consolidated Financial Statements filed with the Director of the Kanto Local Finance Bureau in Japan in order to present these Consolidated Financial Statements in a form which is more familiar to readers of these Consolidated Financial Statements outside Japan.
2. Summary of Significant Accounting Policies(a) Consolidation and investments in affiliates
The Consolidated Financial Statements include the accounts of the Company and all significant subsidiaries (99 subsidiaries at March 31, 2015 and 2016). All significant intercompany transactions, accounts and unrealized intercompany profits are eliminated in consolidation. The difference between the cost and the underlying net equity of the investment in consolidated subsidiaries at the time of acquisition is deferred and amortized over a five-year period. Investments of 50% or less in companies over which the parent company does not have control but has theability to exercise significant influence, and investments in unconsolidated subsidiaries are generally accounted for by the equity method(8 companies at March 31, 2015 and 10 companies at March 31, 2016) and included in Investment securities in the Consolidated Balance Sheets.When the accounts of subsidiaries and affiliates are not significant in relation to the Consolidated Financial Statements, they are carried at cost.The excess of the cost over the underlying net equity of investments in unconsolidated subsidiaries and affiliates accounted for on an equity basisis deferred and amortized over a five-year period. Consolidated net income includes the Company's Equity in earnings of affiliates after eliminationof unrealized intercompany profits.
(b) Translation of foreign currency transactions and accountsForeign currency transactions are translated using the foreign exchange rates prevailing at the transaction dates. Receivables and payablesdenominated in foreign currencies are translated at the balance sheet date using current exchange rates. All asset and liability accounts of foreign subsidiaries and affiliates are translated into Japanese Yen at current exchange rates at the respective balance sheet dates and all income and expense accounts of those subsidiaries are translated at the average exchange rate for the respective fiscal year then ended.Foreign currency financial statement translation differences are reported as a separate component of Net Assets in the Consolidated Balance Sheets.
(c) Consolidated Statement of Cash FlowsFor the purpose of reporting cash flows, cash and cash equivalents include all highly liquid investments, with original maturities of three months orless, that are readily convertible to known amounts of cash and are so near maturity that they present only an insignificant risk of change in value because of changes in interest rates.
(d) Valuation of Investment securitiesSecurities held by the Companies have been classified into the following categories depending on the purpose for which they are held:Held-to-maturity debt securities: These securities are carried at amortized cost. Any premium or discount arising on acquisition is amortized and recognized as an adjustment to interest income/expense.Other securities: These securities are investment securities expected to be held in the long term. Securities for which fair values are readily determinable are carried at fair value with unrealized gains and losses, net of applicable income taxes, being recorded in net assets. Securities for which fair values are not readily determinable are recorded using the moving average cost.
(e) InventoriesInventories are valued at the lower of cost or market, cost being determined mainly using the weighted average method.
(f) Property, plant and equipmentDepreciation of property, plant and equipment is generally computed using the declining-balance method, except for buildings acquired on and after April 1, 1998, and Intangible fixed assets which are depreciated using the straight-line method, over estimated useful lives. The estimated useful lives are as follows:
Buildings: mainly 50 yearsMachinery and equipment: mainly 7 yearsIntangible fixed assets: mainly 5 years
(g) Lease assetsFinance leases are depreciated using the straight-line method over their respective lease terms with no residual values.
(h) Allowance for doubtful accountsAllowance for doubtful accounts provides for estimated uncollectible accounts at amounts either specifically assessed or an amountcomputed based on historical loss experience.
(i) Allowance for investment lossAllowance for investment loss provides for anticipated losses due to the decline of values of investments in unconsolidated subsidiaries andaffiliates, considering financial conditions, etc.
(j) Provision for loss on guaranteesProvision for loss on guarantees provides for anticipated losses due to execution of guarantees, considering financial conditions in guaranteedcompanies.
(k) Provision for business structure improvementProvision for business structure improvement are to cover losses incurred due to improvements made to the business structure.Accordingly, a reasonably estimated amount is posted to this allowance to cover expenses that are likely to arise going forward.
Consolidated Statements of Cash FlowsFujikura Ltd. and its Consolidated SubsidiariesFor the Years Ended March 31, 2015 and 2016
Thousands of Millions of yen U.S. dollars (Note 3)
2015 2016 2016Cash flows from operating activities:Income before income taxes ¥20,235 ¥17,191 $152,646Depreciation and amortization 27,732 26,311 233,626Amortization of goodwill 2,346 3,149 27,961Increase (decrease) in provisions (1,189) 396 3,516Interest and dividend income (1,348) (1,437) (12,760)Interest expenses 3,016 2,783 24,711Equity in (earnings) losses of affiliates 343 2,918 25,910Business structure improvement expenses 165 6,358 56,455Changes in assets and liabilities: Notes and accounts receivable, trade (1,410) 4,432 39,354 Inventories (8,857) (4,579) (40,659) Notes and accounts payable, trade (10,398) 559 4,964Decrease (increase) in net defined benefit asset 4,443 1,367 12,138Increase (decrease) in net defined benefit liability 283 (642) (5,701)Other, net (6,281) (887) (7,876) Sub-total 29,080 57,923 514,323Interest and dividend income received 1,807 2,018 17,919Interest paid (3,019) (2,876) (25,537)Income taxes (paid) refund (7,224) (8,791) (78,059) Net cash provided by (used in) operating activities 20,643 48,274 428,645Cash flows from investing activities:Net decrease (increase) in time deposits (516) (1,099) (9,758)Payments for purchase of property, plant and equipment and other assets (24,257) (30,821) (273,673)Proceeds from sales of property, plant and equipment and other assets 4,341 2,481 22,030Proceeds from sales of investment securities 513 4,313 38,297Payments of loans receivable (852) (791) (7,024)Collection of loans receivable 1,474 225 1,998Purchase of long-term prepaid expenses (850) (2,464) (21,879)Proceeds from transfer of business - 1,802 16,001Purchase of investments in subsidiaries resulting in change in scope of consolidation (Note 16) - (9,731) (86,406)Proceeds from sales of shares of subsidiaries resulting inchange in scope of consolidation - 45 400
Purchase of shares of subsidiaries and associates (1,694) - -Payments for investments in capital of subsidiaries and affiliates (2,405) (1,222) (10,851)Purchase of stocks of affiliates accounted for by equity method-treasury stock (1,500) - -Other, net (323) (19) (169) Net cash provided by (used in) investing activities (26,071) (37,283) (331,051)Cash flows from financing activities:Net increase (decrease) in short-term loans payable 5,195 (3,402) (30,208)Net increase (decrease) in commercial papers 4,000 (2,000) (17,759)Proceeds from long-term loans payable 4,000 22,808 202,522Repayment of long-term loans payable (7,005) (20,378) (180,945)Proceeds from share issuance to non-controlling shareholders 638 1,500 13,319Cash dividends paid (2,118) (2,303) (20,449)Purchase of treasury stock (8,759) (5,590) (49,636)Dividends paid to non-controlling interests (316) (565) (5,017)Other, net - 0 0 Net cash provided by (used in) financing activities (4,366) (9,932) (88,190)Effect of exchange rate change on cash and cash equivalents 2,965 (2,304) (20,458)Net increase (decrease) in cash and cash equivalents (6,828) (1,245) (11,055)Cash and cash equivalents at beginning of period 39,336 33,336 296,004Increase in cash and cash equivalents from newly consolidated subsidiaries 314 - -Increase in cash and cash equivalents resulting from merger with unconsolidated subsidiaries 514 - -Cash and cash equivalents at end of year (Note 15) ¥33,336 ¥32,091 $284,949
The accompanying notes to the consolidated financial statements are an integral part of these statements.
48 Fujikura Annual Report 2016 Fujikura Annual Report 2016 49
(l) Accounting method for retirement benefitsa. Attribution method for the estimated amount of retirement benefits In calculating retirement benefits obligations, the method to attribute the estimated amount of retirement benefits to a period until the end of the consolidated fiscal year is based on the plan’s benefit formula.b. Accounting methods for actuarial differences and prior service cost Prior service cost is accounted for according to the straight-line method as they are incurred for a certain number of years (principally fifteen years) within the average remaining years of service of employees at the time of incurring. Actuarial differences are charged to expenses from the fiscal year next to the fiscal year when incurred using a straight-line method mainly based on determined years (principally fifteen years) within the average remaining years of service of employees when incurred.
(m) Accounting for long-term construction-type contractsThe percentage-of-completion method of accounting is applied for the construction contracts which fulfill the conditions that the outcome of theconstruction activity is reasonably estimated during the course of the activity. Otherwise, the completed-contract method is applied. The cost-to-cost method is applied for estimating the percentage of completion.
(n) Hedge accounting The Companies apply hedge accounting for certain derivative financial instruments, which include foreign currency forward exchange contracts and interest rate swap agreements used as parts of the Companies' risk management of foreign currency and interest rate exposures within the normal course of the Companies' operations.Foreign currency exchange forward contracts: The Companies enter into foreign currency forward exchange contracts to limit exposure to changes in foreign currency exchange rates on accounts receivable and payable and cash flows generated from anticipated transactions denominated in foreign currencies. For foreign currency forward exchange contracts, which are designated as hedges, the Company has adopted the accounting method where foreign currency denominated assets and liabilities are measured at the contract rate of the respective foreign currency forward exchange contract. With respect to such contracts for anticipated transactions, the contracts are marked-to-market and the resulting unrealized gains/losses are deferred and recorded in the income statement when the exchange gains/losses on the hedged items or transactions are recognized.Interest rate swap agreements: The Companies enter into interest rate swap agreements in order to limit the Companies' exposure with respect of adverse fluctuations in interest rates underlying the debt instruments. The related interest differentials paid or received under the interest rate swap agreements are recognized in interest expense over the term of the agreements.
(o) Income taxesIncome taxes are computed using the asset and liability approach. Under this approach, deferred tax assets and liabilities are recognizedfor the expected future tax consequences of temporary differences between the financial reporting basis and tax basis of assets and liabilities.Valuation allowances are recorded to reduce deferred tax assets when it is more likely than not that the tax benefits will not be realized.The Company files its tax return under the consolidated tax filing system for notional taxes.
(p) Appropriations of retained earningsAppropriations of retained earnings reflected in the accompanying Consolidated Financial Statements are recorded upon approval bythe shareholders.
(q) Other basis for presentation of Consolidated Financial Statements Amounts less than ¥1 million have been omitted. As a result, the total shown in the Consolidated Financial Statements and notes thereto do not necessarily agree with the sum of the individual account balances.
(r) ReclassificationCertain accounts in the Consolidated Financial Statements for the year ended March 31, 2015 have been reclassified to conform tothe 2016 presentation.
(New Accounting Pronouncements and Accounting Change)(Application of Accounting Standards for Business Combination)
(Accounting Standards that were issued but not applied this fiscal year.)Implementation Guidance on Recoverability of Deferred Tax Assets (ASBJ Guidance No. 26 issued on March 28, 2016)
(a) Summary
(Revision of classification requirements and standards for treatment of deferred tax assets amounts)・ Treatment of companies that do not fulfill any of the requirements for classification from Category 1 to Category 5・ Requirements for classification as Category 2 and Category 3・ Treatment of deductible temporary differences that cannot be scheduled for companies applicable to Category 2・ Treatment concerning the reasonable estimable period of future taxable income not reflecting temporary differences for companies applicable to Category 3・ Treatment in cases where a company fulfilling the requirements of Category 4 is also applicable to Category 2 or Category 3
(b) Planned date to applyThe Company expects to apply the implementation guidance from the beginning of the fiscal year beginning on April 1, 2016
(c) The impact on the application of these Accounting Standards etc.
Effective from the fiscal year ended March 31, 2016, the Company has applied the “Accounting Standard for Business Combinations” (ASBJ Statement No. 21,September 13, 2013), the “Accounting Standard for Consolidated Financial Statements” (ASBJ Statement No. 22, September 13, 2013), the “Accounting Standard forBusiness Divestitures” (ASBJ Statement No. 7, September 13, 2013), etc. As a result, the method of recording the amount of difference caused by changes in theCompany’s ownership interests in subsidiaries in the case of subsidiaries under ongoing control of the Company was changed to one in which it is recorded as capitalsurplus, and the method of recording acquisition-related costs was changed to one in which they are recognized as expenses for the fiscal year in which they areincurred. Furthermore, for business combinations carried out on or after the beginning of the fiscal year ended March 31, 2016, the accounting method was changed toone in which the revised acquisition cost allocation resulting from the finalization of the provisional accounting treatment is reflected in the consolidated financialstatements for the fiscal year to which the date of business combination belongs. In addition, the presentation method for “net income” and other related items has beenchanged, and the presentation of “minority interests” has been changed to “non-controlling interests.” To reflect these changes, the Company has reclassified itsconsolidated financial statements for the fiscal year ended March 31, 2015. Application of the Accounting Standard for Business Combinations, etc. is in line with the transitional measures provided in Paragraph 58-2 (4) of the AccountingStandard for Business Combinations, Paragraph 44-5 (4) of the Accounting Standards for Consolidated Financial Statements and Paragraph 57-4 (4) of the AccountingStandard for Business Divestitures. The Company is applying the said standard, etc. prospectively from the beginning of the fiscal year ended March 31, 2016.
As a result, net income before income taxes decreased by 2,242 million yen (US$19,908 thousand) in this fiscal year. Moreover, capital surplus increased by 2,297million yen (US$20,396 thousand) and foreign currency translation adjustment decreased by 54 million yen (US$479 thousand) in this fiscal year.
In the Consolidated Statements of Cash Flows for the fiscal year ended March 31, 2016, the method of recording cash flows from the purchase or sales of investment insubsidiaries not related to changes in scope of consolidation has been changed, and these cash flows are now classified under “Cash flows from financing activities.”Moreover, the method of recording cash flows relating to costs arising from the purchase of investment in subsidiaries related to changes in scope of consolidation andcosts arising from the purchase or sales of investment in subsidiaries not related to changes in scope of consolidation has been changed, and these cash flows are nowclassified under “Cash flows from operating activities.”
Authority over the practical guidance for accounting and auditing standards (where it is related to the accounting treatment) for tax effect accounting was transferredfrom the Japanese Institute of Certified Public Accountants (JICPA) to the Accounting Standards Board of Japan (ASBJ). The ASBJ basically continues to apply theframework for estimating the amount of deferred tax assets in accordance with the five categories for classifying corporate entities as prescribed within various standardsbut primarily in the "Audit Treatment of Judgments with Regard to Recoverability of Deferred Tax Assets" (Report No. 66, the audit committee of the JICPA). After thetransfer of authority, the ASBJ conducted a revision of certain categorization requirements for corporate entities and the standards for the treatment of deferred taxassets amounts bsaed on such categorization. Accordingly, the Implementation Guidance on Recoverability of Deferred Tax Assets is a guideline for applying theAccounting Standards for Tax Effect Accounting, issued by the Business Accounting Council, for the purpose of the recoverability of deferred tax assets.
As a result, the net income per share decreased by 7.33 yen (US$0.065) this fiscal year.
The impact on the consolidated financial statements as a result of the "Implementation Guidance on Recoverability of Deferred Tax Assets" are currently underevaluation.
3. United States Dollar AmountsAmounts in U.S. dollars are included solely for the convenience of readers outside Japan. The rate of exchange on March 31, 2016(¥112.62=US$1.00), has been used for translation purposes. The inclusion of such amounts is not intended to imply that Japanese Yenhas been or could be readily converted, realized or settled in U.S. dollars at this rate or any other rate.
4.Financial Instruments(a) Information on financial instruments Policies
The Companies enter into financing arrangements (primarily through bank loans or corporate bonds) based on the planned capital expenditures of its businesses. The Companies invest in low risk financial assets using available cash, finance their short-term working capital needs through commercial papers and bank loans. The Companies use derivative transactions within predetermined transaction volumes to limit the risk of significant fluctuations in foreign currency exchange rates, interest rates, and copper and aluminum prices.
The Companies do not enter into derivative transactions for speculative purposes.
Details of financial instruments and related risksTrade notes and accounts receivable are exposed to customer credit risk. Also, trade receivables denominated in foreign currencies, whichare derived from the Company's global business expansion, are exposed to fluctuations in foreign currency exchange rates, however, the exposure is mitigated by entering into foreign exchange forward contracts.
Investment securities consist mainly of equity securities, which are exposed to market price fluctuation risks.
Trade notes and accounts payable have payment terms within one year. Also, within these accounts there are foreign currency denominated balances generated from the import of raw materials and therefore the balances are exposed to fluctuations in foreign currency exchange rates. However, such balances are typically less than accounts receivable balances denominated in the same currencies. Borrowings and corporate bonds are used primarily for capital expenditures and have maturity dates within mainly five years subsequent to the balance sheet date. Certain borrowing contracts are based on variable, or floating, interest rates, which are exposed to fluctuation risk and are hedged via interest rate swap agreements.
Derivative transactions are comprised primarily of foreign exchange forward contracts hedging foreign currency exchange rate fluctuationrisk in trade receivables/payables denominated in foreign currencies, of interest rate swap agreements hedging interest rate fluctuation riskin bank loans, and commodity forward contracts hedging the risk of copper and aluminum price fluctuation.
Risk management over financial instruments (1) Credit risk management (risk of customers' default risk, etc.)
The Company periodically monitors major customers' financial conditions and performs customer specific aging analyses. In addition, the Company monitors doubtful accounts due to the current economic difficulties in accordance with the credit management policy. The consolidated subsidiaries and affiliates are also required to conform with the credit management policy of the Company.
In order to mitigate credit risks to the greatest extent possible with regards to derivative transactions, the Companies' counterparties arefinancial institutions that maintain high credit ratings.
The financial assets exposed to credit risks recorded in the Consolidated Balance Sheets represent the maximum exposure to credit riskas of March 31, 2015 and March 31, 2016.
(2) Market risk management (risk of fluctuations in foreign currency rates, interest rates, etc.)The Company and certain consolidated subsidiaries generally use foreign exchange forward contracts to limit foreign currency exchange rate fluctuation risk in trade receivables/payables denominated in foreign currencies. Depending on the foreign currency market condition, the Companies use foreign exchange forward contracts for trade receivables denominated in foreign currencies generated from highly probable forecasted export transactions. Also, the Company and certain consolidated subsidiaries use interest rate swap agreements to limit interest rate fluctuation risk associated with bank loans.
In relation to investment securities, the Companies continuously monitor the related market values and financial condition of the issuers while also taking into consideration their business relationships with the issuers.
In executing and managing the daily operations of derivative transactions, the Companies regularly monitor transaction balances/volumesand profit/loss status. Such information is periodically reported to the responsible management team and is audited by certain administration divisions. Prior approval by an Executive Officer of the Company is generally required to enter into significant transactions, transaction modifications or applications for the use of new financial instruments.
(3) Liquidity risk management for financing activities (risk of inability to repay on due date)The Company manages liquidity risk by preparing cash flow forecasts, led by the finance division, based on relevant information reported from the respective divisions.
Supplementary information on the fair value of financial instrumentsThe fair value of financial instruments is based on market values as well as reasonably determined values in situations where the market fair value is unavailable. The determination of such values is based on certain assumptions, which may result in different outcomes if other assumptions are applied.
(l) Accounting method for retirement benefitsa. Attribution method for the estimated amount of retirement benefits In calculating retirement benefits obligations, the method to attribute the estimated amount of retirement benefits to a period until the end of the consolidated fiscal year is based on the plan’s benefit formula.b. Accounting methods for actuarial differences and prior service cost Prior service cost is accounted for according to the straight-line method as they are incurred for a certain number of years (principally fifteen years) within the average remaining years of service of employees at the time of incurring. Actuarial differences are charged to expenses from the fiscal year next to the fiscal year when incurred using a straight-line method mainly based on determined years (principally fifteen years) within the average remaining years of service of employees when incurred.
(m) Accounting for long-term construction-type contractsThe percentage-of-completion method of accounting is applied for the construction contracts which fulfill the conditions that the outcome of theconstruction activity is reasonably estimated during the course of the activity. Otherwise, the completed-contract method is applied. The cost-to-cost method is applied for estimating the percentage of completion.
(n) Hedge accounting The Companies apply hedge accounting for certain derivative financial instruments, which include foreign currency forward exchange contracts and interest rate swap agreements used as parts of the Companies' risk management of foreign currency and interest rate exposures within the normal course of the Companies' operations.Foreign currency exchange forward contracts: The Companies enter into foreign currency forward exchange contracts to limit exposure to changes in foreign currency exchange rates on accounts receivable and payable and cash flows generated from anticipated transactions denominated in foreign currencies. For foreign currency forward exchange contracts, which are designated as hedges, the Company has adopted the accounting method where foreign currency denominated assets and liabilities are measured at the contract rate of the respective foreign currency forward exchange contract. With respect to such contracts for anticipated transactions, the contracts are marked-to-market and the resulting unrealized gains/losses are deferred and recorded in the income statement when the exchange gains/losses on the hedged items or transactions are recognized.Interest rate swap agreements: The Companies enter into interest rate swap agreements in order to limit the Companies' exposure with respect of adverse fluctuations in interest rates underlying the debt instruments. The related interest differentials paid or received under the interest rate swap agreements are recognized in interest expense over the term of the agreements.
(o) Income taxesIncome taxes are computed using the asset and liability approach. Under this approach, deferred tax assets and liabilities are recognizedfor the expected future tax consequences of temporary differences between the financial reporting basis and tax basis of assets and liabilities.Valuation allowances are recorded to reduce deferred tax assets when it is more likely than not that the tax benefits will not be realized.The Company files its tax return under the consolidated tax filing system for notional taxes.
(p) Appropriations of retained earningsAppropriations of retained earnings reflected in the accompanying Consolidated Financial Statements are recorded upon approval bythe shareholders.
(q) Other basis for presentation of Consolidated Financial Statements Amounts less than ¥1 million have been omitted. As a result, the total shown in the Consolidated Financial Statements and notes thereto do not necessarily agree with the sum of the individual account balances.
(r) ReclassificationCertain accounts in the Consolidated Financial Statements for the year ended March 31, 2015 have been reclassified to conform tothe 2016 presentation.
(New Accounting Pronouncements and Accounting Change)(Application of Accounting Standards for Business Combination)
(Accounting Standards that were issued but not applied this fiscal year.)Implementation Guidance on Recoverability of Deferred Tax Assets (ASBJ Guidance No. 26 issued on March 28, 2016)
(a) Summary
(Revision of classification requirements and standards for treatment of deferred tax assets amounts)・ Treatment of companies that do not fulfill any of the requirements for classification from Category 1 to Category 5・ Requirements for classification as Category 2 and Category 3・ Treatment of deductible temporary differences that cannot be scheduled for companies applicable to Category 2・ Treatment concerning the reasonable estimable period of future taxable income not reflecting temporary differences for companies applicable to Category 3・ Treatment in cases where a company fulfilling the requirements of Category 4 is also applicable to Category 2 or Category 3
(b) Planned date to applyThe Company expects to apply the implementation guidance from the beginning of the fiscal year beginning on April 1, 2016
(c) The impact on the application of these Accounting Standards etc.
Effective from the fiscal year ended March 31, 2016, the Company has applied the “Accounting Standard for Business Combinations” (ASBJ Statement No. 21,September 13, 2013), the “Accounting Standard for Consolidated Financial Statements” (ASBJ Statement No. 22, September 13, 2013), the “Accounting Standard forBusiness Divestitures” (ASBJ Statement No. 7, September 13, 2013), etc. As a result, the method of recording the amount of difference caused by changes in theCompany’s ownership interests in subsidiaries in the case of subsidiaries under ongoing control of the Company was changed to one in which it is recorded as capitalsurplus, and the method of recording acquisition-related costs was changed to one in which they are recognized as expenses for the fiscal year in which they areincurred. Furthermore, for business combinations carried out on or after the beginning of the fiscal year ended March 31, 2016, the accounting method was changed toone in which the revised acquisition cost allocation resulting from the finalization of the provisional accounting treatment is reflected in the consolidated financialstatements for the fiscal year to which the date of business combination belongs. In addition, the presentation method for “net income” and other related items has beenchanged, and the presentation of “minority interests” has been changed to “non-controlling interests.” To reflect these changes, the Company has reclassified itsconsolidated financial statements for the fiscal year ended March 31, 2015. Application of the Accounting Standard for Business Combinations, etc. is in line with the transitional measures provided in Paragraph 58-2 (4) of the AccountingStandard for Business Combinations, Paragraph 44-5 (4) of the Accounting Standards for Consolidated Financial Statements and Paragraph 57-4 (4) of the AccountingStandard for Business Divestitures. The Company is applying the said standard, etc. prospectively from the beginning of the fiscal year ended March 31, 2016.
As a result, net income before income taxes decreased by 2,242 million yen (US$19,908 thousand) in this fiscal year. Moreover, capital surplus increased by 2,297million yen (US$20,396 thousand) and foreign currency translation adjustment decreased by 54 million yen (US$479 thousand) in this fiscal year.
In the Consolidated Statements of Cash Flows for the fiscal year ended March 31, 2016, the method of recording cash flows from the purchase or sales of investment insubsidiaries not related to changes in scope of consolidation has been changed, and these cash flows are now classified under “Cash flows from financing activities.”Moreover, the method of recording cash flows relating to costs arising from the purchase of investment in subsidiaries related to changes in scope of consolidation andcosts arising from the purchase or sales of investment in subsidiaries not related to changes in scope of consolidation has been changed, and these cash flows are nowclassified under “Cash flows from operating activities.”
Authority over the practical guidance for accounting and auditing standards (where it is related to the accounting treatment) for tax effect accounting was transferredfrom the Japanese Institute of Certified Public Accountants (JICPA) to the Accounting Standards Board of Japan (ASBJ). The ASBJ basically continues to apply theframework for estimating the amount of deferred tax assets in accordance with the five categories for classifying corporate entities as prescribed within various standardsbut primarily in the "Audit Treatment of Judgments with Regard to Recoverability of Deferred Tax Assets" (Report No. 66, the audit committee of the JICPA). After thetransfer of authority, the ASBJ conducted a revision of certain categorization requirements for corporate entities and the standards for the treatment of deferred taxassets amounts bsaed on such categorization. Accordingly, the Implementation Guidance on Recoverability of Deferred Tax Assets is a guideline for applying theAccounting Standards for Tax Effect Accounting, issued by the Business Accounting Council, for the purpose of the recoverability of deferred tax assets.
As a result, the net income per share decreased by 7.33 yen (US$0.065) this fiscal year.
The impact on the consolidated financial statements as a result of the "Implementation Guidance on Recoverability of Deferred Tax Assets" are currently underevaluation.
based
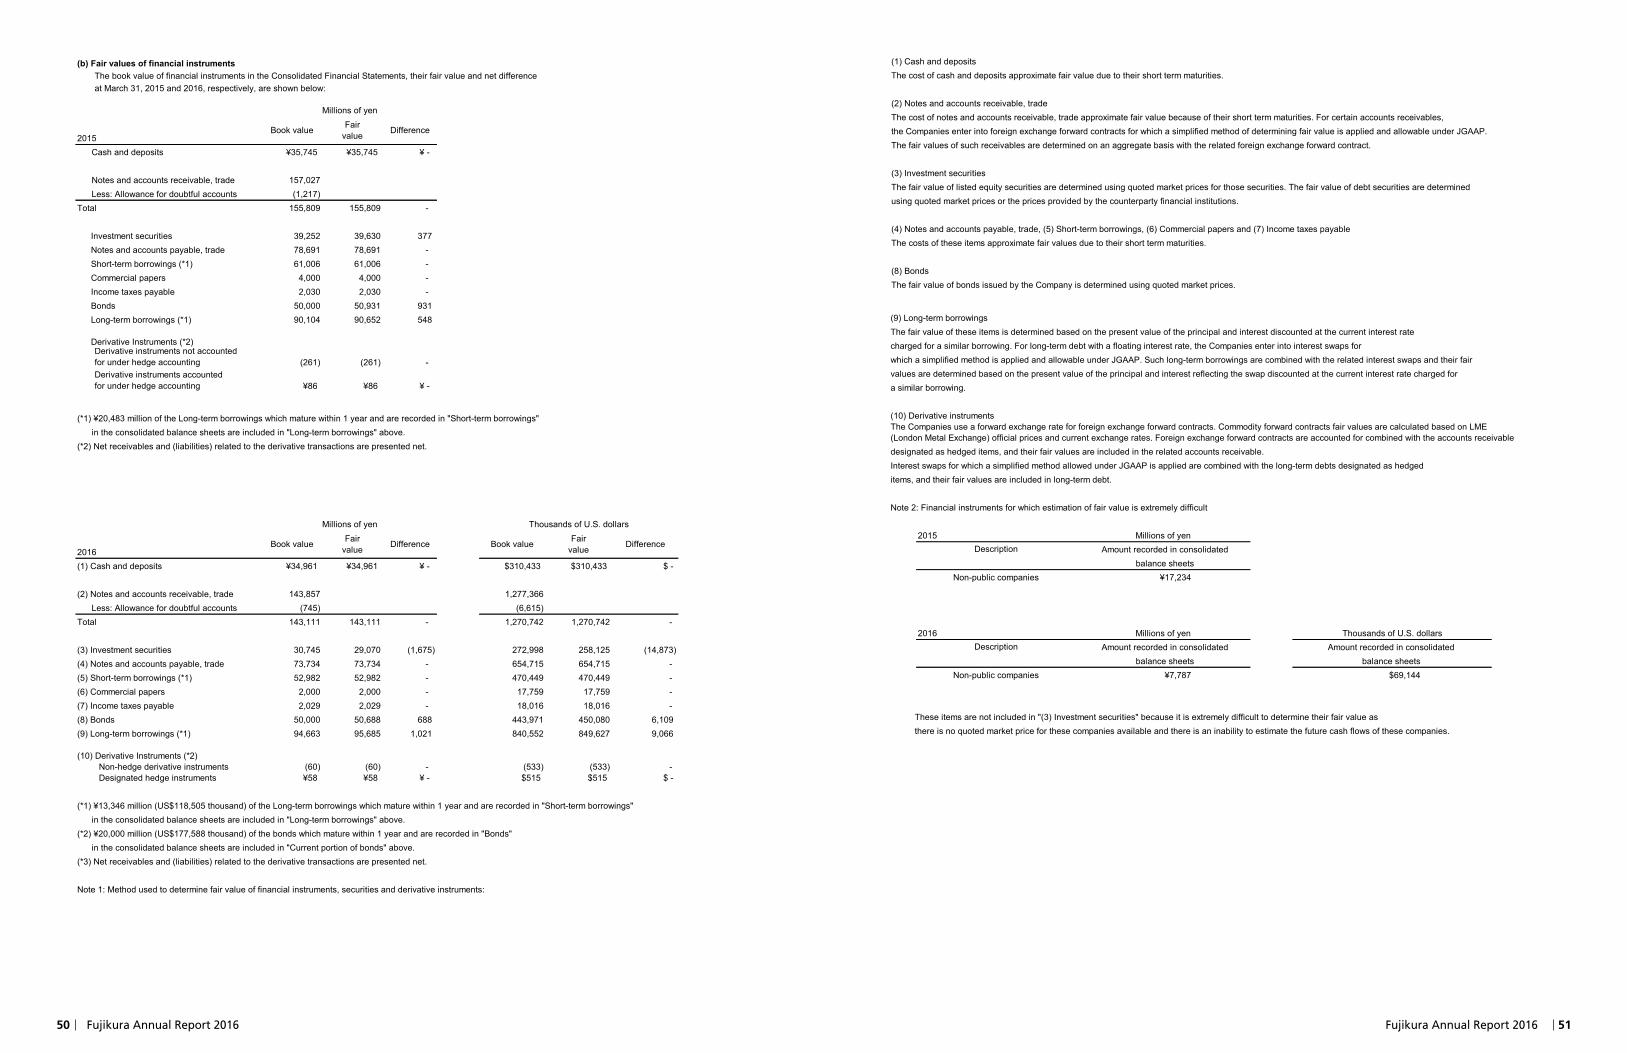
50 Fujikura Annual Report 2016 Fujikura Annual Report 2016 51
(b) Fair values of financial instrumentsThe book value of financial instruments in the Consolidated Financial Statements, their fair value and net difference at March 31, 2015 and 2016, respectively, are shown below:
Millions of yen
2015 Cash and deposits ¥35,745 ¥35,745 ¥ -
Notes and accounts receivable, trade 157,027 Less: Allowance for doubtful accounts (1,217)Total 155,809 155,809 -
Investment securities 39,252 39,630 377 Notes and accounts payable, trade 78,691 78,691 - Short-term borrowings (*1) 61,006 61,006 - Commercial papers 4,000 4,000 - Income taxes payable 2,030 2,030 - Bonds 50,000 50,931 931 Long-term borrowings (*1) 90,104 90,652 548
Derivative Instruments (*2)
Non-hedge derivative instruments (261) (261) -
Designated hedge instruments ¥86 ¥86 ¥ -
(*1) ¥20,483 million of the Long-term borrowings which mature within 1 year and are recorded in "Short-term borrowings" in the consolidated balance sheets are included in "Long-term borrowings" above.(*2) Net receivables and (liabilities) related to the derivative transactions are presented net.
Millions of yen Thousands of U.S. dollars
2016(1) Cash and deposits ¥34,961 ¥34,961 ¥ - $310,433 $310,433 $ -
(2) Notes and accounts receivable, trade 143,857 1,277,366 Less: Allowance for doubtful accounts (745) (6,615)Total 143,111 143,111 - 1,270,742 1,270,742 -
(3) Investment securities 30,745 29,070 (1,675) 272,998 258,125 (14,873)(4) Notes and accounts payable, trade 73,734 73,734 - 654,715 654,715 -(5) Short-term borrowings (*1) 52,982 52,982 - 470,449 470,449 -(6) Commercial papers 2,000 2,000 - 17,759 17,759 -(7) Income taxes payable 2,029 2,029 - 18,016 18,016 -(8) Bonds 50,000 50,688 688 443,971 450,080 6,109(9) Long-term borrowings (*1) 94,663 95,685 1,021 840,552 849,627 9,066
(10) Derivative Instruments (*2) Non-hedge derivative instruments (60) (60) - (533) (533) - Designated hedge instruments ¥58 ¥58 ¥ - $515 $515 $ -
(*1) ¥13,346 million (US$118,505 thousand) of the Long-term borrowings which mature within 1 year and are recorded in "Short-term borrowings" in the consolidated balance sheets are included in "Long-term borrowings" above.(*2) ¥20,000 million (US$177,588 thousand) of the bonds which mature within 1 year and are recorded in "Bonds" in the consolidated balance sheets are included in "Current portion of bonds" above.(*3) Net receivables and (liabilities) related to the derivative transactions are presented net.
Note 1: Method used to determine fair value of financial instruments, securities and derivative instruments:
(1) Cash and depositsThe cost of cash and deposits approximate fair value due to their short term maturities.
(2) Notes and accounts receivable, tradeThe cost of notes and accounts receivable, trade approximate fair value because of their short term maturities. For certain accounts receivables, the Companies enter into foreign exchange forward contracts for which a simplified method of determining fair value is applied and allowable under JGAAP. The fair values of such receivables are determined on an aggregate basis with the related foreign exchange forward contract.
(3) Investment securitiesThe fair value of listed equity securities are determined using quoted market prices for those securities. The fair value of debt securities are determined using quoted market prices or the prices provided by the counterparty financial institutions.
(4) Notes and accounts payable, trade, (5) Short-term borrowings, (6) Commercial papers and (7) Income taxes payableThe costs of these items approximate fair values due to their short term maturities.
(8) BondsThe fair value of bonds issued by the Company is determined using quoted market prices.
Difference
Derivative instruments not accountedfor under hedge accountingDerivative instruments accountedfor under hedge accounting
Book value Fairvalue Difference
Book value Fairvalue Difference
Book value Fairvalue
(9) Long-term borrowingsThe fair value of these items is determined based on the present value of the principal and interest discounted at the current interest rate charged for a similar borrowing. For long-term debt with a floating interest rate, the Companies enter into interest swaps for which a simplified method is applied and allowable under JGAAP. Such long-term borrowings are combined with the related interest swaps and their fair values are determined based on the present value of the principal and interest reflecting the swap discounted at the current interest rate charged for a similar borrowing.
(10) Derivative instrumentsThe Companies use a forward exchange rate for foreign exchange forward contracts. Commodity forward contracts fair values are calculated based on LME(London Metal Exchange) official prices and current exchange rates. Foreign exchange forward contracts are accounted for combined with the accounts receivabledesignated as hedged items, and their fair values are included in the related accounts receivable. Interest swaps for which a simplified method allowed under JGAAP is applied are combined with the long-term debts designated as hedgeditems, and their fair values are included in long-term debt.
Note 2: Financial instruments for which estimation of fair value is extremely difficult
2015 Millions of yenDescription Amount recorded in consolidated
balance sheets Non-public companies ¥17,234
2016 Millions of yen Thousands of U.S. dollarsDescription Amount recorded in consolidated Amount recorded in consolidated
balance sheets balance sheets Non-public companies ¥7,787 $69,144
These items are not included in "(3) Investment securities" because it is extremely difficult to determine their fair value as there is no quoted market price for these companies available and there is an inability to estimate the future cash flows of these companies.
(b) Fair values of financial instrumentsThe book value of financial instruments in the Consolidated Financial Statements, their fair value and net difference at March 31, 2015 and 2016, respectively, are shown below:
Millions of yen
2015 Cash and deposits ¥35,745 ¥35,745 ¥ -
Notes and accounts receivable, trade 157,027 Less: Allowance for doubtful accounts (1,217)Total 155,809 155,809 -
Investment securities 39,252 39,630 377 Notes and accounts payable, trade 78,691 78,691 - Short-term borrowings (*1) 61,006 61,006 - Commercial papers 4,000 4,000 - Income taxes payable 2,030 2,030 - Bonds 50,000 50,931 931 Long-term borrowings (*1) 90,104 90,652 548
Derivative Instruments (*2)
Non-hedge derivative instruments (261) (261) -
Designated hedge instruments ¥86 ¥86 ¥ -
(*1) ¥20,483 million of the Long-term borrowings which mature within 1 year and are recorded in "Short-term borrowings" in the consolidated balance sheets are included in "Long-term borrowings" above.(*2) Net receivables and (liabilities) related to the derivative transactions are presented net.
Millions of yen Thousands of U.S. dollars
2016(1) Cash and deposits ¥34,961 ¥34,961 ¥ - $310,433 $310,433 $ -
(2) Notes and accounts receivable, trade 143,857 1,277,366 Less: Allowance for doubtful accounts (745) (6,615)Total 143,111 143,111 - 1,270,742 1,270,742 -
(3) Investment securities 30,745 29,070 (1,675) 272,998 258,125 (14,873)(4) Notes and accounts payable, trade 73,734 73,734 - 654,715 654,715 -(5) Short-term borrowings (*1) 52,982 52,982 - 470,449 470,449 -(6) Commercial papers 2,000 2,000 - 17,759 17,759 -(7) Income taxes payable 2,029 2,029 - 18,016 18,016 -(8) Bonds 50,000 50,688 688 443,971 450,080 6,109(9) Long-term borrowings (*1) 94,663 95,685 1,021 840,552 849,627 9,066
(10) Derivative Instruments (*2) Non-hedge derivative instruments (60) (60) - (533) (533) - Designated hedge instruments ¥58 ¥58 ¥ - $515 $515 $ -
(*1) ¥13,346 million (US$118,505 thousand) of the Long-term borrowings which mature within 1 year and are recorded in "Short-term borrowings" in the consolidated balance sheets are included in "Long-term borrowings" above.(*2) ¥20,000 million (US$177,588 thousand) of the bonds which mature within 1 year and are recorded in "Bonds" in the consolidated balance sheets are included in "Current portion of bonds" above.(*3) Net receivables and (liabilities) related to the derivative transactions are presented net.
Note 1: Method used to determine fair value of financial instruments, securities and derivative instruments:
(1) Cash and depositsThe cost of cash and deposits approximate fair value due to their short term maturities.
(2) Notes and accounts receivable, tradeThe cost of notes and accounts receivable, trade approximate fair value because of their short term maturities. For certain accounts receivables, the Companies enter into foreign exchange forward contracts for which a simplified method of determining fair value is applied and allowable under JGAAP. The fair values of such receivables are determined on an aggregate basis with the related foreign exchange forward contract.
(3) Investment securitiesThe fair value of listed equity securities are determined using quoted market prices for those securities. The fair value of debt securities are determined using quoted market prices or the prices provided by the counterparty financial institutions.
(4) Notes and accounts payable, trade, (5) Short-term borrowings, (6) Commercial papers and (7) Income taxes payableThe costs of these items approximate fair values due to their short term maturities.
(8) BondsThe fair value of bonds issued by the Company is determined using quoted market prices.
Difference
Derivative instruments not accountedfor under hedge accountingDerivative instruments accountedfor under hedge accounting
Book value Fairvalue Difference
Book value Fairvalue Difference
Book value Fairvalue
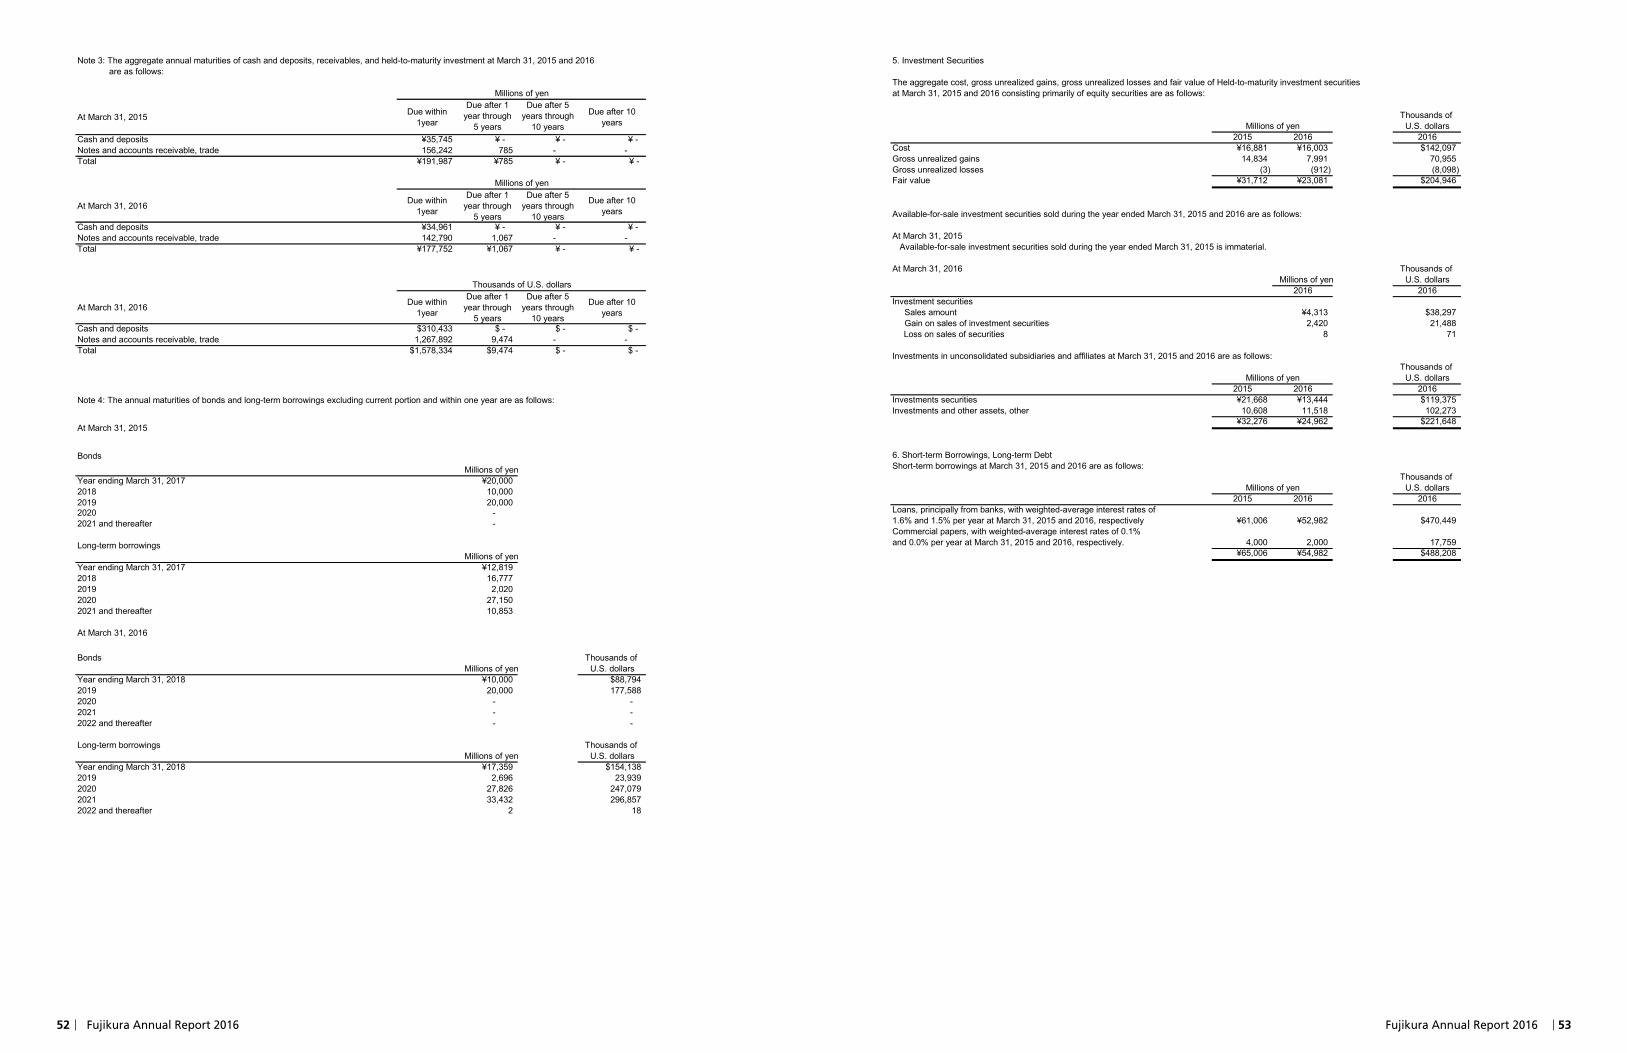
52 Fujikura Annual Report 2016 Fujikura Annual Report 2016 53
5. Investment Securities
The aggregate cost, gross unrealized gains, gross unrealized losses and fair value of Held-to-maturity investment securities at March 31, 2015 and 2016 consisting primarily of equity securities are as follows:
Thousands of Millions of yen U.S. dollars
2015 2016 2016Cost ¥16,881 ¥16,003 $142,097Gross unrealized gains 14,834 7,991 70,955Gross unrealized losses (3) (912) (8,098)Fair value ¥31,712 ¥23,081 $204,946
Available-for-sale investment securities sold during the year ended March 31, 2015 and 2016 are as follows:
At March 31, 2015 Available-for-sale investment securities sold during the year ended March 31, 2015 is immaterial.
At March 31, 2016 Thousands of Millions of yen U.S. dollars
2016 2016Investment securities Sales amount ¥4,313 $38,297 Gain on sales of investment securities 2,420 21,488 Loss on sales of securities 8 71
Investments in unconsolidated subsidiaries and affiliates at March 31, 2015 and 2016 are as follows:Thousands of
Millions of yen U.S. dollars2015 2016 2016
Investments securities ¥21,668 ¥13,444 $119,375Investments and other assets, other 10,608 11,518 102,273
¥32,276 ¥24,962 $221,648
6. Short-term Borrowings, Long-term DebtShort-term borrowings at March 31, 2015 and 2016 are as follows:
Thousands of Millions of yen U.S. dollars
2015 2016 2016Loans, principally from banks, with weighted-average interest rates of1.6% and 1.5% per year at March 31, 2015 and 2016, respectively ¥61,006 ¥52,982 $470,449Commercial papers, with weighted-average interest rates of 0.1%and 0.0% per year at March 31, 2015 and 2016, respectively. 4,000 2,000 17,759
¥65,006 ¥54,982 $488,208
Note 3: The aggregate annual maturities of cash and deposits, receivables, and held-to-maturity investment at March 31, 2015 and 2016 are as follows:
Millions of yen
At March 31, 2015 Due within1year
Due after 1year through
5 years
Due after 5years through
10 years
Due after 10years
Cash and deposits ¥35,745 ¥ - ¥ - ¥ -Notes and accounts receivable, trade 156,242 785 - -Total ¥191,987 ¥785 ¥ - ¥ -
Millions of yen
At March 31, 2016 Due within1year
Due after 1year through
5 years
Due after 5years through
10 years
Due after 10years
Cash and deposits ¥34,961 ¥ - ¥ - ¥ -Notes and accounts receivable, trade 142,790 1,067 - -Total ¥177,752 ¥1,067 ¥ - ¥ -
Thousands of U.S. dollars
At March 31, 2016 Due within1year
Due after 1year through
5 years
Due after 5years through
10 years
Due after 10years
Cash and deposits $310,433 $ - $ - $ -Notes and accounts receivable, trade 1,267,892 9,474 - -Total $1,578,334 $9,474 $ - $ -
Note 4: The annual maturities of bonds and long-term borrowings excluding current portion and within one year are as follows:
At March 31, 2015
Bonds Millions of yen
Year ending March 31, 2017 ¥20,0002018 10,0002019 20,0002020 -2021 and thereafter -
Long-term borrowings Millions of yen
Year ending March 31, 2017 ¥12,8192018 16,7772019 2,0202020 27,1502021 and thereafter 10,853
At March 31, 2016
Bonds Thousands of Millions of yen U.S. dollars
Year ending March 31, 2018 ¥10,000 $88,7942019 20,000 177,5882020 - -2021 - -2022 and thereafter - -
Long-term borrowings Thousands of Millions of yen U.S. dollars
Year ending March 31, 2018 ¥17,359 $154,1382019 2,696 23,9392020 27,826 247,0792021 33,432 296,8572022 and thereafter 2 18
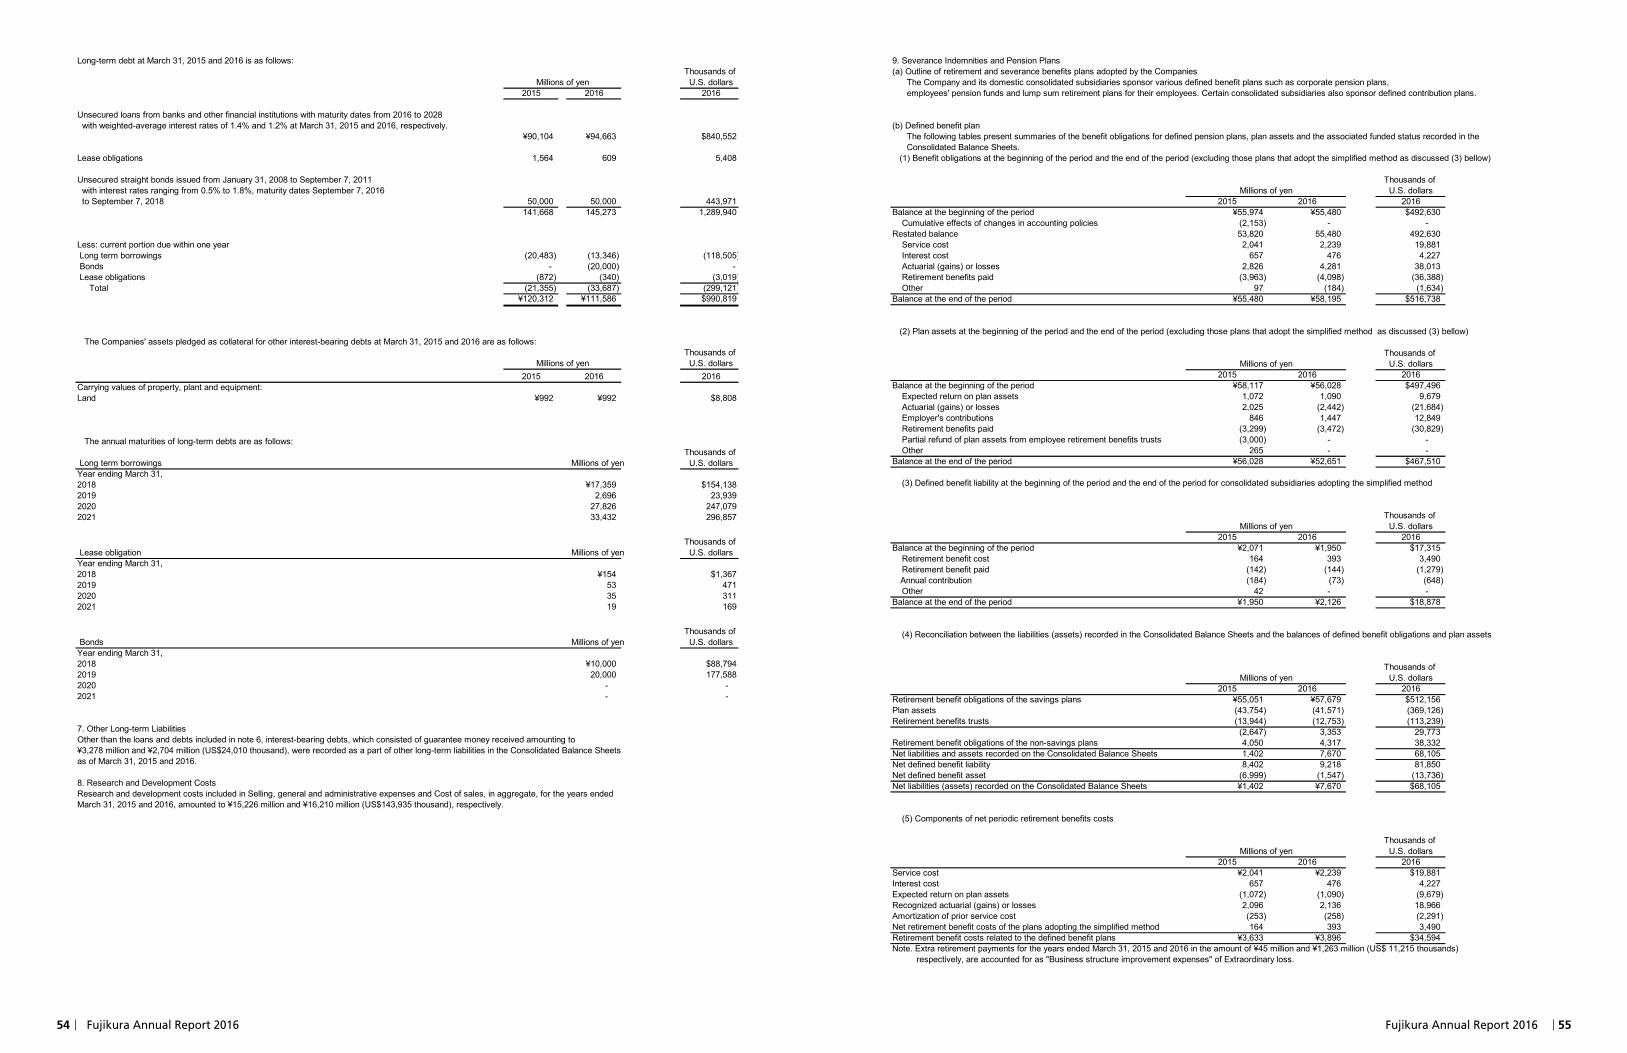
54 Fujikura Annual Report 2016 Fujikura Annual Report 2016 55
9. Severance Indemnities and Pension Plans(a) Outline of retirement and severance benefits plans adopted by the Companies The Company and its domestic consolidated subsidiaries sponsor various defined benefit plans such as corporate pension plans, employees' pension funds and lump sum retirement plans for their employees. Certain consolidated subsidiaries also sponsor defined contribution plans.
(b) Defined benefit plan The following tables present summaries of the benefit obligations for defined pension plans, plan assets and the associated funded status recorded in the Consolidated Balance Sheets. (1) Benefit obligations at the beginning of the period and the end of the period (excluding those plans that adopt the simplified method as discussed (3) bellow)
Thousands of U.S. dollars
2015 2016 2016Balance at the beginning of the period ¥55,974 ¥55,480 $492,630 Cumulative effects of changes in accounting policies (2,153) - -Restated balance 53,820 55,480 492,630 Service cost 2,041 2,239 19,881 Interest cost 657 476 4,227 Actuarial (gains) or losses 2,826 4,281 38,013 Retirement benefits paid (3,963) (4,098) (36,388) Other 97 (184) (1,634)Balance at the end of the period ¥55,480 ¥58,195 $516,738
(2) Plan assets at the beginning of the period and the end of the period (excluding those plans that adopt the simplified method as discussed (3) bellow)
Thousands of U.S. dollars
2015 2016 2016Balance at the beginning of the period ¥58,117 ¥56,028 $497,496 Expected return on plan assets 1,072 1,090 9,679 Actuarial (gains) or losses 2,025 (2,442) (21,684) Employer's contributions 846 1,447 12,849 Retirement benefits paid (3,299) (3,472) (30,829) Partial refund of plan assets from employee retirement benefits trusts (3,000) - - Other 265 - -Balance at the end of the period ¥56,028 ¥52,651 $467,510
(3) Defined benefit liability at the beginning of the period and the end of the period for consolidated subsidiaries adopting the simplified method
Thousands of U.S. dollars
2015 2016 2016Balance at the beginning of the period ¥2,071 ¥1,950 $17,315 Retirement benefit cost 164 393 3,490 Retirement benefit paid (142) (144) (1,279) Annual contribution (184) (73) (648) Other 42 - -Balance at the end of the period ¥1,950 ¥2,126 $18,878
(4) Reconciliation between the liabilities (assets) recorded in the Consolidated Balance Sheets and the balances of defined benefit obligations and plan assets
Thousands of U.S. dollars
2015 2016 2016Retirement benefit obligations of the savings plans ¥55,051 ¥57,679 $512,156Plan assets (43,754) (41,571) (369,126)Retirement benefits trusts (13,944) (12,753) (113,239)
(2,647) 3,353 29,773Retirement benefit obligations of the non-savings plans 4,050 4,317 38,332Net liabilities and assets recorded on the Consolidated Balance Sheets 1,402 7,670 68,105Net defined benefit liability 8,402 9,218 81,850Net defined benefit asset (6,999) (1,547) (13,736)Net liabilities (assets) recorded on the Consolidated Balance Sheets ¥1,402 ¥7,670 $68,105
(5) Components of net periodic retirement benefits costs
Thousands of U.S. dollars
2015 2016 2016Service cost ¥2,041 ¥2,239 $19,881Interest cost 657 476 4,227Expected return on plan assets (1,072) (1,090) (9,679)Recognized actuarial (gains) or losses 2,096 2,136 18,966Amortization of prior service cost (253) (258) (2,291)Net retirement benefit costs of the plans adopting the simplified method 164 393 3,490Retirement benefit costs related to the defined benefit plans ¥3,633 ¥3,896 $34,594Note. Extra retirement payments for the years ended March 31, 2015 and 2016 in the amount of ¥45 million and ¥1,263 million (US$ 11,215 thousands) respectively, are accounted for as "Business structure improvement expenses" of Extraordinary loss.
(6) Remeasurements of defined benefit plans before deduction of deferred taxThousands of
U.S. dollars2015 2016 2016
Unrecognized prior service cost ¥253 ¥258 $2,291Unrecognized actuarial (gains) or losses (967) 4,618 41,005Total (¥713) ¥4,876 $43,296
Millions of yen
Millions of yen
Millions of yen
Millions of yen
Millions of yen
Millions of yen
Long-term debt at March 31, 2015 and 2016 is as follows:Thousands of
Millions of yen U.S. dollars2015 2016 2016
Unsecured loans from banks and other financial institutions with maturity dates from 2016 to 2028 with weighted-average interest rates of 1.4% and 1.2% at March 31, 2015 and 2016, respectively.
¥90,104 ¥94,663 $840,552
Lease obligations 1,564 609 5,408
Unsecured straight bonds issued from January 31, 2008 to September 7, 2011 with interest rates ranging from 0.5% to 1.8%, maturity dates September 7, 2016 to September 7, 2018 50,000 50,000 443,971
141,668 145,273 1,289,940
Less: current portion due within one year Long term borrowings (20,483) (13,346) (118,505) Bonds - (20,000) - Lease obligations (872) (340) (3,019) Total (21,355) (33,687) (299,121)
¥120,312 ¥111,586 $990,819
The Companies' assets pledged as collateral for other interest-bearing debts at March 31, 2015 and 2016 are as follows:Thousands of
Millions of yen U.S. dollars2015 2016 2016
Carrying values of property, plant and equipment:Land ¥992 ¥992 $8,808
The annual maturities of long-term debts are as follows:Thousands of
Long term borrowings Millions of yen U.S. dollarsYear ending March 31,2018 ¥17,359 $154,1382019 2,696 23,9392020 27,826 247,0792021 33,432 296,857
Thousands of Lease obligation Millions of yen U.S. dollarsYear ending March 31,2018 ¥154 $1,3672019 53 4712020 35 3112021 19 169
Thousands of Bonds Millions of yen U.S. dollarsYear ending March 31,2018 ¥10,000 $88,7942019 20,000 177,5882020 - -2021 - -
7. Other Long-term LiabilitiesOther than the loans and debts included in note 6, interest-bearing debts, which consisted of guarantee money received amounting to ¥3,278 million and ¥2,704 million (US$24,010 thousand), were recorded as a part of other long-term liabilities in the Consolidated Balance Sheetsas of March 31, 2015 and 2016.
8. Research and Development CostsResearch and development costs included in Selling, general and administrative expenses and Cost of sales, in aggregate, for the years endedMarch 31, 2015 and 2016, amounted to ¥15,226 million and ¥16,210 million (US$143,935 thousand), respectively.
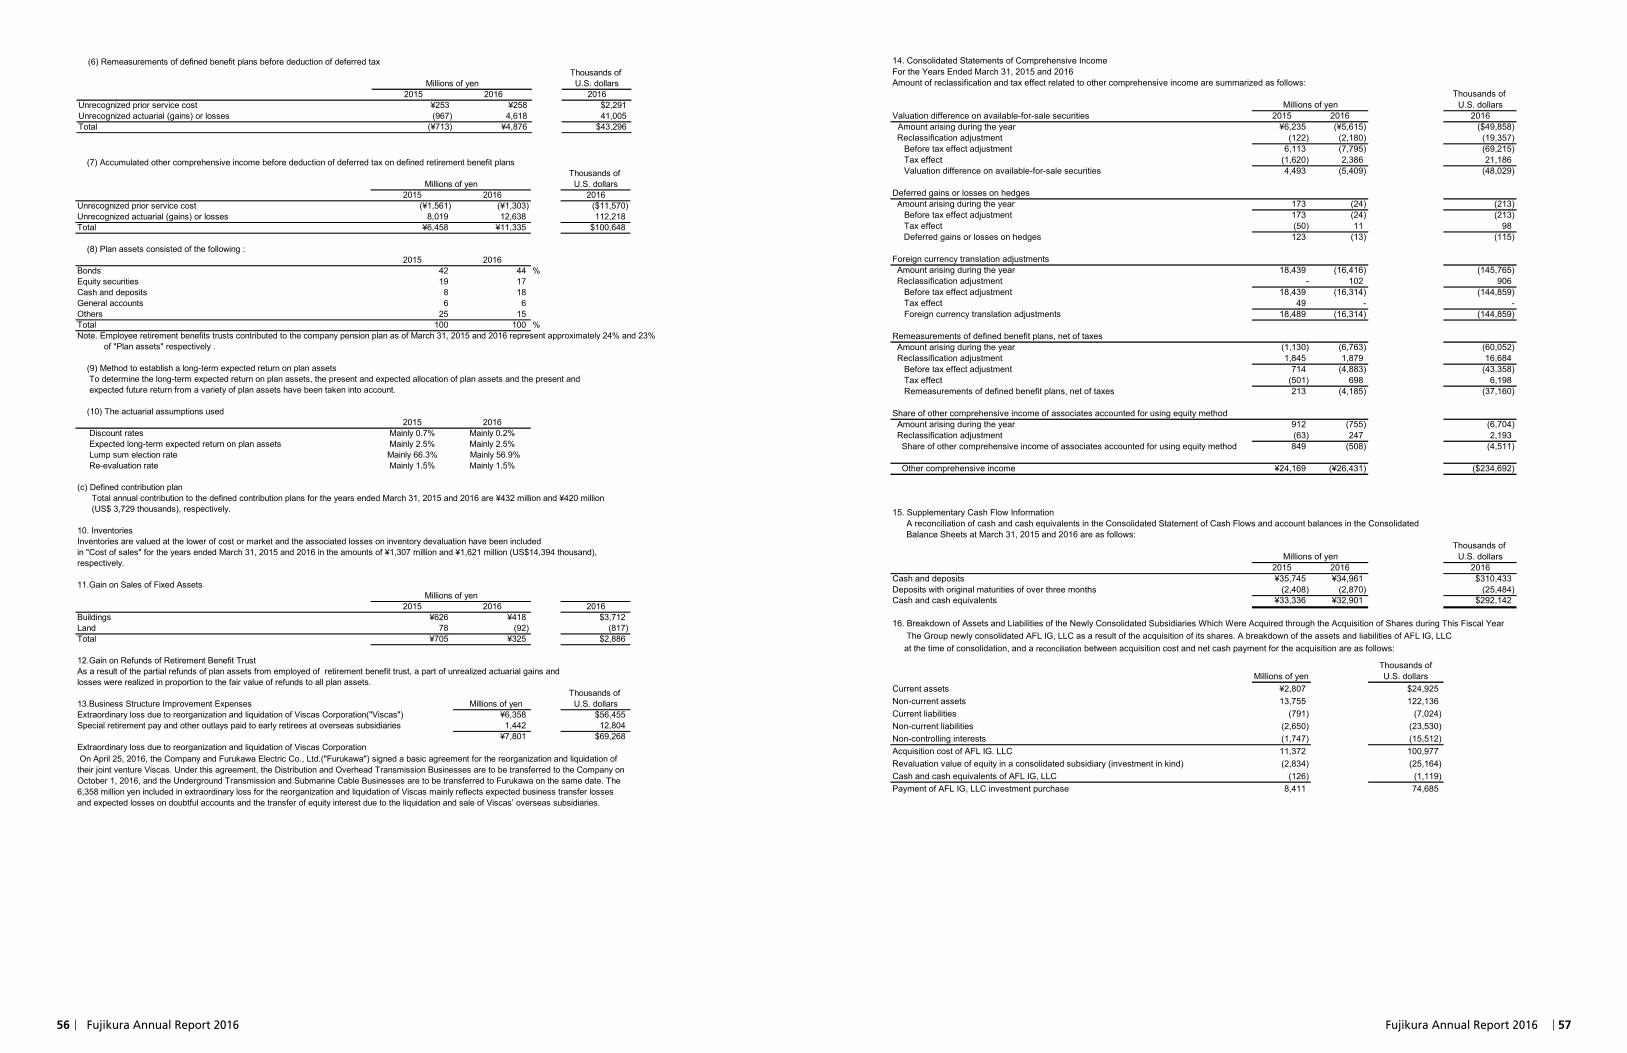
56 Fujikura Annual Report 2016 Fujikura Annual Report 2016 57
14. Consolidated Statements of Comprehensive IncomeFor the Years Ended March 31, 2015 and 2016Amount of reclassification and tax effect related to other comprehensive income are summarized as follows:
Thousands of Millions of yen U.S. dollars
Valuation difference on available-for-sale securities 2015 2016 2016Amount arising during the year ¥6,235 (¥5,615) ($49,858)
Reclassification adjustment (122) (2,180) (19,357) Before tax effect adjustment 6,113 (7,795) (69,215) Tax effect (1,620) 2,386 21,186 Valuation difference on available-for-sale securities 4,493 (5,409) (48,029)
Deferred gains or losses on hedges mount arising during the year 173 (24) (213) Before tax effect adjustment 173 (24) (213) Tax effect (50) 11 98 Deferred gains or losses on hedges 123 (13) (115)
Foreign currency translation adjustments Amount arising during the year 18,439 (16,416) (145,765) Reclassification adjustment - 102 906 Before tax effect adjustment 18,439 (16,314) (144,859) Tax effect 49 - - Foreign currency translation adjustments 18,489 (16,314) (144,859)
Remeasurements of defined benefit plans, net of taxes Amount arising during the year (1,130) (6,763) (60,052) Reclassification adjustment 1,845 1,879 16,684 Before tax effect adjustment 714 (4,883) (43,358) Tax effect (501) 698 6,198 Remeasurements of defined benefit plans, net of taxes 213 (4,185) (37,160)
Share of other comprehensive income of associates accounted for using equity method Amount arising during the year 912 (755) (6,704) Reclassification adjustment (63) 247 2,193 Share of other comprehensive income of associates accounted for using equity method 849 (508) (4,511)
Other comprehensive income ¥24,169 (¥26,431) ($234,692)
15. Supplementary Cash Flow Information A reconciliation of cash and cash equivalents in the Consolidated Statement of Cash Flows and account balances in the Consolidated Balance Sheets at March 31, 2015 and 2016 are as follows:
Thousands of Millions of yen U.S. dollars
2015 2016 2016Cash and deposits ¥35,745 ¥34,961 $310,433Deposits with original maturities of over three months (2,408) (2,870) (25,484)Cash and cash equivalents ¥33,336 ¥32,901 $292,142
16. Breakdown of Assets and Liabilities of the Newly Consolidated Subsidiaries Which Were Acquired through the Acquisition of Shares during This Fiscal Year The Group newly consolidated AFL IG, LLC as a result of the acquisition of its shares. A breakdown of the assets and liabilities of AFL IG, LLC at the time of consolidation, and a recociliation between acquisition cost and net cash payment for the acquisition are as follows:
Millions of yenThousands ofU.S. dollars
Current assets ¥2,807 $24,925Non-current assets 13,755 122,136Current liabilities (791) (7,024)Non-current liabilities (2,650) (23,530)Non-controlling interests (1,747) (15,512)Acquisition cost of AFL IG. LLC 11,372 100,977Revaluation value of equity in a consolidated subsidiary (investment in kind) (2,834) (25,164)Cash and cash equivalents of AFL IG, LLC (126) (1,119)Payment of AFL IG, LLC investment purchase 8,411 74,685
(7) Accumulated other comprehensive income before deduction of deferred tax on defined retirement benefit plansThousands of
U.S. dollars2015 2016 2016
Unrecognized prior service cost (¥1,561) (¥1,303) ($11,570)Unrecognized actuarial (gains) or losses 8,019 12,638 112,218Total ¥6,458 ¥11,335 $100,648
(8) Plan assets consisted of the following : 2015 2016Bonds 42 44 %Equity securities 19 17Cash and deposits 8 18General accounts 6 6Others 25 15Total 100 100 %Note. Employee retirement benefits trusts contributed to the company pension plan as of March 31, 2015 and 2016 represent approximately 24% and 23% of "Plan assets" respectively .
(9) Method to establish a long-term expected return on plan assets To determine the long-term expected return on plan assets, the present and expected allocation of plan assets and the present and expected future return from a variety of plan assets have been taken into account.
(10) The actuarial assumptions used2015 2016
Discount rates Mainly 0.7% Mainly 0.2% Expected long-term expected return on plan assets Mainly 2.5% Mainly 2.5% Lump sum election rate Mainly 66.3% Mainly 56.9% Re-evaluation rate Mainly 1.5% Mainly 1.5%
(c) Defined contribution plan Total annual contribution to the defined contribution plans for the years ended March 31, 2015 and 2016 are ¥432 million and ¥420 million (US$ 3,729 thousands), respectively.
10. InventoriesInventories are valued at the lower of cost or market and the associated losses on inventory devaluation have been included in "Cost of sales" for the years ended March 31, 2015 and 2016 in the amounts of ¥1,307 million and ¥1,621 million (US$14,394 thousand), respectively.
11.Gain on Sales of Fixed Assets
2015 2016 2016Buildings ¥626 ¥418 $3,712Land 78 (92) (817)Total ¥705 ¥325 $2,886
12.Gain on Refunds of Retirement Benefit TrustAs a result of the partial refunds of plan assets from employed of retirement benefit trust, a part of unrealized actuarial gains and losses were realized in proportion to the fair value of refunds to all plan assets.
Thousands of 13.Business Structure Improvement Expenses Millions of yen U.S. dollarsExtraordinary loss due to reorganization and liquidation of Viscas Corporation("Viscas") ¥6,358 $56,455Special retirement pay and other outlays paid to early retirees at overseas subsidiaries 1,442 12,804
¥7,801 $69,268Extraordinary loss due to reorganization and liquidation of Viscas Corporation On April 25, 2016, the Company and Furukawa Electric Co., Ltd.("Furukawa") signed a basic agreement for the reorganization and liquidation oftheir joint venture Viscas. Under this agreement, the Distribution and Overhead Transmission Businesses are to be transferred to the Company onOctober 1, 2016, and the Underground Transmission and Submarine Cable Businesses are to be transferred to Furukawa on the same date. The6,358 million yen included in extraordinary loss for the reorganization and liquidation of Viscas mainly reflects expected business transfer lossesand expected losses on doubtful accounts and the transfer of equity interest due to the liquidation and sale of Viscas’ overseas subsidiaries.
Millions of yen
Millions of yen
9. Severance Indemnities and Pension Plans(a) Outline of retirement and severance benefits plans adopted by the Companies The Company and its domestic consolidated subsidiaries sponsor various defined benefit plans such as corporate pension plans, employees' pension funds and lump sum retirement plans for their employees. Certain consolidated subsidiaries also sponsor defined contribution plans.
(b) Defined benefit plan The following tables present summaries of the benefit obligations for defined pension plans, plan assets and the associated funded status recorded in the Consolidated Balance Sheets. (1) Benefit obligations at the beginning of the period and the end of the period (excluding those plans that adopt the simplified method as discussed (3) bellow)
Thousands of U.S. dollars
2015 2016 2016Balance at the beginning of the period ¥55,974 ¥55,480 $492,630 Cumulative effects of changes in accounting policies (2,153) - -Restated balance 53,820 55,480 492,630 Service cost 2,041 2,239 19,881 Interest cost 657 476 4,227 Actuarial (gains) or losses 2,826 4,281 38,013 Retirement benefits paid (3,963) (4,098) (36,388) Other 97 (184) (1,634)Balance at the end of the period ¥55,480 ¥58,195 $516,738
(2) Plan assets at the beginning of the period and the end of the period (excluding those plans that adopt the simplified method as discussed (3) bellow)
Thousands of U.S. dollars
2015 2016 2016Balance at the beginning of the period ¥58,117 ¥56,028 $497,496 Expected return on plan assets 1,072 1,090 9,679 Actuarial (gains) or losses 2,025 (2,442) (21,684) Employer's contributions 846 1,447 12,849 Retirement benefits paid (3,299) (3,472) (30,829) Partial refund of plan assets from employee retirement benefits trusts (3,000) - - Other 265 - -Balance at the end of the period ¥56,028 ¥52,651 $467,510
(3) Defined benefit liability at the beginning of the period and the end of the period for consolidated subsidiaries adopting the simplified method
Thousands of U.S. dollars
2015 2016 2016Balance at the beginning of the period ¥2,071 ¥1,950 $17,315 Retirement benefit cost 164 393 3,490 Retirement benefit paid (142) (144) (1,279) Annual contribution (184) (73) (648) Other 42 - -Balance at the end of the period ¥1,950 ¥2,126 $18,878
(4) Reconciliation between the liabilities (assets) recorded in the Consolidated Balance Sheets and the balances of defined benefit obligations and plan assets
Thousands of U.S. dollars
2015 2016 2016Retirement benefit obligations of the savings plans ¥55,051 ¥57,679 $512,156Plan assets (43,754) (41,571) (369,126)Retirement benefits trusts (13,944) (12,753) (113,239)
(2,647) 3,353 29,773Retirement benefit obligations of the non-savings plans 4,050 4,317 38,332Net liabilities and assets recorded on the Consolidated Balance Sheets 1,402 7,670 68,105Net defined benefit liability 8,402 9,218 81,850Net defined benefit asset (6,999) (1,547) (13,736)Net liabilities (assets) recorded on the Consolidated Balance Sheets ¥1,402 ¥7,670 $68,105
(5) Components of net periodic retirement benefits costs
Thousands of U.S. dollars
2015 2016 2016Service cost ¥2,041 ¥2,239 $19,881Interest cost 657 476 4,227Expected return on plan assets (1,072) (1,090) (9,679)Recognized actuarial (gains) or losses 2,096 2,136 18,966Amortization of prior service cost (253) (258) (2,291)Net retirement benefit costs of the plans adopting the simplified method 164 393 3,490Retirement benefit costs related to the defined benefit plans ¥3,633 ¥3,896 $34,594Note. Extra retirement payments for the years ended March 31, 2015 and 2016 in the amount of ¥45 million and ¥1,263 million (US$ 11,215 thousands) respectively, are accounted for as "Business structure improvement expenses" of Extraordinary loss.
(6) Remeasurements of defined benefit plans before deduction of deferred taxThousands of
U.S. dollars2015 2016 2016
Unrecognized prior service cost ¥253 ¥258 $2,291Unrecognized actuarial (gains) or losses (967) 4,618 41,005Total (¥713) ¥4,876 $43,296
Millions of yen
Millions of yen
Millions of yen
Millions of yen
Millions of yen
Millions of yen
reconciliation

58 Fujikura Annual Report 2016 Fujikura Annual Report 2016 59
Net deferred tax assets (liabilities) included in the Consolidated Balance Sheets are as follows:Thousands of
Millions of yen U.S. dollars2015 2016 2016
Current assets - Deferred tax assets ¥4,525 ¥5,263 $46,732Non-current assets - Deferred tax assets 4,699 10,643 94,504Current liabilities - Other (6) (16) (142)Non-current liabilities - Deferred tax liabilities (1,123) (766) (6,802)Net deferred tax assets
Adjustments to deferred tax assets, deferred tax liabilities etc. due to a change in the income tax rate :Due to approval in the Diet on March 29, 2016 of the “Partial Amendment of the Income Tax Act, etc.” and “The Revision of the Local Tax Law”,the statutory effective tax rate used to measure deferred tax assets and deferred tax liabilities (limited to settlements made after April 1, 2016)has been changed from the current 31.7% to 30.4% for temporary differences expected to be reversed during the period from the year beginning on April 1, 2016 to the year ending March 31, 2018,and to 30.2% for temporary differences expected to be reversed in the years beginning on April 1, 2018 and thereafter. As a result of these changes in the tax rate, the amount of deferred tax assets (netted of deferred tax liabilities) as at March 31, 2016increased by 175 million yen (US$1,554 thousand), valuation difference on available-for-sale securities as at March 31, 2016 increasedby 67 million yen (US$595 thousand), remeasurements of defined benefit plans s as at March 31, 2016 increased by 83 million yen (US$737 thousand), income taxes deferred for the year ended March 31, 2016 decreased by 24 million yen(US$213 thousand).
18. Contingent Liabilities Thousands of (a) Guarantees for liabilities Millions of yen U.S. dollarsGuarantees for loans borrowed / notes issued by: 2015 2016 2016Employees ¥319 ¥260 $2,309VISCAS corporation, affiliated company 10,481 7,667 68,078Other unconsolidated subsidiaries and affiliates 2,568 3,411 30,288
¥13,368 ¥11,339 $100,684
(b) OtherFujikura Electronics (Thailand) Ltd. (FETL), a consolidated subsidiary in Thailand, received (1) tax assessments in the amountof 883 million baht from the Revenue Department of Thailand on May 21, 2013, (2) tax assessments in the amount of 29 millionbaht from the Revenue Department of Thailand on May 28, 2014, (3) tax assessments in the amount of 7 million baht fromthe Revenue Department of Thailand on May 21, 2015, and (4) tax assessments in the amount of 1 million baht from the Revenue Departmentof Thailand on January 14, 2016.Management does not agree with the assessments of the Revenue Department believing them to be unjust and without legalgrounds. For (1), FETL plans to file a lawsuit with the Tax Court of Thailand following the unfavorable ruling to the petition to appeal the tax assessments to the Administrative Appeal Committee of the Revenue Department on June 18, 2013. For (2), FETL filed a petition toappeal the tax assessments to the Administrative Appeal Committee of the Revenue Department on June 19, 2014. For (3), FETL filed a petition to appeal the tax assessments to the Administrative Appeal Committee of the RevenueDepartment on June 18, 2015. For (4), FETL filed a petition to appeal the tax assessments to the Administrative Appeal Committee of the RevenueDepartment on February 12, 2016.If the Committee issues an unfavorable ruling, FETL intends to continue contesting the legitimacy of its position with the tax court. FETL provided bank guarantees to the Revenue Department in place of provisional payments on the same day.On May 16, 2016 the Supreme Court of the Kingdom of Thailand dismissed the claim made by another company which is similar to the lawsuit or petition by FETL mentioned above, while on June 16, 2016, notification of "The Time Extension for Submission of Corporate Income Tax Return Pursuant to the Revenue Code" has been issued by Ministry of Finance of the Kingdom of Thailand.We are thoroughly reviewing the judgement and the notification as discussed about and studying carefully these impactson the consolidated financial statements of the Company.
17. Income TaxesThe Company and its domestic subsidiaries are subject to a number of different income taxes which, in aggregate, indicate a normalstatutory tax rate in Japan of approximately 35.1% and 32.6% for the years ended March 31, 2015 and 2016, respectively.A reconciliation between the normal statutory income tax rate and the effective income tax rate in the accompanying ConsolidatedStatements of Income for the years ended March 31, 2015 and 2016 are as follows:
2015 2016Normal statutory tax rate 35.1 % 32.5 %Effect on tax rate resulting from permanent differences 0.9 0.6Foreign tax credit and payment (1.8) 3.5Equity in losses of affiliates 0.6 (0.9)Tax exemption in foreign tax jurisdiction (3.7) (8.1)Valuation allowance 2.8 (3.0)Effect of lower tax rates at overseas subsidiaries (7.3) (12.1)Amortization of Goodwill 3.8 6.0Other 3.8 8.4Effective income tax rate 34.2 % 27.0 %
The significant components of deferred tax assets and liabilities at March 31, 2015 and 2016 are as follows:Thousands of
Millions of yen U.S. dollars2015 2016 2016
Deferred tax assets:Inventory devaluations ¥1,009 ¥877 $7,787Bonus accrual 2,313 2,323 20,627Net defined benefit liability 3,701 4,566 40,543Elimination of intercompany profits on inventories 468 162 1,438Enterprise taxes 112 132 1,172Net operating losses carried forward 18,950 18,837 167,262Loss on valuation of investment securities 2,564 2,310 20,511Depreciation 3,152 3,160 28,059Allowance for doubtful accounts 1,085 1,016 9,021Impairment losses 1,435 1,242 11,028Elimination of intercompany profits on fixed assets 814 814 7,228Foreign tax credit carried forward 2,147 1,708 15,166Other 5,367 6,164 54,733Gross deferred tax assets 43,122 43,317 384,630Less: valuation allowance (29,185) (24,641) (218,798)Total deferred tax assets 13,937 18,676 165,832
Deferred tax liabilities:Special tax-purpose reserve for deferred gain on sale of property 786 733 6,509Retained earnings of equity-method affiliated company 546 543 4,822Net defined benefit asset 332 - -Unrealized gains on investment securities 3,815 1,428 12,680Other 361 847 7,521Total deferred tax liabilities 5,842 3,552 31,540Net deferred tax assets ¥8,094 ¥15,123 $134,283
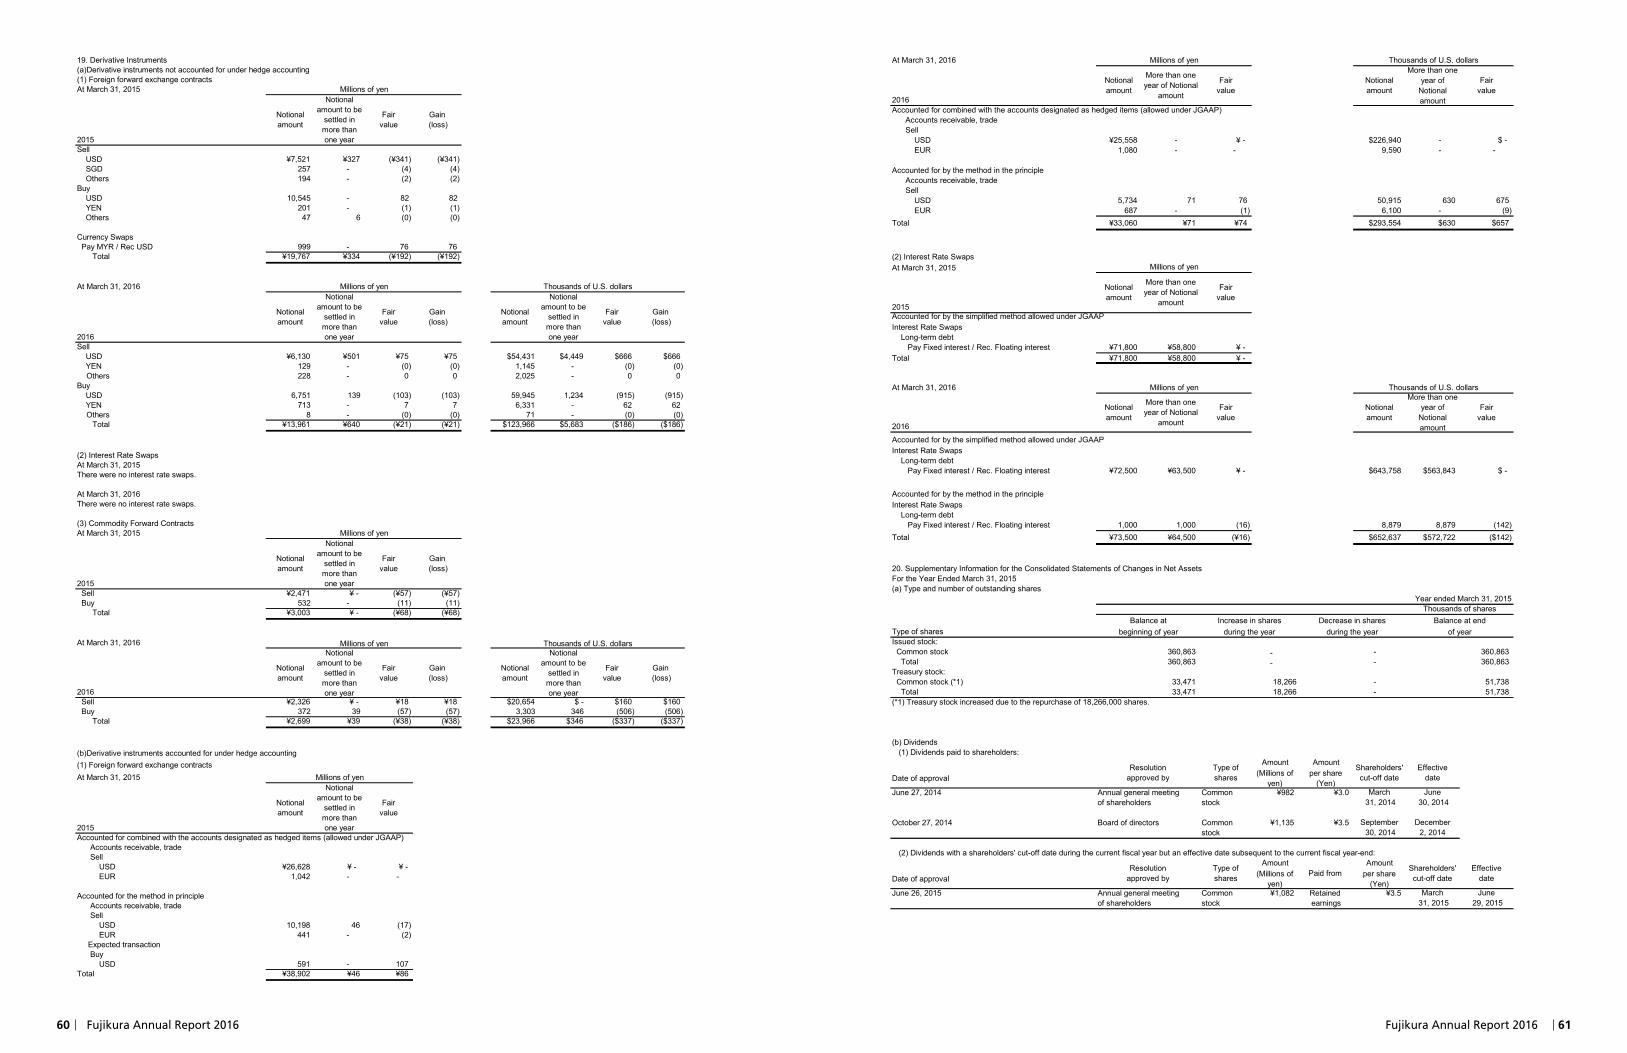
60 Fujikura Annual Report 2016 Fujikura Annual Report 2016 61
At March 31, 2016 Millions of yen Thousands of U.S. dollars
2016Accounted for combined with the accounts designated as hedged items (allowed under JGAAP) Accounts receivable, trade Sell USD ¥25,558 - ¥ - $226,940 - $ - EUR 1,080 - - 9,590 - -
Accounted for by the method in the principle Accounts receivable, trade Sell USD 5,734 71 76 50,915 630 675 EUR 687 - (1) 6,100 - (9)Total ¥33,060 ¥71 ¥74 $293,554 $630 $657
(2) Interest Rate SwapsAt March 31, 2015 Millions of yen
2015Accounted for by the simplified method allowed under JGAAPInterest Rate Swaps Long-term debt Pay Fixed interest / Rec. Floating interest ¥71,800 ¥58,800 ¥ -Total ¥71,800 ¥58,800 ¥ -
At March 31, 2016 Millions of yen Thousands of U.S. dollars
2016
Accounted for by the simplified method allowed under JGAAPInterest Rate Swaps Long-term debt Pay Fixed interest / Rec. Floating interest ¥72,500 ¥63,500 ¥ - $643,758 $563,843 $ -
Accounted for by the method in the principleInterest Rate Swaps Long-term debt Pay Fixed interest / Rec. Floating interest 1,000 1,000 (16) 8,879 8,879 (142)Total ¥73,500 ¥64,500 (¥16) $652,637 $572,722 ($142)
20. Supplementary Information for the Consolidated Statements of Changes in Net AssetsFor the Year Ended March 31, 2015(a) Type and number of outstanding shares
Year ended March 31, 2015
Type of sharesIssued stock: Common stock - Total -Treasury stock: Common stock (*1) - Total -(*1) Treasury stock increased due to the repurchase of 18,266,000 shares.
(b) Dividends (1) Dividends paid to shareholders:
Amount Amount
Date of approval (Millions ofyen)
per share(Yen)
June 27, 2014 Common ¥982 ¥3.0stock
October 27, 2014 Common ¥1,135 ¥3.5stock
(2) Dividends with a shareholders' cut-off date during the current fiscal year but an effective date subsequent to the current fiscal year-end:Amount Amount
Date of approval (Millions ofyen)
per share(Yen)
June 26, 2015 Common ¥1,082 Retained ¥3.5stock earnings
Resolutionapproved by
Type ofshares Paid from Shareholders'
cut-off dateEffective
date
Annual general meeting March 31, 2015
June 29, 2015of shareholders
Annual general meeting March 31, 2014
June 30, 2014of shareholders
Board of directors September 30, 2014
December2, 2014
33,471 18,266 51,738
Resolutionapproved by
Type ofshares
Shareholders'cut-off date
Effectivedate
360,863 - 360,863
33,471 18,266 51,738
beginning of year during the year during the year of year
360,863 - 360,863
Notionalamount
More than oneyear of
Notionalamount
Fairvalue
Thousands of sharesBalance at Increase in shares Decrease in shares Balance at end
Notionalamount
More than oneyear of Notional
amount
Fairvalue
Notionalamount
More than oneyear of Notional
amount
Fairvalue
Notionalamount
More than oneyear of Notional
amount
Fairvalue
Notionalamount
More than oneyear of
Notionalamount
Fairvalue
19. Derivative Instruments(a)Derivative instruments not accounted for under hedge accounting(1) Foreign forward exchange contractsAt March 31, 2015 Millions of yen
2015Sell USD ¥7,521 ¥327 (¥341) (¥341) SGD 257 - (4) (4) Others 194 - (2) (2)Buy USD 10,545 - 82 82 YEN 201 - (1) (1) Others 47 6 (0) (0)
Currency Swaps Pay MYR / Rec USD 999 - 76 76 Total ¥19,767 ¥334 (¥192) (¥192)
At March 31, 2016 Millions of yen Thousands of U.S. dollars
2016Sell USD ¥6,130 ¥501 ¥75 ¥75 $54,431 $4,449 $666 $666 YEN 129 - (0) (0) 1,145 - (0) (0)
Others 228 - 0 0 2,025 - 0 0Buy USD 6,751 139 (103) (103) 59,945 1,234 (915) (915) YEN 713 - 7 7 6,331 - 62 62
Others 8 - (0) (0) 71 - (0) (0) Total ¥13,961 ¥640 (¥21) (¥21) $123,966 $5,683 ($186) ($186)
(2) Interest Rate SwapsAt March 31, 2015There were no interest rate swaps.
At March 31, 2016There were no interest rate swaps.
(3) Commodity Forward ContractsAt March 31, 2015 Millions of yen
2015 Sell ¥2,471 ¥ - (¥57) (¥57) Buy 532 - (11) (11) Total ¥3,003 ¥ - (¥68) (¥68)
At March 31, 2016 Millions of yen Thousands of U.S. dollars
2016
Notionalamount
Notionalamount to be
settled inmore thanone year
Fairvalue
Gain (loss)
Notionalamount
Notionalamount to be
settled inmore thanone year
Fairvalue
Gain (loss)
Sell ¥2,326 ¥ - ¥18 ¥18 $20,654 $ - $160 $160 Buy 372 39 (57) (57) 3,303 346 (506) (506) Total ¥2,699 ¥39 (¥38) (¥38) $23,966 $346 ($337) ($337)
(b)Derivative instruments accounted for under hedge accounting(1) Foreign forward exchange contractsAt March 31, 2015 Millions of yen
2015Accounted for combined with the accounts designated as hedged items (allowed under JGAAP) Accounts receivable, trade Sell USD ¥26,628 ¥ - ¥ - EUR 1,042 - -
Accounted for the method in principle Accounts receivable, trade Sell USD 10,198 46 (17) EUR 441 - (2) Expected transaction Buy USD 591 - 107Total ¥38,902 ¥46 ¥86
Notionalamount to be
settled inmore thanone year
Fairvalue
Gain (loss)
Notionalamount
Notionalamount to be
settled inmore thanone year
Fairvalue
Gain (loss)
Gain (loss)
Notionalamount
Notionalamount to be
settled inmore thanone year
Fairvalue
Gain (loss)
Notionalamount
Notionalamount
Notionalamount to be
settled inmore thanone year
Fairvalue
Notionalamount
Notionalamount to be
settled inmore thanone year
Fairvalue
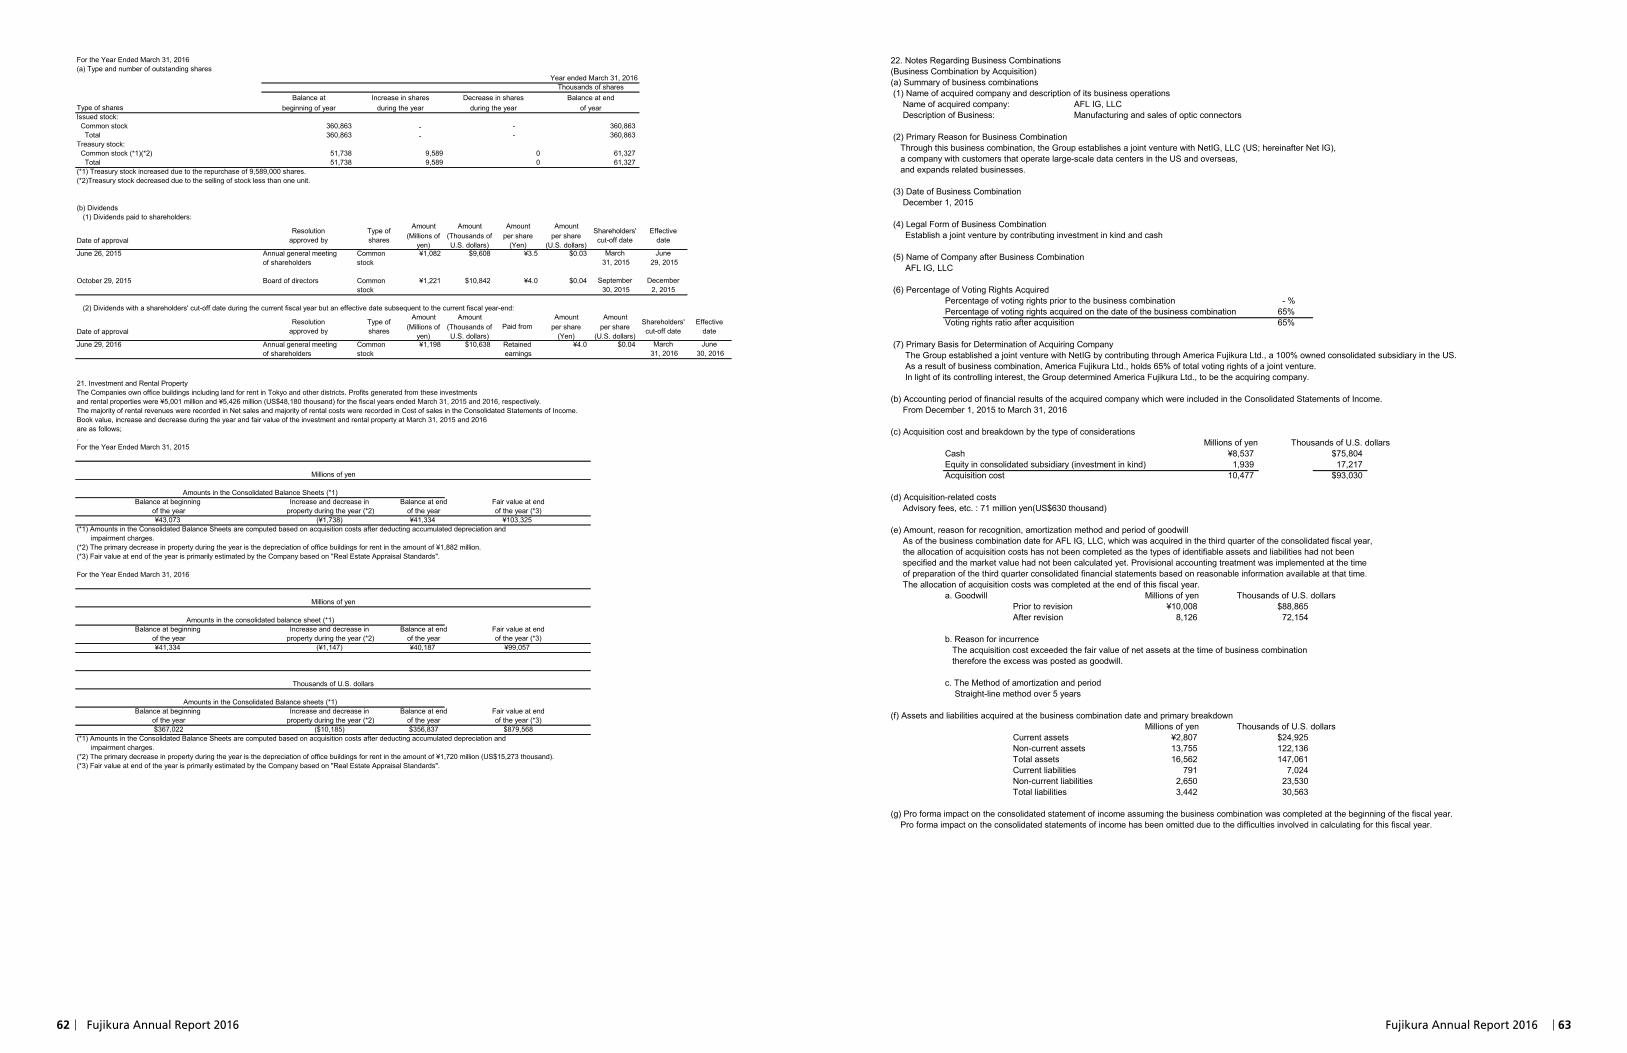
62 Fujikura Annual Report 2016 Fujikura Annual Report 2016 63
22. Notes Regarding Business Combinations(Business Combination by Acquisition)(a) Summary of business combinations (1) Name of acquired company and description of its business operations Name of acquired company: AFL IG, LLC Description of Business: Manufacturing and sales of optic connectors
(2) Primary Reason for Business Combination Through this business combination, the Group establishes a joint venture with NetIG, LLC (US; hereinafter Net IG), a company with customers that operate large-scale data centers in the US and overseas, and expands related businesses.
(3) Date of Business Combination December 1, 2015
(4) Legal Form of Business Combination Establish a joint venture by contributing investment in kind and cash
(5) Name of Company after Business Combination AFL IG, LLC
(6) Percentage of Voting Rights AcquiredPercentage of voting rights prior to the business combination - %Percentage of voting rights acquired on the date of the business combination 65%Voting rights ratio after acquisition 65%
(7) Primary Basis for Determination of Acquiring Company The Group established a joint venture with NetIG by contributing through America Fujikura Ltd., a 100% owned consolidated subsidiary in the US. As a result of business combination, America Fujikura Ltd., holds 65% of total voting rights of a joint venture. In light of its controlling interest, the Group determined America Fujikura Ltd., to be the acquiring company.
(b) Accounting period of financial results of the acquired company which were included in the Consolidated Statements of Income. From December 1, 2015 to March 31, 2016
(c) Acquisition cost and breakdown by the type of considerationsMillions of yen Thousands of U.S. dollars
Cash ¥8,537 $75,804Equity in consolidated subsidiary (investment in kind) 1,939 17,217Acquisition cost 10,477 $93,030
(d) Acquisition-related costs Advisory fees, etc. : 71 million yen(US$630 thousand)
(e) Amount, reason for recognition, amortization method and period of goodwill As of the business combination date for AFL IG, LLC, which was acquired in the third quarter of the consolidated fiscal year, the allocation of acquisition costs has not been completed as the types of identifiable assets and liabilities had not been specified and the market value had not been calculated yet. Provisional accounting treatment was implemented at the time of preparation of the third quarter consolidated financial statements based on reasonable information available at that time. The allocation of acquisition costs was completed at the end of this fiscal year.
a. Goodwill Millions of yen Thousands of U.S. dollarsPrior to revision ¥10,008 $88,865After revision 8,126 72,154
b. Reason for incurrence The acquisition cost exceeded the fair value of net assets at the time of business combination therefore the excess was posted as goodwill.
c. The Method of amortization and period Straight-line method over 5 years
(f) Assets and liabilities acquired at the business combination date and primary breakdownMillions of yen Thousands of U.S. dollars
Current assets ¥2,807 $24,925Non-current assets 13,755 122,136Total assets 16,562 147,061Current liabilities 791 7,024Non-current liabilities 2,650 23,530Total liabilities 3,442 30,563
(g) Pro forma impact on the consolidated statement of income assuming the business combination was completed at the beginning of the fiscal year. Pro forma impact on the consolidated statements of income has been omitted due to the difficulties involved in calculating for this fiscal year.
For the Year Ended March 31, 2016(a) Type and number of outstanding shares
Year ended March 31, 2016
Type of sharesIssued stock: Common stock - Total -Treasury stock: Common stock (*1)(*2) Total(*1) Treasury stock increased due to the repurchase of 9,589,000 shares.(*2)Treasury stock decreased due to the selling of stock less than one unit.
(b) Dividends (1) Dividends paid to shareholders:
Amount Amount Amount Amount
Date of approval (Millions ofyen)
(Thousands ofU.S. dollars)
per share(Yen)
per share(U.S. dollars)
June 26, 2015 Common ¥1,082 $9,608 ¥3.5 $0.03stock
October 29, 2015 Common ¥1,221 $10,842 ¥4.0 $0.04stock
(2) Dividends with a shareholders' cut-off date during the current fiscal year but an effective date subsequent to the current fiscal year-end:Amount Amount Amount Amount
Date of approval (Millions ofyen)
(Thousands ofU.S. dollars)
per share(Yen)
per share(U.S. dollars)
June 29, 2016 Common ¥1,198 $10,638 Retained ¥4.0 $0.04stock earnings
21. Investment and Rental PropertyThe Companies own office buildings including land for rent in Tokyo and other districts. Profits generated from these investments and rental properties were ¥5,001 million and ¥5,426 million (US$48,180 thousand) for the fiscal years ended March 31, 2015 and 2016, respectively. The majority of rental revenues were recorded in Net sales and majority of rental costs were recorded in Cost of sales in the Consolidated Statements of Income.Book value, increase and decrease during the year and fair value of the investment and rental property at March 31, 2015 and 2016are as follows;.For the Year Ended March 31, 2015
Millions of yen
Amounts in the Consolidated Balance Sheets (*1)Balance at beginning Increase and decrease in Balance at end Fair value at end
of the year property during the year (*2) of the year of the year (*3)¥43,073 (¥1,738) ¥41,334 ¥103,325
(*1) Amounts in the Consolidated Balance Sheets are computed based on acquisition costs after deducting accumulated depreciation and impairment charges. (*2) The primary decrease in property during the year is the depreciation of office buildings for rent in the amount of ¥1,882 million.(*3) Fair value at end of the year is primarily estimated by the Company based on "Real Estate Appraisal Standards".
For the Year Ended March 31, 2016
Millions of yen
Amounts in the consolidated balance sheet (*1)Balance at beginning Increase and decrease in Balance at end Fair value at end
of the year property during the year (*2) of the year of the year (*3)¥41,334 (¥1,147) ¥40,187 ¥99,057
Thousands of U.S. dollars
Amounts in the Consolidated Balance sheets (*1)Balance at beginning Increase and decrease in Balance at end Fair value at end
of the year property during the year (*2) of the year of the year (*3)$367,022 ($10,185) $356,837 $879,568
(*1) Amounts in the Consolidated Balance Sheets are computed based on acquisition costs after deducting accumulated depreciation and impairment charges. (*2) The primary decrease in property during the year is the depreciation of office buildings for rent in the amount of ¥1,720 million (US$15,273 thousand).(*3) Fair value at end of the year is primarily estimated by the Company based on "Real Estate Appraisal Standards".
Effectivedate
Annual general meeting March 31, 2016
June 30, 2016of shareholders
Board of directors September 30, 2015
December2, 2015
Resolutionapproved by
Type ofshares Paid from Shareholders'
cut-off date
Resolutionapproved by
Type ofshares
Shareholders'cut-off date
Effectivedate
Annual general meeting March 31, 2015
June 29, 2015of shareholders
51,738 9,589 0 61,32751,738 9,589 0 61,327
360,863 - 360,863360,863 - 360,863
Thousands of sharesBalance at Increase in shares Decrease in shares Balance at end
beginning of year during the year during the year of year
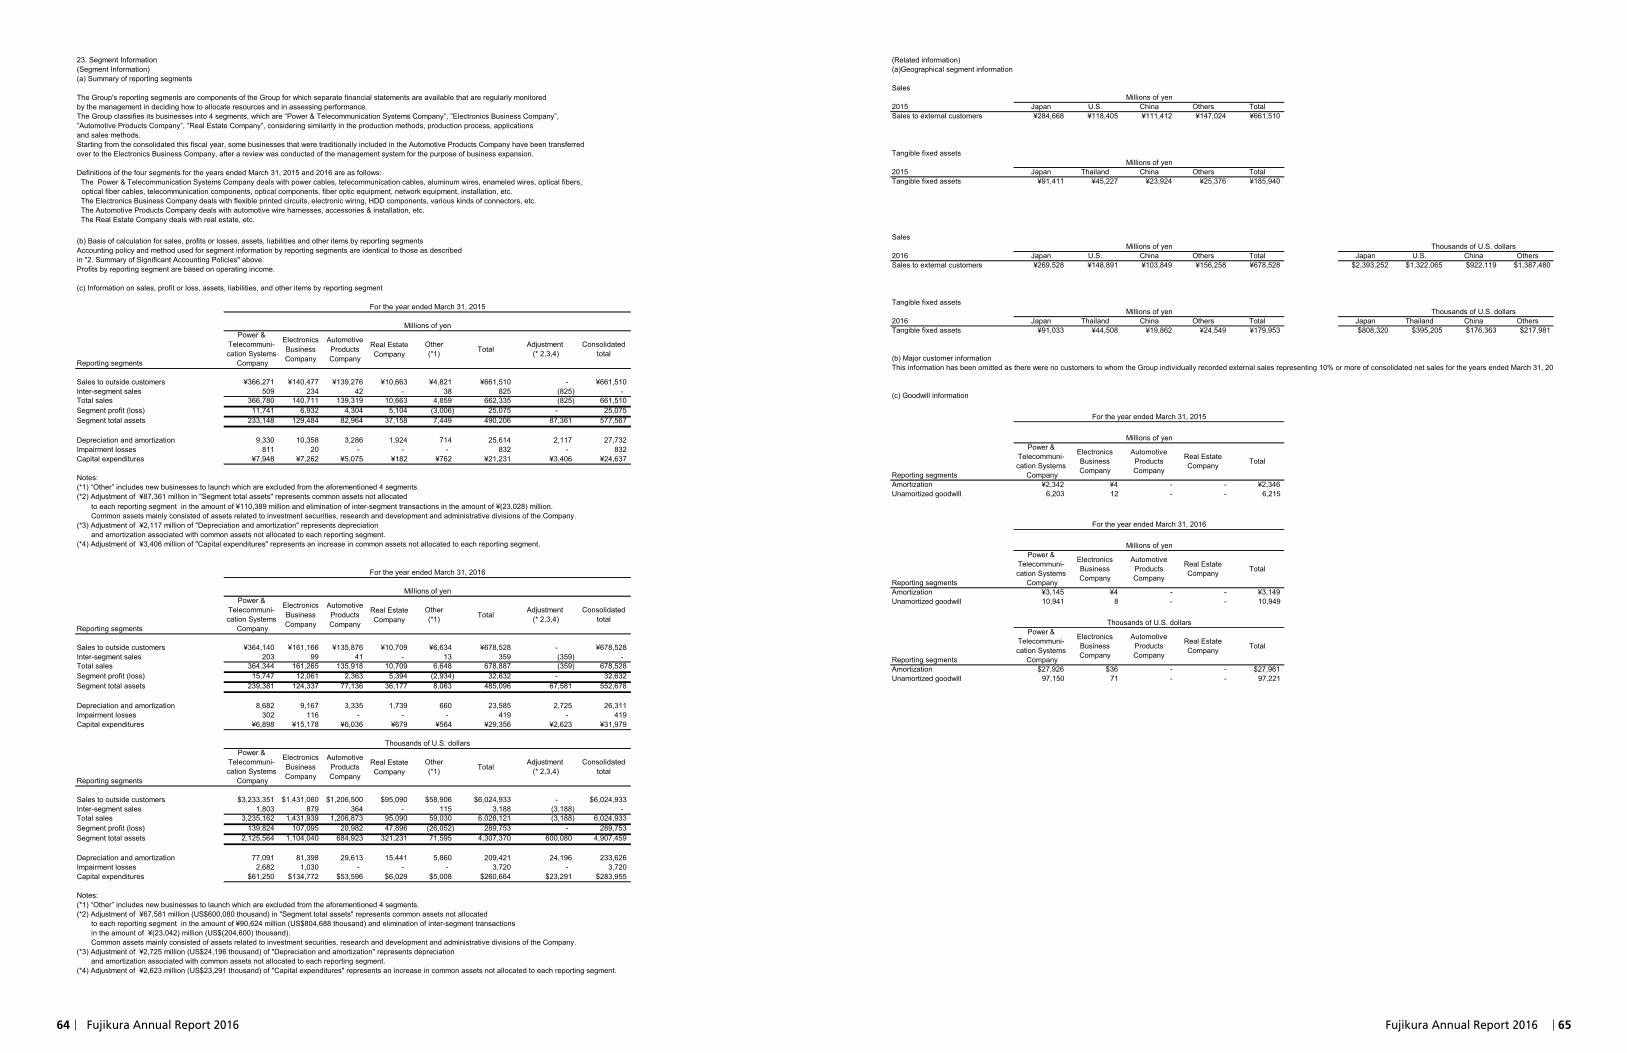
64 Fujikura Annual Report 2016 Fujikura Annual Report 2016 65
(Related information)(a)Geographical segment information
SalesMillions of yen
2015 Japan U.S. China Others TotalSales to external customers ¥284,668 ¥118,405 ¥111,412 ¥147,024 ¥661,510
Tangible fixed assetsMillions of yen
2015 Japan Thailand China Others TotalTangible fixed assets ¥91,411 ¥45,227 ¥23,924 ¥25,376 ¥185,940
SalesMillions of yen Thousands of U.S. dollars
2016 Japan U.S. China Others Total Japan U.S. China Others TotalSales to external customers ¥269,528 ¥148,891 ¥103,849 ¥156,258 ¥678,528 $2,393,252 $1,322,065 $922,119 $1,387,480 $6,024,933
Tangible fixed assetsMillions of yen Thousands of U.S. dollars
2016 Japan Thailand China Others Total Japan Thailand China Others TotalTangible fixed assets ¥91,033 ¥44,508 ¥19,862 ¥24,549 ¥179,953 $808,320 $395,205 $176,363 $217,981 $1,597,878
(b) Major customer informationThis information has been omitted as there were no customers to whom the Group individually recorded external sales representing 10% or more of consolidated net sales for the years ended March 31, 2015 and 2016.
(c) Goodwill information
For the year ended March 31, 2015
Millions of yenPower &
Telecommuni- cation Systems
Reporting segments CompanyAmortization ¥2,342 ¥4 - - ¥2,346Unamortized goodwill 6,203 12 - - 6,215
For the year ended March 31, 2016
Millions of yenPower &
Telecommuni- cation Systems
Reporting segments CompanyAmortization ¥3,145 ¥4 - - ¥3,149Unamortized goodwill 10,941 8 - - 10,949
Thousands of U.S. dollarsPower &
Telecommuni- cation Systems
Reporting segments CompanyAmortization $27,926 $36 - - $27,961Unamortized goodwill 97,150 71 - - 97,221
ElectronicsBusinessCompany
AutomotiveProductsCompany
Real EstateCompany Total
ElectronicsBusinessCompany
AutomotiveProductsCompany
Real EstateCompany Total
ElectronicsBusinessCompany
AutomotiveProductsCompany
Real EstateCompany Total
23. Segment Information(Segment Information)(a) Summary of reporting segments
The Group's reporting segments are components of the Group for which separate financial statements are available that are regularly monitoredby the management in deciding how to allocate resources and in assessing performance.The Group classifies its businesses into 4 segments, which are “Power & Telecommunication Systems Company”, ”Electronics Business Company”, ”Automotive Products Company”, ”Real Estate Company”, considering similarity in the production methods, production process, applications and sales methods.Starting from the consolidated this fiscal year, some businesses that were traditionally included in the Automotive Products Company have been transferred over to the Electronics Business Company, after a review was conducted of the management system for the purpose of business expansion.
Definitions of the four segments for the years ended March 31, 2015 and 2016 are as follows: The Power & Telecommunication Systems Company deals with power cables, telecommunication cables, aluminum wires, enameled wires, optical fibers, optical fiber cables, telecommunication components, optical components, fiber optic equipment, network equipment, installation, etc. The Electronics Business Company deals with flexible printed circuits, electronic wiring, HDD components, various kinds of connectors, etc. The Automotive Products Company deals with automotive wire harnesses, accessories & installation, etc. The Real Estate Company deals with real estate, etc.
(b) Basis of calculation for sales, profits or losses, assets, liabilities and other items by reporting segmentsAccounting policy and method used for segment information by reporting segments are identical to those as described in "2. Summary of Significant Accounting Policies" above. Profits by reporting segment are based on operating income.
(c) Information on sales, profit or loss, assets, liabilities, and other items by reporting segment
For the year ended March 31, 2015
Millions of yenPower &
Telecommuni- Other Adjustment Consolidated cation Systems (*1) (* 2,3,4) total
Reporting segments Company
Sales to outside customers ¥366,271 ¥140,477 ¥139,276 ¥10,663 ¥4,821 ¥661,510 - ¥661,510Inter-segment sales 509 234 42 - 38 825 (825) -Total sales 366,780 140,711 139,319 10,663 4,859 662,335 (825) 661,510Segment profit (loss) 11,741 6,932 4,304 5,104 (3,006) 25,075 - 25,075Segment total assets 233,148 129,484 82,964 37,158 7,449 490,206 87,361 577,567
Depreciation and amortization 9,330 10,358 3,286 1,924 714 25,614 2,117 27,732Impairment losses 811 20 - - - 832 - 832Capital expenditures ¥7,948 ¥7,262 ¥5,075 ¥182 ¥762 ¥21,231 ¥3,406 ¥24,637
Notes:(*1) “Other” includes new businesses to launch which are excluded from the aforementioned 4 segments.(*2) Adjustment of ¥87,361 million in "Segment total assets" represents common assets not allocated to each reporting segment in the amount of ¥110,389 million and elimination of inter-segment transactions in the amount of ¥(23,028) million. Common assets mainly consisted of assets related to investment securities, research and development and administrative divisions of the Company.(*3) Adjustment of ¥2,117 million of "Depreciation and amortization" represents depreciation and amortization associated with common assets not allocated to each reporting segment.(*4) Adjustment of ¥3,406 million of "Capital expenditures" represents an increase in common assets not allocated to each reporting segment.
For the year ended March 31, 2016
Millions of yenPower &
Telecommuni- Other Adjustment Consolidated cation Systems (*1) (* 2,3,4) total
Reporting segments Company
Sales to outside customers ¥364,140 ¥161,166 ¥135,876 ¥10,709 ¥6,634 ¥678,528 - ¥678,528Inter-segment sales 203 99 41 - 13 359 (359) -Total sales 364,344 161,265 135,918 10,709 6,648 678,887 (359) 678,528Segment profit (loss) 15,747 12,061 2,363 5,394 (2,934) 32,632 - 32,632Segment total assets 239,381 124,337 77,136 36,177 8,063 485,096 67,581 552,678
Depreciation and amortization 8,682 9,167 3,335 1,739 660 23,585 2,725 26,311Impairment losses 302 116 - - - 419 - 419Capital expenditures ¥6,898 ¥15,178 ¥6,036 ¥679 ¥564 ¥29,356 ¥2,623 ¥31,979
Thousands of U.S. dollarsPower &
Telecommuni- Other Adjustment Consolidated cation Systems (*1) (* 2,3,4) total
Reporting segments Company
Sales to outside customers $3,233,351 $1,431,060 $1,206,500 $95,090 $58,906 $6,024,933 - $6,024,933Inter-segment sales 1,803 879 364 - 115 3,188 (3,188) -Total sales 3,235,162 1,431,939 1,206,873 95,090 59,030 6,028,121 (3,188) 6,024,933Segment profit (loss) 139,824 107,095 20,982 47,896 (26,052) 289,753 - 289,753Segment total assets 2,125,564 1,104,040 684,923 321,231 71,595 4,307,370 600,080 4,907,459
Depreciation and amortization 77,091 81,398 29,613 15,441 5,860 209,421 24,196 233,626Impairment losses 2,682 1,030 - - - 3,720 - 3,720Capital expenditures $61,250 $134,772 $53,596 $6,029 $5,008 $260,664 $23,291 $283,955
Notes:(*1) “Other” includes new businesses to launch which are excluded from the aforementioned 4 segments.(*2) Adjustment of ¥67,581 million (US$600,080 thousand) in "Segment total assets" represents common assets not allocated to each reporting segment in the amount of ¥90,624 million (US$804,688 thousand) and elimination of inter-segment transactions in the amount of ¥(23,042) million (US$(204,600) thousand). Common assets mainly consisted of assets related to investment securities, research and development and administrative divisions of the Company.(*3) Adjustment of ¥2,725 million (US$24,196 thousand) of "Depreciation and amortization" represents depreciation and amortization associated with common assets not allocated to each reporting segment.(*4) Adjustment of ¥2,623 million (US$23,291 thousand) of "Capital expenditures" represents an increase in common assets not allocated to each reporting segment.
Real EstateCompany Total
ElectronicsBusinessCompany
AutomotiveProductsCompany
Real EstateCompany Total
ElectronicsBusinessCompany
AutomotiveProductsCompany
Real EstateCompany Total
ElectronicsBusinessCompany
AutomotiveProductsCompany
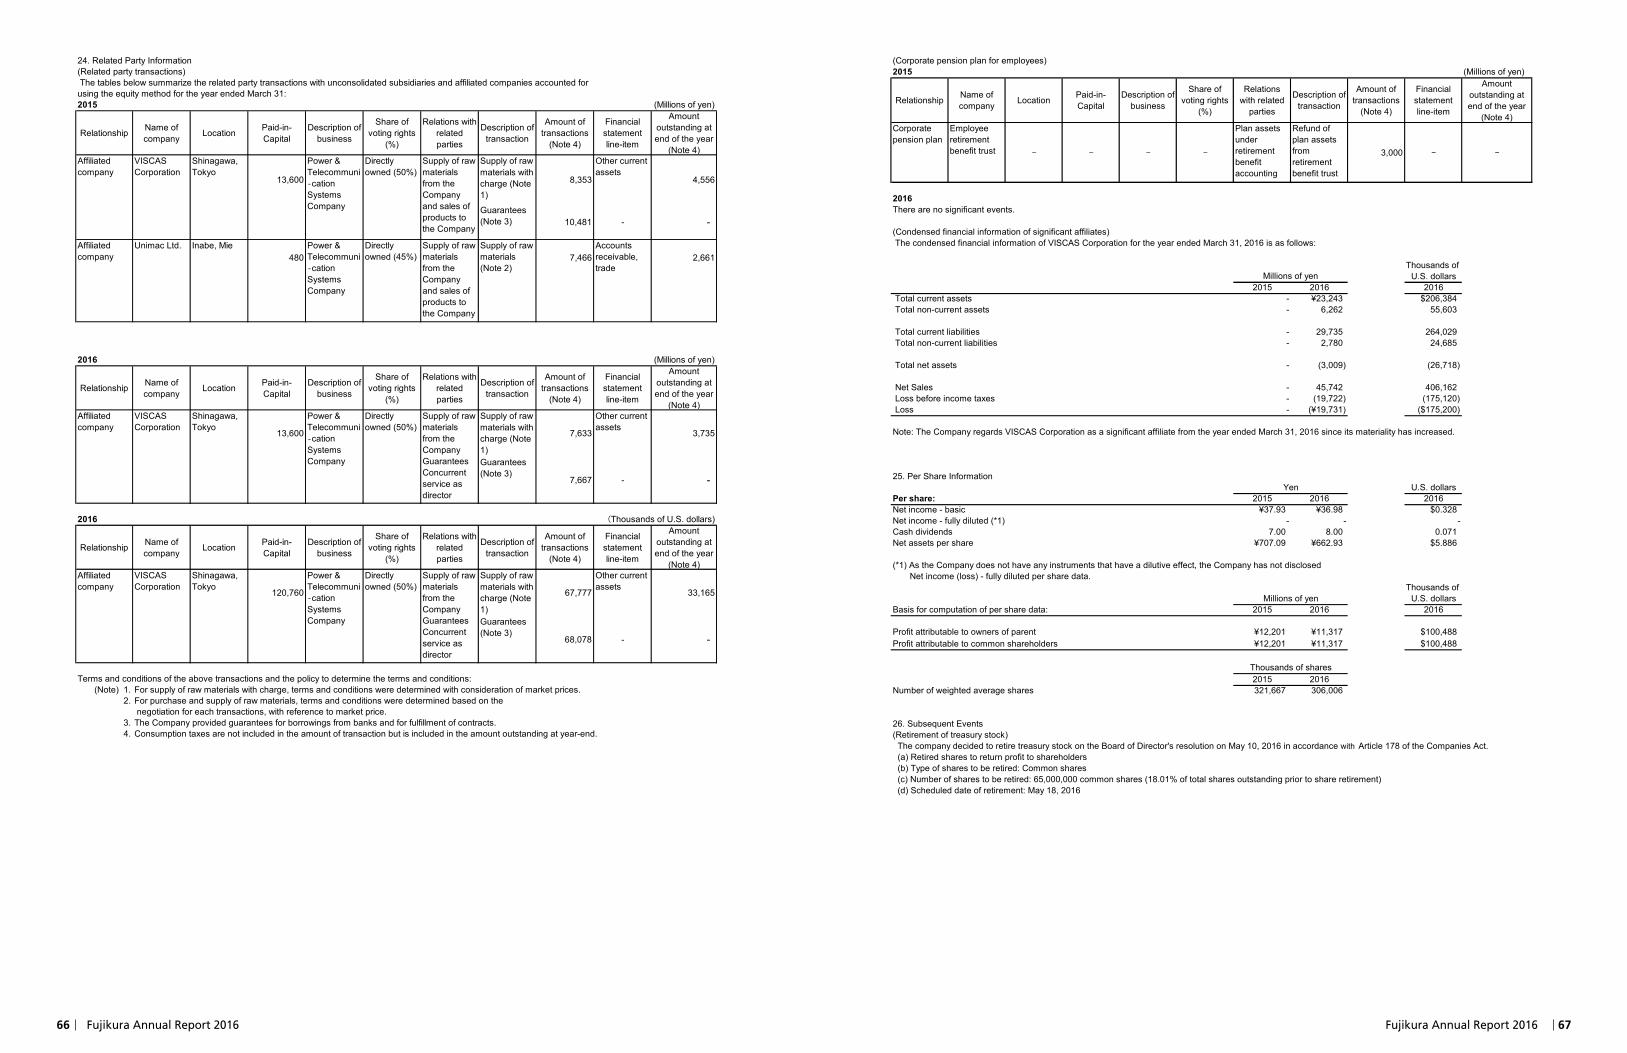
66 Fujikura Annual Report 2016 Fujikura Annual Report 2016 67
(Corporate pension plan for employees)2015 (Millions of yen)
Relationship Name ofcompany Location Paid-in-
CapitalDescription of
business
Share ofvoting rights
(%)
Relationswith related
parties
Description oftransaction
Amount oftransactions
(Note 4)
Financialstatementline-item
Amountoutstanding atend of the year
(Note 4)Corporatepension plan
Employeeretirementbenefit trust
Plan assetsunderretirementbenefitaccounting
Refund ofplan assetsfromretirementbenefit trust
3,000
2016There are no significant events.
(Condensed financial information of significant affiliates) The condensed financial information of VISCAS Corporation for the year ended March 31, 2016 is as follows:
Thousands of U.S. dollars
2015 2016 2016 Total current assets - ¥23,243 $206,384 Total non-current assets - 6,262 55,603
Total current liabilities - 29,735 264,029 Total non-current liabilities - 2,780 24,685
Total net assets - (3,009) (26,718)
Net Sales - 45,742 406,162 Loss before income taxes - (19,722) (175,120) Loss - (¥19,731) ($175,200)
Note: The Company regards VISCAS Corporation as a significant affiliate from the year ended March 31, 2016 since its materiality has increased.
25. Per Share InformationYen U.S. dollars
Per share: 2015 2016 2016Net income - basic ¥37.93 ¥36.98 $0.328Net income - fully diluted (*1) - - -Cash dividends 7.00 8.00 0.071Net assets per share ¥707.09 ¥662.93 $5.886
(*1) As the Company does not have any instruments that have a dilutive effect, the Company has not disclosed Net income (loss) - fully diluted per share data.
Thousands of Millions of yen U.S. dollars
Basis for computation of per share data: 2015 2016 2016
Profit attributable to owners of parent ¥12,201 ¥11,317 $100,488Profit attributable to common shareholders ¥12,201 ¥11,317 $100,488
Thousands of shares2015 2016
Number of weighted average shares 321,667 306,006
26. Subsequent Events(Retirement of treasury stock) The company decided to retire treasury stock on the Board of Director's resolution on May 10, 2016 in accordance wtih Article 178 of the Companies Act. (a) Retired shares to return profit to shareholders (b) Type of shares to be retired: Common shares (c) Number of shares to be retired: 65,000,000 common shares (18.01% of total shares outstanding prior to share retirement) (d) Scheduled date of retirement: May 18, 2016
Millions of yen
24. Related Party Information(Related party transactions) The tables below summarize the related party transactions with unconsolidated subsidiaries and affiliated companies accounted forusing the equity method for the year ended March 31:2015 (Millions of yen)
Relationship Name ofcompany Location Paid-in-
CapitalDescription of
business
Share ofvoting rights
(%)
Relations withrelatedparties
Description oftransaction
Amount oftransactions
(Note 4)
Financialstatementline-item
Amountoutstanding atend of the year
(Note 4)Affiliatedcompany
VISCASCorporation
Shinagawa,Tokyo
13,600
Directlyowned (50%)
Supply of rawmaterials withcharge (Note1)
8,353
Other currentassets
4,556
Guarantees(Note 3) 10,481 - -
Affiliatedcompany
Unimac Ltd. Inabe, Mie480
Directlyowned (45%)
Supply of rawmaterials(Note 2)
7,466Accountsreceivable,trade
2,661
2016 (Millions of yen)
Relationship Name ofcompany Location Paid-in-
CapitalDescription of
business
Share ofvoting rights
(%)
Relations withrelatedparties
Description oftransaction
Amount oftransactions
(Note 4)
Financialstatementline-item
Amountoutstanding atend of the year
(Note 4)Affiliatedcompany
VISCASCorporation
Shinagawa,Tokyo
13,600
Directlyowned (50%)
Supply of rawmaterials withcharge (Note1)
7,633
Other currentassets
3,735
Guarantees(Note 3)
7,667 - -
2016 Thousands of U.S. dollars)
Relationship Name ofcompany Location Paid-in-
CapitalDescription of
business
Share ofvoting rights
(%)
Relations withrelatedparties
Description oftransaction
Amount oftransactions
(Note 4)
Financialstatementline-item
Amountoutstanding atend of the year
(Note 4)Affiliatedcompany
VISCASCorporation
Shinagawa,Tokyo
120,760
Directlyowned (50%)
Supply of rawmaterials withcharge (Note1)
67,777
Other currentassets
33,165
Guarantees(Note 3)
68,078 - -
Terms and conditions of the above transactions and the policy to determine the terms and conditions:(Note) 1. For supply of raw materials with charge, terms and conditions were determined with consideration of market prices.
2. For purchase and supply of raw materials, terms and conditions were determined based on the negotiation for each transactions, with reference to market price.
3. The Company provided guarantees for borrowings from banks and for fulfillment of contracts.4. Consumption taxes are not included in the amount of transaction but is included in the amount outstanding at year-end.
Power &Telecommuni‐cationSystemsCompany
Supply of rawmaterialsfrom theCompanyGuaranteesConcurrentservice asdirector
Power &Telecommuni‐cationSystemsCompany
Supply of rawmaterialsfrom theCompanyand sales ofproducts tothe Company
Supply of rawmaterialsfrom theCompanyand sales ofproducts tothe Company
Power &Telecommuni‐cationSystemsCompany
Power &Telecommuni‐cationSystemsCompany
Supply of rawmaterialsfrom theCompanyGuaranteesConcurrentservice asdirector
with
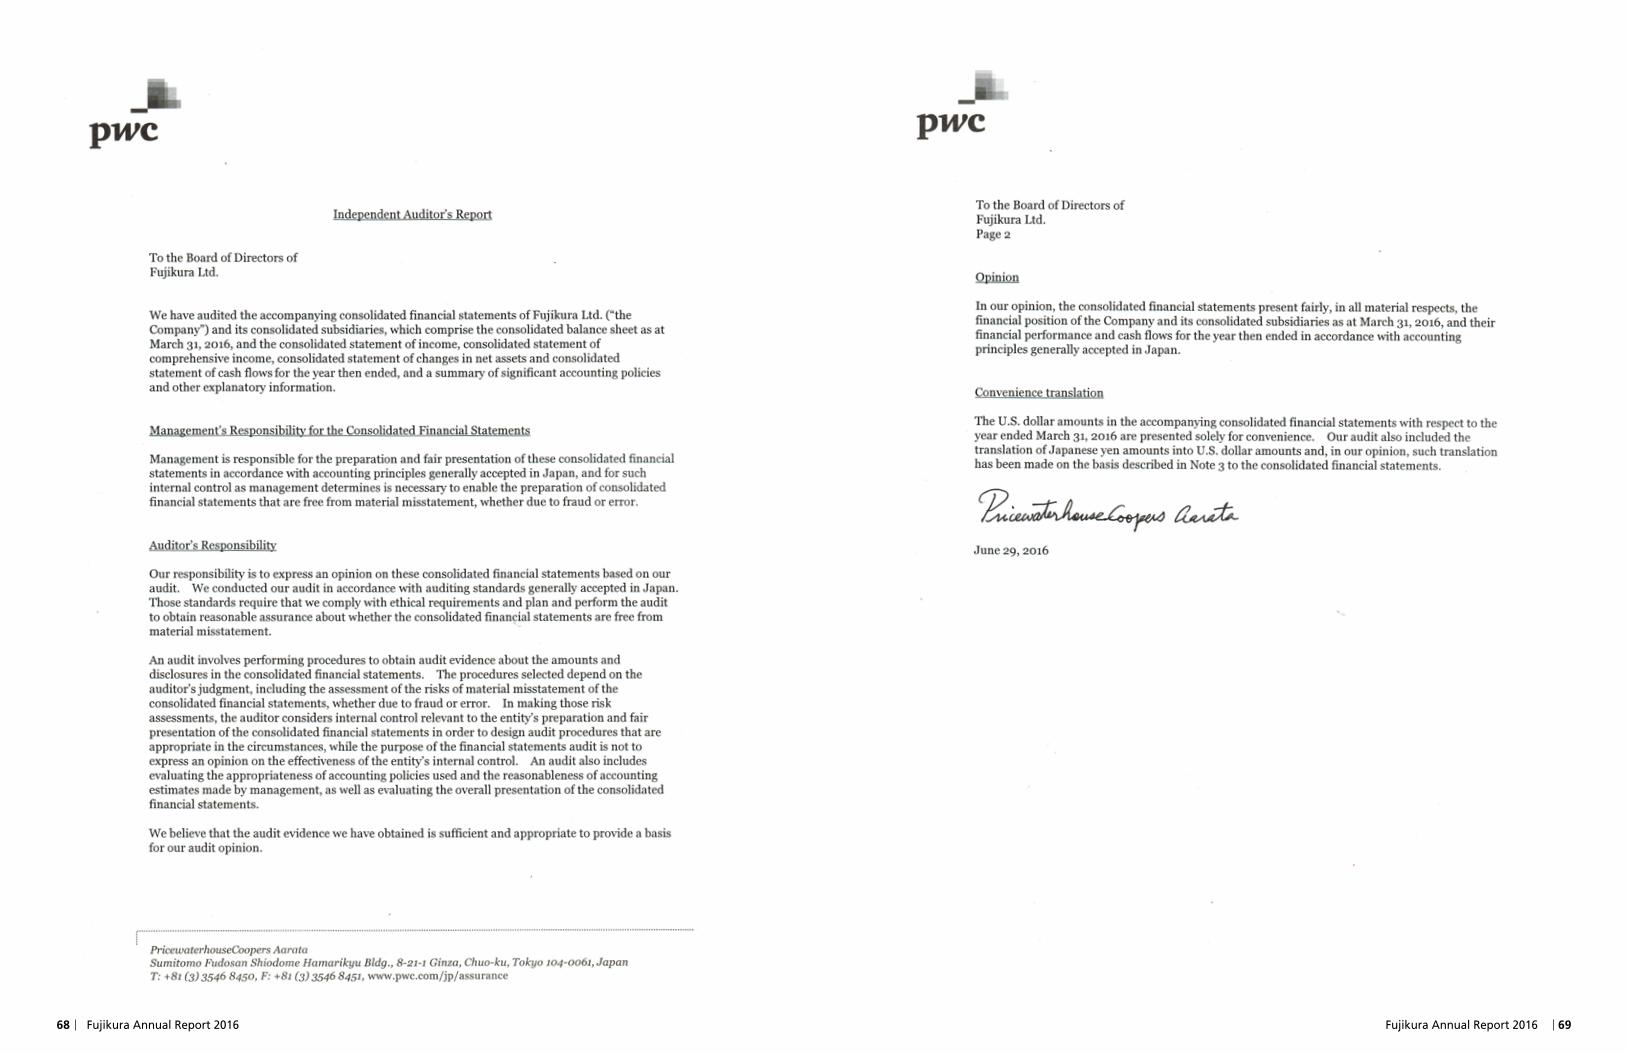
68 Fujikura Annual Report 2016 Fujikura Annual Report 2016 69
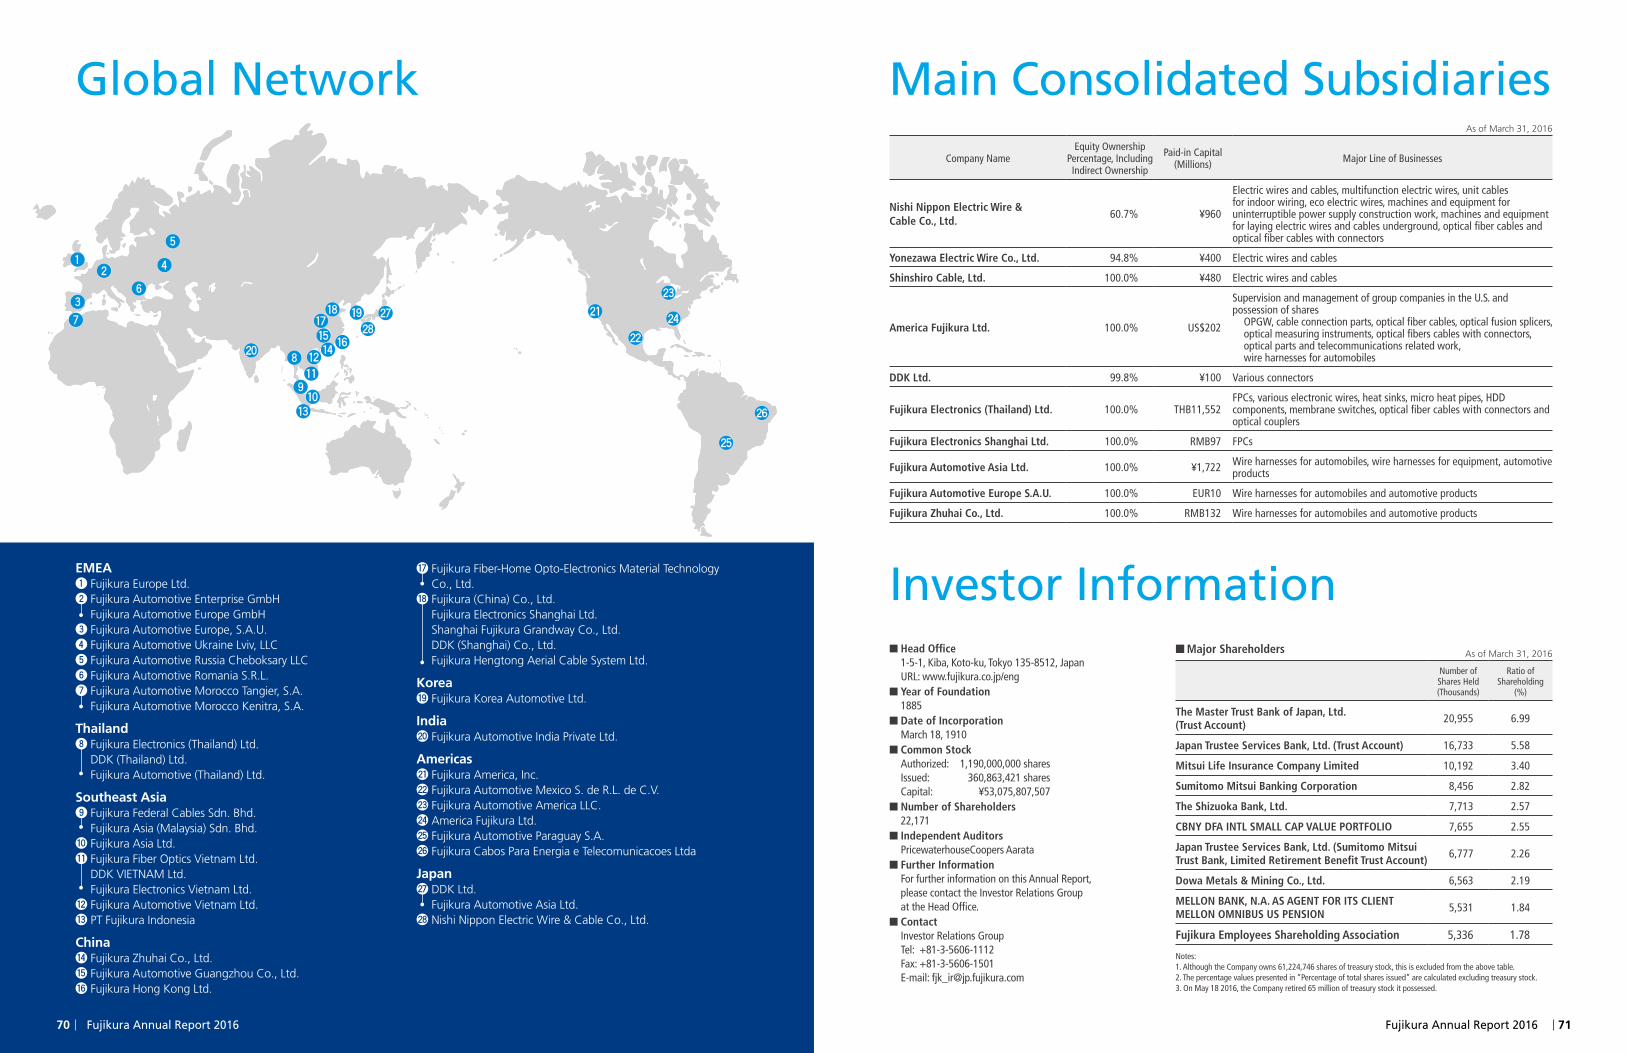
Fujikura Annual Report 2016 7170 Fujikura Annual Report 2016
InvestorInformation
As of March 31, 2016
Company NameEquity Ownership
Percentage, IncludingIndirect Ownership
Paid-in Capital(Millions) Major Line of Businesses
Nishi Nippon Electric Wire & Cable Co., Ltd.
60.7% ¥960
Electric wires and cables, multifunction electric wires, unit cables for indoor wiring, eco electric wires, machines and equipment for uninterruptible power supply construction work, machines and equipment for laying electric wires and cables underground, optical fiber cables and optical fiber cables with connectors
Yonezawa Electric Wire Co., Ltd. 94.8% ¥400 Electric wires and cables
Shinshiro Cable, Ltd. 100.0% ¥480 Electric wires and cables
America Fujikura Ltd. 100.0% US$202
Supervision and management of group companies in the U.S. and possession of shares
OPGW, cable connection parts, optical fiber cables, optical fusion splicers, optical measuring instruments, optical fibers cables with connectors, optical parts and telecommunications related work,wire harnesses for automobiles
DDK Ltd. 99.8% ¥100 Various connectors
Fujikura Electronics (Thailand) Ltd. 100.0% THB11,552FPCs, various electronic wires, heat sinks, micro heat pipes, HDD components, membrane switches, optical fiber cables with connectors and optical couplers
Fujikura Electronics Shanghai Ltd. 100.0% RMB97 FPCs
Fujikura Automotive Asia Ltd. 100.0% ¥1,722 Wire harnesses for automobiles, wire harnesses for equipment, automotive products
Fujikura Automotive Europe S.A.U. 100.0% EUR10 Wire harnesses for automobiles and automotive products
Fujikura Zhuhai Co., Ltd. 100.0% RMB132 Wire harnesses for automobiles and automotive products
■ Major Shareholders As of March 31, 2016
Number ofShares Held(Thousands)
Ratio ofShareholding
(%)
The Master Trust Bank of Japan, Ltd. (Trust Account) 20,955 6.99
Japan Trustee Services Bank, Ltd. (Trust Account) 16,733 5.58
Mitsui Life Insurance Company Limited 10,192 3.40
Sumitomo Mitsui Banking Corporation 8,456 2.82
The Shizuoka Bank, Ltd. 7,713 2.57
CBNY DFA INTL SMALL CAP VALUE PORTFOLIO 7,655 2.55
Japan Trustee Services Bank, Ltd. (Sumitomo Mitsui Trust Bank, Limited Retirement Benefit Trust Account) 6,777 2.26
Dowa Metals & Mining Co., Ltd. 6,563 2.19
MELLON BANK, N.A. AS AGENT FOR ITS CLIENTMELLON OMNIBUS US PENSION 5,531 1.84
Fujikura Employees Shareholding Association 5,336 1.78
Notes: 1. Although the Company owns 61,224,746 shares of treasury stock, this is excluded from the above table.2. The percentage values presented in “Percentage of total shares issued” are calculated excluding treasury stock.3. On May 18 2016, the Company retired 65 million of treasury stock it possessed.
■ Head Office 1-5-1, Kiba, Koto-ku, Tokyo 135-8512, Japan URL: www.fujikura.co.jp/eng ■ Year of Foundation 1885 ■ Date of Incorporation March 18, 1910 ■ Common Stock Authorized: 1,190,000,000 shares Issued: 360,863,421 shares Capital: ¥53,075,807,507 ■ Number of Shareholders 22,171 ■ Independent Auditors PricewaterhouseCoopers Aarata ■ Further Information For further information on this Annual Report,please contact the Investor Relations Group at the Head Office. ■ Contact Investor Relations Group Tel: +81-3-5606-1112 Fax: +81-3-5606-1501 E-mail: [email protected]
MainConsolidatedSubsidiaries
EMEA1 Fujikura Europe Ltd.2 Fujikura Automotive Enterprise GmbH Fujikura Automotive Europe GmbH3 Fujikura Automotive Europe, S.A.U.4 Fujikura Automotive Ukraine Lviv, LLC5 Fujikura Automotive Russia Cheboksary LLC6 Fujikura Automotive Romania S.R.L.7 Fujikura Automotive Morocco Tangier, S.A. Fujikura Automotive Morocco Kenitra, S.A.
Thailand8 Fujikura Electronics (Thailand) Ltd. DDK (Thailand) Ltd. Fujikura Automotive (Thailand) Ltd.
Southeast Asia9 Fujikura Federal Cables Sdn. Bhd. Fujikura Asia (Malaysia) Sdn. Bhd.0 Fujikura Asia Ltd.q Fujikura Fiber Optics Vietnam Ltd. DDK VIETNAM Ltd. Fujikura Electronics Vietnam Ltd.w Fujikura Automotive Vietnam Ltd.e PT Fujikura Indonesia
Chinar Fujikura Zhuhai Co., Ltd.t Fujikura Automotive Guangzhou Co., Ltd. y Fujikura Hong Kong Ltd.
u Fujikura Fiber-Home Opto-Electronics Material Technology Co., Ltd.
i Fujikura (China) Co., Ltd. Fujikura Electronics Shanghai Ltd. Shanghai Fujikura Grandway Co., Ltd. DDK (Shanghai) Co., Ltd. Fujikura Hengtong Aerial Cable System Ltd.
Koreao Fujikura Korea Automotive Ltd.
Indiap Fujikura Automotive India Private Ltd.
Americasa Fujikura America, Inc.s Fujikura Automotive Mexico S. de R.L. de C.V.d Fujikura Automotive America LLC.f America Fujikura Ltd. g Fujikura Automotive Paraguay S.A.h Fujikura Cabos Para Energia e Telecomunicacoes Ltda
Japanj DDK Ltd. Fujikura Automotive Asia Ltd.㉘ Nishi Nippon Electric Wire & Cable Co., Ltd.
g
12
6
5
4
a
sp
f
h
d
o jk
iut yr
e
wq
09
8
3
7
Global Network