Embed Size (px)
Citation preview
NASATechnical NASA-TP-2495 19850022994
Paper2495
July 1985
Rapid Estimation ofConcentration of AromaticGlasses in Middistillate
Fuels by High-PerformanceLiquid Chromatography
Dumas A. Ottersonand Gary T. Seng
t."d'.K;! t__. iO__,t .,_',7(._.{ t , 1; t.],_f
L lli!,_,"_!7'/. Ix,,-_.).,
!.rWvl!_t '_/,.!,, 't_'_", '"
NASA
https://ntrs.nasa.gov/search.jsp?R=19850022994 2018-07-31T02:06:40+00:00Z

NASATechnicalPaper2495
1985
Rapid Estimation ofConcentration of AromaticClasses in MiddistillateFuels by High-PerformanceLiquid Chromatography
Dumas A. Otterson
and Gary T. SengLewis Research CenterCleveland, Ohio
RII ANational Aeronauticsand Space Administration
Scientific and TechnicalInformation Branch

Summary There was also evidence that the presence of polycyclicaromatics may introduce errors in the determination of
High-performance liquid chromatography (HPLC) is the aromatic group in which the standards are preparedone of the most promising methods for the general by the reaction of the fuel with sulfuric acid. Correctionscharacterization of middistillate fuels. The value of this based on the change in the refractive index thattechnique is its precision, speed, and range of sample accompanies a change in composition of the aromatictypes. However, the accuracy of the method is affected fraction improved both the precision and accuracy of theby the suitability of the standards used for calibration, values obtained for the aromatic group concentration.Each aromatic class in a fuel is composed of manycompounds. The most accurate results would be obtainedif the composition of the corresponding group in the Introductionstandard and that in the fuel were identical. Themultiplicity of fuel sources and refining methods suggests Current trends in petroleum technology have led tothe need for many standards or other ways to quantitate increased attention to hydrocarbon group-typethe HPLC data. determinations (saturates, olefins, and aromatics) for jet
This report presents the results of an investigation into turbine fuels. In addition to increasing aromaticquantitative HPLC methods. The data were obtained by contents, future jet fuels may exhibit a change in theusing modern chromatographic instrumentation distribution of monocyclic and polynuclear aromatics.equipped with a 25-cm aminosilane column and a Such changes may occur as a result of an increase in therefractive index detector. The eluent was hexane, final boiling points of the fuels, an increase in the amountAccurate values for the concentrations of the classes were of cracked stock streams employed to produce the fuels,
obtained by using standards that were derived from each or the eventual introduction of syncrudes into thefuel by preparative HPLC. Inasmuch as standard refineries. Consequently, several important fuelpreparation by this means may require several days, other properties, including combustion quality, materialsquantitative methods were investigated. The method that compatibility, and fuel stability, may be affected. Thus,was developed requires only one chromatogram (-20 the need for class determinations of aromatics (i.e., themin) for the estimation of aromatic class concentrations quantities of monocyclic, dicyclic, tricyclic, etc.if the total aromatic concentration is known. The aromatics) is becoming increasingly critical for aestimations also use one average value of the refractive complete characterization of fuels.index for each aromatic class for all fuels. Aromatic class analyses can be performed with various
The seven fuels used in this study covered a wide range degrees of accuracy and precision through the use ofof composition. The amounts of the monocyclic several modern instrumental techniques. Thesearomatics ranged from 13to 55 vol %; those of the fused techniques are generally quite time consuming. Massdicyclic aromatics from 1 to 20 vol %; and those of the spectrometry (MS) can be employed following afused tricyclic aromatics from 0to 1.5 vol °10.The relative separation of the fuel into fractions of saturates anderrors obtained for each class by using the method aromatics (ref. 1). Nuclear magnetic resonance (NMR)developed varied among the fuels. For the monocyclic spectrometric methods for both fractionated and wholearomatic class, the relative errors ranged from 0.3 to 8.8 fuels have been reported to provide relatively goodpercent. More than half of them were less than 1percent, results. However, these methods require C-13 NMRThe relative errors for the fused dicyclic aromatics ranged results and/or other characterization data in addition tofrom 0.6 to 10.1 percent with more than half being proton results (refs. 2 and 3). Ultraviolet (UV)greater than 6.5 percent. The absolute errors in the spectrophotometric methods have also been attemptedconcentrations of both the miscellaneous polycyclic with varying degrees of success (refs. 4 and 5). Gasaromatics and the fused tricyclic aromatics were less than chromatographic (GC) determinations are also possible,0.3 vol °7owith most being less than 0.1 vol %. although most current studies are aimed at more detailed
separations to identify individual components (ref. 6). that were operated by the controller. The sampling valveOne method which has demonstrated much promise for was a 1-/zl, four-port internal shaft injection valvedeterminations of this type is high-performance liquid (AHCFSV-4UHPa-N60, Valco Instruments Co., Inc.)chromatography (HPLC) employing a bonded that was equipped with a syringe adapter. The backflushaminosilane column (refs. 7 to 10). This technique is valve was a six-port valve (AHCV-6UHPa-N60, Valcorelatively fast, simple, accurate, and precise. However, as Instruments Co., Inc.). A third valve, which was handis the case for the MS, UV, and GC methods, operated, was included in the system to facilitatequantitative HPLC work requires the use of accurately conversion of the one-column configuration to a three-prepared standards or a fuel fractionation step. column configuration and vice versa. The columns were aPreparation of accurate standards from pure compounds 25-cm-long by 4.6-mm-inside-diameter, 5-_m reversiblerequires a detailed analysis of each fuel class for each fuel Hi-Chrom aminosilane column (Regis Chemicalto be analyzed. The excessive time required for these Company); a 30-cm-long by 3.9-mm-inside-diameter,analyses can be avoided by fractionation of the fuel by 10-/_mPorasil (SiO2) column (Waters Associates); and ausing high-performance preparative liquid 25-cm-long by 4.5-mm-inside-diameter, 10-/zmchromatography. Even this technique can require several Spherisorb (SiO2) column (Jones Chromatography,days of operator time to produce sufficient amounts to be Inc.).used as aromatic class standards. A schematic drawing of the system is presented in
Rapid fuel characterization would greatly facilitate the figure 1. The solid arcs on the backflush valve indicatestudy of the effect of aromatic classes on a number of the forward flow configuration, and the dashed arcsimportant fuel properties. Sink, Hardy, and Hazlett show the configurations for reverse flow. The solid arcsrecently published a paper about compound class on the manual valve indicate the flow when all columnsquantitation in JP-5 jet fuels (ref. 11). The quantitation are included in the flow path, and the dashed arcsprocedure utilized standards which had the same indicate the flow when only the aminosilane column isrefractive index as the average values that were obtained used.for the classes of a number of JP-5 fuels. Preparative chromatograph.--A model 830 liquidSemipreparative chromatography was used to prepare chromatograph (Du Pont Company) equipped with asufficient amounts of the saturates, and monocyclic and model 837 spectrophotometer and a model 845dicyclic aromatic classes for the measurement of their refractometer, which had been converted to a high-refractive indices, performance preparative liquid chromatograph
In this investigation, a variety of middistillate fuels are (HPPLC), was used to produce class standards from eachemployed to develop quantitative HPLC methods for fuel. This chromatograph used a 25-cm by 21.2-mm-four aromatic classes which individually require less than inner-diameter aminosilane column in place of the1hr to complete. In addition to JP-5 fuels, this study also analytical column. A fraction collection system, a dead-includes diesel fuels and experimental referee-broadened volume tee, and a needle valve were also part of thespecification (ERBS)fuels. Quantitation is accomplished HPPLC. The valve was adjusted so that a fuelby using various types of standards as well as a method component was discharged at the same time its presencebased on refractive indices. The results so obtained are was indicated by a response on the refractive indexcompared with those obtained by using standards detector.produced by preparative HPLC and in specific cases with
those obtained by mass spectroscopy. Chromatographic Methods
Analysis.--The analytical chromatograph indicated inExperimental Procedure figure 1 can be used for several types of fuel analysis:
aromatic class-type analysis, group-type analysis, andInstrumentation identification of components of the miscellaneous
Analytical chromatograph.--A model 324 gradient polycyclic class. Group-type and aromatic class-typeliquid chromatograph (Beckman Instruments, Inc.) was analyses need only one column (the amino column) in theemployed in this work. It was equipped with several system. Group-type analyses require backflushing tobecolumns, a model 421 controller, model 100A pumps, a started after elution of the saturated hydrocarbons andmixing chamber, a diode array detection system olefins and prior to elution of any aromatic(Hewlett-Packard 1040A HPLC UV-VIS), and a hydrocarbons. On the other hand, class-type analysesrefractive index detector (Altex model 156). This system require no backflushing. Identification of thewas modified by the addition of an onstream solvent components of the miscellaneous polycyclic fractiondrying filter (Alltech Associates) between the mixing generally requires the use of all three columns. Details ofchamber and the sample valve. Sample introduction and the identification methods are presented in the sectionbackflushing were accomplished by air-actuated valves DATA TREATMENT.
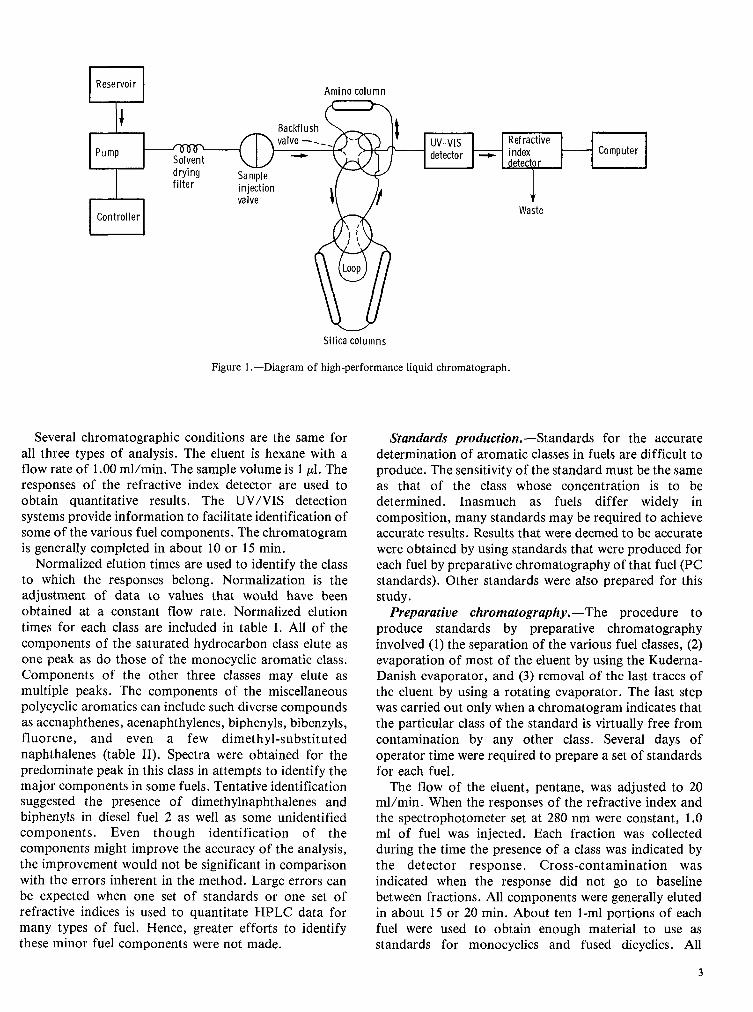
I Resewoir I Amino column
I _ valve_- _ Refractive ComputerPuml, I Solvent _ _ indexdetectordrying Sample /filter injection
valve
I Controller I Waste
Silicacolumns
Figure 1.--Diagram of high-performance liquid chromatograph.
Several chromatographic conditions are the same for Standards production.--Standards for the accurateall three types of analysis. The eluent is hexane with a determination of aromatic classes in fuels are difficult toflow rate of 1.00 ml/min. The sample volume is 1/_l. The produce. The sensitivity of the standard must be the sameresponses of the refractive index detector are used to as that of the class whose concentration is to beobtain quantitative results. The UV/VIS detection determined. Inasmuch as fuels differ widely insystems provide information to facilitate identification of composition, many standards may be required to achievesome of the various fuel components. The chromatogram accurate results. Results that were deemed to be accurateis generally completed in about 10 or 15 min. were obtained by using standards that were produced for
Normalized elution times are used to identify the class each fuel by preparative chromatography of that fuel (PCto which the responses belong. Normalization is the standards). Other standards were also prepared for thisadjustment of data to values that would have been study.obtained at a constant flow rate. Normalized elution Preparative chromatography.--The procedure totimes for each class are included in table I. All of the produce standards by preparative chromatographycomponents of the saturated hydrocarbon class elute as involved (1) the separation of the various fuel classes, (2)one peak as do those of the monocyclic aromatic class, evaporation of most of the eluent by using the Kuderna-Components of the other three classes may elute as Danish evaporator, and (3)removal of the last traces ofmultiple peaks. The components of the miscellaneous the eluent by using a rotating evaporator. The last steppolycyclic aromatics can include such diverse compounds was carried out only when a chromatogram indicates thatas acenaphthenes, acenaphthylenes, biphenyls, bibenzyls, the particular class of the standard is virtually free fromfluorene, and even a few dimethyl-substituted contamination by any other class. Several days ofnaphthalenes (table II). Spectra were obtained for the operator time were required to prepare a set of standardspredominate peak in this class in attempts to identify the for each fuel.major components in some fuels. Tentative identification The flow of the eluent, pentane, was adjusted to 20suggested the presence of dimethylnaphthalenes and ml/min. When the responses of the refractive index andbiphenyls in diesel fuel 2 as well as some unidentified the spectrophotometer set at 280 nm were constant, 1.0components. Even though identification of the ml of fuel was injected. Each fraction was collectedcomponents might improve the accuracy of the analysis, during the time the presence of a class was indicated bythe improvement would not be significant in comparison the detector response. Cross-contamination waswith the errors inherent in the method. Large errors can indicated when the response did not go to baselinebe expected when one set of standards or one set of between fractions. All components were generally elutedrefractive indices is used to quantitate HPLC data for in about 15 or 20 min. About ten 1-ml portions of eachmany types of fuel. Hence, greater efforts to identify fuel were used to obtain enough material to use asthese minor fuel components were not made. standards for monocyclics and fused dicyclics. All
3
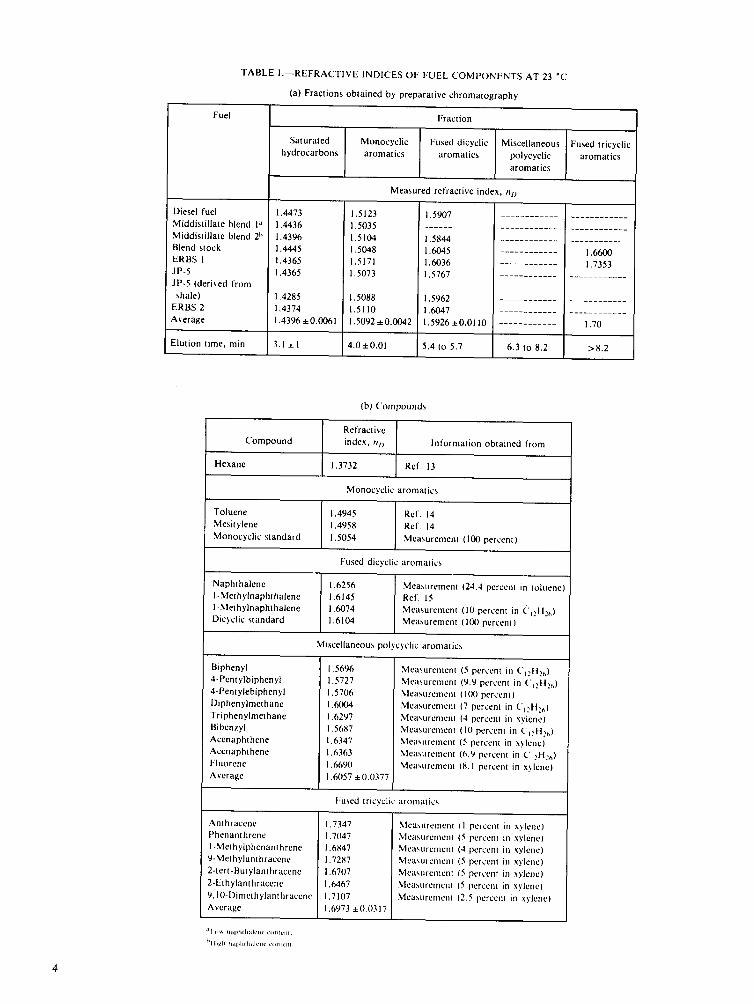
TABLE 1.--REFRACTIVE INDICES OF FUEL COMPONENTS AT 23 *C
(a) Fractions obtained by preparative chromatography
Fuel Fraction
Saturated Monocyclic Fused dicyclic Miscellaneous Fused tricyclichydrocarbons aromatics aromatics polycyclic aromatics
aromatics
Measured refractive index, nr_
Diesel fuel 1.4473 1.5123 1.5907Middistillate blend Ia 1.4436 1.5035Middistinate blend 2_' 1.4396 1.5104 1.5844
Blend stock 1.4445 1.5048 1.6045 1.6600ERBS 1 1.4365 1.5171 1.6036 1.7353JP-5 1.4365 1.5073 1.5767
JP-5 (derived fromshale} 1.4285 1.5088 1.5962
ERBS 2 1,4374 1.5110 1.6047
Average 1.4396::1:0.0061 1.5092±0.0042 1.5926±0.0110 1.70
Elution time, rain 3.1 + 1 4.0±0.01 5.4 to 5.7 6.3 to 8.2 >8.2
(b) Compounds
Refractive
Compound index, nt; Information obtained from
Hexane 1.3732 Ref. 13
Monocyclic aromatics
Toluene 1.4945 Ref. 14
Mesitylene 1.4958 Ref. 14Monocyclic standard 1.5054 Measurement (100 percent)
Fused dicyclic aromatics
Naphthalene 1.6256 Measurement (24.4 percent in toluene)l-Methylnaphthalene 1.6145 Ref. 15l-Methylnaphthalene 1.6074 Measurement (10 percent in ('_zH2DDicvclic standard 1.6104 Measurement (100 percent)
Miscellaneous polycyclic aromatics
Biphenyl t.5696 Measurement (5 percent in CIzH,_,I4-Pentylbiphenyl 1.5727 Measurement (9.9 percent in ('t.,Hzt_)4-Pentylebiphenyl 1.5706 Measurement (I(X) percent )
Diphenylmethane 1.6(K)4 Measurement (7 percent in (.L, H2_,)Triphenylmethane 1.6297 Measurement (4 percent in xylene)
Bibenzyl 1.5687 Measurement (10 percent in (.'t2H2t,)Acenaphthene 1.6347 Measurement (5 percent in xylene)Acenaphlbene 1.6363 Measurement (6.9 percent in (.'12Hz¢,)Fluorene 1.6690 Mea_,urement (8.1 percent in xylen¢)Average 1.6057 ±0,0377
Fused tricyclic aromatics
Anthracene 1.7347 Measurement (1 percent in xylene)Phenanthrene 1.7047 Measurement (5 percent in xylene)I-Methylphenanthrene 1.6847 Measurement (4 percent in xylene)9-Methylantbracene 1.7287 Measurement (5 percent in xylene)2-tert-Butylanthracene 1.67(17 Measurement (5 percent in xylene)2-Ethylanthracene 1.6467 Measurement (5 percent in xylcne)9,10-1)imethylanthraccnc 1.7107 Measurement (2.5 percent in xylene)
Average 1.6973:1:0.0317
a[ _1\_ii_lphlh;tlClll2 t;(Hllellt.
I_} Ilgh fl;q_lllh;tl_:llC t'lllllClll
4
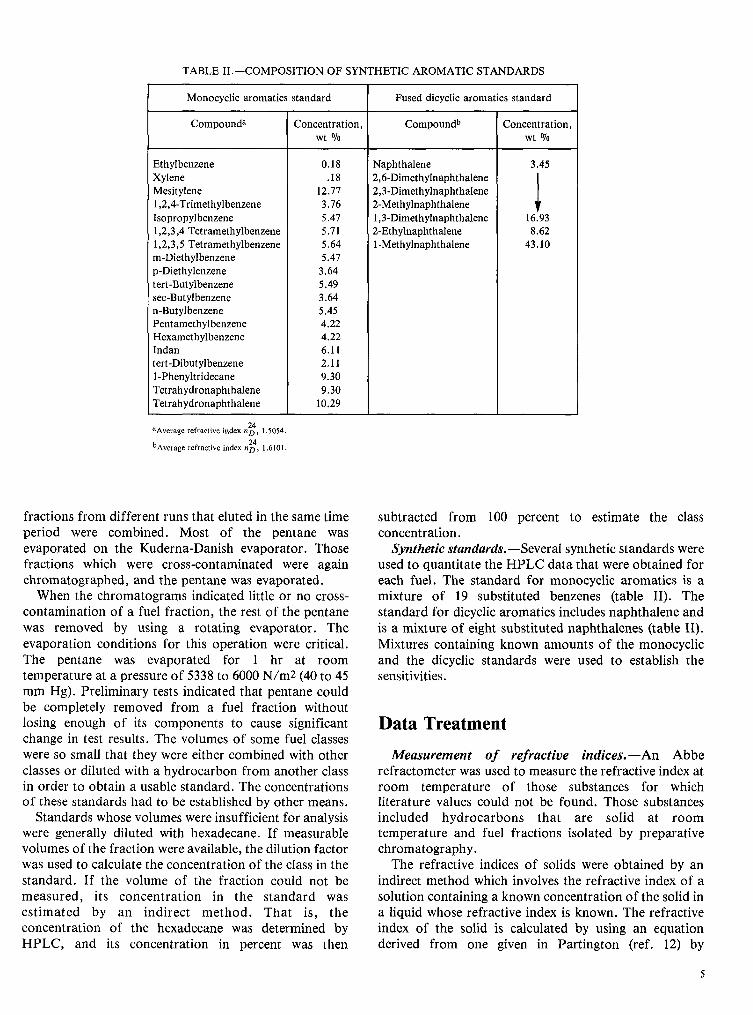
TABLE II.--COMPOSITION OF SYNTHETIC AROMATIC STANDARDS
Monocyclic aromatics standard Fused dicyclic aromatics standard
Compound a Concentration, Compound b Concentration,wt % wt %
Ethylbenzene 0,18 Naphthalene 3.45Xylene .18 2,6-DimethylnaphthaleneMesitylene 12.77 2,3 -Dimethylnaphthalene1,2,4-Trimethylbenzene 3.76 2-Methylnaphthalene !rIsopropylbenzene 5.47 1,3-Dimethylnaphthalene 16.93
1,2,3,4 Tetramethylbenzene 5.71 2-Ethylnaphthalene 8.621,2,3,5 Tetramethylbenzene 5,64 1-Methylnaphthalene 43.10m-Diethylbenzene 5.47p-Diethylenzene 3.64tert -Butylbenzene 5.49sec-Butylbenzene 3.64n-Butylbenzene 5.45Pentamethylbenzene 4.22Hexamethylbenzene 4.22Indan 6.11tert -Dibutylbenzene 2.111-Phenyltridecane 9.30
] Tetrahydronaphthalene 9,30Tetrahydronaphthalene 10,29
24aAverage refractive index n D , |.5054.
bAverage refractive index n_, 1.6101.
fractions from different runs that eluted in the same time subtracted from 100 percent to estimate the classperiod were combined. Most of the pentane was concentration.evaporated on the Kuderna-Danish evaporator. Those Synthetic standards.--Several synthetic standards werefractions which were cross-contaminated were again used to quantitate the HPLC data that were obtained forchromatographed, and the pentane was evaporated, each fuel. The standard for monocyclic aromatics is a
When the chromatograms indicated little or no cross- mixture of 19 substituted benzenes (table II). Thecontamination of a fuel fraction, the rest of the pentane standard for dicyclic aromatics includes naphthalene andwas removed by using a rotating evaporator. The is a mixture of eight substituted naphthalenes (table II).evaporation conditions for this operation were critical. Mixtures containing known amounts of the monocyclicThe pentane was evaporated for 1 hr at room and the dicyclic standards were used to establish thetemperature at a pressure of 5338 to 6000 N/m2 (40 to 45 sensitivities.mm Hg). Preliminary tests indicated that pentane couldbe completely removed from a fuel fraction withoutlosing enough of its components to cause significant Data Treatmentchange in test results. The volumes of some fuel classeswere so small that they were either combined with other Measurement of refractive indices.--An Abbeclasses or diluted with a hydrocarbon from another class refractometer was used to measure the refractive index atin order to obtain a usable standard. The concentrations room temperature of those substances for whichof these standards had to be established by other means, literature values could not be found. Those substances
Standards whose volumes were insufficient for analysis included hydrocarbons that are solid at roomwere generally diluted with hexadecane. If measurable temperature and fuel fractions isolated by preparativevolumes of the fraction were available, the dilution factor chromatography.was used to calculate the concentration of the class in the The refractive indices of solids were obtained by anstandard. If the volume of the fraction could not be indirect method which involves the refractive index of ameasured, its concentration in the standard was solution containing a known concentration of the solidinestimated by an indirect method. That is, the a liquidwhoserefractiveindexis known. The refractiveconcentration of the hexadecane was determined by index of the solid is calculated by using an equationHPLC, and its concentration in percent was then derived from one given in Partington (ref. 12) by
5
assuming that the solution is ideal. The derived equation due to two types of sensitivity fluctuation (ref. 16). Oneis type was short-term variations in flow rate, and the other
was day-to-day fluctuations due to unspecified causes.nm=nlfl +n2f2 (1) Corrections for both involved normalization of the data.
Errors due to fluctuations in flow rate were normalized
where nm is the measured refractive index, n 1and n2 are by adjusting the data to values they would have had at athe refractive indices of the two components of the uniform flow rate. Normalization for day-to-daysolution, and fl and f2 are their volume fractions, sensitivity fluctuations is needed only when data obtainedInasmuch as both concentrations and nm and n2 are on two different days are used in calculations.known, the value of n1can be calculated. Table I lists the Normalization in this case is done by adjusting the datavalues obtained for the refractive index of 17 solids obtained on one day to values they would have had if theobtained in this manner, as well as literature values for sensitivity were the same as that of the other day. Thesome fuel components (refs. 13 to 15). The accuracy of normalization equation isthese values is better for those solutions with higher solids
concentrations than for those with very low concentrations. DnIn the latter case the concentrations were limited by the R n= Ro (2)low solubility of the solid. In spite of this, the accuracy frothat was achieved is adequate for this method. Thisbecomes evident during the discussion of the where Ro and R n are the observed and normalizedrecommended method, responses respectively, DOis the observed elution time (or
The refractive indices of the aromatic classes are given sensitivity of a standard), and Dn is elution time (orin table I(a). Fuel fractions were produced by preparative sensitivity of the same standard) to which the responseschromatography, their refractive indices were measured, are to be normalized (ref. 16).and these values were used to calculate the refractive Quantitation of HPLC data.--The HPLC data whichindex of the class that was the major component of the were obtained for each fuel were quantitated by twofraction. In the event that the fraction contained only one methods by using several parameters for each method.class (as indicated by a chromatographic analysis) the The first method used several types of standards. Thevalue measured was assumed to be the refractive index of most accurate results were deemed to be those that were
that class. If more than one class was present, an iteration obtained by using standards produced by preparativeprocedure was used to estimate the refractive index of the chromatography of the fuel being analyzed (PCmajor class, standards). The other standards were synthetic standards
The iteration procedure involves the estimation of which were used with all the fuels. The second method ofapproximate concentrations of the classes in a fuel quantitation, which is new, uses refractive indices tofraction first by using the refractive index method and quantitate the HPLC data. It is discussed in the nextthen by using equation (1) to determine the refractive section.index of the major class of the fraction. This method for Derivation of an equation to quantitate HPLC datathe estimation of the concentration uses refractive indices using refractive indices.--The derivation of an equationto quantitate chromatographic data obtained with a to quantitate HPLC data using refractive indices is basedrefractive index detector. In the initial step of the on two equations. One is an identity that states that theiteration, the measured refractive index of each fuel sum of the concentrations (in percent) of all fuel
fraction is assumed to be that of its major component, components Cj is equal to 100 percent:Values of concentration obtained in this step are then
used in equation (1) to calculate a more accurate value of r.jCj = 100 (3)the refractive index for the major component in the fuelfraction. For this calculation the measured refractive The other equation is the relation between a response R iindex is used correctly as that of the fuel fraction. The of the refractive index detector for a substance and itsrefractive index for the major component obtained in this concentration Ci:way is then used to estimate more accurateconcentrations of the classes in the fuel fraction. Ri=kiCi=_oi(ni-ne)Ci (4)Repetitions of these calculations are then carried out byusing the calculated refractive index and concentration where k i and _Piare constants, and ni and ne are thevalues until the values are equal to those obtained in the refractive index of a fuel component and the eluent,previous calculation, respectively. Preliminary investigations indicated that the
Normalization of HPLC data.wDuring the course of accuracy would be improved by using only the data forthis research, methods were developed to reduce the error the aromatic classes. These investigations included the
determination of _oi for representative compounds of fused tricyclic compounds by including the appropriatevarious fuel classes and groups and quantitative values of,piin equation (6).calculations involving data for all fuel components as Similar considerations help us to understand why thewell as for only the aromatic classes. Inasmuch as a rapid accuracy of aromatic class determinations decreasesmethod is available to determine concentrations of when equation (7) also includes data for the saturatesaromatic classes, equation (1) is modified to group. This group is generally at least 70 percent of the
fuel. Hence, a small relative difference of 3 percent in the
C a = _iCi (5) value of _'i for saturated hydrocarbons would produce a2-percent absolute error in total aromatics. This issignificantly greater than the differences reported in table
where i refers only to the aromatic components. Dividing III (maximum 0.9 percent) between results for totala rearranged form of equation (4) by equation (5) gives aromatics using preparative chromatography standardsthe following: (considered to be the most accurate results) and those
using sulfuric acid prepared standards. Hence, a methodR i R i which uses data for the saturates group is expected to
Ci _oi(ni-ne ) _oi(ni-ne ) produce aromatic class concentrations that are more- - erroneous than those from the method which uses
Ri concentrations of the aromatics obtained by usingCa _iCi _i_i ( rli - ne) sulfuric acid prepared standards.
or (6)
R; Results and Discussion_i(ni--ne)
C i - C a
r.1 Ri Aromatics Class Analysis_i(rli-ne) Data which were used to evaluate various methods of
quantitation are presented in tables III and IV. Table IIIIf _Pihas the same value for all aromatics, then compares the concentrations obtained for the aromatic
group (i.e., total aromatic classes) by all methodsconsidered. These data were used to indicate those
Ri methods which are sufficiently accurate to merit furtherhi-ne consideration. The concentrations of the aromatic classes
C i- ---- Ca (7) obtained by these selected methods are presented in table_t Ri IV.
ni- ne Two types of results are presented in table III. They arethe sum of the concentrations of all fuel groups obtained
Calculations using this equation can generally be made in by using standards produced by preparativea few minutes, chromatography (PC standards) and the sum of the
Let us now consider the errors that are introduced by concentration of all aromatic classes in a fuel obtained bythe assumption that _oi's are equal. Experimental the quantitation methods being studied. The sums of theinvestigations indicate that values of _oi can vary as much concentrations of all fuel groups in each of seven fuelsas 5 percent for those monocyclic and fused dicyclic are presented in the first row of the table. All sums werearomatics that are apt to be present in middistillate fuels, within 1.6 percent of 100 percent. This strongly impliesThis suggests that the use of an average value of _oicould that the relative errors in these analyses were not morecause an uncertainty of 2 or 3 percent in the reported than 2 percent. It also suggests that the errors for theconcentration. The values of _oi for fused tricyclic aromatic class concentrations obtained by using PCaromatics can be as much as 17 percent higher and show standards should also be in the same range.greater variations than for the two classes mentioned Two quantitation methods produced results for thepreviously. Generally, the errors which are introduced by aromatic class concentrations which agreed with thethe assumption that the values of €'i for tricyclics are the results based on PC standards with an average differencesame as those of the other aromatic classes have of 0.7 percent. The methods included the use ofnegligible effect on the results for the other aromatic standards prepared by reaction of each fuel with sulfuricclasses because the concentrations of the fused tricyclic acid (H2SO4 standards) and the use of syntheticaromatics are rarely greater than 1 percent. Corrections standards. The maximum differences were 1.1 percent bycan be made for those fuels with higher concentrations of using H2SO4standards and 1.8 percent by using synthetic
TABLE III.--DATA FOR PRELIMINARY COMPARISON OF METHODS OF QUANTITATION
Method of quantitation Fuel
Diesel 2 Middistillate Middistillate Blend ERBS 1 JP-5 JP-5blend 1a blend 2h stock derived
fromshale
Sum of concentrations for all components, vol%
Preparative chromatography standards 99.60 100.5 100.3 98.4 101.1 99.3 98.7
Sum of concentrations for all aromatics classes, vol%
Preparative chromatography standards 20.0 30.2 28.3 77.4 28.1 18.5 21.3Synthetic standards c'd 19.9 28.4 27.7 74.1 29.0 18.7 20.4Toluene and naphthalene standards d 21.5 33.7 31.3 84.0 31.7 28.8 23.6Mesitylene and 1-methylnaphthalene 21.0 31.1 30.0 80.8 30.7 17.2 22.1standards d
Standards by fuel and HzSO4 reaction e 20.3 30.1 28.0 78.8 27.8 18.9 21.6Mass spectroscopy (ref. 17) 21.4 30.8 28.6 73.4 28.7 ........
f(76.0)
Fluorescence indicator analysis 17.8, 32.4 31,6 61.7 31.1 18.5 21.3FIA (ASTM-D1319) 21.0,
26.0
aLow naphthalene content.bHigh naphthalene content.CCompositions of synthetic standards can be found in table 1.dValues obtained by using preparative chromatography derived standards for miscettaneoas polycyclic and for fused tricyelic classes were included in these totals.eData from table V.
fCorrected value based on blendstock blend analyses (ref. 17}.
standards. Examination of the data suggests that the method yielded values which agreed with most of theaccuracy of the aromatic group concentrations obtained values obtained by using PC standards, syntheticby using H2SO 4 standards was better than indicated. In standards, the H2SO 4 method, and mass spectrometryevery case, the aromatic group concentrations obtained within the reproducibility limits specified for the FIAby using H2SO4 standards and those obtained by using method.PC standards differed in the same direction as the Table IV presents values for the concentrations off ourcorrection that is needed for the sum of the aromatic classes which were obtained by the three mostconcentrations of all fuel components to equal 100 accurate quantitation methods using the same HPLCpercent. The values reported in this table for aromatic data, as well as by other analytical techniques. The fourgroup concentrations obtained by using H2SO4standards classes are monocyclic aromatics (alkyl-substitutedare the corrected values listed in table V. The corrections benzenes), fused dicyclic aromatics (alkyl-substitutedare discussed in connection with that table, naphthalenes), miscellaneous polycyclic aromatics, and
It can be observed in table III that the aromatic group fused tricyclic aromatics (alkyl-substituted anthracenesconcentrations obtained by mass spectroscopy (MS) were and phenanthrenes). Miscellaneous polycyclic aromaticshigher than those obtained by using PC standards except are those compounds which elute after most of the fusedfor the blend stock. In this case, mass spectrometric dicyclics and before fused tricyclics. They includeresults for the aromatic group concentration were suspect acenaphthene, acenaphthylenes, fluorenes, some(ref. 17). Aromatic group concentrations obtained by methylated naphthalenes, biphenyls, diphenylmethane,using a toluene and naphthalene standard, a mesitylene etc. This class often appears as several peaks.and l-methylnaphthalene standard, and the FIA method Identification of the components responsible for any of(ASTM-D1319) are also presented in thistable. Aromatic these peaks would permit estimation of theirgroup values obtained by using these three quantitation concentrations. Two components of this class have beenmethods indicate that these methods produced aromatic tentatively identified in diesel fuel 2. They areclass results with large errors, so they were not considered methylnaphthalenes and substituted biphenyls. Otherfurther. It should be noted that the FIA (ASTM-D1319) components have not been identified. This class could be
TABLE IV.--CONCENTRATIONS OBTAINED FOR AROMATIC CLASSES BY THREE MOSTACCURATE QUANTITATION METHODS
Fuel Quantitation method
Ratio with standard sample Refractive index method using- Mass Ultravioletspectroscopy spectra
Preparative General ni values Average n i (ref. 17) ref. (4)chromatography synthetic obtained values
for fuel
Concentration, vol%
Monocyclic aromatics
Diesel 2 13.1 14.1 13.8 13.7 13.4Middistillate blend 1a 29.2 27.5 29.3 29.3 29.2Middistillate blend 2b 21.2 21.8 20.9 21.1 20.5Blending stock 54.9 53.8 55.6 54.4 46.5ERBS 1 15.0 16.5 15.0 15.1 14.0JP-5 17.6 17.1 16.9 17.0 ....JP-5 derived from shale 17.2 17.8 18.7 18.7 ....
Fused dicyclic aromatics
Diesel 2 5.6 4.2 5.0 5.1 5.0 7.0,10.6,12.6Middistillate blend 1a 1.0 .86 .95 .96 1.3 .7Middistillate blend 2b 5.9 5.1 5.6 5.4 5.5 6.3Blending stock 20.1 17.7 20.1 21.5 18.3 17.0ERBS 1 11.9 11.3 11.1 11.1 9.8 11.6JP-5 1.6 1.5 1.7 1.6 .... 1.7JP-5 derived from shale 2.8 2.4 2.8 2.7 .... 3.1
Miscellaneous polycyclic aromatics
Diesel 2 0.56 .... 0.91 0.91 3.01Middistillate blend la .003 .... .05 .06 .16Middistillate blend 2b 1.1 .... 1.0 1.0 1.96Blending stock 1.2 .... 1.2 1.2 6.29ERBS 1 .71 .... .71 .66 3.72JP-5 .07 .... .06 .08 ....JP-5 derived from shale .05 .... .05 .05 ....
Fused tricyclic aromatics
Diesel 2 0.83 .... 0.59 0.51 1.0Middistillate blend Ia 0 .... 0 0 .07Middistillate blend 2b .40 .... .49 .52 .70Blending stock 1.3 .... 1.5 1.4 2.4ERBS 1 .42 .... .64 .72 1.2JP-5 0 .... 0 0 ....JP-5 derived from shale .06 .... .004 .003 ....
aLow naphthalene content.
bHigh napthalene content.
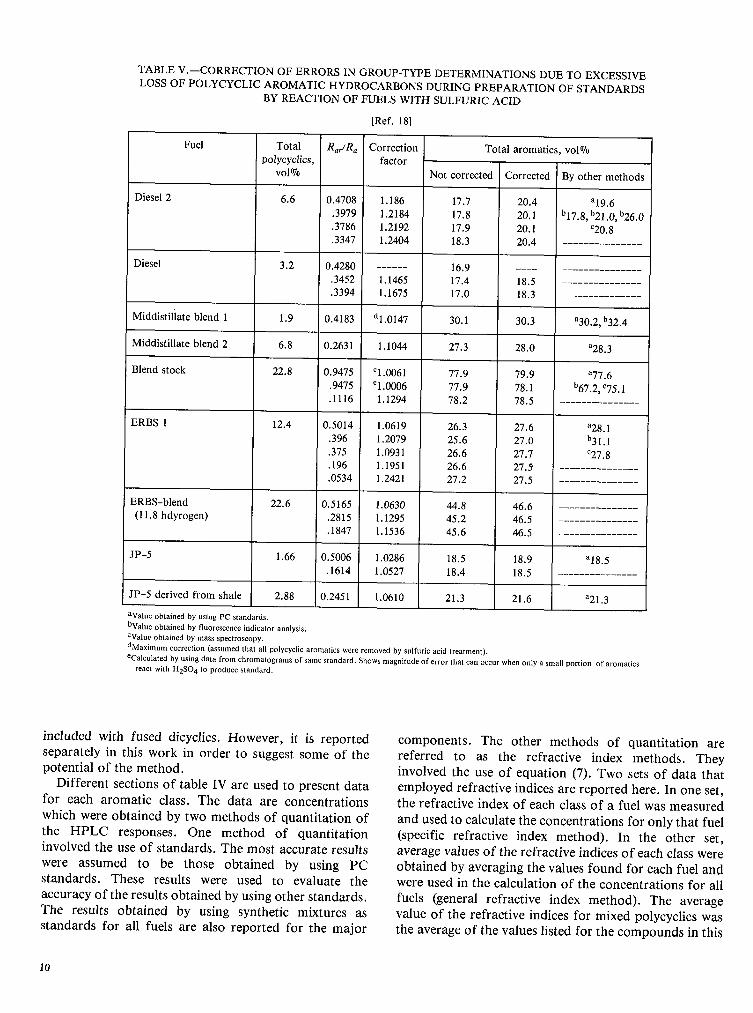
TABLE V.--CORRECTION OF ERRORS IN GROUP-TYPE DETERMINATIONS DUE TO EXCESSIVELOSS OF POLYCYCLIC AROMATIC HYDROCARBONS DURING PREPARATION OF STANDARDS
BY REACTION OF FUELS WITH SULFURIC ACID
[Ref. 18]
Fuel Total Rar/Ra Correction Total aromatics, vol%polycyclics, factor
vol% Not corrected Corrected By other methods
Diesel 2 6.6 0.4708 1.186 17.7 20.4 a19.6.3979 1.2184 17.8 20.1 b17.8, b21.0, b26.0.3786 1.2192 17.9 20.1 %0.8.3347 1.2404 18.3 20.4
Diesel 3.2 0.4280 16.9 .....3452 1.1465 17.4 18.5.3394 1.1675 17.0 18.3
Middistiliate blend 1 1.9 0.4183 dl.0147 30.1 30.3 a30.2, b32.4
Middistillate blend 2 6.8 0.2631 1.1044 27.3 28.0 a28.3
Blend stock 22.8 0.9475 el.0061 77.9 79.9 a77.6.9475 el .0006 77.9 78.1 b67.2, c75.1.1116 1.1294 78.2 78.5
ERBS 1 12.4 0.5014 1.0619 26.3 27.6 a28.1.396 1.2079 25.6 27.0 b31.1.375 1.0931 26.6 27.7 c27.8.196 1.1951 26.6 27.5.0534 1.2421 27.2 27.5
ERBS-blend 22.6 0.5165 1.0630 44.8 46.6(11.8 hdyrogen) .2815 1.1295 45.2 46.5
.1847 1.1536 45.6 46.5
JP-5 1.66 0.5006 1.0286 18.5 18.9 a18.5.1614 1.0527 18.4 18.5
JP-5 derived from shale 2.88 0.2451 1.0610 21.3 21.6 a21.3
aVa|ue obtained by using PC standards.bValue obtained by fluorescence indicator analysis.CValue obtained by mass spectroscopy.dMaximum correction (assumed that all polycyclic aromatics were removed by sulfuric acid treatment).eCalculated by using data from chromatograms of same standard. Shows magnitude of error that can occur when only a small portion of aromatics
react with H2SO4 to produce standard.
included with fused dicyclics. However, it is reported components. The other methods of quantitation areseparately in this work in order to suggest some of the referred to as the refractive index methods. Theypotential of the method, involved the use of equation (7). Two sets of data that
Different sections of table IV are used to present data employed refractive indices are reported here. In one set,for each aromatic class. The data are concentrations the refractive index of each class of a fuel was measuredwhich were obtained by two methods of quantitation of and used to calculate the concentrations for only that fuelthe HPLC responses. One method of quantitation (specific refractive index method). In the other set,involved the use of standards. The most accurate results average values of the refractive indices of each class werewere assumed to be those obtained by using PC obtained by averagingthevalues found for each fuel andstandards. These results were used to evaluate the were used in the calculation of the concentrations for allaccuracy of the results obtained by using other standards, fuels (general refractive index method). The averageThe results obtained by using synthetic mixtures as value of the refractive indices for mixed polycyclics wasstandards for all fuels are also reported for the major the average of the values listed for the compounds in this
10
category in table I(b). Published results from two other none of the saturates group are removed in this method.sources are included in table IV. They are mass The equation to quantitate the HPLC data isspectrometry (ref. 17)and ultraviolet spectroscopy (ref.
4). The latter was developedto estimatethe fused dicyclic ka Ra raromatic concentrations only. Other refractive index 1values were used to quantitate these HPLC data. They kar Ramerely indicated that the refractive indices could be 1-F a= (8)
Rsr ka Ratvaried by ±0.03 for both the miscellaneouspolycyclicand the fused tricyclic classes without causing any Rs kar Rasignificant change in the results.
The concentrationsof the monocyclicaromaticsand of where F, R, and k are the concentration (volumethe fused dicyclics(table IV) indicated that the general fraction), the response, and the sensitivity of therefractive index method could produce more accurate substances indicated by the subscripts, respectively.Theresults for all fuels than the method that used one set of subscripts a, ar, s, and sr indicate that the value is thatsynthetic standards for the same fuels. A change in the obtained for the aromatic or saturates groups before orcomposition of these standards could improve the after reaction of the fuel with H2SO 4, respectively.accuracy of the method but not the large variation in Heretofore, it has been assumed that ka=kar (i.e., theresults. The data also confirmed the viewthat the general aromatic fraction does not vary in composition as therefractive index method was less accurate than the fuel is reacted with sulfuric acid). Aromatic group-typespecificrefractive index method. The maximum relative results obtained by using this assumption generallyerror for both refractive index methods was 9 percent for agreed with FIA (ASTMD1319)valueswithin the ASTMmonocyclicaromatics. For fused dicyclics,the maximum limits. However, when these data were correlated withrelative error was 10 percent for the general refractive resultsobtained by usingPC standards, the differencesinindex method and 7.3 percent for the specificrefractive the results from these two methods weregreater for thoseindex method, fuels with relatively large polycyclic aromatic
The data for miscellaneouspolycyclicaromatics and concentrations. Since polycyclic aromatics react withfor fused tricyclic aromatics (table IV) include values sulfuric acid more rapidly than monocyclic aromaticsobtained by usingPC standards, the two refractive index (ref. 19),the concentration of polycyclicsin the aromaticmethods, and mass spectrometry, group would be expectedto decreasewhenthe fuel reacts
Results obtained by the use of synthetic mixtures as with sulfuric acid. The refractive index of this groupstandards for these two classes are not included. All the would also decrease because the refractive indices ofconcentrations of both classeswere within the range of 0 polycyclic aromatic compounds are generally greaterto 1.55 percent. Hence, the methodology for these than those of monocyclicaromatic compounds (refs. 12substances did not warrant a detailed study at this time. to 14).Therefore, the assumptionthat ka = kar is not true,The data were similar for both classes; that is, the and the errors resulting from its useshould be evaluatedaccuracyof both refractiveindex methods wereabout the for these fuels.same. However, the general refractive index method This was done for this investigation by generatingcaused slightly greater error than did the specific correction factors for each of the fuels. Correctionrefractive index method. The maximum absolute error factors are ratios of the sensitivities of the aromaticwas about 0.3 percent for either of these classes. The fraction before reaction with sulfuric acid to those aftererrors for these minor classes appeared to be associated reaction. The refractive index ni of the ith substance isprimarily with the errors in the concentrations of the two related to its sensitivitywhena refractiveindex detector ismajor aromatic classes. This was supported by the used in the followingmanner:observation that relatively large variations in therefractive indices used in the calculation of ki=_oi(ni-ne) (9)concentrations of the minor classes caused only slightvariation in the results. Apparently greater accuracy in where _oi is a constant related to the ith substance (see eq.the results for the minor classescould be achievedby the (4)). Hence we may writeuse of a synthetic standard.
Group-Type Analysis Correctionfactor- kar - _°a(na-ne) (10)k a _Oar(n ar - n e)
The concentration of the aromatic group in a fuel canreadilybe determinedby HPLC usingan H2SO 4 standard The correction factors listedin table V werecalculated by(ref. 18). In general, over half of the aromatic group and usingthis equation and assuming_oa= _Par.The values for
11
na and narwere calculated by using methods described in deduced from the fact that the two correction factors forthis report. That is, the concentrations of the four classes this treatment were almost identical (1.0061 and 1.0006).in the aromatic group were estimated for both the Improved accuracy due to these corrections could beunreacted and the reacted fuel by using the average observed with diesel fuel 2, middistillate blend 2, andrefractive index that was found for each class and their with ERBS 1. Of the fuels with high polycyclic aromaticHPLC response in equation (7). These concentrations concentrations, only the blend stock showed a decrease inand refractive indices are used in the following equation: accuracy caused by this type of correction. In this case,
both the corrected and the uncorrected results were
_iCini higher than the value obtained by using a PC standardha= i2iC i (11) which was assumed to be correct. Only 98.4 percent ofthe blend stock was accounted for upon adding the values
for all of its components obtained by using PC standards.in which the summations include all aromatic Hence, the actual value for the total aromaticcomponents. This equation is the general form of concentration could be greater than the value obtained byequation (1). using this method by more than 1 percent. In the event
Table V presents data concerning the correction of that it was only 0.8 percent greater, these data would beerrors. The first two columns list the fuel and the total consistent with all the other data obtained for fuels with a
aromatic polycyclic concentrations (i.e., all aromatic high polycyclic concentration. That is, this type ofclasses except monocyclics). The next two columns list correction would also improve the accuracy for this fuel.the ratio of the responses for the total aromatics in thereacted fuel and the unreacted fuel and the correction
factor obtained for that standard. The ratio of responses
is an approximation of the fraction of the original Concluding Remarksaromatic concentration that remains after reaction. The
next two columns present the uncorrected and corrected This study has showed that HPLC can be used tovalues for the aromatic concentration found by using an estimate the concentrations of four aromatic classes inH2SO4standard. The last column presents values for this middistillate fuels in about 15 or 20 min. The classesconcentration obtained by other methods. The value for were:the aromatic group obtained by adding theconcentrations of the aromatic classes found by using PC (1) Monocyclic aromatics (alkyl-substituted benzenes)standards is listed first in this column. (2) Fused dicyclic aromatics (alkyl-substituted
The data presented in table V indicated that these naphthalenes)corrections could improve the precision and accuracy of (3) Miscellaneous polycyclic aromatics (specificaromatic group determinations. They also suggested that dimethylnaphthalenes, fluorenes, acenaphthenes,these corrections were trivial for those fuels with low biphenyls, etc.)
(4) Fused tricyclic aromatics (alkyl-substitutedpolycyclic aromatic concentration. This suggestion wasanthracenes and phenanthrenes)
easily confirmed by the data for middistillate blend 1 andthe two JP-5 fuels. Data for the JP-5 fuel derived from In the rapid HPLC method developed, theshale indicated that the corrected result was not as concentration of each aromatic class, Ci, was calculatedaccurate as the uncorrected value. This conclusion might by using the following equation:be wrong because the value assumed to be correct was
very probably erroneously low. This possibility was Risuggested by the fact that only 98.7 percent of the fuelcould be accounted for by the results obtained by using ni- nePC standards. Ci= -- Ca
The improved precision resulting from these r_. Ricorrections was observed in table V for diesel 2, ERBS 1, tni- neand ERBS blend (11.8 percent of hydrogen). Theconcentrations of the polycyclic aromatics in these fuels where R i is the response of the refractive index detectorwere all greater than 6.5 percent. The data for blend due to the ith class; ni and ne are the refractive indices ofstock which contains more than 20 percent polycyclic the ith class and the eluent, respectively; and Ca is thearomatics should not be included in this consideration, concentration of the total aromatic group.The decrease in the aromatic concentration of only 5 Average values of the refractive index for each classpercent resulting from a mild sulfuric acid reaction were used in the calculations for all the fuels that werecaused the corrections to be erroneous. This could be tested.
12
The precision of the results was generally very good, 5. Newman, F.M.; and Greenberg, M.M.: Determinationofbut the accuracy fluctuated because the sensitivities Aromaticity of Fuels and Lubricant Basestocks by Ultravioletvaried from fuel to fuel. The relative errors determined Spectroscopy.AFLRL-103,ArmyFuels and Lubricants Research
Laboratory, 1980, (AD-A086654.)for the refractive index ranged from 0.3 to 8.8 percent for 6. Warner, J.S.; Danison,T.H.; and McNulty, J.S.: Analyticalmonocyclic aromatics and 0.6 to 10.1 percent for fused TechniquesforAromatic Components in Aircraft Fuels. AFWAL-
dicyclics. The absolute errors for the miscellaneous TR-82-2015, Air Force WrightAeronauticalLaboratories,1982
polycyclics and the fused tricyclics were all less than 0.3 (AD-Al18838.)7. Wise, S.A., et al.: Chemically-Bonded Aminosilane Stationarypercent. Significant improvements in accuracy could be Phase for the High Performance Liquid Chromatographic
expected by limiting the method to a specific fuel type. Separation of Polynuclear Aromatic Compounds. Anal. Chem.,Hence, the method could then be considered to be a vol.49,no. 14,Dec. 1977, pp. 2306-2310.determination rather than an estimation. 8. Matsunaga, Atsushi: Separation of Aromatic and Polar
This work also indicated that polycyclic aromatics Compounds in Fossil Fuel Liquids by Liquid Chromatography.Anal. Chem., vol. 55, no. 8, July 1983, pp. 1375-1379.
could adversely affect with group-type analyses in which 9. Dark, W.A.:ShaleOil Separation by High-PerformanceLiquid-the fuel was reacted with sulfuric acid to produce Chromatography.JournalofLiquidChromatography,vol.6, no.standards. The resulting changes in concentration of the 2, Feb. 1983,pp.325-342.
components of the aromatic fraction was employed to 10.Dark, W.A.: Crude Oil HydrocarbonGroup Separationevaluate correction factors. The use of these factors Quantitation. Journal of Liquid Chromatography, vol. 5, no. 9,
Sept. 1982, pp. 1645-1652.improved both the precision and the accuracy of group- 11. Sink,C.W., Hardy,D.R., and Hazlett,R.N.: CompoundClasstype analysis. Quantitation of JP-5 Jet Fuels by High Performance Liquid
Chromatography/Differential Refractive Index Detection. NRLMR-5407, Naval Research Lab, 1984.
12. Partington, James Riddick: An Advanced Treatise on PhysicalChemistry, Vol. IV, Physico-Chemical Optics. Longmans Green,
LewisResearch Center New York, 1953.National Aeronautics and Space Administration 13. Egloff, Gustav: Physical Constants of Hydrocarbons, Vol. V,
Cleveland, Ohio, April 22, 1985 Paraffins, Olefins, Acetylenes, and Other AliphaticHydrocarbons, ACS Monograph Series No. 78, Rheinhold, 1953.
14. Egloff, Gustav.: Physical Constants of Hydrocarbons, Vol. III,Mononuclear Aromatic Compounds, ACS Monograph Series No.78, Rheinhold, 1946.
References 15. Egloff, Gustav.: Physical Constants of Hydrocarbons, Vol. IV,Polynuclear Aromatic Compounds, ACS Monograph Series No.78, Rheinhold, 1947.
1. Hydrocarbon Types in Middle Distillates by Mass Spectrometry. 16. Otterson, Dumas A.: Correction of Errors in HPLC AnalysesAm. Soc. Test. Mater. Stand. D-2425-83, 1983. Caused by Sensitivity Fluctuations. LC/Liquid Chromatography
2. Clutter, D.R., et al: Nuclear Magnetic Resonance Spectrometry of HPLC Magazine, vol. II, no. 9, 1984, pp. 694, 696.Petroleum Fractions. Anal. Chem., vol. 44, no. 8, July 1972, pp. 17. Rosfjord, T.J.: Aviation Fuel Property Effects on Combustion.1395-1405. (UTRC-884-915908-29, United Technologies Research Center;
3. Netzel, D.A.; and Hunter, P.M.: Hydrocarbon Type Analysis of NASA Contract NAS3-23167.) NASA CR-168334, 1984.Jet Fuels by _H and 13CNMR. DOE/LETC/RI-81-1, U.S. Dept. 18. Otterson, Dumas A., and Seng, Gary T.: Group-Typeof Energy, 1981. Hydrocarbon Standards for High-Performance Liquid
4. Kim, Walter S.; and Seng, Gary T.: Evaluation of Ultraviolet Chromatographic Analysis of Middistillate Fuels. NASASpectrophotometry for Simultaneous Analysis of Alkylbenzenes, TP-2317, 1984.Alkylnaphthalenes, Alkylanthracenes/Phenanthrenes and Total 19. Gilbert, Everett Eddy: Sulfonation and Related Reactions.Aromatics in Mid-distillate Fuels. NASA TM-83032, 1982. Interscience Publishers, New York, 1977, pp. 87, 91.
13
1. Report No. 2. Government Accession No. 3. Reclpient's Catalog No.
NASATP-24954. Title and Subtitle 5. Report Date
July 1985Rapid Estimation of Concentration of AromaticCl asses i n Middi sti I I ate Fuels by High-Performance 6 Performing Organization CodeLiquid Chromatography 505-31-42
7. Author(s) 8. Performing Organization Report No.
DumasA. Otterson and Gary T. Seng E-237610. Work Unit No.
9. Performing Organization Name and Address11. Contract or Grant No.
National Aeronautics and Space AdministrationLewis Research CenterCleveland, Ohio 44135 13.TypeofReportandPerlodCovered
12. Sponsoring Agency Name and Address Techni cal Paper
National Aeronautics and Space Admini stration 14Sponsoring Agency CodeWashington, D.C. 20546
15. Supplementary Notes
16. Abstract
An HPLCmethod to estimate four aromatic classes in middistillate fuels ispresented. Average refractive indices are used in a correlation to obtain theconcentrations of each of the aromatic classes from HPLCdata. The aromaticclass concentrations can be obtained in about 15 min when the concentration ofthe aromatic group is known. Seven fuels with a wide range of compositions wereused to test the method. Relative errors in the concentration o_ the two majoraromatic classes were not over lO percent. Absolute errors of the minor classeswere all less than 0.3 percent. The data show that errors in group-type anal-yses using sulfuric acid derived standards are greater for fuels containing highconcentrations of polycyclic aromatics. Corrections are baseo on the change inrefractive index of the aromatic fraction which can occur when sulfuric acid andthe fuel react. These corrections improved both the precision and the accuracyof the group-type results.
17. Key Words (Suggested by Author(s)) 18. Distribution Statement
Fuel analysis; High-performance |iquid Unclassified - un]imiteochromatography; Fuel characterization; STARCategory 28Fuel aromatic class; Group-type analysis
19. Security Classif. (of this report) 20. Security Classif. (of this page) 21. No. of pages 22, Price
Unclassified Unclassified 15 A02I
For sale by the National Technical Information Service, Springfield, Virginia 22161 NASA-Langley, 1985

National Aeronautics andSpaceAdministration
BULK RATEWashington, D.C. POSTAGE& FEESPAID20546 NASAWashington,DCOfficial Business PermitNo, G-27Penalty for Private Use, $300
__I_A POSTMASTER: If Undeliverable (Section 158Postal Manual) Do Not Return


![What is HPLC? High Performance Liquid Chromatography High Pressure Liquid Chromatography (usually true] Hewlett Packard Liquid Chromatography (a joke)](https://img.pdfslide.us/doc/110x75/56649c855503460f9493c784/what-is-hplc-high-performance-liquid-chromatography-high-pressure-liquid-chromatography.jpg)