Embed Size (px)
Citation preview
SIBERIAN COAL ENERGY COMPANY
Investor presentationJanuary 2017
Fuelling industryPowering the world
Disclaimer
This presentation has been prepared by SUEK Group (the “Company”). The information in this presentation is provided in a summary form and does not purport to be complete.
This presentation contains certain “forward-looking statements”. All statements, other than statements of historical fact, are forward-looking statements that involve risks and uncertainties. There can be no assurances that such statements will prove accurate and actual results and future events could differ materially from those anticipated in such statements. Such information contained herein represents management’s best judgement as of the date hereof based on information currently available. The Company does not assume the obligation to update any forward-looking statement.
This presentation does not constitute or form part of, and should not be construed as, an offer, invitation or recommendation with respect to any of the facilities of the Company, or an offer, invitation or recommendation to sell or issue, or the solicitation of an offer to buy or acquire, the facilities or any of the securities of the Company in any jurisdiction or an inducement to enter into any investment activity. No part of this presentation, nor the fact of its distribution, should form the basis of, or be relied upon in connection with, any contract or commitment or investment decision whatsoever.
The information and opinions contained in this presentation are provided as at the date of this presentation and are subject to change. This presentation contains information derived from public sources that have not been independently verified.
1
Content
2
CompanyOverview
OurStrategy
Key PerformanceHighlights
ProductionAssets
Logistics
KeyOperational Figures
CoalMarket Overview andOutlook
GlobalCash Cost Curve
SUEK Sales
KeyFinancial Figures
DebtSnapshot
CorporateGovernance
3
4
5
6
7
8
9
10
11-12
13
14
15
Contacts 16
29.2
30.1
37.5
38.7
40.4
44.4
46.9
55.0
71.7
110.3
51.9
Kideco
Rio Tinto
Banpu
Peabody
Adaro
Bumi
SUEK
Anglo American
BHP Billiton
Glencore
Company Overview
3
№1
№4
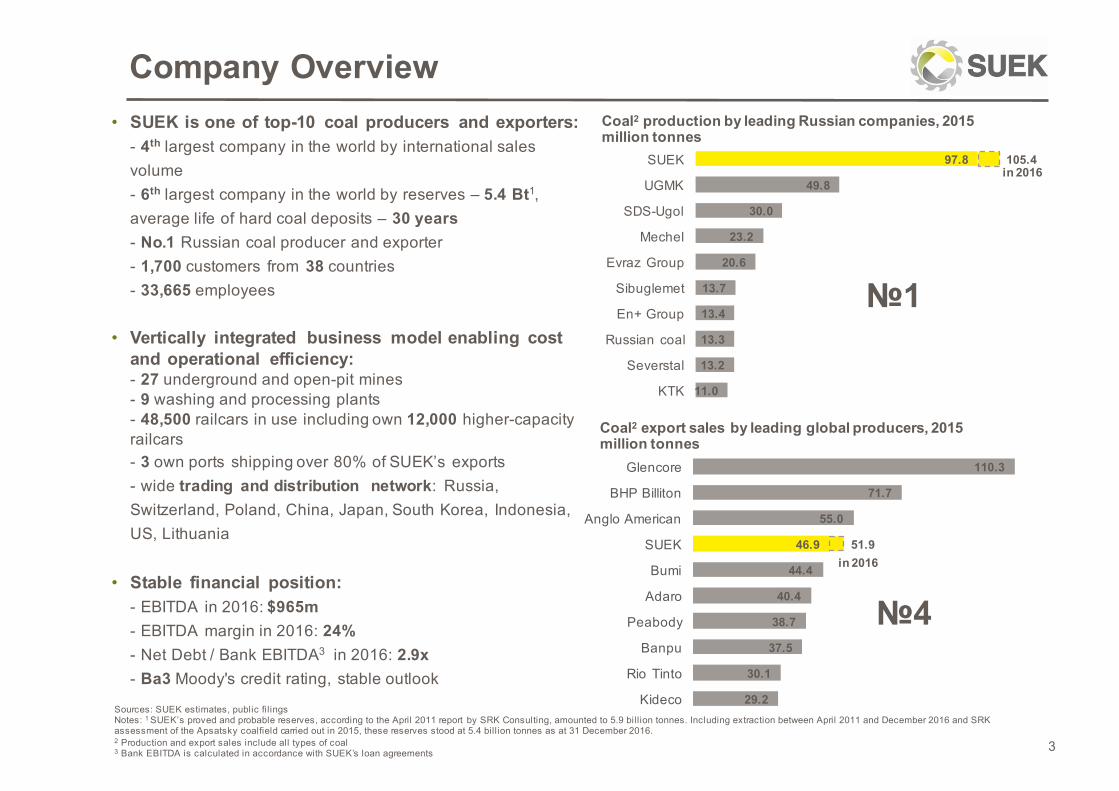
• SUEK is one of top-10 coal producers and exporters:- 4th largest company in the world by international sales volume- 6th largest company in the world by reserves – 5.4 Bt1, average life of hard coal deposits – 30 years - No.1 Russian coal producer and exporter- 1,700 customers from 38 countries- 33,665 employees
• Vertically integrated business model enabling cost and operational efficiency:- 27 underground and open-pit mines- 9 washing and processing plants- 48,500 railcars in use including own 12,000 higher-capacity railcars- 3 own ports shipping over 80% of SUEK’s exports- wide trading and distribution network: Russia, Switzerland, Poland, China, Japan, South Korea, Indonesia, US, Lithuania
• Stable financial position:- EBITDA in 2016: $965m- EBITDA margin in 2016: 24%- Net Debt / Bank EBITDA3 in 2016: 2.9x- Ba3 Moody's credit rating, stable outlook
Сoal2 production by leading Russian companies, 2015million tonnes
Coal2 export sales by leading global producers, 2015million tonnes
11.0
13.2
13.3
13.4
13.7
20.6
23.2
30.0
49.8
97.8 105.4
KTK
Severstal
Russian coal
En+ Group
Sibuglemet
Evraz Group
Mechel
SDS-Ugol
UGMK
SUEKin 2016
in 2016
Sources: SUEK estimates, public filingsNotes: 1 SUEK’s proved and probable reserves, according to the April 2011 report by SRK Consulting, amounted to 5.9 billion tonnes. Including extraction between April 2011 and December 2016 and SRK assessment of the Apsatsky coalfield carried out in 2015, these reserves stood at 5.4 billion tonnes as at 31 December 2016.2 Production and export sales include all types of coal3 Bank EBITDA is calculated in accordance with SUEK’s loan agreements
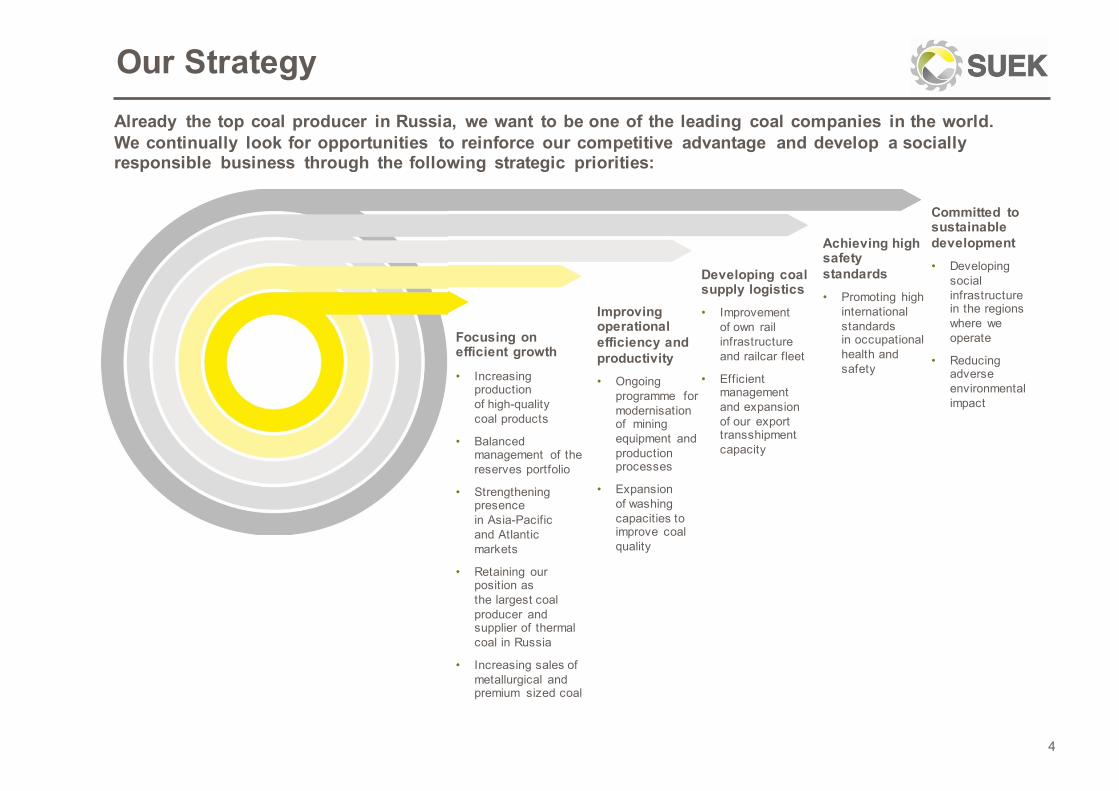
Our StrategyAlready the top coal producer in Russia, we want to be one of the leading coal companies in the world. We continually look for opportunities to reinforce our competitive advantage and develop a socially responsible business through the following strategic priorities:
4
Focusing on efficient growth
• Increasing production of high-quality coal products
• Balanced management of the reserves portfolio
• Strengthening presencein Asia-Pacificand Atlantic markets
• Retaining our position as the largest coal producer and supplier of thermal coal in Russia
• Increasing sales of metallurgical and premium sized coal
Committed to sustainable development • Developing
social infrastructure in the regions where we operate
• Reducing adverse environmental impact
Improving operational efficiency and productivity • Ongoing
programme for modernisationof mining equipment and production processes
• Expansion of washing capacities to improve coal quality
Developing coal supply logistics • Improvement
of own rail infrastructure and railcar fleet
• Efficient management and expansion of our export transshipment capacity
Achieving high safety standards • Promoting high
international standards in occupational health and safety
5
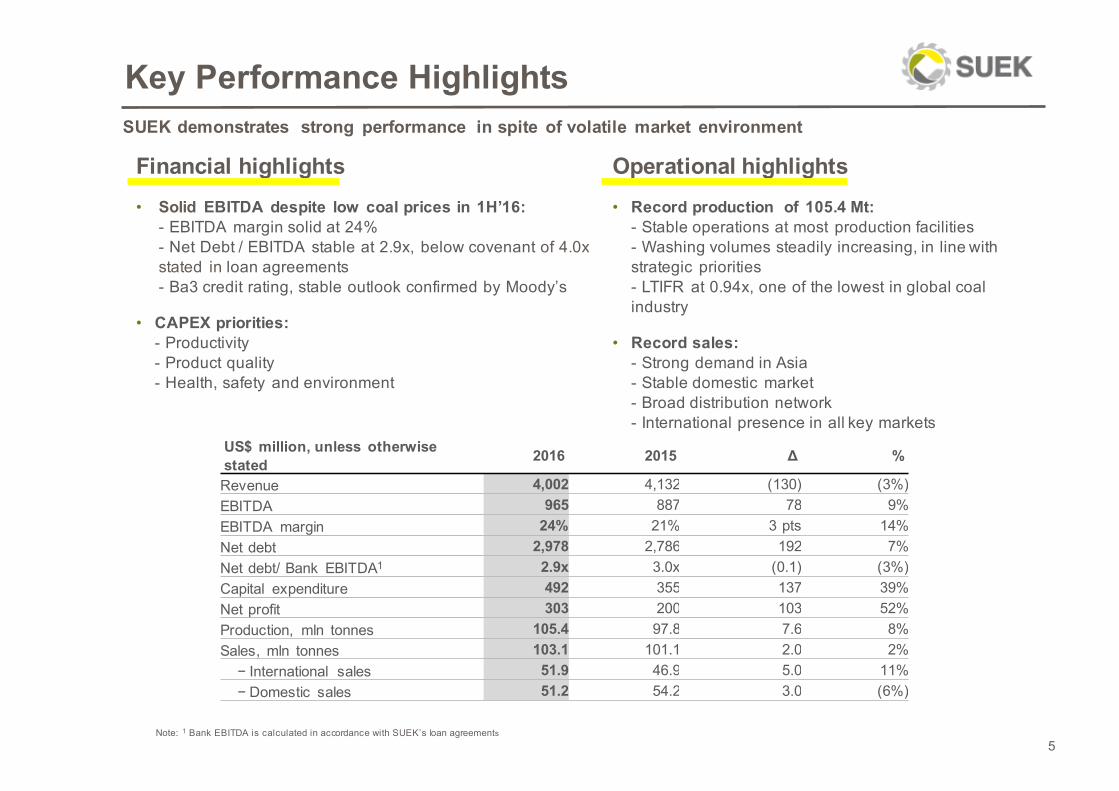
Financial highlights• Solid EBITDA despite low coal prices in 1H’16:
- EBITDA margin solid at 24%- Net Debt / EBITDA stable at 2.9x, below covenant of 4.0x stated in loan agreements- Ba3 credit rating, stable outlook confirmed by Moody’s
• CAPEX priorities:- Productivity- Product quality- Health, safety and environment
Key Performance Highlights
US$ million, unless otherwise stated 2016 2015 Δ %
Revenue 4,002 4,132 (130) (3%)EBITDA 965 887 78 9%EBITDA margin 24% 21% 3 pts 14%Net debt 2,978 2,786 192 7%Net debt/ Bank EBITDA1 2.9x 3.0x (0.1) (3%)Capital expenditure 492 355 137 39%Net profit 303 200 103 52%Production, mln tonnes 105.4 97.8 7.6 8%Sales, mln tonnes 103.1 101.1 2.0 2%
− International sales 51.9 46.9 5.0 11%− Domestic sales 51.2 54.2 3.0 (6%)
Operational highlights• Record production of 105.4 Mt:
- Stable operations at most production facilities- Washing volumes steadily increasing, in line with strategic priorities- LTIFR at 0.94x, one of the lowest in global coal industry
• Record sales:- Strong demand in Asia - Stable domestic market - Broad distribution network- International presence in all key markets
SUEK demonstrates strong performance in spite of volatile market environment
Note: 1 Bank EBITDA is calculated in accordance with SUEK’s loan agreements
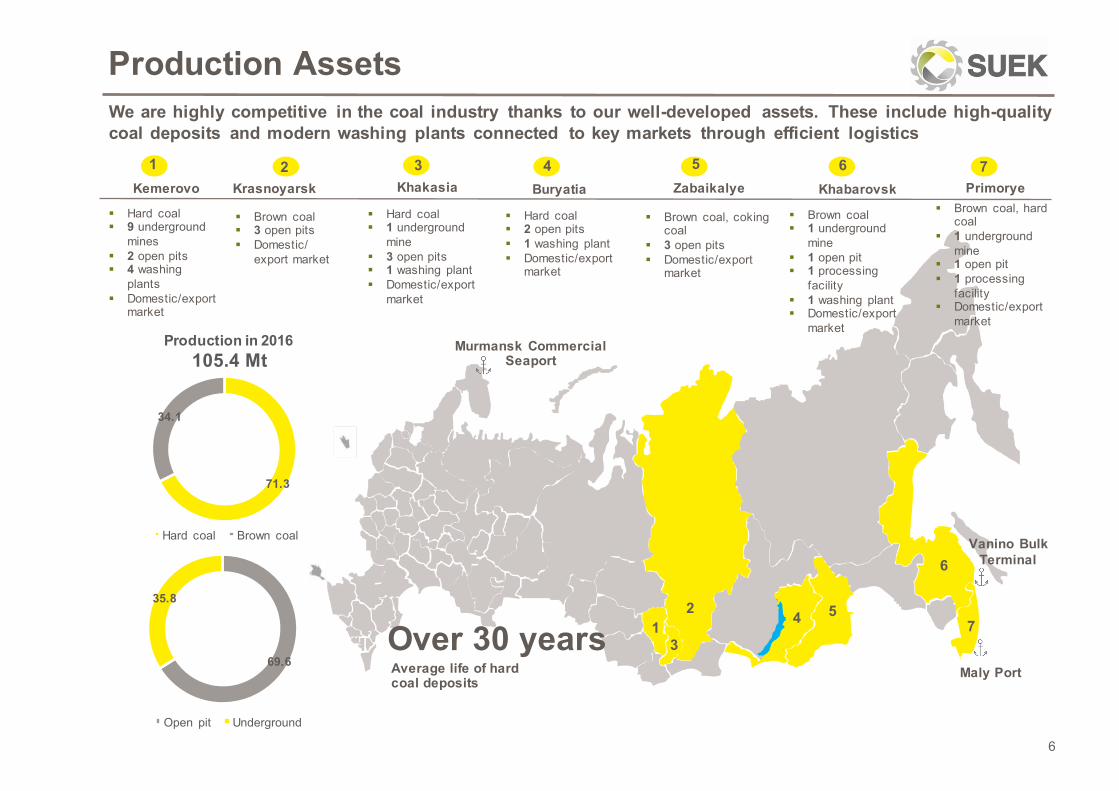
§ Brown coal§ 1 underground
mine§ 1 open pit§ 1 processing
facility§ 1 washing plant§ Domestic/export
market
1
Production Assets
6
§ Hard coal§ 9 underground
mines§ 2 open pits§ 4 washing
plants§ Domestic/export
market
Kemerovo
§ Brown coal§ 3 open pits§ Domestic/
export market
PrimoryeKhabarovskZabaikalyeKhakasiaKrasnoyarsk Buryatia
§ Hard coal§ 1 underground
mine§ 3 open pits§ 1 washing plant§ Domestic/export
market
§ Hard coal§ 2 open pits§ 1 washing plant§ Domestic/export
market
§ Brown coal, coking coal
§ 3 open pits § Domestic/export
market
Murmansk Commercial Seaport
Vanino BulkTerminal
Maly Port
Production in 2016105.4 Mt
We are highly competitive in the coal industry thanks to our well-developed assets. These include high-quality coal deposits and modern washing plants connected to key markets through efficient logistics
21
2
§ Brown coal, hard coal
§ 1 underground mine
§ 1 open pit§ 1 processing
facility§ Domestic/export
market
76543
3
4 5
6
7
Average life of hard coal deposits
Over 30 years
71.3
34.1
Hard coal Brown coal
69.6
35.8
Open pit Underground
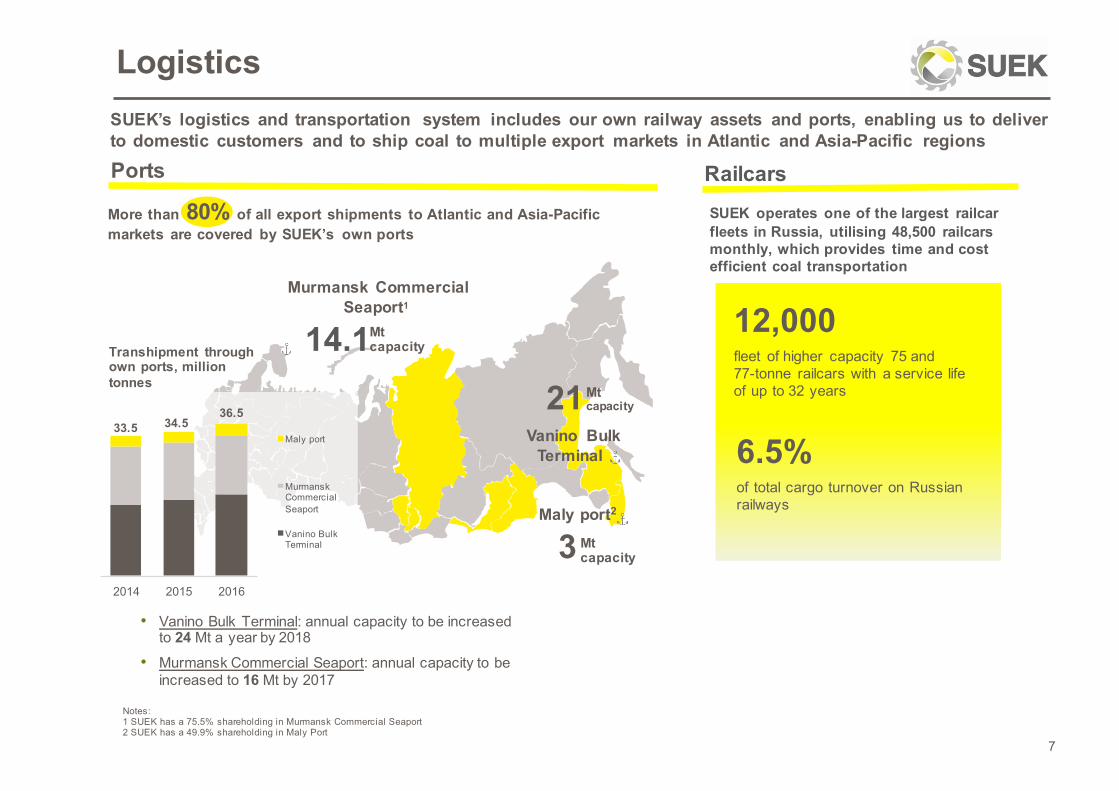
More than 80% of all export shipments to Atlantic and Asia-Pacific markets are covered by SUEK’s own ports
LogisticsSUEK’s logistics and transportation system includes our own railway assets and ports, enabling us to deliver to domestic customers and to ship coal to multiple export markets in Atlantic and Asia-Pacific regions
7
RailcarsPorts
Murmansk Commercial Seaport1
3 Mtcapacity
Notes:1 SUEK has a 75.5% shareholding in Murmansk Commercial Seaport2 SUEK has a 49.9% shareholding in Maly Port
12,000fleet of higher capacity 75 and 77-tonne railcars with a service life of up to 32 years
SUEK operates one of the largest railcar fleets in Russia, utilising 48,500 railcars monthly, which provides time and cost efficient coal transportation
6.5%of total cargo turnover on Russian railways
Vanino BulkTerminal
Maly port2
21Mtcapacity
• Vanino Bulk Terminal: annual capacity to be increased to 24 Mt a year by 2018
• Murmansk Commercial Seaport: annual capacity to be increased to 16 Mt by 2017
Transhipment through own ports, million tonnes
Mtcapacity
2014 2015 2016
Maly port
Murmansk Commercial Seaport
Vanino Bulk Terminal
33.5 34.536.5
14.1
2012
2013
2014
2015
2016
Own coal Purchased coal
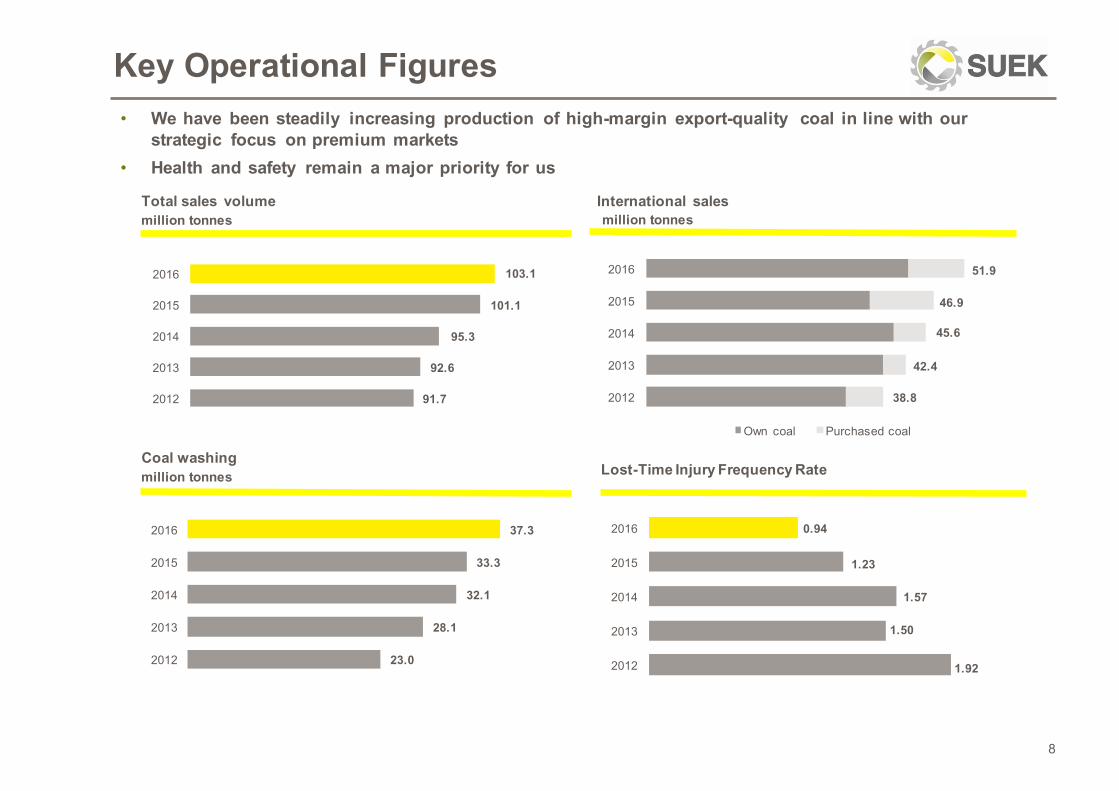
Key Operational Figures
Total sales volume International salesmillion tonnes million tonnes
Coal washingLost-Time Injury Frequency Ratemillion tonnes
8
51.9
38.8
42.4
45.6
46.9
• We have been steadily increasing production of high-margin export-quality coal in line with our strategic focus on premium markets
• Health and safety remain a major priority for us
23.0
28.1
32.1
33.3
37.3
2012
2013
2014
2015
2016
1.92
1.50
1.57
1.23
0.94
2012
2013
2014
2015
2016
91.7
92.6
95.3
101.1
103.1
2012
2013
2014
2015
2016
0,00%
5,00%
10,00%
15,00%
20,00%
25,00%
30,00%
-
200,0
400,0
600,0
800,0
1 000,0
1 200,0
1 400,0
1 600,0
1 800,0
2008
2009
2010
2011
2012
2013
2014
2015
2016
2017
2018
2019
2020
2021
2022
2023
2024
2025
2026
2027
2028
2029
2030
2031
2032
2033
2034
2035
mill
ion
tonn
es
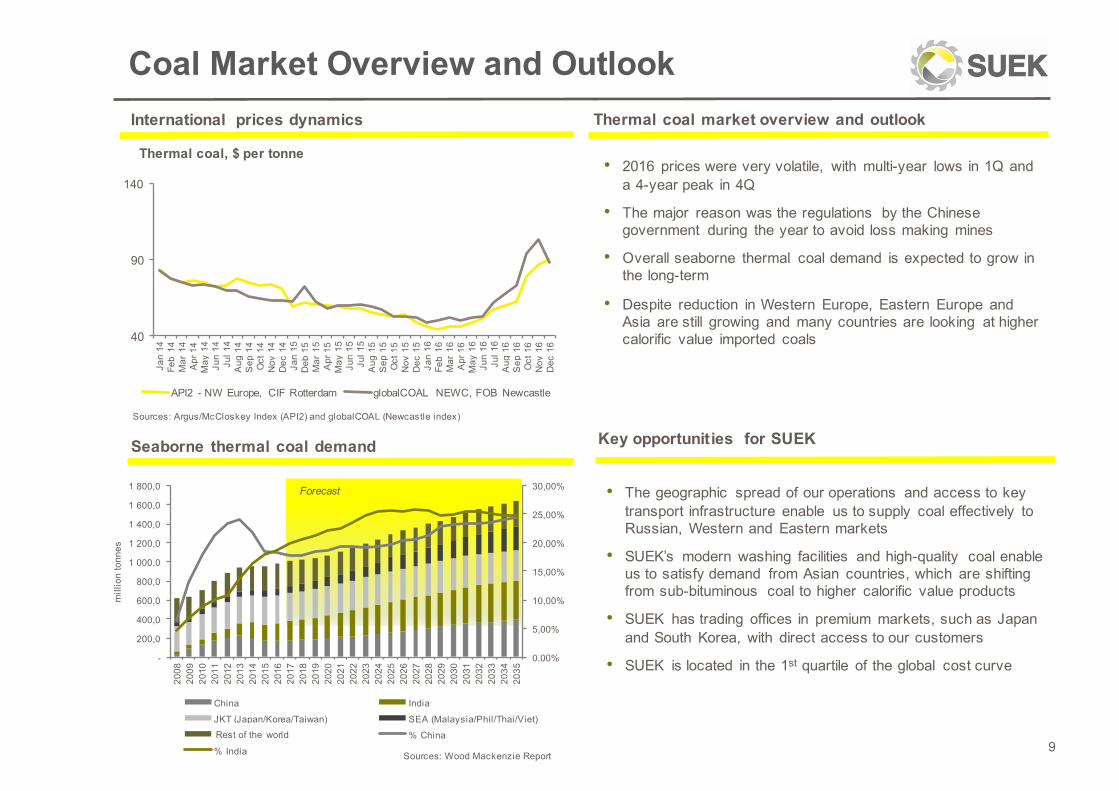
China India
JKT (Japan/Korea/Taiwan) SEA (Malaysia/Phil/Thai/Viet)
ROW % China
% India
Coal Market Overview and Outlook
9Sources: Wood Mackenzie Report
Forecast
Thermal coal market overview and outlook
• 2016 prices were very volatile, with multi-year lows in 1Q anda 4-year peak in 4Q
• The major reason was the regulations by the Chinese government during the year to avoid loss making mines
• Overall seaborne thermal coal demand is expected to grow in the long-term
• Despite reduction in Western Europe, Eastern Europe and Asia are still growing and many countries are looking at higher calorific value imported coals
Seaborne thermal coal demand Key opportunities for SUEK
• The geographic spread of our operations and access to key transport infrastructure enable us to supply coal effectively to Russian, Western and Eastern markets
• SUEK’s modern washing facilities and high-quality coal enable us to satisfy demand from Asian countries, which are shifting from sub-bituminous coal to higher calorific value products
• SUEK has trading offices in premium markets, such as Japan and South Korea, with direct access to our customers
• SUEK is located in the 1st quartile of the global cost curve
Sources: Argus/McCloskey Index (API2) and globalCOAL (Newcastle index)
International prices dynamics
Thermal coal, $ per tonne
40
90
140
Jan
14Fe
b 14
Mar
14
Apr
14
May
14
Jun
14Ju
l 14
Aug
14
Sep
14
Oct
14
Nov
14
Dec
14
Jan
15D
eb 1
5M
ar 1
5A
pr 1
5M
ay 1
5Ju
n 15
Jul 1
5A
ug 1
5S
ep 1
5O
ct 1
5N
ov 1
5D
ec 1
5Ja
n 16
Feb
16M
ar 1
6A
pr 1
6M
ay 1
6Ju
n 16
Jul 1
6A
ug 1
6S
ep 1
6O
ct 1
6N
ov 1
6D
ec 1
6
API2 - NW Europe, CIF Rotterdam globalCOAL NEWC, FOB Newcastle
Rest of the world
Global Cash Cost Curve
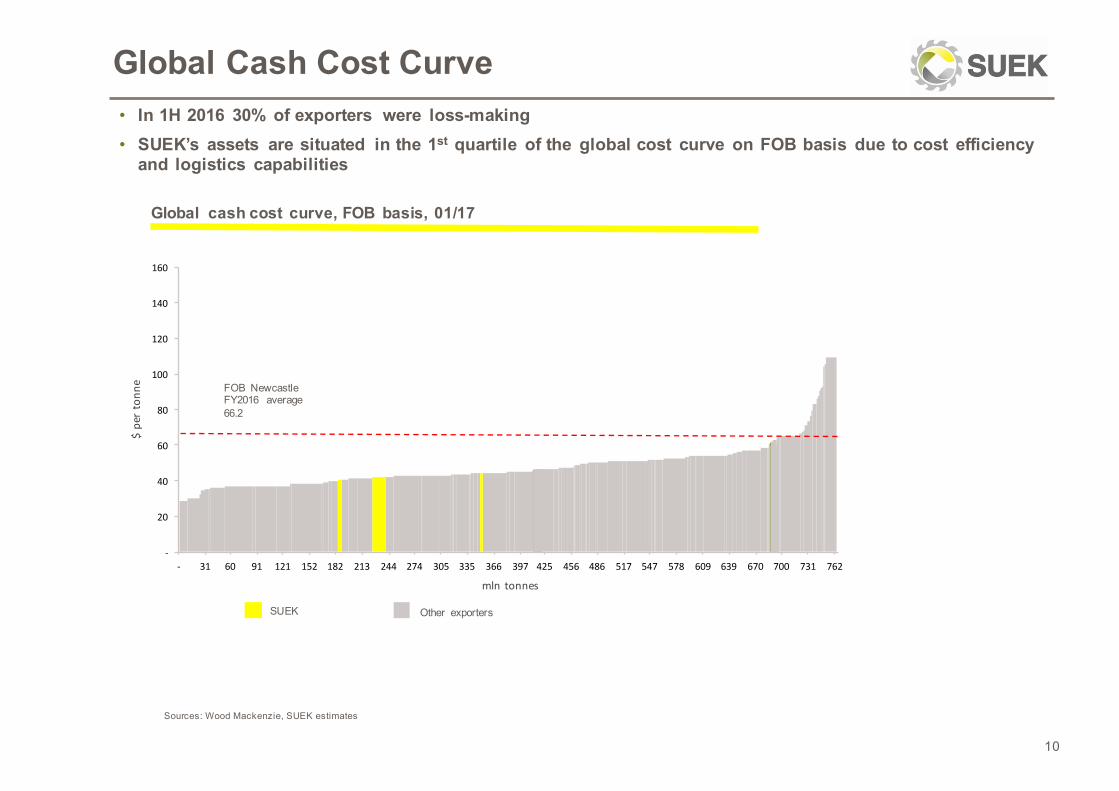
Sources: Wood Mackenzie, SUEK estimates
10
Global cash cost curve, FOB basis, 01/17
• In 1H 2016 30% of exporters were loss-making• SUEK’s assets are situated in the 1st quartile of the global cost curve on FOB basis due to cost efficiency
and logistics capabilities
-
20
40
60
80
100
120
140
160
- 31 60 91 121 152 182 213 244 274 305 335 366 397 425 456 486 517 547 578 609 639 670 700 731 762
$pertonn
e
mln tonnes
SUEK Other exporters
FOB Newcastle FY2016 average 66.2
Ust-Luga Port
MurmanskCommercialSeaport
Vanino Bulk Terminal
Maly PortAzov Port
Vostochny Port
Railways
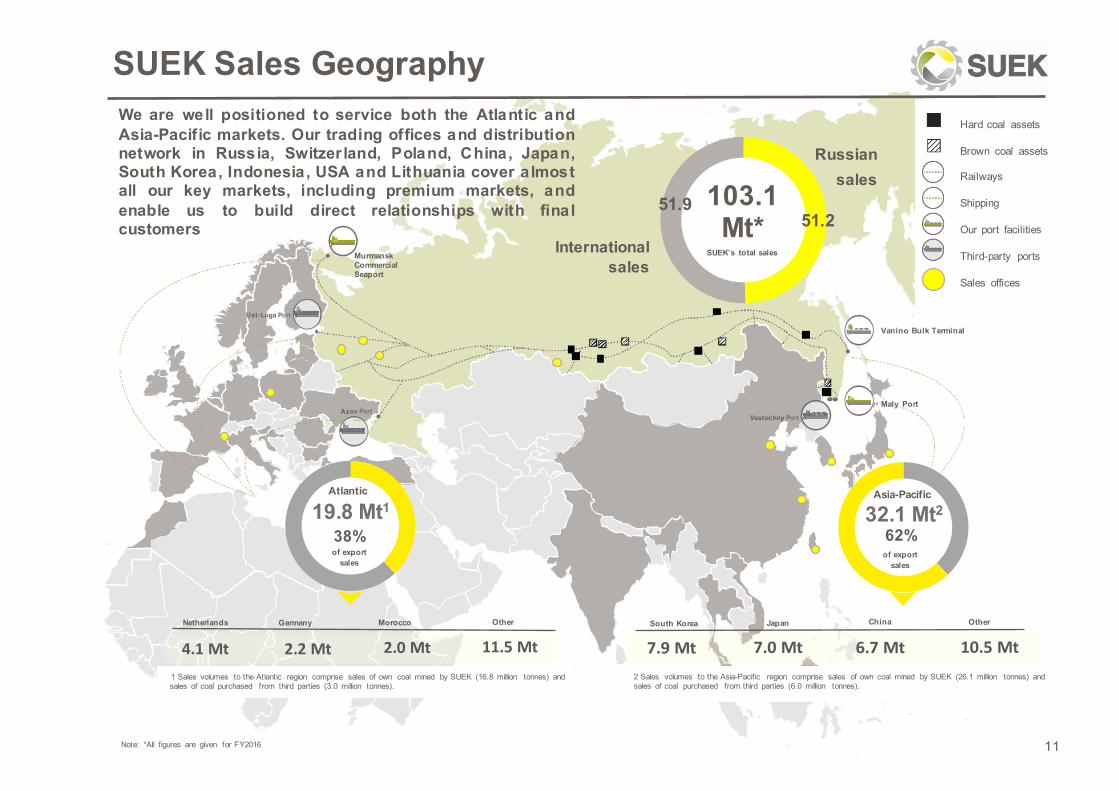
Shipping103.1 Mt*
11
We are well positioned to service both the Atlantic andAsia-Pacific markets. Our trading offices and distributionnetwork in Russia, Switzer land, Poland, China, Japan,South Korea, Indonesia, USA and Lithuania cover almostall our key markets, including premium markets, andenable us to build direct relationships with finalcustomers
19.8 Mt1
38%of export
sales
Atlantic
32.1 Mt2
62%of export
sales
Asia-Pacific
Netherlands MoroccoGermany Other South Korea Japan China Other
Hard coal assets
Brown coal assets
Railways
Shipping
Our port facilities
Third-party ports
Sales offices
SUEK Sales Geography
Note: *All figures are given for FY2016
Russian sales
International sales
SUEK’s total sales
51.251.9
1 1 Sales volumes to the Atlantic region comprise sales of own coal mined by SUEK (16.8 million tonnes) andsales of coal purchased from third parties (3.0 million tonnes).
2 Sales volumes to the Asia-Pacific region comprise sales of own coal mined by SUEK (26.1 million tonnes) and sales of coal purchased from third parties (6.0 million tonnes).
4.1Mt 2.2 Mt 2.0Mt 11.5 Mt 7.9Mt 7.0Mt 6.7Mt 10.5Mt
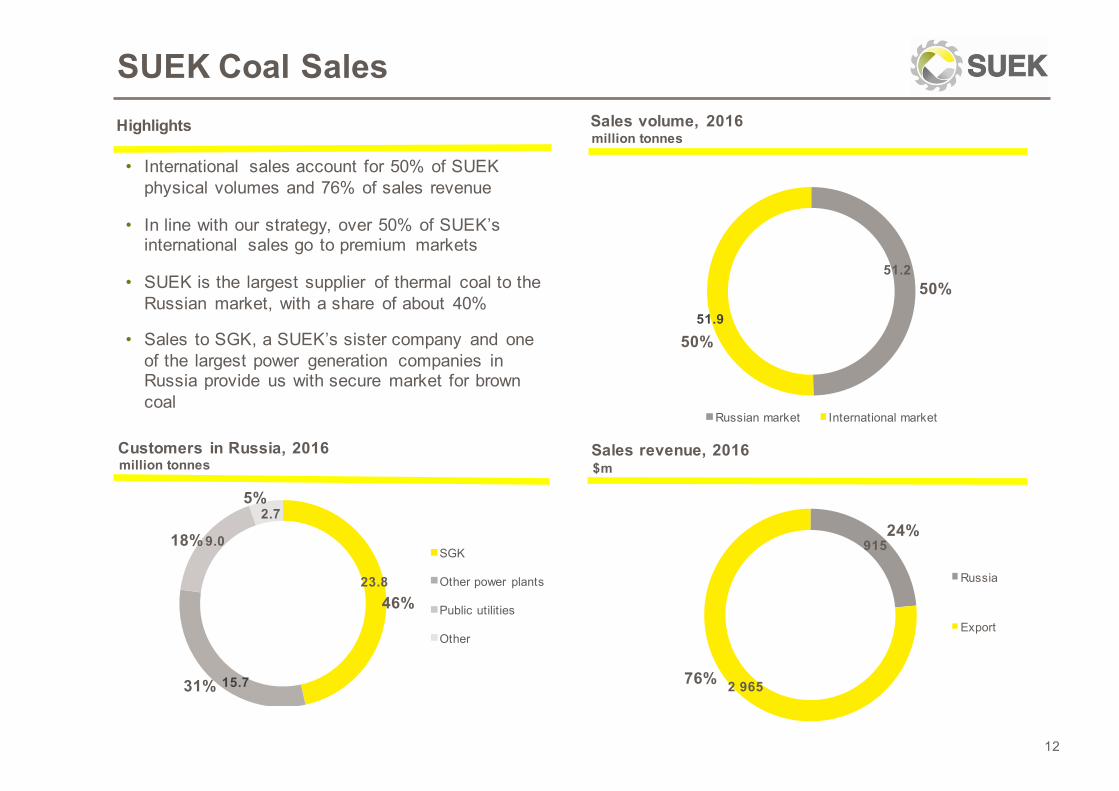
915
2 965
Russia
Export
46%
31%
18%
5%
SGK
Other power plants
Public utilities
Other
50%
50%
Russian market International market
SUEK Coal SalesSales volume, 2016
• International sales account for 50% of SUEK physical volumes and 76% of sales revenue
• In line with our strategy, over 50% of SUEK’s international sales go to premium markets
• SUEK is the largest supplier of thermal coal to the Russian market, with a share of about 40%
• Sales to SGK, a SUEK’s sister company and one of the largest power generation companies in Russia provide us with secure market for brown coal
Sales revenue, 2016
12
million tonnes
Customers in Russia, 2016
Highlights
$m
51.9
51.2
76%
million tonnes
23.8
2.7
9.0
15.7
24%
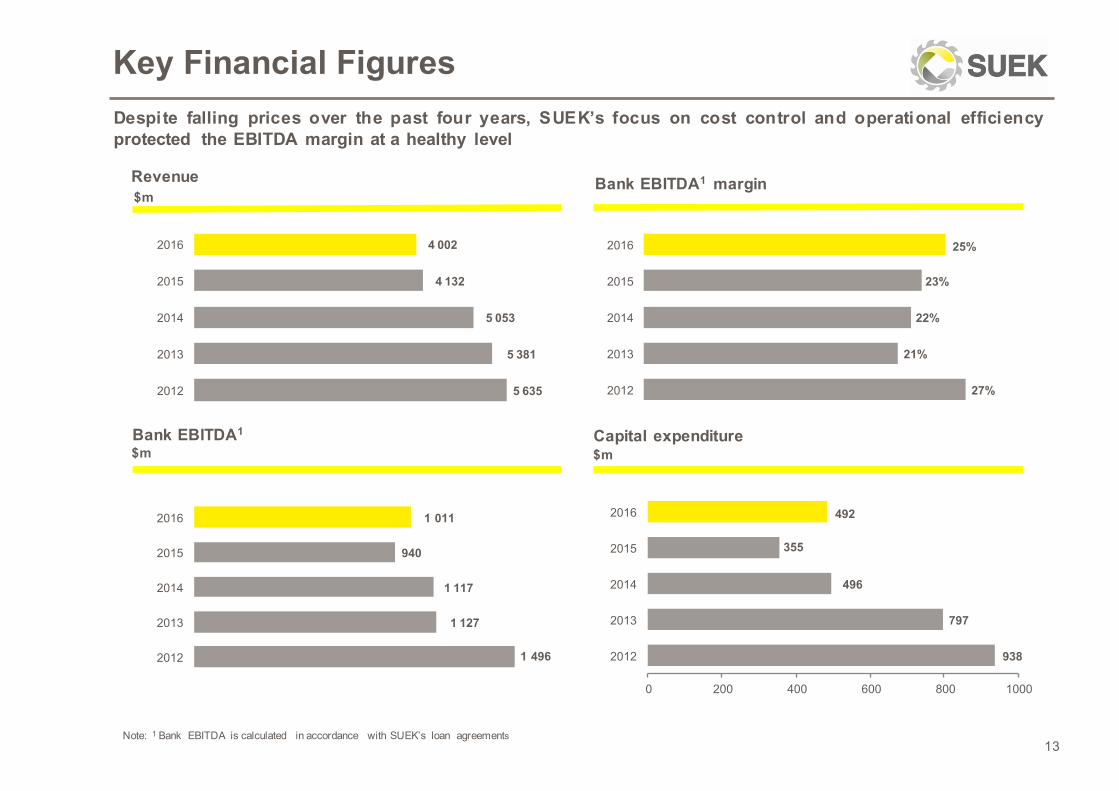
1 496
1 127
1 117
940
1 011
2012
2013
2014
2015
2016
Key Financial Figures
$m
13
Revenue Bank EBITDA1 margin
Bank EBITDA1 Capital expenditure$m $m
Note: 1 Bank EBITDA is calculated in accordance with SUEK’s loan agreements
Despite falling prices over the past four years, SUEK’s focus on cost control and operational efficiencyprotected the EBITDA margin at a healthy level
938
797
496
355
492
0 200 400 600 800 1000
2012
2013
2014
2015
2016
27%
21%
22%
23%
25%
2012
2013
2014
2015
2016
5 635
5 381
5 053
4 132
4 002
2012
2013
2014
2015
2016
3 001
3 444 3 373 3 3423 425
2 786 2 791
2 978
2.43.1 3.3 2.99 3.3 2.96 3.23 2.94
10.9
8.9 9.2 9.3
7.8 7.57.3
7.9
0
2
4
6
8
10
12
2000
2500
3000
3500
30'Jun 2013
31'Dec 2013
30'Jun 2014
31'Dec 2014
30'Jun 2015
31'Dec 2015
30'Jun 2016
31 Dec'16
Net Debt Net Debt/EBITDA EBITDA/Interest Expense
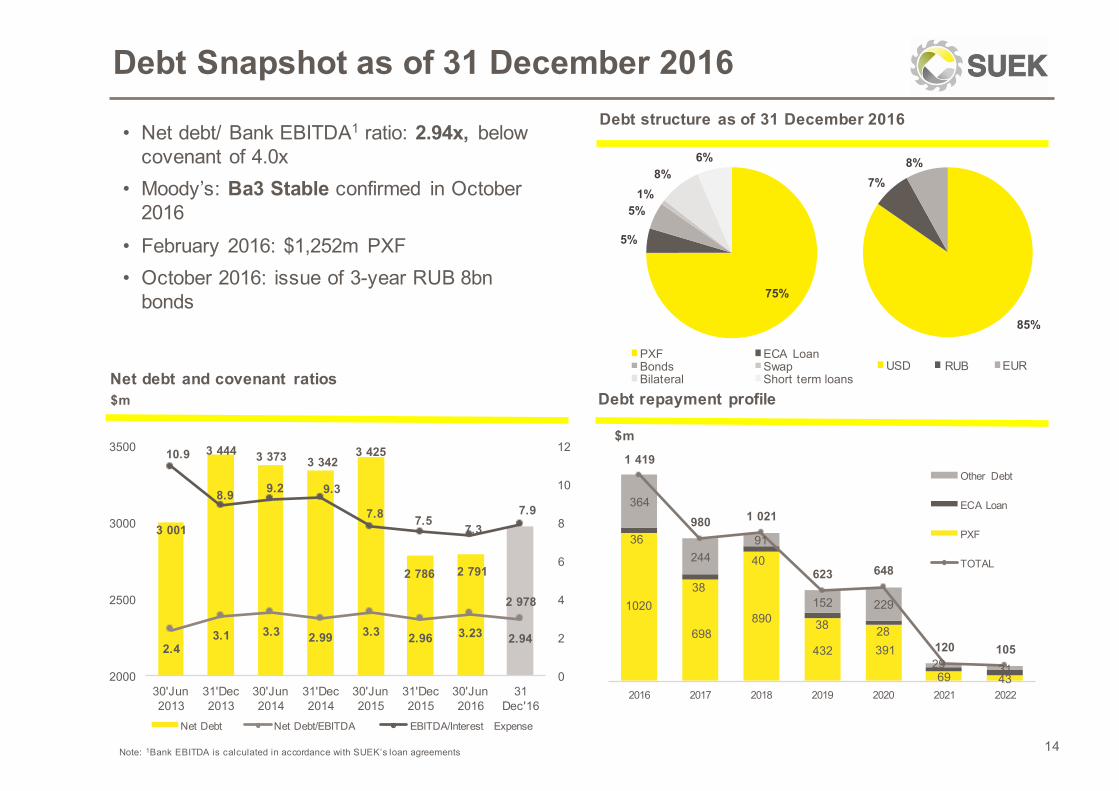
Debt Snapshot as of 31 December 2016
14
Net debt and covenant ratios
Debt structure as of 31 December 2016
Note: 1Bank EBITDA is calculated in accordance with SUEK’s loan agreements
$m Debt repayment profile
• Net debt/ Bank EBITDA1 ratio: 2.94x, below covenant of 4.0x
• Moody’s: Ba3 Stable confirmed in October 2016
• February 2016: $1,252m PXF • October 2016: issue of 3-year RUB 8bn
bonds
$m
85%
7%8%
USD RUR EUR
75%
5%
5%1%
8%6%
PXF ECA LoanBonds SwapBilateral Short term loans
1020
698890
432 391
69 43
36
38
40
38 28
364
24491
152 229
29 31
1 419
980 1 021
623 648
120 105
2016 2017 2018 2019 2020 2021 2022
Other Debt
ECA Loan
PXF
TOTAL
RUB
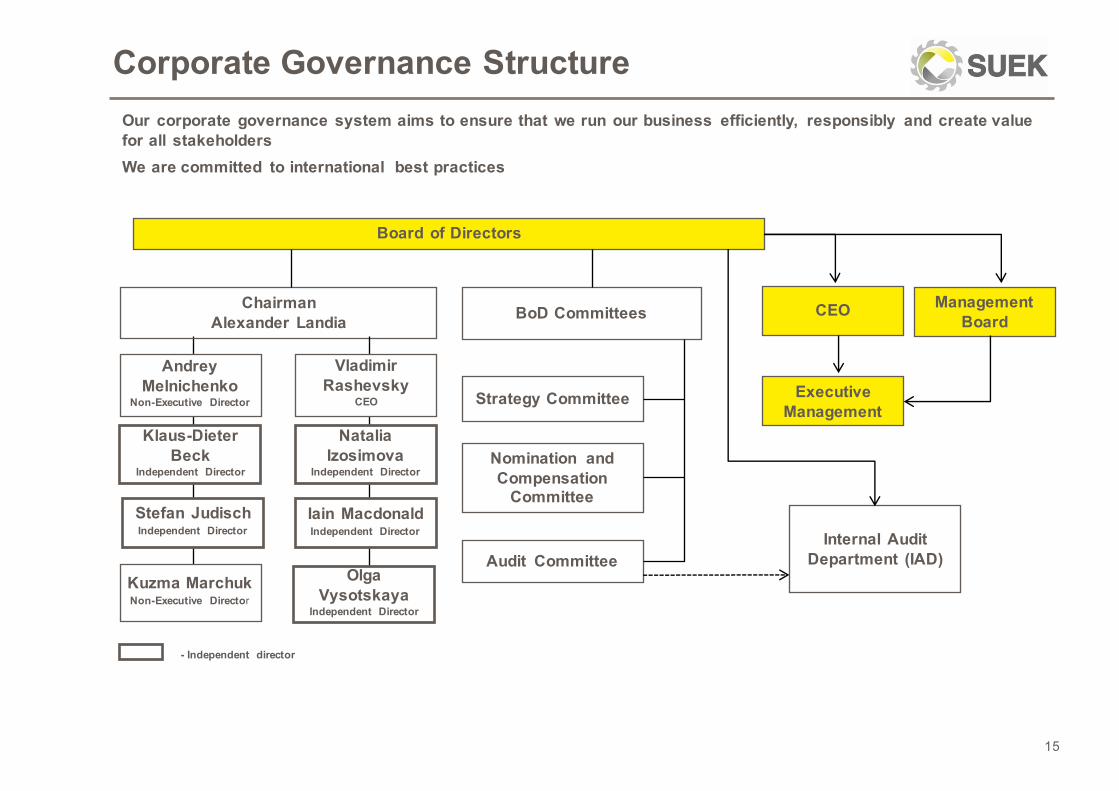
Corporate Governance Structure
15
Board of Directors
Management Board
CEOChairmanAlexander Landia
Executive Management
BoD Committees
Klaus-Dieter Beck
Independent Director
Stefan JudischIndependent Director
Kuzma MarchukNon-Executive Director
Natalia Izosimova
Independent Director
Iain MacdonaldIndependent Director
Olga Vysotskaya
Independent Director
Andrey Melnichenko
Non-Executive Director Strategy Committee
Nomination and Compensation
Committee
Audit CommitteeInternal Audit
Department (IAD)
Our corporate governance system aims to ensure that we run our business efficiently, responsibly and create value for all stakeholdersWe are committed to international best practices
Vladimir Rashevsky
CEO
- Independent director
For more information please visit www.suek.com
or contact our Investor Relations [email protected]
Contacts