Embed Size (px)
Citation preview

Fuel Poverty Methodology Documentation
First published July 2006Minor Revision made September 2006


Fuel Poverty Model Documentation
i
Introduction ............................................................................................................... 1Purpose of the Documentation............................................................................... 1Background ........................................................................................................... 1
Income ...................................................................................................................... 2Development of the Income Model ........................................................................ 2Modelling Process ................................................................................................. 2
Modelling Steps.................................................................................................. 2Data Sources ..................................................................................................... 2Missing Data ...................................................................................................... 3
EHCS Primary Benefit Unit (PBU) Income Model .................................................. 5Income From Private Sources ............................................................................ 5Income From State Benefits ............................................................................... 6Deductions ......................................................................................................... 6Imputing Missing Income Data ........................................................................... 6Income From Savings ........................................................................................ 7Output ................................................................................................................ 7
Fuel Poverty Basic Income Model.......................................................................... 7Additional Benefit Units. ..................................................................................... 7Winter Fuel Payments (WFP)............................................................................. 8Output ................................................................................................................ 8
Fuel Poverty Full Income Model............................................................................. 8Income From Housing Benefit. ........................................................................... 8Income From ISMI.............................................................................................. 8Income From MPPI ............................................................................................ 9Income From Council Tax Benefit (CTB)............................................................ 9Council Tax Deduction ....................................................................................... 9Output ................................................................................................................ 9
Validation............................................................................................................... 9List of Acronyms ..................................................... Error! Bookmark not defined.
Fuel Prices .............................................................................................................. 10Fuel Price Data Sources...................................................................................... 10
Metered Fuels (Electricity and Gas) ................................................................. 10Non-Metered Fuels Except Wood (e.g. Coal, LPG, Fuel Oil) ............................ 10Wood, Economy 10 Electricity, 24hr Tariff Electricity, Communal Heat From Boilers and Communal Heat From CHP........................................................... 10
Methods of payment data .................................................................................... 11Mapping the prices to each household................................................................. 12
Energy Consumption............................................................................................... 12Dimensions Calculation for Fuel Consumption Calculations ................................ 13Dwelling Fuel Consumption and Energy Use....................................................... 13Space Heating and Definition of Heating Regime ................................................ 15
Geographical Location ..................................................................................... 15Demand Temperature ...................................................................................... 15Extent of Heating.............................................................................................. 15Bedroom standard............................................................................................ 15Floor Area ........................................................................................................ 16Hours of Heating .............................................................................................. 16Heating Regime ............................................................................................... 17
Water Heating...................................................................................................... 17Lights and Appliance Energy Use ........................................................................ 18Cooking Energy Use............................................................................................ 18Energy Costs ....................................................................................................... 19Space and Water Heating Systems ..................................................................... 19Handling Missing Values...................................................................................... 19
Dwelling Data ................................................................................................... 19
Fuel Poverty Model Documentation
ii
Household Data ............................................................................................... 20Validation............................................................................................................. 20
References.............................................................................................................. 21Appendix A.............................................................................................................. 22Appendix B.............................................................................................................. 23Appendix C ............................................................................................................. 24Appendix D ............................................................................................................. 25Appendix E.............................................................................................................. 26Appendix F.............................................................................................................. 27
Fuel Poverty Model Documentation
1
Introduction
Purpose of the DocumentationThis document describes the methodology used to calculate the 2003 fuel poverty figures for England. It is the result of a work stream launched following an independent review of the fuel poverty calculation methodology[1].
The main body of the document is divided into three sections each describing one of the three main components of the fuel poverty calculation methodology; income, fuel prices and energy consumption.
BackgroundThe key data source used to derive estimates of fuel poverty in England is the English House Condition Survey (EHCS). This survey provides information on the changing condition and composition of the housing stock and the characteristics of the households living in different types of dwelling.
Originally carried out every five years until 2001, the EHCS now operates on a continuous format in which a population of approximately 8,000 dwellings is sampled each year. For the majority of analyses, including the monitoring of fuel poverty in England, two years’ datasets are combined to give ~16,000 dwellings/households.
The survey comprises three components; an interview survey, a physical survey and a market value survey. To calculate households that are fuel poor (defined as those which would need to spend more than 10% of their income on all fuel use whilst maintaining an adequate standard of warmth), household level information on fuel costs and incomes are required.
For each case on the EHCS, a ‘fuel poverty ratio’ is calculated. This calculation has three components – energy prices (unit and standing charges), fuel consumption andincome. The equation takes the following form:
Income
ChargeStandingn)ConsumptioFuelPriceFuel(Unit ratiopoverty Fuel
Where for each household the following applies:i) The unit fuel price (£/GJ) is applied to each fuel typeii) Fuel consumption (GJ) is the energy use for each fuel typeiii) Standing charges (£) are applied where applicable for each fuel type andiv) Income (£) is the annual income of the whole household.
Note that for every household all applicable use and cost values are summed for each fuel type.
If the fuel poverty ratio is greater than 0.1 (i.e. a household spends more than 10% of their income on fuel) then the household is considered to be fuel poor.

Fuel Poverty Model Documentation
2
IncomeA list of the acronyms used in the description of the income model can be found in appendix A.
Development of the Income ModelThe original version of the Fuel Poverty Income Model, known as the 1996 Methodology, was used to calculate the published fuel poverty figures for 1996, 1998 and 2001. Small modifications were made as a result of improvements in the treatment of missing data and changes in the benefit and tax system.
In 2004, the Department of Trade and Industry (DTI) commissioned a consultation to discuss changes proposed by the Building Research Establishment (BRE) to the fuel poverty methodology. This resulted in three significant changes to the modelling of household incomes, all of which came about due to additional information being collected in the EHCS interview survey. The first was to do with the treatment of income from other members of a household and the second and third were to do with council tax and council tax benefit. This updated method, known as the 2001 Methodology, is the current methodology and has been used to calculate the fuel poverty figures for 2003 and was also used to re-calculate the figures for 2001 in order to assess the impact of the changes on the fuel poverty statistics.
Modelling Process
Modelling StepsIn modelling incomes for fuel poverty, two definitions have been adopted:
i) “Basic income” excludes income related directly to housing.ii) “Full income”, used for targets, includes income related directly to housing
(i.e. Housing Benefit, Income Support for Mortgage Interest (ISMI), Mortgage Payment Protection Insurance (MPPI), Council Tax Benefit (CTB) and the payment of council tax).
For both definitions it is the income, net of income tax and national insurance, of the whole household. That is the income of the Household Reference Person (HRP) and any partner, plus any other adult member.
There are three major steps involved in modelling household incomes for fuelpoverty. First, the Primary Benefit Unit (PBU) Income is calculated for the HRP and partner in each household. Next, the Fuel Poverty Basic Income is modelled for each household and from this, the Fuel Poverty Full Income is modelled. The specific procedures involved in each step are discussed in detail in the following sections. The diagram in appendix B shows the outline of the steps involved in the process.
The fuel poverty income model is coded in SPSS® syntax, consisting of separate programs for all the components, which are run in sequence through the SPSS® program.
Data SourcesThe EHCS collects detailed information about the income of the HRP and any partner from different sources (wages, pensions, benefits, savings and investments and other sources e.g. rent from property). Respondents are asked separately about each source and which, if any, state benefits they receive. This information is

Fuel Poverty Model Documentation
3
collated and modelled to produce total net income for the primary benefit unit (HRP and any partner/spouse). Less detailed information is collected from the respondent (who is always in the primary benefit unit) about the income of any additional benefit units in the household. The EHCS also collects information on housing and council tax benefit, council tax bands, ISMI and MPPI.
Missing DataThe EHCS income model assumes that the details given by the respondent are correct unless they are totally implausible. There is usually a proportion of cases in which data on incomes is either refused or unknown and for these cases a method of imputation is required. The imputation methods used are described in detail in the relevant section of this documentation. Table 1 summarises the type and method of imputations carried out.

Fuel Poverty Model Documentation
4
Type of income Type of missing data Method of imputation
Private incomesSelf-employed Amounts missing New Earnings Survey
Regular employment Amounts missing New Earnings Survey
Government scheme Amounts missing Sample mean
Occupational pension Amounts missing Sample mean
Private pension Amounts missing Sample mean
Other sources Amounts missing None
Other work Amounts missing None
Total private income If answered don't know or refused Sample mean imputed at later stage
to any private income question
State benefits Benefits received are refused or d/k. Sample mean imputed at later stage
Income supportJSA*WFTCState pensionChild benefitWorking tax credit**Child tax credit**Maternity allowanceWidows pensionWar disablement pensionSevere disability allowanceIndustrial injuries allowanceCarers allowanceDLA (mobility component)DLA (care component)Disabled persons tax creditStatutory sick payDisability premium with IS/HB
Benefit amount is refused or d/k Theoretical amounts modelled
Attendance allowance Benefit amount is refused or d/k Middle rate modelled
Incapacity benefit Benefit amount is refused or d/k Incapacity benefit modelled at lower rate
Other disability benefit Benefit amount is refused or d/k Theoretical amount of DLA (mobility) modelled
PBU income Net household income missing Mean sample income imputed
Low income imputed If income is below minimum income guarantee:
If any benefits received, basic IS imputed.
If no benefits received, sample mean income imputed.
Savings Amount of savings refused/don’t know
Imputed using CHAID
Additional benefit units Gross income of ABUs missing If working, given NES means based on sex age and working statusIf not working, given theoretical income support entitlement
WFP No information on whether hhold receives WFP
Given to all 60 and over hholds – eligible for different amounts depending on number and age of over 60s
Housing benefit No information on how much hhold receives
Theoretical amount calculated following Zebedee et al, 2004
Rental amounts missing Impute rents using ODPM data
ISMI No amount given Imputed using mortgage information or from sample mean
MPPI No information given as to amount Imputed from median monthly mortgage payment of those receiving MPPI
Council tax benefit Amount of CTB Theoretical amount calculated following Zebedee et al, 2004
Table 1: Imputation procedures
*Income-based JSA modelled; no information on contribution based. Actual amount received is dependent on savings and partner's working hours but quality of data is not good enough to characterise this. Disability premium not modelled.**WTC and CTC brought in in 2003. May be paid in wages but no information available. Currently it is assumed it is not. Disability premiums not included. Child care element not modelled for WTC.

Fuel Poverty Model Documentation
5
EHCS Primary Benefit Unit (PBU) Income ModelThe PBU Income model starts with three data files obtained from the EHCS interview survey; People.sav, Income.sav and Employment.sav. These files are sorted by the EHCS key code (aacode), initial checks are performed and some preliminary recoding is done to the relationship of each person to the HRP (required due to the way that the survey form is set up). A series of indicators about the household are created - age, sex, marital status, working status of HRP and any partner and the ages of any dependent children. Basic checks are done on the input files to ensure that key variables such as age and sex are complete and plausible for all cases and that cases over 16 have marriage and employment status and no cases have more than one partner.
A fourth file, Disability.sav, is used to create two variables, the number of people registered disabled and the number of people who are disabled but not registered. Disabled people in other benefit units are then selected out as their circumstances do not influence the HRP/partner’s income. The household indicators created are used to compute theoretical entitlement to benefits. Weekly amounts for income support, JSA, state retirement pension (standard amounts are used which don't include any SERPS), incapacity benefit and child benefit are calculated and rounded up to an annual amount. Data for the theoretical benefit entitlements are obtained from information provided by the Department of Work and Pensions (DWP) for the corresponding year.
Income From Private SourcesInitial checks are made to verify that the Boolean responses to the private income questions correspond to responses concerning the amount of income from that source. Separate programs are used to calculate the annual income from regular employment, self-employment, government schemes, occupational pensions, private pensions, other work and other sources. Income from private sources is coded in bands in the EHCS survey and either a gross or net amount or both is provided. In the calculations, incomes are set at the mid-point of the band.
The programs carry out various checks and for regular and self-employment incomes, cases that look implausible are flagged for further checking (gross or net earnings are greater than £100,000 or greater than £30,000 if tenure is LA/RSL or unknown; part-time earnings over £30,000; or if income is estimated). For cases in which the amount of income from a private source is missing, amounts are imputed according to the methods shown in table 1. For regular and self-employed income, the rule used for imputing amounts for part-time employment is that if the hours worked are less than or equal to 15 per week the amount imputed is one-third of the full-time amount. For more than 15 hours per week, the amount is two-thirds of the full-time amount. The default is full-time if the variable is missing or unknown. The amounts imputed are the same for regular and self-employment. No imputations are performed for income from other sources or other work as the amounts are too variable to be reliable. Incomes for these cases are imputed later using the group mean.
Information on all private sources is combined. Where net amounts are given for income from private sources, the gross amount for that source is approximated by increasing the net amount by 20% (unless the combined net and gross income is less than the tax threshold of £4615, when it is assumed that no tax is paid and the net amount is set to the gross amount) and the total gross private income for the

Fuel Poverty Model Documentation
6
HRP and any partner is calculated. This is a requirement for the deductions sub-routine because the amount of tax payable will be underestimated (and therefore the income overestimated) if part of taxable income is given as net and part as gross. We cannot simply calculate the tax on the gross part and then add the gross-taxed to the net as the rate of tax is dependent on income thresholds, set for all taxable income. A number of flags are created indicating the nature and extent of any imputation. If incomes from other work or other sources are missing, the total income is set to missing.
Income From State Benefits The EHCS interview survey asks about benefits paid to the HRP or their partner and the period of payment. It does not check if the benefit is for one or both people in a couple, so this needs to be estimated for the purposes of tax deductions. Combining benefits is an important aspect of the model. Households often receive more than one benefit and, if one of these benefits is means tested, it may determine the value of other benefits. Typically, respondents know the amount of income they receive from benefits but do not necessarily know exactly which benefits they receive. For cases in which data is missing or totally implausible, benefit rates are applied using the prescribed rates for the correct period.
Four key variables are created: total taxable benefit income for the head of household (HOH), total non-taxable benefit income for HOH, total taxable benefit income for partner, total non-taxable benefit income for partner. The HOH is used because the taxation system treats the man in a couple as being the head of the household and can therefore be different from the HRP.
DeductionsThe private and benefit income is added together, distinguishing between taxable and non-taxable. It uses the 3 key variables of whether self-employed, whether over state retirement age for the HRP and partner and whether the HRP or partner makes a contribution into their employer’s occupational pension scheme, to calculate the amount of National Insurance payable (Class 1, 2 and 4 contributions). The programme then calculates the personal tax allowances for the HRP and partner and calculates the total amount of tax payable. It then sorts out if the HRP or partner is entitled to any of the other allowances restricted at 10% (married man's, married age and additional personal allowances) and recalculates tax payable. It then computes
total net income for HRP and partner separately where:
It adds together the HRP and partner’s incomes. If one is missing and both should have a valid value even if it is zero, then it is set to missing.
Imputing Missing Income DataAt this stage there are two scenarios in which the PBU income could still be missing:
i) If income amounts from the private sources ‘other work’ or ‘other sources’ are missing, or if the respondent answered ‘don’t know’ ‘or ‘refused’ to income from private sources and benefits.
ii) If missing income from state benefits is imputed using theoretical amounts which are calculated using the assessed income of the HRP and partner; and this is missing.
TaxIncomeInsuranceNational-IncomeTaxableIncomeTaxableNon IncomeNet
Fuel Poverty Model Documentation
7
Two programs are used for imputing missing income data. The first deals with income data that is either zero or very low. If household income is less than the minimum, defined as basic income support, it is changed. Where the household receives any of the main state benefits (excluding child benefit) their income is pegged to the basic IS amount (plus any disability premiums if they qualify). Where they do not receive any state benefits then it is assumed that some component of their income is missing and the whole lot is set to missing and imputed in the next program. A flag is created to identify cases which are changed and the original values are kept for later checking.
The second program uses the mean income of key groups from the weighted EHCS dataset to impute missing household income. The employment status and SEG group of both HRP and partner is used to create a ‘combined’ flag for the household.
Income From Savings A question about savings and money invested is asked of the interviewee in the interview survey. Approximately 5% of the data obtained is missing, perhaps due to the unwillingness of householders to divulge this personal information. A method based on CHAID analysis is used to estimate the savings for each household. The data collected on savings from the interview survey is used as the dependent variable in the analysis.
The predictor variables used for estimating savings are: tenure, age of HRP, number of jobs (HRP plus partner), highest educational qualification, single householder or with partner, sex of HRP, manual or non-manual occupation, pension, benefits (whether the HRP gets any means-tested benefits), dwelling type and dwelling market value. Once all the cases have a savings band, the midpoint is taken as their savings amount. The income received from these savings is then calculated using an interest rate of 3% net of tax.
OutputThe final PBU income variable (hhincx) is created by adding the savings income to the HRP and partner’s net income from private sources and benefits.
Fuel Poverty Basic Income Model
Additional Benefit Units.The fuel poverty Basic Income measure is the household income, including income from additional benefit units (ABUs), for example a grown-up child living with their parents or two or more people sharing a house. In addition, the winter fuel payment (WFP), made annually to those eligible is included in the FP Basic Income.
In the 1996 methodology, income from ABUs was modelled using a correction factor based on the FES survey. The 2001 methodology uses data collected during the interview survey. The number of additional benefit units in the household is derived by the CAPI program during the interview and questions are asked for each ABU as to whether they receive any of the main benefits and the total gross earnings (income plus benefits) for each ABU. Although very little data regarding the benefits is unknown (~4% of cases with ABUs), approximately 37% of the gross income variable is missing. This missing income data is imputed using NES (now known as ASHE) data (if the ABU is working), based on sex, age and working hours (incomes for part
Fuel Poverty Model Documentation
8
time workers are imputed at a rate of half those of full time workers) or from the theoretical entitlement to income support for those cases not working.
Winter Fuel Payments (WFP)The Winter Fuel Payment, introduced in 1998, is a payment given once a year to help older people with their heating bills. It is available to all households with at least one resident aged 60 years or over and is paid automatically to an eligible person who receives a state benefit (other than housing benefit, council tax benefit or child benefit). Those who do not receive benefits have to claim the payment. No question is asked in the EHCS survey as to whether anyone in a household receives WFP. In the FP Basic Income model, the WFP is given to anyone aged 60 or over (additional amounts are payable to those aged 80 or over and in 2004 a one-off payment was also available to those aged 70 or over).
OutputThe Fuel Poverty Basic Income variable, (fpbasinc) is created by adding the income from the ABUs in a household and the winter fuel payments to the PBU income variable (hhincx).
Fuel Poverty Full Income ModelThe Fuel Poverty Full Income measure (FP Full Income) is the final output of the income model and is the measure used in the calculation of the Fuel Poverty Indicator used for targeting. Income/outgoings relating to housing costs are dealt with in this final step.
Income From Housing Benefit.The purpose of the housing benefit (HB) scheme is to help people on low incomes pay their rent (families who own their own homes may have their mortgage interest payments met through income support – see below). People on IS, income-based JSA or the guarantee credit element of the pension credit are automatically entitled to the full level of HB. For other claimants, the amount of HB payable depends upon their income in much the same way as for IS or income-based JSA.
Income From ISMIIncome Support Mortgage Interest (ISMI) is an additional payment of interest on a mortgage. The criteria for receiving ISMI are 1) that the homeowner receives either income support or JSA, 2) that there is an outstanding mortgage on the property, 3) that the owner of the property lives in it and 4) that the claimant has savings totalling less than £8,000 pounds. Monthly mortgage repayments for ISMI are calculated in the income model using the following rules:
Households receiving ISMI that have provided a monthly amount are assigned this amount.
Households that receive ISMI but have given no amount have their payments calculated if they have provided sufficient mortgage information. If no term of mortgage is provided it is assumed to be 25 years. The monthly interest payments are calculated for the outstanding loan amount using the average interest rate of the top 20 lenders as reported by the ONS.
Households that receive ISMI but have given no amount and have insufficient mortgage information are assigned the median monthly ISMI amount from those with known amounts.
Fuel Poverty Model Documentation
9
Income From MPPIIf the owner and HRP or partner are not working, the question is asked in the interview survey as to whether any contributions to the mortgage payments are received under an MPPI policy. No amount for the payment received is requested but the respondent answers as to whether the payment covers the full amount or part amount of the mortgage. Amounts for MPPI income are imputed using the median monthly mortgage payment of those cases who receive MPPI. Minimum and maximum amounts are calculated in the same manner as for ISMI.
Income From Council Tax Benefit (CTB)The interview survey asks whether council tax benefit is received by the HRP or partner. The actual amounts received are modelled by applying the standard means test for income disregards and applicable amounts, with the addition of premiums for number of children, age and whether the dwelling contains a family. These modelled amounts are used unless there has been income imputation, in which case the respondent’s answer is taken.
Council Tax DeductionSince 2002/03, the council tax band for each dwelling has been collected through the Market Value Survey (MVS). The amount of council tax paid by the household is therefore modelled using the council tax band of the dwelling and information about charges in the relevant local authority area. In previous years information about council tax bands was collected during the interview survey. This led to a certain amount of missing data for which Band D council tax amounts for the designated local authority area were assigned. Lone persons discount is applied where appropriate.
OutputThe Fuel Poverty Full Income variable (fpfullinc) is created by adding the income related to housing costs; i.e. housing benefit, ISMI, MPPI and council tax benefit to the basic income variable (fpbasinc), and by subtracting the council tax payable.
ValidationThere are many stages in the process of calculating fuel poverty incomes and at each stage checks are made to ensure as far as possible that the data is reasonable. For example, in the calculation of incomes from private sources, checks are made on data falling outside certain plausibility ranges, as it is possible that coding errors are made during the interview. The characteristics of that case are interrogated and if the amount seems reasonable it is kept. Only when we can be as certain as possible that the data is incorrect do we make an imputation or change. Any changes made are always flagged so that the data can be revisited and the syntax rerun to see what the effect of these imputations might be.
The main external validation techniques applied to the income model are trend analysis over time and comparison with analogous income data from other surveys. The average incomes of the PBU and the household are compared with those of the Family Resource Survey (FRS) and the Expenditure and Food Survey (EFS). The FRS is considered to be the most comprehensive and accurate income survey conducted in this country and one that is dedicated to incomes, something the EHCS is not. It is therefore important to check that the EHCS income model results are comparable.

Fuel Poverty Model Documentation
10
Fuel PricesThe fuel price element of the fuel poverty model generates a case by case output to be fed into the energy consumption model (see next section).
The price each household pays for its fuel depends on four main factors:i) The household’s location within the country (fuel prices vary regionally)ii) The choice of supplieriii) The choice of tariffiv) The method of payment where relevant (i.e. payment by direct debit,
credit etc).
Information on the exact tariff, or the supplier, is not collected in the EHCS. The survey does however collect information on the geographical location of each case and on the method of payment (for metered fuels). This allows the application of an average fuel price for each region and method of payment. Fuel prices specific to each household are calculated for each case.
The process involved is shown as a flowchart in appendix C.
Fuel Price Data Sources
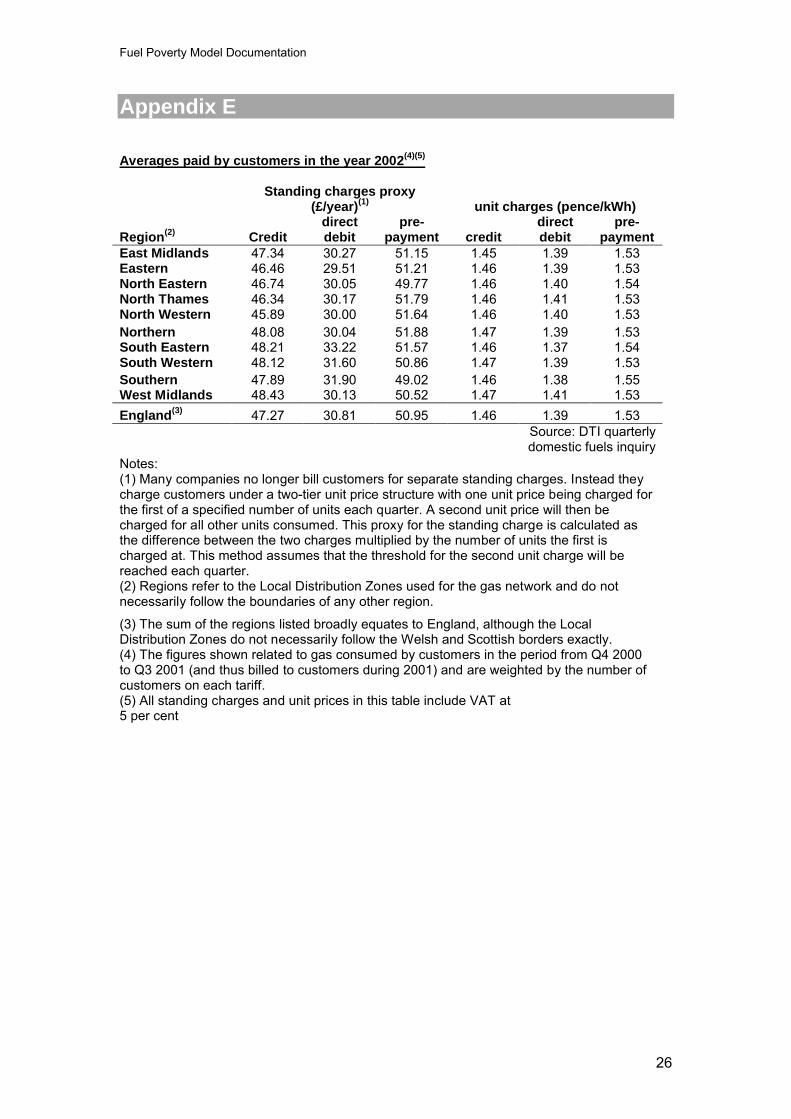
Metered Fuels (Electricity and Gas)The DTI provides average annual prices (January to December) for gas, standard electricity and off-peak (Economy 7) electricity1. These prices are split by the electricity supply regions/gas distribution zones and three methods of payment; direct debit, standard credit and pre-payment. The method employed by the DTI is outlined in the flowchart in Appendix D.
An example of this data (the 2002 gas prices) can be found in Appendix E.
Non-Metered Fuels Except Wood (e.g. Coal, LPG, Fuel Oil)The prices paid for the majority of non-metered fuels (with the exception of wood) are taken from the SALKENT reports. These are independently produced reports which provide the average prices paid for fuels, split into four broad geographical regions. The reports are published twice yearly; once in May and once in October.
For fuel poverty calculations we use the October SALKENT price. Non-metered fuels tend to show considerable seasonality and are more expensive in the autumn and winter. The rationale behind using the October price is that the fuel poor are unlikely to be in a position to buy fuel in advance of need in the summer months. This is also in line with the precautionary principles followed in our analysis.
Wood, Economy 10 Electricity, 24hr Tariff Electricity, Communal Heat From Boilers and Communal Heat From CHPThe prices of wood, Economy 10 electricity, 24hr tariff electricity, communal heat from boilers and communal heat from CHP are not provided by the DTI and not published in the SALKENT reports. For these fuels we use prices adjusted from the
1 The fuel price data supplied to BRE are also published in the DTI’s quarterly energy prices: http://www.dti.gov.uk/energy/statistics/publications/prices/index.html

Fuel Poverty Model Documentation
11
price published in SAP 2001. It is likely that when SAP 2005 is finalised and published we will take these prices as a new base.
The price of wood is determined by increasing the previously published 2001 SAP price by the same proportion as anthracite nuts have increased since 2001. This follows the SAP methodology used in producing the SAP 1996 and SAP 2001 wood prices.
The “communal from boiler” unit price and the “communal from CHP/waste heat” are determined as a ratio of the gas unit price for that year (the ratios used are from SAP 2001). The communal standing charge is equal to the gas standing charge (again as in SAP 2001). For each year the average England gas price provided by the DTI is taken as the base gas data.
The price of Economy 10 and 24 hr electricity is inflated from the SAP 2001 base prices for these fuels by the same amount as Economy 7 electricity has increased since that year. However, in 2002 and 2003 the price of Economy 7 electricity was in fact lower on average than in 2001. Therefore, following the precautionary principle, we considered it more prudent to continued to use the SAP 2001 published prices for these two fuels.
Methods of payment dataThe methods of payment data collected are for gas and electricity only. Each household is asked how they pay for their electricity and gas. For each fuel they have the option of:
a) Direct Debitb) Standing Orderc) Monthly / Quarterly Billd) Pre-payment (key/card or token) meterse) Included in rentf) Frequent cash payment method (i.e. more frequent than once a month)g) Fuel direct / direct from benefitsh) Fixed annual bill (however much gas / electricity is used) e.g. StayWarm (n.b.
this question was only added in 2003/04 survey)i) Other (specified)j) Not applicable / no mains gask) Don’t know
There are more methods of payment collected in the EHCS survey than the three methods of payment attached to the prices provided by the DTI (see above and Appendix E). We therefore need to make some assumptions in order to assign each household a method of payment. The current assumptions are as follows:
Those stating ‘direct debit’, ‘included in rent’, ‘fuel direct/direct from benefits’ or ‘fixed annual bill (e.g. StayWarm)’ are coded as Direct Debit.
Those stating ‘standing order’, ‘monthly/quarterly bill’ and ‘frequent cash payment method (more than once a month)’ are coded as Standard Credit.
Those stating ‘pre-payment (key card or token) meters’ are coded as Pre-Payment.
For those coded as ‘other’ and where a description is provided, the most suitable method of payment is assigned for each fuel.
Fuel Poverty Model Documentation
12
After this process there will still be some cases without a method of payment (i.e. those who have said they don’t know, or “other” and where the description is missing or insufficient). For these cases an imputation process is applied in which the method of payment is matched with that of a similar type of household.
Mapping the prices to each householdIn addition to matching each household to a fuel based on the method of payment, the household must also be assigned a price based on its location within the country. The EHCS collects information on which government office region (GOR) each household is in however the GORs do not correspond with the electricity supply regions, gas distribution zones or SALKENT regions.
The model matches the fuel prices for each supply/distribution/SALKENT region onto the GORs using a geographical matching technique. This is based upon estimates of the proportion of each government office region within each supply region or distribution zone.
For example, if a household’s GOR lies 40% within one supply region and 60% within another supply region the price applied will be a 40/60 weighted average of the two prices. This approach assumes a uniform population density across England.
The prices of wood, Economy 10 electricity, 24hr electricity, communal from boilers and communal from CHP are calculated on a national scale so no regional mapping is necessary.
Energy ConsumptionThe amount of fuel consumed to provide the energy needs of each household is required as one of the components of the fuel poverty ratio, to assess whether a household is fuel poor.
Under the fuel poverty definition, the energy required to heat and power a home includes energy for:
i) Space heating - ES (GJ).ii) Water heating - EW (GJ).iii) Lights and appliances - EL&A (GJ).iv) Cooking - EC (GJ).
The BREDEM model [2] is used to predict the energy use of a household where:
Total household fuel consumption = ES + EW + EL&A + EC.
Total household energy-use includes space and water heating (to meet defined standards) and energy for lights, appliances and cooking. The amount of energy required to heat a dwelling will depend on the building specification such as insulation levels, heating systems and the geographical location of the dwelling. A household’s demand for energy will depend on the number of people within the household and the habits of these individuals. Information from the EHCS is used to provide details about both dwellings and households. The calculation method for each component of energy consumption is consistent with standard energy models such as the Standard Assessment Procedure (SAP) for calculating energy use in dwellings [2] and the more general model from which SAP is derived (BREDEM) [3].

Fuel Poverty Model Documentation
13
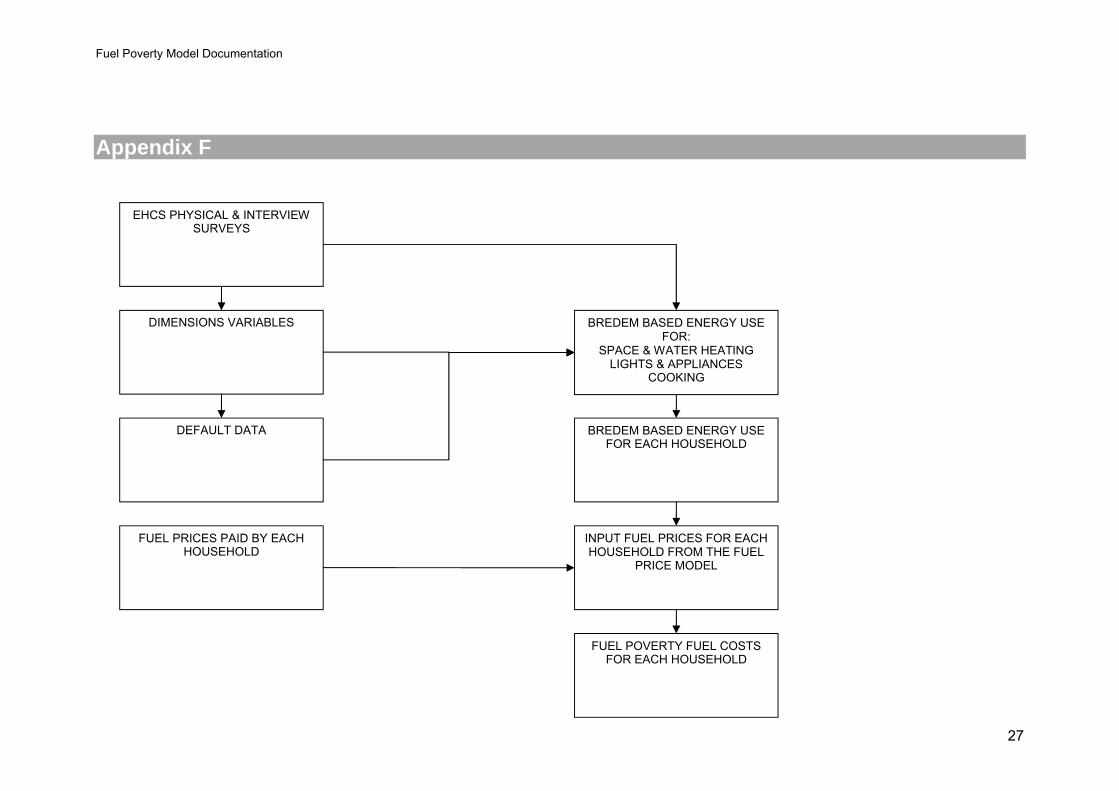
Comprehensive data about the housing stock and occupants are collected in two main components of the EHCS: the “physical” and “interview” surveys. The physical survey is undertaken by trained surveyors and collects information about all of the physical attributes of the dwelling. The interview survey includes responses obtained from the Household Reference Person (HRP) or their partner about the occupants of the dwelling. This about occupation patterns. The energy use and cost calculation process is summarised in Appendix F.
Dimensions Calculation for Fuel Consumption CalculationsData from the EHCS physical survey are used to calculate the dimensions of the dwelling and in particular the heated volume and heat loss areas – see Table 2. This involves utilising data from many different modules that relate to different parts of the survey form. The following information is calculated:
Internal & external wall areas. Roof area. Room specific floor areas. Habitable floor area and footprint area. Perimeter of building. Ceiling height. Window areas. Number of floors and rooms in a dwelling.
Key variables are the width and depth of the main and additional parts from the ‘Shape’ section of the survey form. These are used to determine the area (m2) of each floor. All physical data relating to the dwelling must have a value for the width and depth of the building to be considered part of the main data set. The survey form only has space to include the widths and depths of three levels, so the dimensions of any further levels are imputed. They are assumed to be the same size as the floor below, with the exception of any attics, which are assumed to be half the size of the floor below, and basements, which are assumed to be the same size as the floor above. In general, wherever possible imputations are based on the case in question, not on stereotypes or on the rest of the data set.
Dwelling Fuel Consumption and Energy UseThe calculation of fuel consumption data for fuel poverty requires information from both the physical and interview surveys and the dimensions data to derive the following:
Heat loss due to conduction from all the external house structure to the external environment.
Heat gain from solar fluxes and other gains such as from lights and appliances and occupants.
Heat loss due to ventilation. Energy required for space and water heating systems. Heating regime of the inhabitants (the details of which will be developed
below). Energy required for lights, appliances and cooking.
The information collected in the interview and physical surveys is loaded into a series of data files. Table 2 describes the data that are required and how these relate directly to the EHCS forms completed by surveyors and interviewers when they visit a dwelling/household.

Fuel Poverty Model Documentation
14
DatabaseDescription of information used in energy calculations
Firstimp Key dwelling components: Tenure Type e.g. mid-terrace Construction date
Interior Rooms in the dwelling – function, dimensions, floor level.
Introoms Details of the rooms e.g. presence of solid floors.
Services Utilities available e.g. mains gas, off-peak electricity.Primary & secondary heating systems and controls.Water heating system.Type and quantity of roof insulation.
Flatdets Dimensions and details specific to flats.
Numflats Information about complete building that contains the flat.
Shape Complete building dimensions including presence of attics and basements.Construction material of building.
Elevate Proportion of external walls that have wall insulation.
Chimneys Number of chimneys and construction type.
Roofstruc Describes the structure of the roof e.g. flat roof.
Wallstruc Detailed construction information for each external wall.
Dormers Presence of dormers and bay windows.
Windows Number of windows and glazing/frames of windows.
Doors Number and type of doors.
Ph
ysic
al s
urv
ey
Around Information about surrounding gardens.
Attitudes Information about the daily routine of occupants.Information about methods of payment for gas and electricity
People Information about the number, sex, age and occupation of inhabitants.
Inte
rvie
w
surv
ey
Workdone Details of any energy improvements that have been recently installed in the dwelling.
Table 2: Energy consumption input data
Fuel Poverty Model Documentation
15
Space Heating and Definition of Heating RegimeThe amount of energy required for space heating is estimated using the BREDEM 12 algorithm. This model requires the geographical location of a dwelling and the specification of a heating regime (that defines an acceptable level of heating). An acceptable level of heating is defined in terms of the temperature of a dwelling, the extent to which the dwelling space is heated and the number of hours that the occupants spend within the dwelling and require heating.
Geographical LocationBREDEM 12 defines twelve geographical regions for England. These BREDEM regions define average climatic conditions such as temperature, solar flux and wind-speed. Each dwelling in the EHCS has a geographical identifier that can be used to determine in which BREDEM region the property is located.
Demand TemperatureBREDEM 12 suggests that (generally) a house can be split into three distinct zones: a primary heated zone, secondary heated zone and unheated zone, as described in detail in [3]. For the modelling of fuel poverty the demand temperature of all dwellings within the primary zone is assumed to be 21ºC, the secondary zone is assumed to be heated to 18ºC and the temperature of the unheated zone relates to the external temperature and therefore varies depending on the local climatic conditions. These are temperatures that, it has been agreed, should provide an adequate level of thermal comfort and that all households have a right to.
Extent of HeatingSome dwellings are considered excessive in size for the number of occupants that live there. In this case the house is assumed to be “under-occupied” that is, only a proportion of the dwelling will need heating. In order for a dwelling to be considered under-occupied it must fulfil the following criteria that depend on both the number of bedrooms in a dwelling and the total floor area of the dwelling:
Bedroom standardA dwelling is considered to have surplus bedrooms if:
there are one or more extra bedrooms than required for homes without dependent children (children under 18 years)
or there are two or more extra bedrooms than required for homes with
dependent children.
The number of bedrooms required depends on the household constitution. The standard states that:
A bedroom is required for each couple. Children of different sexes below the age of 11 years can share a room. Children/adolescents below the age of 21 years of the same sex can share a
room.

Fuel Poverty Model Documentation
16
Floor Area
There is surplus floor area in a property if the floor area of the property is over 200% of that considered to be the “standard” living area required for the number of occupants, as defined by the Parker-Morris Standard [4]. Table 3 defines this standard.
Occupants Standard living area required (m2)
1 33.02 48.53 61.04 79.05 89.56 97.07 114.58 128.09 140.0
Table 3: Parker Morris Standard
For the purposes of fuel poverty, a dwelling is considered to be under-occupied if there are both surplus bedrooms and surplus floor area.
If a dwelling is under-occupied then it is assumed that approximately half of the dwelling (based on the total floor-area of the dwelling and the layout of the floors) is heated, that is:
Aheated≈ 0.5A
where A is the total floor area of the dwelling.
Hours of HeatingThe length of the heating season must be calculated on a dwelling by dwelling basis as factors such as location and dwelling characteristics can affect the length of time that heating is required throughout the year. This calculation depends on the external temperature for the degree day region for the month and the gain to loss ratio (GLR) of the dwelling and includes consideration of solar gain. The following regimes are applied during the heating season:
A standard heating regime assumes that the occupants are not occupying the dwelling during normal working hours. In this case it is assumed that the occupant heats the dwelling for two hours first thing in the morning and then for seven hours from late afternoon. During the weekend it is assumed that the property is heated throughout the day for 16 hours. The SAP methodology also makes this assumption to calculate the energy consumption in a dwelling.
This heating pattern does not apply for large sectors of the population, in particular the vulnerable such as the elderly and those caring for young children. From 2001, the EHCS interview survey included a direct question to ask whether anybody within the household occupied the dwelling during the morning or afternoon (contained within the database "attitudes.sav"). This question is directly utilised to approximate the heating pattern. If anybody is in the house in either the morning or afternoon

Fuel Poverty Model Documentation
17
during weekdays, the house is assumed to require all day heating. In these cases all day heating is assumed throughout the week.
Heating RegimeThe following heating regimes are defined and used to calculate the energy consumption of a household:
Details of STANDARD heating regime
Heating Pattern Weekday 9 hours of heatingWeekend 16 hours of heating
Heating Extent Whole house
Demand Temperature Primary living zone 21CSecondary living zone 18C
Table 4: The standard heating regime for the fuel poverty heating calculations
Details of FULL heating regime
Heating Pattern Weekday 16 hours of heatingWeekend 16 hours of heating
Heating Extent Whole house
Demand Temperature Primary living zone 21CSecondary living zone 18C
Table 5: The full heating regime for the fuel poverty heating calculations
Details of PARTIAL heating regime
Heating Pattern Weekday 16 hours of heatingWeekend 16 hours of heating
Heating Extent Half house
Demand Temperature Primary living zone 21CSecondary living zone 18C
Table 6: The partial heating regime for the fuel poverty heating calculations
Having defined the heating regime used by each household, the energy use for space heating can be approximated using the BREDEM model which calculates the energy required to bring each dwelling to the designated temperatures and for a set period of time each day and across the year. This calculation needs to take on board details about the heating systems, applied insulation and dwelling construction and materials. Full details of the method are provided in [3].
Water HeatingEnergy demand for water heating QU(Watts) is given as:
Fuel Poverty Model Documentation
18
QU =fdemand (78 + 52 N)
where N is the number of occupants and fdemand is the demand factor. The fuel poverty calculation assumes that all households use 20% more than average i.e.fdemand = 1.2. This factor was derived by analysing the change in overall water use since this equation was derived, which implies a 20% increase [5].
Most methods of water heating involve energy losses that relate to storing the water in hot water tanks and distribution losses. Therefore the total water energy demand must satisfy the above equation and account for the energy losses inherently involved in satisfying the supply required. Hot water storage losses are mostly influenced by tank insulation and tank volume. A factor is applied if there is very low occupancy in a property as generally this means that water will be stored for a longer period of time.
The energy required for water heating EW (GJ/yr) is given as:
EW = k(QU + QLoss - QS)/W
Where QLoss (Watts) are losses through water storage/distribution, QS(Watts) is solar-heating, W is the efficiency of the water heater and k is a constant.
Lights and Appliance Energy UseEnergy demand for electrical lights and appliances ELA(GJ/yr) is given as:
4.47 + 0.0232 A N, A N < 710
ELA = 11.98 + (0.0146 A N - 2.78 10-6 (A N)2), 2400 > A N 710
31.01, A N 2400
Where: A = Total floor area of the dwelling (m2).
Cooking Energy UseEnergy demand for cooking is given as EK(GJ/yr):
EK =f Gas (2.98 + 0.6 N) + f Electricity (1.7 + 0.34 N)
Where f Gas and f Electricity are the proportions of demand satisfied from gas or electric cooking, respectively.
Where both gas and electricity are present in a dwelling it is assumed that the proportion of gas and electrical energy demanded for cooking is split equally. Consequently, in this case f Gas =0.5 and f Electricity =0.5.
Where a gas connection is present (i.e. a gas meter is identified by the surveyor), but no gas space or water heating appliances are present, it is assumed that the gas connection is not in use. In these cases 100% of energy demand for cooking is assumed to be met by electricity. No gas standing charge will be applied in the final calculation of fuel cost.

Fuel Poverty Model Documentation
19
Energy CostsTotal energy consumption is given as:
Total energy use (GJ/yr) = ES + EW + EL& A + EC
Where:ES: Energy for space heating;EW: Energy for water heating;EL & A: Energy use for lights and appliances;EC: Energy use for cooking.
Different fuels may be used for some or all of these energy contributions and therefore different tariffs, and in some cases standing charges, must be applied to approximate the total cost of energy to the household as described earlier in the fuel price section.
Total energy cost (£) = £S + £W + £LA + £C + £Standing
Where:£S: Energy cost for space and water heating;£W: Energy cost for water heating; £LA: Energy cost use for lights and appliances;£C : Energy cost use for cooking; £Standing: Standing charges for all fuels.
Space and Water Heating SystemsInformation relating to the heating systems assigned for each dwelling is taken directly from the ‘services.sav’ file (see table 2). The primary heating group, fuel and type are essential for the allocation of the primary heating system and the calculation of energy use for each household. In cases where primary data are missing for the heating systems, information from ‘other heating’ (secondary heating) is used in its place. System efficiencies are determined from SAP [6]. Heating system boiler efficiencies can also be assigned from the SEDBUK database [7] in cases where boiler manufacturer and model details have been completed by the surveyor. SAP efficiencies are used in all other cases.
Information relating to the presence and specification of the water heating system is also located in the ‘services.sav’ file. In the majority of cases the hot water is heated via the space heating system and, where this is the case, the space heating specification will be applied.
Handling Missing Values
Dwelling DataWhere information is required but not available from the form or values are implausible, imputation routines are used and take the form of:-
i) Inferring information from external sources: In many instances it is possible to deduce information by making use of known relationships from other sources. For example, high levels of roof insulation will be installed in newer properties due to building regulations.
ii) Using default data: If information is missing then it can be obtained from what is referred to as ‘default’ data. These data are constructed using

Fuel Poverty Model Documentation
20
national averages from the EHCS. Average floor and window areas, together with other building dimensions from the EHCS stock are summarised in an ‘average’ dataset.
iii) Building age and construction type are also used to impute values where the information is not available from the EHCS form.
Household DataThe number of occupants living in a dwelling and the composition of the household is provided in the interview survey as described in table 2. Data are required for each individual household. If this information is not available then the property is considered to be vacant – the dwelling will not be included for fuel poverty calculations and can be ignored.
ValidationValidation of the fuel poverty energy use and cost outputs is an important process in the delivery of reliable results. The level of validation applied will depend on the level of accuracy quoted, the significance of the indicator, the type of result quoted and the resource provided for the task. Several layers of data validation are applied to the fuel poverty energy use and cost variables. These include cross checking from an independent member of staff, validation through a bespoke model, comparing results against external data sources such as the Energywatch [8] for fuel prices and DUKES [9] for energy use. Additional comparisons are made with the Domestic Energy Factfile [10].
Fuel Poverty Model Documentation
21
References
[1] Sefton, T and Chesshire, J. Peer Review of the methodology for calculating the number of households in fuel poverty in England. http://www.dti.gov.uk/energy/fuel-poverty/methodology-review/index.html
[2] Anon 2001. The Government’s Standard Assessment Procedure for energy rating of dwellings: 2001 edition, BRECSU Report, BRE, Garston, 2001.
[3] Anderson B R, P.F Chapman, N.G Cutland, C. M. Dickson, G. Herderson, J.H. Henderson, P.J. Iles, L. Kosmina and L. D. Shorrock, BREDEM-12 Model Description 2001 update, BRE Report, BRE, Watford, 2001.
[4] Homes for today and tomorrow, Department of the Environment, HMSO 1961.
[5] Estimates of hot water consumption from the 1998 EFUS – Implications for modelling fuel poverty in England, http://www.dti.gov.uk/energy/consumers/fuel_poverty/hot_water_consumption.pdf
[6] Anon 2001. The Government’s Standard Assessment Procedure for energy rating of dwellings: 2001 edition, BRECSU Report, BRE, Garston, 2001.
[7] SEDBUK, Boiler Energy Efficiency Database, http://www.sedbuk.com/index.htm.
[8] Energywatch, http://www.energywatch.org.uk.
[9] DUKES, Digest of United Kingdom Energy Statistics, http://www.dti.gov.uk/energy/inform/dukes
[10] Utley J, Shorrock L & Brown J. Domestic Energy Fact File: http://projects.bre.co.uk/factfile/index.html

Fuel Poverty Model Documentation
22
Appendix A
Acronym Definition
ABU Additional Benefit Unit
ASHE Annual Survey of Hours and Earnings
BRE Building Research Establishment
CHAID Chi-squared Automatic Interaction Detector
CTB Council Tax Benefit
CTC Child Tax Credit
DLA Disability Living Allowance
DTI Department of Trade and Industry
DWP Department of Work and Pensions
EFS Expenditure and Food Survey
EHCS English House Condition Survey
FRS Family Resources Survey
HB Housing Benefit
HOH Head of Household
HRP Household Reference Person
IS Income Support
ISMI Income Support for Mortgage Interest
JSA Jobseekers Allowance
LA Local Authority
MPPI Mortgage Payment Protection Insurance
MVS Market Value Survey
ONS Office of National Statistics
RSL Registered Social Letting
SERPS State Earnings Related Pension Scheme
WFP Winter Fuel Payment
WTC Working Tax Credit

Fuel Poverty Model Documentation
23
Appendix B
INCOME FROM PRIVATE SOURCES Fuel Poverty
BASIC INCOME(FOR EACH HOUSEHOLD)
ADD INCOME FROM BENEFITS & TAX CREDITS
DEDUCT INCOME TAX & NATIONAL INSURANCE
FROM WHOLE SUM
BRING EVERYONE UP TO AT LEAST BASIC INCOME
SUPPORT
IMPUTE MISSING VALUES
ADD ON INCOME FROM SAVINGS
ADD WINTER FUEL PAYMENTS TO THOSE
ELIGIBLE
Fuel PovertyFULL INCOME
(FOR EACH HOUSEHOLD)
INCOMES GIVEN AS NET ARE GROSSED UP - AS ARE NON-
TAXABLE BENEFITS
PBU INCOME(OF HRP AND
PARTNER FOR EACH HOUSEHOLD)
ADD INCOME FROM COUNCIL TAX BENEFIT
DEDUCT COUNCIL TAX FROM ALL HOUSEHOLDS
ADD ALL INCOME FROM OTHER BENEFIT UNITS
ADD INCOME FROM HOUSING BENEFIT
ADD INCOME FROM ISMI
ADD INCOME FROM MPPI

Fuel Poverty Model Documentation
24
Appendix C
FUEL PRICES
PAID(BY EACH
HOUSEHOLD)
GAS PRICES FOR EACH SUPPLY REGION AND METHOD OF PAYMENT
(DTI) MAP ONTO GOV.
REGIONS
MAP ONTO GOV. REGIONS
MAP ONTO GOV.
REGIONS
ELECTRICITY PRICES FOR EACH SUPPLY REGION AND METHOD OF
PAYMENT (DTI)
NON-METERED FUEL PRICES (EXCEPT WOOD) FOR FOUR BROAD REGIONS
(OCTOBER SALKENT REPORTS)
METHODS OF PAYMENT DATA FROM INTERVIEW
SURVEY
METHOD OF PAYMENT ASSIGNED / IMPUTED
FOR UNKNOWN CASES
PRICES PAID FOR METERED FUELS
ASSIGNED BY REGION AND METHOD OF
PAYMENT
PRICES PAID FOR NON-METERED FUELS
ASSIGNED BY REGION
WOOD, EC10, 24HR, COMMUNAL & CHP PRICES
FOLLOWING SAP METHODOLOGY

Fuel Poverty Model Documentation
25
Appendix D
To calculate the annual standing charge proxy per customer:annual standing charge revenue / average number of customers
To calculate the average unit cost for gas and standard electricity:(annual revenue - annual standing charge revenue) / annual consumption
To calculate the average night unit costs:annual night revenue / annual night consumption
To calculate the average day unit costs:(total annual revenue - annual standing charge revenue - annual night revenue) / annual day consumption
Each gas and electricity company submit details on a quarterly basis of every tariff in every region. This includes unit prices, split levels, customer numbers, standing charges and discounts.
Quarterly bills are calculated for each tariff using the appropriate quarterly consumption levels. 30% is consumed in Q4 and Q1, and 20% in Q2 and Q3. For E7, separate day and night bills are calculated as well as an overall bill.
The standing charge proxy is calculated in two steps. Firstly the difference between the 1st and 2nd unit price is calculated, and this is then multiplied by the split level to obtain the standing charge component.
An average annual bill is calculated for each tariff by summing the bills for each quarter. Again, separate day and night bills are calculated for E7 and an overall bill. If data for a tariff is missing in a quarter, for example if there is a new tariff, the bills for the missing quarters are calculated using the data for the available quarters and the appropriate consumption levels.
The actual standing charge, if any, is then added to the standing charge component and any discounts are taken away to give the quarterly standing charge proxy for each tariff.
The average number of customers for each tariff is calculated. If it is a new tariff, the customer numbers for the missing quarters as entered as 0.
The proxy for each tariff is then multiplied by the number of customers to give the quarterly standing charge revenue for each tariff.
The average annual bill is multiplied by the average customer numbers to give the annual revenue.
The quarterly standing charge revenues for each tariff are summed to give the annual standing charge revenue
The annual revenue is summed for each payment type in each region.
The annual standing charge revenue is summed for each payment type in each region.
Fuel Poverty Model Documentation
26
Appendix E
Averages paid by customers in the year 2002(4)(5)
Standing charges proxy (£/year)(1) unit charges (pence/kWh)
Region(2) Creditdirect debit
pre-payment credit
direct debit
pre-payment
East Midlands 47.34 30.27 51.15 1.45 1.39 1.53Eastern 46.46 29.51 51.21 1.46 1.39 1.53North Eastern 46.74 30.05 49.77 1.46 1.40 1.54North Thames 46.34 30.17 51.79 1.46 1.41 1.53North Western 45.89 30.00 51.64 1.46 1.40 1.53Northern 48.08 30.04 51.88 1.47 1.39 1.53South Eastern 48.21 33.22 51.57 1.46 1.37 1.54South Western 48.12 31.60 50.86 1.47 1.39 1.53Southern 47.89 31.90 49.02 1.46 1.38 1.55West Midlands 48.43 30.13 50.52 1.47 1.41 1.53
England(3) 47.27 30.81 50.95 1.46 1.39 1.53Source: DTI quarterly domestic fuels inquiry
Notes:(1) Many companies no longer bill customers for separate standing charges. Instead they charge customers under a two-tier unit price structure with one unit price being charged for the first of a specified number of units each quarter. A second unit price will then be charged for all other units consumed. This proxy for the standing charge is calculated as the difference between the two charges multiplied by the number of units the first is charged at. This method assumes that the threshold for the second unit charge will be reached each quarter.(2) Regions refer to the Local Distribution Zones used for the gas network and do not necessarily follow the boundaries of any other region.
(3) The sum of the regions listed broadly equates to England, although the Local Distribution Zones do not necessarily follow the Welsh and Scottish borders exactly.(4) The figures shown related to gas consumed by customers in the period from Q4 2000 to Q3 2001 (and thus billed to customers during 2001) and are weighted by the number of customers on each tariff.(5) All standing charges and unit prices in this table include VAT at 5 per cent
Fuel Poverty Model Documentation
27
Appendix F
EHCS PHYSICAL & INTERVIEW SURVEYS
DIMENSIONS VARIABLES
FUEL PRICES PAID BY EACH HOUSEHOLD
FUEL POVERTY FUEL COSTS FOR EACH HOUSEHOLD
INPUT FUEL PRICES FOR EACH HOUSEHOLD FROM THE FUEL
PRICE MODEL
BREDEM BASED ENERGY USE FOR:
SPACE & WATER HEATINGLIGHTS & APPLIANCES
COOKING
DEFAULT DATA BREDEM BASED ENERGY USE FOR EACH HOUSEHOLD