Embed Size (px)
Citation preview

fuel moisture. The heating values a t any moisture content can be found from:
QhM = QhO [1-MI M
1-M QlM = [I-MI [QhO - A ( - + 0.09H)l
M = moisture content wet basis (decimal)
QhM = higher heating value at mois- ture content M
QlM = lower heating value at mois- ture content M
QhO = higher heating value at zero moisture (see tables)
X = latent energy of water vapori- zation
H = concentration of hydrogen in the fuel (70 by weight dry basis - see tables)
Higher heating values for the samples analyzed range from 14.56 to 23.28 mega- joules per kilogram (MJ/kg) dry basis. Heating values are proportional to vola- tile concentration and inversely propor- tional to ash content. When higher heating value is expressed on a dry, ash-free ba- sis, the difference between the maximum and minimum values is only 4.84 MJ/kg. Many of the field crop residues and food and fiber processing wastes had high ash contents.
Biomass has high volatile and high oxygen concentrations compared with fossil fuels. The high oxygen results from the lignocellulosic structure of plant tis- sues and is the principal reason for the low heating values of biomass as com- pared with hydrocarbon fuels. Nitrogen concentrations are high in field crop resi- dues, vineyard prunings, and nut hulls. Fuel-bound nitrogen is an important con- tributor to nitrous oxide (NOx) emissions from biomass combustion systems. All fu- els analyzed had low sulfur concentra- tions.
The values in the tables reflect the in- trinsic properties of the fuels as much as possible. We performed the sampling so as to minimize added dirt. The dirt con- tent varies substantially in materials like cotton gin trash, and no single value for ash can describe all possible sources of the fuel. The type of system used to col- lect and handle the fuel may affect the amount of added dirt and the ash content. Added dirt may also change the ash com- position, resulting in increased potential for slag formation. Data in the tables can be used for preliminary design but cannot be substituted for a complete analysis of the intended fuel in making a detailed de- sign. Bryan M. Jenkins is Assistant Professor, and James M. Ebeline is Graduate Research Assistant. &Dart- ment of Agricultural Engineering, Universiiy of California, Davis.
Recen t debates on immigration reform have generated contradictory statements about California's farmworkers. Some ad- vocates of a legal guestworker program contend that most seasonal farmworkers are illegal/undocumented workers who would abandon agriculture for nonfarm jobs if offered an amnesty. Other observ- ers counter that many U.S. citizens and legal immigrants also do seasonal farm work, and that modern personnel prac- tices could attract and retain more such workers.
In August 1983, the University of Cali- fornia and the California Employment Development Department interviewed 1,286 farmworkers throughout the state in an effort to establish an up-to-date pro- file. Each of EDD's 42 farmworker of- fices interviewed 30 workers, selected in a manner to reflect the approximate number and characteristics of field- workers involved in each office area's ag- riculture (detailed survey methodology will be published in a forthcoming Gian- nini Foundation Information Report). The UC-EDD sample provided the most com- prehensive picture of farmworkers since a 1965 California Farmworker Profile re- quested by the state legislature.
Farmworker characteristics Most of the 1,286 farmworkers sur-
veyed in 1983 were immigrants: 80 per- cent were persons born abroad who later
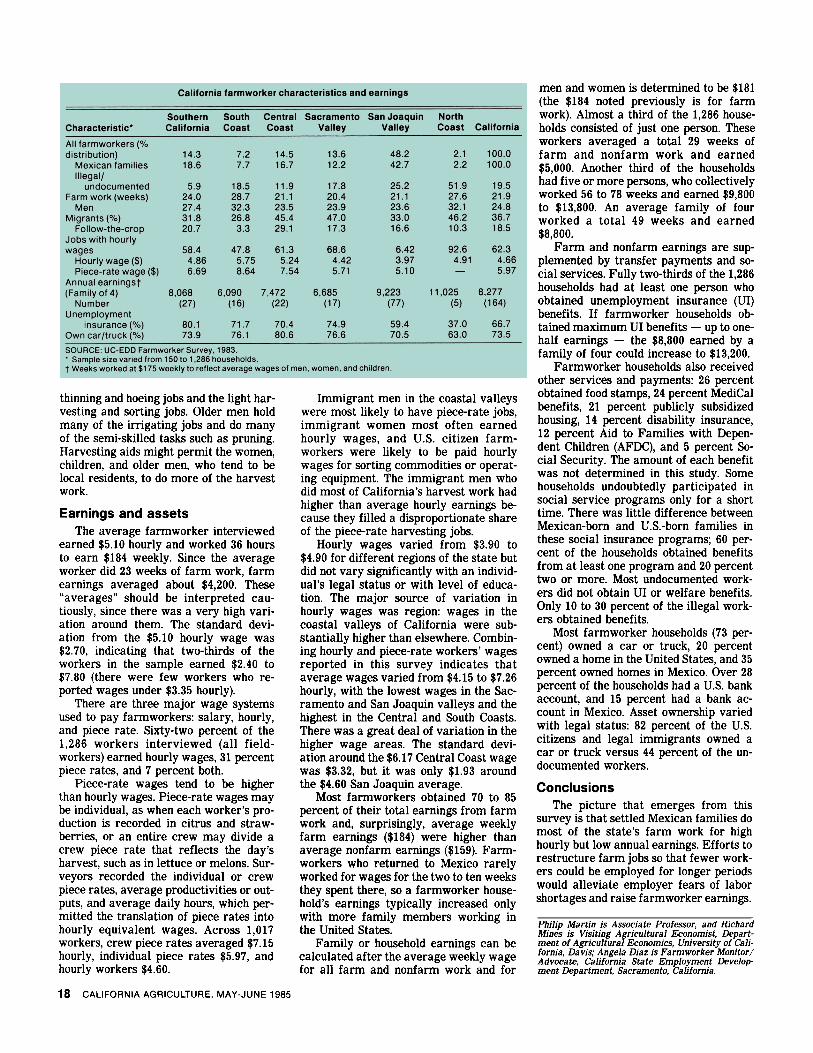
Melon harvest crew in Imperial Valley.
entered the United States. Most of these immigrants - 73 percent - were born and raised in Mexico. US.-born farm- workers (20 percent) and those born in other countries (7 percent) composed the rest of the sample.
Most of the immigrants had green- cards (work and residence documents is- sued by the US. Immigration and Natu- ralization Service), which entitled them to work legally in the United States. The va- lidity of these greencards was not estab- lished by interviewers, so the legal status estimates presented here are minimums. Fully two-thirds of the 1,028 immigrant farmworkers interviewed had green- cards, 25 percent were clearly illegal or undocumented, and 5 percent had their le- gal status pending. Many families headed by legal or undocumented immigrant adults included U.S. citizen children.
A disproportionate number of illegals were young men, and the arduous har- vesting tasks employing young men in cit- rus, grapes, and tree fruits had work forces that were 30 to 50 percent illegal. Illegal workers were not distributed uni- formly around the state; the coastal vege- table areas had fewer illegals than the Central Valley.
Farmworkers had a household size dis- tribution unlike the general work force in California. One-third of the adults inter- viewed lived alone, another third lived in households with five or more members.
16 CALIFORNIA AGRICULTURE, MAY-JUNE 1985

CALIFORNIA FARMWORKERS Percentage Distribution
These large households included 60 per- cent of the total 4,600-person sample pop- ulation (persons interviewed plus spouses and dependents). Almost 50 percent of the 4,600-person sample were children 17 or younger living with their farmworker parents.
The 1,286 adult farmworkers inter- viewed fell into three groups: Mexican- born persons who settled in California with their families (50 percent); Mexican- born men living and working alone in California (25 percent); and farmworker families headed by U.S. citizens (16 per- cent). Each group had unique attributes: settled Mexican families included the le- gal immigrant farmworkers who did over half the state’s farm work; unaccompan- ied Mexican men filled a disproportionate share of the hardest and highest wage piece-rate harvesting jobs; U.S. citizen farmworkers operated much of the farm equipment.
Farm work and migrancy California agriculture generates an
unusually large number of short two- to six-week jobs. This seasonal demand for labor on one farm means that most farm- workers must change employers and tasks (for example, switch from pruning
grapes to thinning peaches) or follow a task around the state, usually by moving from south to north with the harvest, such as from Imperial to Fresno for the melon harvest. Most farmworkers must be flexi- ble about the jobs or tasks they are willing to perform or be migratory to accumu- late a significant number of weeks of work in California’s seasonal agriculture.
There are two types of migrant farm- workers: back-and-forth migrants cross the US. border to work in California agri- culture, while follow-the-crop migrants leave their temporary or permanent U.S. homes overnight to do farm work. About 6 percent of the sample were both back- and-forth and follow-the-crop migrants. A total of 40 percent of the sample were migrants - back-and-forth, follow-the- crop, or both.
Most farmworkers interviewed indi- cated that they were unwilling or unable to change employers frequently or to mi- grate, so they obtained farm work for less than half the year. The average married male in this survey did farm work for 26 weeks, did nonfarm work for 3 weeks, was unemployed 21 weeks, and was out- side the United States 2 weeks. Thus, the most ambitious and committed group of farmworkers was unemployed over 40
percent of the year. Such unemployment rates encourage workers to abandon farm work when they are offered nonfarm jobs. Relatively few of the adult men who did most of California’s farm work found temporary nonfarm jobs. The three most common nonfarm jobs were in services, canninglpacking, and gardeningljanitori- a1 work; the first two are usually filled by women, explaining why married women averaged 4 weeks of nonfarm work annu- ally (versus 2 weeks for men).
Over a 12-month period, adult men (married and single) averaged 25 weeks of farm work, adult women 16 weeks, and farmworker children (14 to 17 years old) 8 weeks. These differences in weeks of farm work mean that a group’s represen- tation in the workforce is not the same as that group’s share of work done; adult men made up two-thirds of the sample but did 74 percent of the farm work.
A similar distinction can be drawn be- tween casual, seasonal, and year-round workers. Casual workers who did less than 12 weeks of farm work represented 34 percent of the sample but contributed only 12 percent of the total farm work. Seasonal workers - 50 percent of the sample - worked 13 to 17 weeks and con- tributed 56 percent of the work. Regular or year-round workers employed 38 or more weeks made up 16 percent of the sample but contributed 32 percent of the farm work.
The difference between a group’s rep- resentation in the work force and its share of the farm work done is important to the calculation of the number of guest- workers that would be needed after an immigration reform. As indicated by this survey, most guestworkers would be men, and an average adult man’s work (25 weeks) is equivalent to that of one adult woman (16 weeks) plus one child (8 weeks). A minimum necessary work force can be calculated by knowing that the 2,230 adult farmworkers in the sample (the 1,286 interviewed plus spouses) con- tributed 49,000 weeks of farm work in 1982-83. If these 49,000 weeks had been contributed by 50-week employees, only 980 workers would have been required. Even at a more realistic 40- and 30-week employees, only 1,225 and 1,633 workers would have been required. Thus, if farm work were reorganized to employ fewer workers longer, the farm work force could be reduced by 27 to 56 percent.
However, there would have to be changes in the tasks normally performed by each group. The survey indicates that young adult men (18 to 35) fill most of the heavy harvesting jobs such as picking cit- rus and tree fruits on ladders and harvest- ing vegetables and melons. Women, chil- dren, and older men fill many of the
CALIFORNIA AGRICULTURE, MAY-JUNE 1985 17
thinning and hoeing jobs and the light har- vesting and sorting jobs. Older men hold many of the irrigating jobs and do many of the semi-skilled tasks such as pruning. Harvesting aids might permit the women, children, and older men, who tend to be local residents, to do more of the harvest work.
Earnings and assets The average farmworker interviewed
earned $5.10 hourly and worked 36 hours to earn $184 weekly. Since the average worker did 23 weeks of farm work, farm earnings averaged about $4,200. These “averages” should be interpreted cau- tiously, since there was a very high vari- ation around them. The standard devi- ation from the $5.10 hourly wage was $2.70, indicating that two-thirds of the workers in the sample earned $2.40 to $7.80 (there were few workers who re- ported wages under $3.35 hourly).
There are three major wage systems used to pay farmworkers: salary, hourly, and piece rate. Sixty-two percent of the 1,286 workers interviewed (all field- workers) earned hourly wages, 31 percent piece rates, and 7 percent both.
Piece-rate wages tend to be higher than hourly wages. Piece-rate wages may be individual, as when each worker’s pro- duction is recorded in citrus and straw- berries, or an entire crew may divide a crew piece rate that reflects the day’s harvest, such as in lettuce or melons. Sur- veyors recorded the individual or crew piece rates, average productivities or out- puts, and average daily hours, which per- mitted the translation of piece rates into hourly equivalent wages. Across 1,017 workers, crew piece rates averaged $7.15 hourly, individual piece rates $5.97, and hourly workers $4.60.
Immigrant men in the coastal valleys were most likely to have piece-rate jobs, immigrant women most often earned hourly wages, and U.S. citizen farm- workers were likely to be paid hourly wages for sorting commodities or operat- ing equipment. The immigrant men who did most of California’s harvest work had higher than average hourly earnings be- cause they filled a disproportionate share of the piece-rate harvesting jobs.
Hourly wages varied from $3.90 to $4.90 for different regions of the state but did not vary significantly with an individ- ual’s legal status or with level of educa- tion. The major source of variation in hourly wages was region: wages in the coastal valleys of California were sub- stantially higher than elsewhere. Combin- ing hourly and piece-rate workers’ wages reported in this survey indicates that average wages varied from $4.15 to $7.26 hourly, with the lowest wages in the Sac- ramento and San Joaquin valleys and the highest in the Central and South Coasts. There was a great deal of variation in the higher wage areas. The standard devi- ation around the $6.17 Central Coast wage was $3.32, but it was only $1.93 around the $4.60 San Joaquin average.
Most farmworkers obtained 70 to 85 percent of their total earnings from farm work and, surprisingly, average weekly farm earnings ($184) were higher than average nonfarm earnings ($159). Farm- workers who returned to Mexico rarely worked for wages for the two to ten weeks they spent there, so a farmworker house- hold’s earnings typically increased only with more family members working in the United States.
Family or household earnings can be calculated after the average weekly wage for all farm and nonfarm work and for
men and women is determined to be $181 (the $184 noted previously is for farm work). Almost a third of the 1,286 house- holds consisted of just one person. These workers averaged a total 29 weeks of farm and nonfarm work and earned $5,000. Another third of the households had five or more persons, who collectively worked 56 to 78 weeks and earned $9,800 to $13,800. An average family of four worked a total 49 weeks and earned $8,800.
Farm and nonfarm earnings are sup- plemented by transfer payments and so- cial services. Fully two-thirds of the 1,286 households had at least one person who obtained unemployment insurance (UI) benefits. If farmworker households ob- tained maximum UI benefits - up to one- half earnings - the $8,800 earned by a family of four could increase to $13,200.
Farmworker households also received other services and payments: 26 percent obtained food stamps, 24 percent Medical benefits, 21 percent publicly subsidized housing, 14 percent disability insurance, 12 percent Aid to Families with Depen- dent Children (AFDC), and 5 percent So- cial Security. The amount of each benefit was not determined in this study. Some households undoubtedly participated in social service programs only for a short time. There was little difference between Mexican-born and US.-born families in these social insurance programs; 60 per- cent of the households obtained benefits from at least one program and 20 percent two or more. Most undocumented work- ers did not obtain UI or welfare benefits. Only 10 to 30 percent of the illegal work- ers obtained benefits.
Most farmworker households (73 per- cent) owned a car or truck, 20 percent owned a home in the United States, and 35 percent owned homes in Mexico. Over 28 percent of the households had a U.S. bank account, and 15 percent had a bank ac- count in Mexico. Asset ownership varied with legal status: 82 percent of the US. citizens and legal immigrants owned a car or truck versus 44 percent of the un- documented workers.
Conclusions The picture that emerges from this
survey is that settled Mexican families do most of the state’s farm work for high hourly but low annual earnings. Efforts to restructure farm jobs so that fewer work- ers could be employed for longer periods would alleviate employer fears of labor shortages and raise farmworker earnings.
Philip Martin is Associate Professor, and Richard Mines is Visitine Aericultural Economist. Deoart- ment of Agriculhrar Economics, University of’cali- fornia, Davis; Angela Diaz is Farmworker Monitor/ Advocate, California State Employment Develop ment Department, Sacramento, California.
18 CALIFORNIA AGRICULTURE, MAY-JUNE 1985