Embed Size (px)
Citation preview
Fuel constraints on New Zealand Economy and Freight Transport: Analysing impacts and Mitigation Options
LANG, Aline; DANTAS, Andre; MOREL, Julien
12th WCTR, July 11-15, 2010 – Lisbon, Portugal
1
FUEL CONSTRAINTS ON NEW ZEALAND ECONOMY AND FREIGHT TRANSPORT: ANALYSING IMPACTS
AND MITIGATION OPTIONS
Aline Lang, Department of Civil and Natural Resources Engineering, University of Canterbury, [email protected]
André Dantas, Department of Civil and Natural Resources Engineering,
University of Canterbury
Julien Morel, Department of Mathematics and Modelling Engineering, Polytech’ Clermont-Ferrand, University of Blaise Pascal
ABSTRACT
In the past few years, there has been convincing evidence of future fuel constraints
due to supply limitations. The failure to address and plan accordingly to the
seriousness of the issue might drastically impact on various national economies
around the world. Nevertheless, there is limited knowledge about the impacts of
reduced fuel availability to the economy and freight transport, which is essentially
overlooked in studies, forecasts and planning. This paper presents the economic
analysis of future fuel availability scenarios using Supply Constraint Input-Output
models. The New Zealand economy is examined and more specifically the freight
transport sector is studied. The paper also investigates potential mitigation options
that could be adopted in terms of changes in technology, infrastructure and policy
actions to promote sustainable freight transport. The results, achieved by the
comparison of different scenarios of fuel constraints and economic growth, indicate
that if no actions were taken to mitigate impacts of fuel constraints, and if they persist
for several years, the total impacts on the fuel, freight transport and all other sectors
would increase significantly and greatly affect the New Zealand economy. In this
backdrop, technological mitigation options to reduce impacts of fuel constraints were
investigated considering New Zealand‘s economy and geography. The analysis
revealed that improvements of the existing technologies are necessary to provide a
positive balance of saved energy.
Keywords: fuel constraints, impacts, economy, freight transport
Fuel constraints on New Zealand Economy and Freight Transport: Analysing impacts and Mitigation Options
LANG, Aline; DANTAS, Andre; MOREL, Julien
12th WCTR, July 11-15, 2010 – Lisbon, Portugal
2
INTRODUCTION
It is widely acknowledged that freight transport systems are dependent on fossil fuels
availability. Goods movement is mainly performed by fuelled engines, predominantly
with petroleum derivatives. Fossil fuel consumption is involved in most of the
processes of the extended supply chain, from the extraction of raw materials to the
final disposal of the produced goods, in particular on the transport stages of the
supply chain. Every day decisions are made, in private and public levels, based on
the assumption that oil and natural gas will remain plentiful and affordable.
However, there are signs of future fuel price increases and shortages. Lately, various
governments have admitted the probability of fuel restrictions in the future (Dunlop,
2007; EIA, 2000; Lee, 2006). Others have also forecasted high likelihoods of
increases in fossil fuel prices due to scarcity effects (IEA, 2008; MED, 2006). In the
past few years, convincing evidence about the global world peak production of
conventional oil (―Peak Oil‖) and the oil depletion issue (Campbell, 1997; Deffeyes,
2001) confirmed future fuel supply restrictions. The data suggests that ―Peak Oil‖ is
likely to happen soon. Despite the uncertainty of when peak oil may happen, a
mapping of all predictions shows the probability of happening at 2015 (or before) is
about 80% (Dantas et al., 2007). Fuel specialists all over the world are completely
convinced that in the next 20 years oil will become more difficult to find, locations will
become more remote, drilling will be deeper and prices will rise, making cheap oil
disappear (Lee, 2006). Additionally, the levels of carbon dioxide emissions and green
house gases in atmosphere became an evident issue after the Kyoto Protocol. The
solution for both problems is pointed to an urgent decrease of fossil fuel
consumption, by means of shortages (Peak Oil) or reduction policies (Climate
Change).
Despite the high risk of fuel constraints, there is limited knowledge about their real
impacts. Passenger transport has received plenty of attention and some progress is
noticed in this area (Krumdieck et al., 2010; Schafer, 2000). Although freight is still
less than passenger transport in terms of total energy usage and kilometres travelled,
the growth in freight has been dramatic. Predictions anticipate that the energy use for
freight transport will exceed that for people travel on a world-wide basis in the year
2020 (WEC, 1995). Even though there has been considerable interest in the
European Union to decouple freight transport and economic growth (Kveiborg and
Fosgerau, 2007; McKinnon, 2007; Schleicher-Tappeser et al., 1998), freight transport
is still mostly neglected by planning and policy making, and little genuine progress is
observed.
Some scholars‘ efforts have focused in addressing the freight transport energy issues
and presenting alternatives to reduce the freight fuel consumption (Ang-Olson and
Schroeer, 2002; McKinnon, 1999). Researchers have also analysed how the road
freight sector can rapidly save oil during a supply emergency, but do not include any
quantitative assessment of policy measures (Noland and Wadud, 2009). However,
Fuel constraints on New Zealand Economy and Freight Transport: Analysing impacts and Mitigation Options
LANG, Aline; DANTAS, Andre; MOREL, Julien
12th WCTR, July 11-15, 2010 – Lisbon, Portugal
3
the overall impact of reduced fuel availability on the freight transport sector and the
economy has never been comprehensively evaluated. This lack of a systematic
assessment of economic impacts contributes to a disregard of freight in the regional
transportation planning (Seetharaman et al., 2003).
The approach taken in this paper is focused on long-term continuous fuel shortages
and assumes that the future of world oil supply is more critical than the challenges
imposed by climate change. Without adequate energy supply, the world will not be
able to cope with the negative effects of climate change (Lightfoot, 2006).
Additionally, it is more likely that reductions in fuel availability will happen before
effective policies to reduce fuel consumption are instituted as the effects of climate
change become more pronounced. Recent disruptions to fuel supply, such as the
fuel protests of 2000 in the UK, have confirmed their heavy impact on the economy
and people‘s well-being and indicates a lack of resilience and preparation (Lyons and
Chatterjee, 2002). However, there is little knowledge on the quantitative impact
measures of fuel constraints to economy. Some have argued that there is a 1:1
relationship between percent decline in world oil supply and percent decline in world
GDP (Hirsch, 2008), but this is not realistically proved.
This paper introduces a method to estimate the broader impacts of fuel constraints to
the freight transport and the economy. A supply constraint Input-Output analysis is
used to model the relationship between scenarios of fuel constraint and economic
impacts. The New Zealand economy is studied and more specifically the freight
transport sector is investigated. In the end of this paper mitigation options of vehicle
and energy technologies for the New Zealand freight transport system are examined,
based upon the options‘ energy consumption and implementation costs.
METHOD
Economic impact analysis is used to measure changes in economic activity resulting
from specific program or projects (Hudson, 2001). It estimates potential economic
benefits of interventions and helps in determining best value projects. It has been
widely used in transportation decision making due to its ability to systematically
quantify impacts to different kinds of resources, including scarce and valued
resources.
There are many techniques to analyse economic impacts and they can be divided in
partial equilibrium models and general equilibrium models. General equilibrium
models take into account the interrelationship between sectors and markets. They
have an appropriate framework to conduct economic impact analysis. Among the
available techniques to apply general equilibrium models, Input-Output (I-O) models
have the smaller data requirements. They also suit well this research‘s objectives
and do not involve a great number of secondary data. Moreover, there are many
Fuel constraints on New Zealand Economy and Freight Transport: Analysing impacts and Mitigation Options
LANG, Aline; DANTAS, Andre; MOREL, Julien
12th WCTR, July 11-15, 2010 – Lisbon, Portugal
4
commercially available I-O models and they have been widely applied to
transportation analysis.
Input-Output Analysis
Input-output model, developed by the Nobel Prize winner Wassily Leontief, is a well
established technique to undertake an economic impact analysis. It is, in fact, the
most commonly used tool to do such analysis. Within an I-O model, each industrial
sells its output to other sectors and buys inputs from the other sectors (Seetharaman
et al., 2003). Its popularity is based on the ability to not only compute the direct
effects of a project, but also to estimate secondary indirect and induced effects,
through inter-dependence relationships among sectors (Seetharaman et al., 2003).
Among the different variations of I–O analysis, the supply constraint or mixed I-O
model was selected. It was initially proposed by Stone (1961) to improve the
evaluation of economic impacts in a case of supply constraint. Mixed I-O was
designed to trace the economic implications of a reduction in productive capacity on
one or more industries of the final demand. It is based on the purchase coefficients
A , which shows how one sector is dependent on the others, calculating how much
each sector needs to purchase from the other sectors to produce one dollar of
output.
The mixed I-O approach allows the final demand of the constrained sectors and the
gross output of the remaining sectors to be specified exogenously. The model is then
partitioned in constrained and unconstrained sectors; represented by the indexes r
and s , respectively. The new outputs of the unconstrained sectors ( sX ) and the final
demands of the constrained sectors ( rY ) are estimated by Equations 1 and 2. To do
so, it is necessary to specify the values for the outputs of the constrained sector ( rX )
and final demands of the unconstrained sectors ( sY ).
)()1( 1srsrsss YXAAX
(1)
srsrrrr XAXAY )1( (2)
Where,
ssA = direct requirement matrix of transactions between the s unconstrained
industries;
srA = direct requirement matrix of coefficients of inputs by the s unconstrained
industries of the r constrained industries outputs;
rsA = direct requirement matrix of coefficients of inputs by the r constrained
industries of outputs by the s unconstrained industries; and
rrA = direct requirement matrix of transactions between the r constrained
industries.
Fuel constraints on New Zealand Economy and Freight Transport: Analysing impacts and Mitigation Options
LANG, Aline; DANTAS, Andre; MOREL, Julien
12th WCTR, July 11-15, 2010 – Lisbon, Portugal
5
Model Assumptions
The assumptions that support this model are an unchanged matrix of purchase
coefficients, and unchanged vector of final demand for the unconstrained sectors.
The first assumption means that the input distribution patterns are constant in an
economic system even after an initial constraint, and the second assumption implies
that the unconstrained sectors will keep the same level of sales to final markets
(households, government, private investments and exports). Even though earlier
applications of the model have not indicated any problems regarding its use and
have validated the technique (Davis and Salkin, 1984; Giarratani, 1976; Hubacek and
Sun, 2001; Subramanian and Sadoulet, 1990), these assumptions underpin some of
the model‘s limitations.
The first assumption indicates that there would be no input substitution and
technology change, which are likely to occur as a result of an increase in fuel prices
relative to other inputs. However, input substitutions and technological innovations
take a long time to be developed and implemented. The second assumption
suggests that the final demand of products would remain constant even after a fuel
constraint, meaning that there would be no substitution effects (buying less fuel and
more of other commodities, because the relative price of fuel rises) or income effects
(changing households consumption pattern in face of having less money available to
spend in total due to higher fuel costs).
These assumptions are particularly concerning, if the objective is to study impacts of
increases in fuel prices. This paper, though, aims to analyse the impacts of peak oil
translated as a reduction in the availability of fuel to the production processes, as
stated before. It is expected that a reduction in fuel quantity would lead to an
increase in fuel prices, at a rate determined by the price elasticity of supply (normal
supply-demand behaviour).
However, oil prices have oscillated widely over the last few years, and mostly in
response to short term factors such as wars, crisis, natural disasters and
speculations (Williams, 2008). Amongst these causes, probably the most relevant are
the geopolitical tensions and uncertainties in the OPEC‘s countries (Brook et al.,
2004) and the natural disasters, which are almost unpredictable. The previous
attempts to model future fuel prices have failed to predict fuel prices for one year
ahead (for a summary of these forecasts see Donovan et al. (2008)). Also, most of
these models forecast that future fuel prices will remain almost constant in the next
20 years, around USD 100/barrel. Surely the future of fuel prices is highly
unpredictable.
On one hand, price fluctuations are considerably important and there are many
interesting discussions on this topic (Davis and Haltiwanger, 2001; Hamilton, 2003;
Jiménez-Rodríguez and Sanchez, 2005; Keane and Prasad, 1996) . Jones et
Fuel constraints on New Zealand Economy and Freight Transport: Analysing impacts and Mitigation Options
LANG, Aline; DANTAS, Andre; MOREL, Julien
12th WCTR, July 11-15, 2010 – Lisbon, Portugal
6
al.(2004) summarized many theoretical and empirical developments in the
understanding of the macroeconomic consequences of oil price shocks. They are:
Positive and negative oil shocks generate asymmetric impacts and intra- and
inter-sectoral reallocations of labour, noted only in highly disaggregated
models;
Post oil shock recessionary movements of GDP are largely attributable to the
oil prices and could not been avoided by alternative monetary policies;
There is a stable, nonlinear, relationship between oil price shocks and GDP,
but this relationship has been weakened with time and it is quite complex to
estimate;
The extent to which an oil shock impacts on GDP is around -0.055, as an oil
price-GDP elasticity. Thus, a 10% fuel price high of 3 years would cause the
GDP to reduce about 0.55% in a two year period; and
There is still much to learn concerning price changes and economic impacts,
and that there are many contradictory results that need further examination.
On the other hand, supply constraints are more effective to motivate behavioural
changes than fuel prices rises, because people prefer functionality over feasibility
(Krumdieck et al., 2004). Thus, the discussion on how prices will behave when fuel
constraints occur and how fuel prices will impact on the economy and transport
system is likely to become a fierce debate, which is not of the interest of this paper.
Also, despite the existence of many studies about the impacts of fuel price shocks,
the effects of supply variations have not been broadly covered. Therefore, the
approach taken in this paper is to examine the effect of supply constraints, ignoring
fuel price increases or assuming that fuel prices would remain constant.
ANALYSING FUEL SUPPLY CONSTRAINTS ON NEW ZEALAND
When ―Peak Oil‖ happens, there will be no excess capacity on the economy, neither
there will be a perfect substitute to fuel in a short or medium term. Available
renewable energy sources, such as solar, wind and biofuels will not produce enough
energy to economically and environmentally substitute the use of traditional fossil
fuels (Lightfoot, 2006). Also, the reduced fuel supply will not be instantly adjusted
within the economic system. A likely scenario would be the continuous consumption
of fuel stocks which will be quickly extinct. Subsequently the production of the other
sectors will be affected. Finally, the reduced production of goods and services will
impact on the whole economic system.
The mixed I-O model accounts for economic impacts in cases of supply constraints
and assumes that supply is inelastic for some sectors (Miller and Blair, 1985). It
considers the sector that is causing the disruption as exogenous to the system. After
Fuel constraints on New Zealand Economy and Freight Transport: Analysing impacts and Mitigation Options
LANG, Aline; DANTAS, Andre; MOREL, Julien
12th WCTR, July 11-15, 2010 – Lisbon, Portugal
7
estimating the reduction on the constrained sector it can then calculate the impacts
on the unconstrained sectors.
Context
New Zealand was chosen as a case study to analyse fuel constraint impacts due to a
number of reasons. The country is mall and isolated, extremely reliant on fossil fuels.
The nation is greatly dependent on international trade, mainly with Australia, the USA
and Japan. Also, there are not many options to shift from traditional fuels, for
instance biofuels. In addition, because of the country geography, the rail and
maritime networks are underused. At last, 95% of fossil fuels used internally are
imported from three main locations: the Middle East, the Far East and Australia.
Thus, instabilities in fuel supplies in these places would probably cause disruptions to
the national economy.
The current distribution of goods in New Zealand is mostly made by roads. In
2006/2007 approximately 92% of tonnage and 70% of tonne-km is transported by the
roading network. Rail has 6% of tonnage and 15% of tonne-km, and coastal shipping
has a corresponding share of 2% of tonnage and 15% of tonne-km (Paling, 2009).
New Zealand has become particularly reliant on cheap air travel. The primary
industries are agriculture, forestry, milk and livestock. These four industries have a
significant share of total freight movements, corresponding to approximately 25% of
the total tonne-km. The economy is also tourism based.
The trip-end-estimated total freight in tonnes occurs over 71% in North Island. Only
the regions of Auckland, Waikato, Bay of Plenty and Manawatu-Wanganui
correspond to more than 50% of tonnage. There are several courier and freight
companies spread throughout the country and the goods distribution system is
considered inefficient, mostly in terms of delays and operational costs; and
unsustainable.
The Transaction Table
In an Input-Output analysis, New Zealand‘s economy is represented by its
transaction table. The original table of 54 industries of the year 2005/2006 was
consolidated into seven industries, three final-payments sectors (households, other
payments and imports), and three final-demand sectors (private consumption, other
local final demand and exports) to facilitate reproduction and analysis, as depicted in
Table 1. Furthermore, the table was roughly updated to the year 2009 considering
the national accounts and other statistical data (Infometrics, 2009; SNZ, 2009). It was
considered that the technology available in 2006 is the same as the currently
available.
Fuel constraints on New Zealand Economy and Freight Transport: Analysing impacts and Mitigation Options
LANG, Aline; DANTAS, Andre; MOREL, Julien
12th WCTR, July 11-15, 2010 – Lisbon, Portugal
8
The freight transport sector includes road freight, rail and water transport. Air
transport and transport services, and passengers transport were added to the service
sector, which incorporate all services sectors plus finance and insurance,
government and administration, defence, and education. The fuel sector embraces
oil and gas extraction, production and distribution; petroleum refining and product
manufacturing. Sector 3 (Supply and Construction) denotes the construction sector
combined with electricity generation, electricity transmission and distribution, water
supply, sewerage, drainage and waste disposal services. Trade (sector 4) embraces
wholesale and retail trade, as well as accommodation, cafes and restaurants. The
other industries were grouped according to the 1996 ANZSIC (Australian and New
Zealand Standard Industrial Classification).
Fuel constraints on New Zealand Economy and Freight Transport: Analysing impacts and Mitigation Options LANG, Aline; DANTAS, Andre; MOREL, Julien
12th WCTR, July 11-15, 2010 – Lisbon, Portugal
9
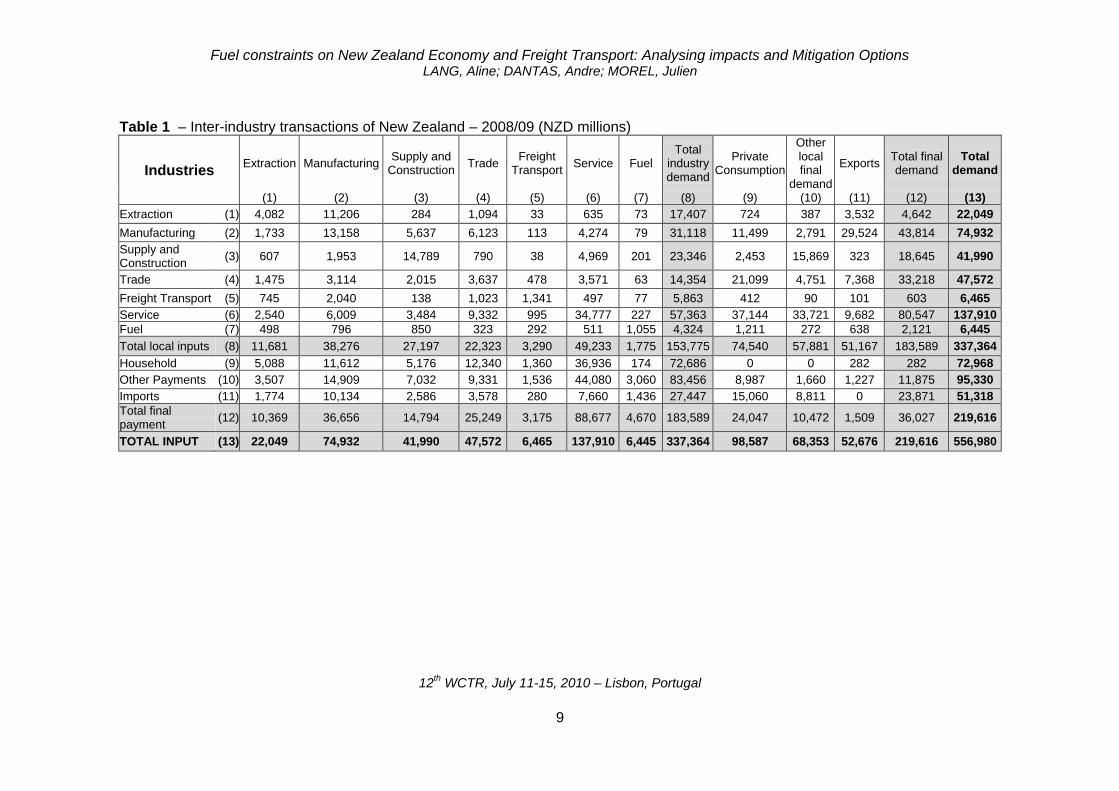
Table 1 – Inter-industry transactions of New Zealand – 2008/09 (NZD millions)
Industries Extraction Manufacturing
Supply and Construction
Trade Freight
Transport Service Fuel
Total industry demand
Private Consumption
Other local final
demand
Exports Total final demand
Total demand
(1) (2) (3) (4) (5) (6) (7) (8) (9) (10) (11) (12) (13)
Extraction (1) 4,082 11,206 284 1,094 33 635 73 17,407 724 387 3,532 4,642 22,049
Manufacturing (2) 1,733 13,158 5,637 6,123 113 4,274 79 31,118 11,499 2,791 29,524 43,814 74,932
Supply and Construction
(3) 607 1,953 14,789 790 38 4,969 201 23,346 2,453 15,869 323 18,645 41,990
Trade (4) 1,475 3,114 2,015 3,637 478 3,571 63 14,354 21,099 4,751 7,368 33,218 47,572
Freight Transport (5) 745 2,040 138 1,023 1,341 497 77 5,863 412 90 101 603 6,465
Service (6) 2,540 6,009 3,484 9,332 995 34,777 227 57,363 37,144 33,721 9,682 80,547 137,910
Fuel (7) 498 796 850 323 292 511 1,055 4,324 1,211 272 638 2,121 6,445
Total local inputs (8) 11,681 38,276 27,197 22,323 3,290 49,233 1,775 153,775 74,540 57,881 51,167 183,589 337,364
Household (9) 5,088 11,612 5,176 12,340 1,360 36,936 174 72,686 0 0 282 282 72,968
Other Payments (10) 3,507 14,909 7,032 9,331 1,536 44,080 3,060 83,456 8,987 1,660 1,227 11,875 95,330
Imports (11) 1,774 10,134 2,586 3,578 280 7,660 1,436 27,447 15,060 8,811 0 23,871 51,318
Total final payment
(12) 10,369 36,656 14,794 25,249 3,175 88,677 4,670 183,589 24,047 10,472 1,509 36,027 219,616
TOTAL INPUT (13) 22,049 74,932 41,990 47,572 6,465 137,910 6,445 337,364 98,587 68,353 52,676 219,616 556,980
Fuel constraints on New Zealand Economy and Freight Transport: Analysing impacts and Mitigation Options
LANG, Aline; DANTAS, Andre; MOREL, Julien
12th WCTR, July 11-15, 2010 – Lisbon, Portugal
10
As shown in Table 1, New Zealand‘s economy is dominated by the service and
manufacturing industries, together they represent more than 63% of the total economy. Even
though, New Zealand is not a major manufacturing economy comparing to other international
patterns. Other representative sectors are sector 4 and 3. But the final demand and final
payment sectors (12) are predominant.
It was considered that Table 1 represents the most efficient technology to produce the goods
and services in New Zealand and that it cannot be quickly changed. Therefore, it is assumed
that the purchase coefficients will remain constant (or optimal) even if there are variations in
the composition of final demand in the near future.
The Fuel Constraints
The exact fuel constraint to be caused by peak oil is still uncertain. Past oil crisis, such as the
Iranian revolution, the Persian Gulf War and the Suez Crisis had a reduction of world oil
output of between 7.2% and 10.1% (Hamilton, 2003). To determine the real fuel constraint of
peak oil, it would be necessary to know the exact world oil‘s reserves. However, OPEC‘s true
reserves are unknown (Tverberg, 2008). The constraint analysed here is assumed as a
disruption on the main New Zealand fuel supplies and an international oil scarcity. The entire
fuel sector of New Zealand is considered to be affected, and the reduction on the supply of
the sector is initially set to 10%. A key assumption of the model would be that the reduction
of supply on the constrained sector would be evenly distributed to all purchases of that sector
from other sectors. So, the fuel sector would sell 10% less to all other sectors. The final
demands of the non-constrained sectors would remain stable after the fuel constraint
Thus, the total output of the fuel sector would be subject to a 10% reduction, which is
equivalent to rX equal 0.9 multiplied by New Zealand Dollars (NZD) 6,445 million. This
reduction on total output of the fuel sector would represent an initial 0.12% decrease in the
total economy‘s output.
The Impacts
Using Equations 1 and 2, impacts were calculated for the unconstrained sectors and for the
national economy. Considering a fixed purchase coefficient, a transaction table for after fuel
constraints was computed, as shown in Table 2.

Fuel constraints on New Zealand Economy and Freight Transport: Analysing impacts and Mitigation Options
LANG, Aline; DANTAS, Andre; MOREL, Julien
12th WCTR, July 11-15, 2010 – Lisbon, Portugal
11
Table 2 – New Zealand Transactions after Fuel Supply Constraints (NZD million)
Industries (1) (2) (3) (4) (5) (6) (7) (8) Final
Demand (12)
Total Output
(13)
(1) 4,080 11,203 284 1,094 33 635 65 17,394 4,642 22,036
(2) 1,732 13,154 5,632 6,122 113 4,273 71 31,097 43,814 74,911
(3) 607 1,952 14,776 790 38 4,967 181 23,310 18,645 41,955
(4) 1,474 3,113 2,013 3,636 478 3,570 57 14,342 33,218 47,560
(5) 744 2,039 138 1,023 1,339 497 70 5,851 603 6,454
(6) 2,538 6,007 3,481 9,330 993 34,766 204 57,319 80,547 137,866
(7) 498 796 849 322 292 511 949 4,217 1,584 5,800
(8) 11,673 38,265 27,174 22,317 3,284 49,218 1,598 153,529 183,052 336,581
Final Payments
(12) 10,362 36,646 14,781 25,242 3,170 88,648 4,203 183,052 36,027 219,079
Total Input (13)
22,036 74,911 41,955 47,560 6,454 137,866 5,800 336,581 219,079 555,660
The 10% reduction on total output of the fuel sector would initially cause a 25.3% decrease
of its final demand, from NZD 2.1 billion to NZD 1.6 billion. This change would affect the non-
constrained sectors, because fuel is an input factor to all other industry sectors. Thus, non-
constrained sectors would reduce their total outputs due to backward linkages, which would
affect the entire economy. Comparing the total input of New Zealand before and after the
constraint, the cutback would be of NZD 1.3 billion. This corresponds to a 0.24% contraction
of the total economy. This might seam insignificant, but the absolute value corresponds to
more than the entire coal mining and other mining and quarrying sectors‘ output
(consolidated into the extraction sector).
The reductions of output of the unconstrained sectors would not be too significant in absolute
and relative value terms. In relative terms the mostly affected sector (excluding fuel) would
be the freight transport sector with a reduction of 0.18%, because freight transport is highly
dependent on fossil fuels. However, in absolute values the freight transport sector would
have the smallest reduction in the total output (only NZD 12 million). This is due to the freight
sector‘s small share on the total money flow of the economy. On the other hand, the service
sector would have the second highest output decrease in absolute values (NZD 44 million),
but it would be subject to a small percentage reduction. This is because the service sector
has considerable participation on the total output of the economy, but it has limited exposure
to changes in the fuel sector.
Sector 3 (construction and supply) would have the second largest percentage reduction.
Probably this is explained by the sectors‘ direct backward linkage to the fuel sector, as
electricity generation can be reliant on fuels. It is also observed that the trade sector would
have a contraction in absolute values smaller than the extraction sector, even though trade is
more than twice bigger than extraction. This is because the extraction sector has high levels
of fuel consumption. the service sector would have the smallest percent decline, even though
it has the most expressive total input of the endogenous sectors. This is explained by the fact
that fuel is not a significant input to the service sector. Hence, the economic contraction of
sectors is related to the interdependency each sector has with the fuel sector and vice-versa.
Fuel constraints on New Zealand Economy and Freight Transport: Analysing impacts and Mitigation Options
LANG, Aline; DANTAS, Andre; MOREL, Julien
12th WCTR, July 11-15, 2010 – Lisbon, Portugal
12
Some inferences could be drawn by observing the economic structure of New Zealand
regarding the allocation of the impacts to the final demand sectors. The fuel‘s final demand
was the only one affected by the fuel constraints, due to the model assumptions. This final
demand includes exports of fuel; household consumption of fuel (heat houses, fuel cars and
other domestic uses); and other local final demand, which comprise government
consumption, stock change and gross investment. Considering that unfinished projects
would likely continue even after an initial reduction in fuel supply, plans for other investments
would not immediately change and government expenditures would continue as planed
beforehand. It can be argued that government consumption and investments would have the
smallest reductions of output. On the other hand, the stocks probably would have greater
reductions in comparison to the previous year changes. This would reduce the risks of
maintaining high fuel stocks during a shortage. Thus, it is plausible that the exports and
private consumption of fuel would be the most affected final demand sectors. Due to
international scarcity of fuel, the exports would probably be reduced to zero to protect the
internal market. Also, the household consumption of fuel would be significantly reduced,
since domestic consumption generally has a higher capacity to adapt than industry demand.
It is likely people would become more thoughtful on the number and distance of car trips, and
shift to other forms of energy to maintain their lifestyle.
All the analyses done so far were for an open economy. If the households sector were
included as an endogenous sector, a common practice in many cases, the impacts would be
significantly bigger. . Closing New Zealand economy with respect to households and
imposing the same 10% fuel constraint would cause the total economy to decline by 11.2%.
The exalted impacts in the closed economy are explained by the fundamental role household
plays in buying outputs of the entire economy and are also related to the fact that this model
is highly aggregated.
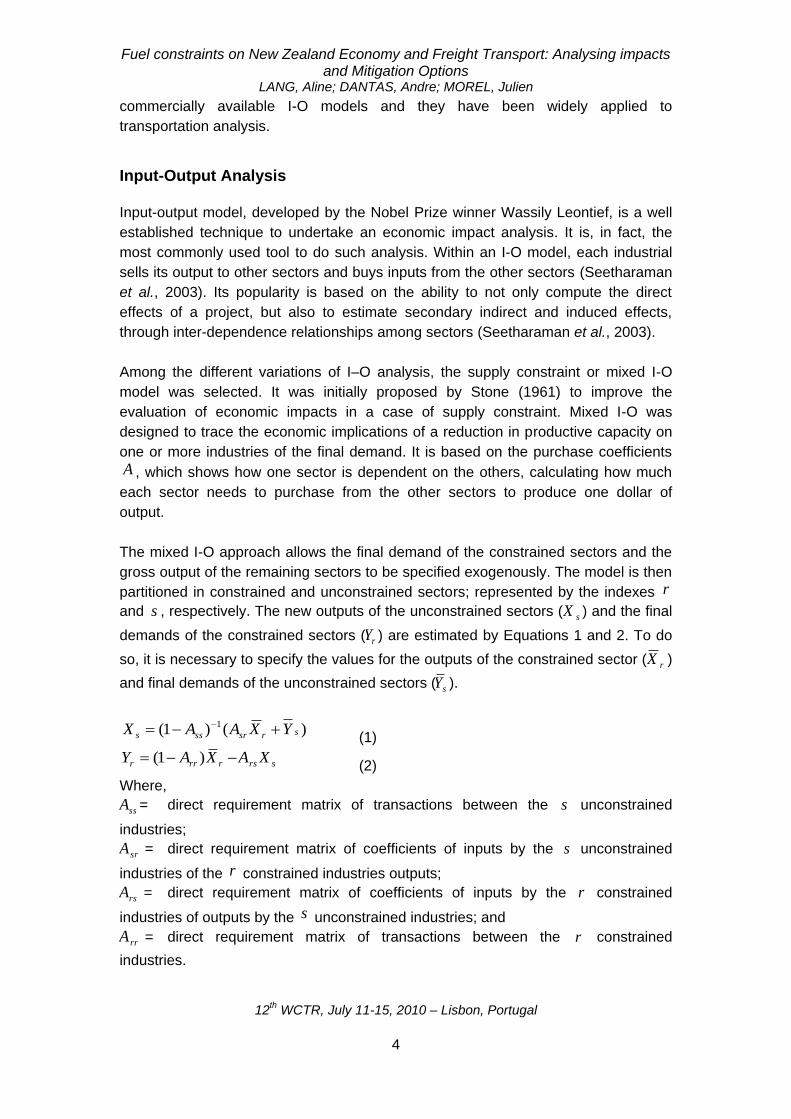
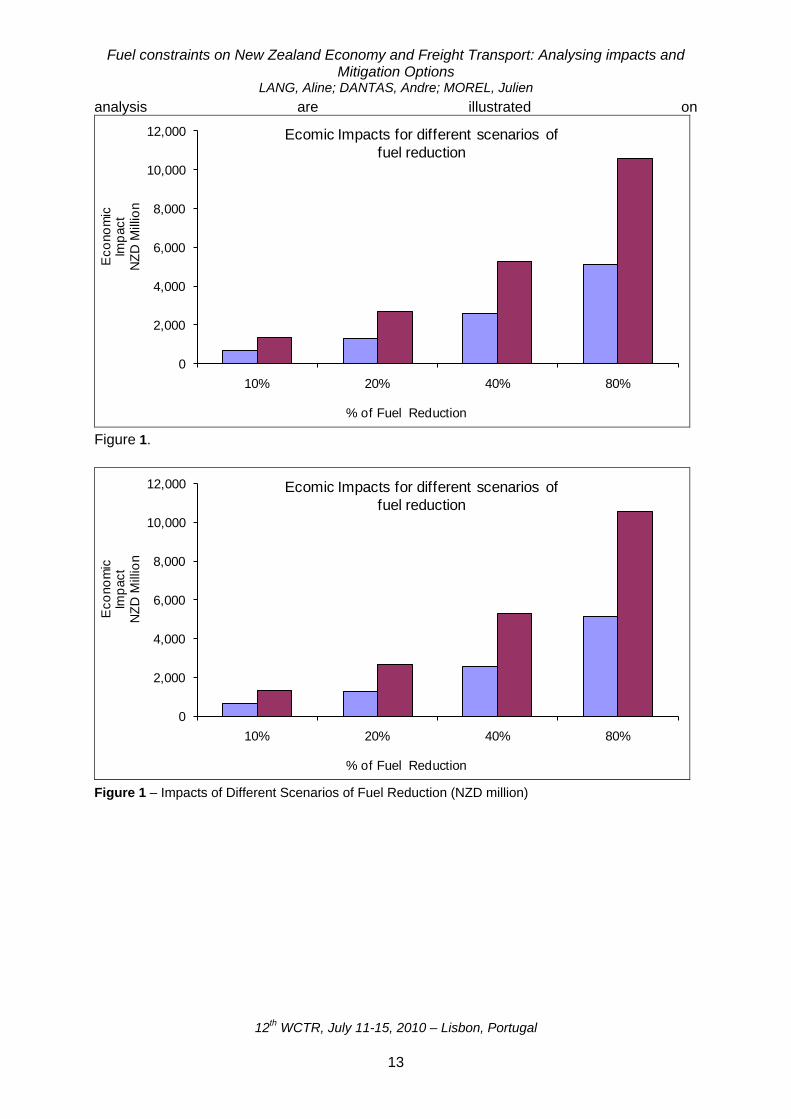
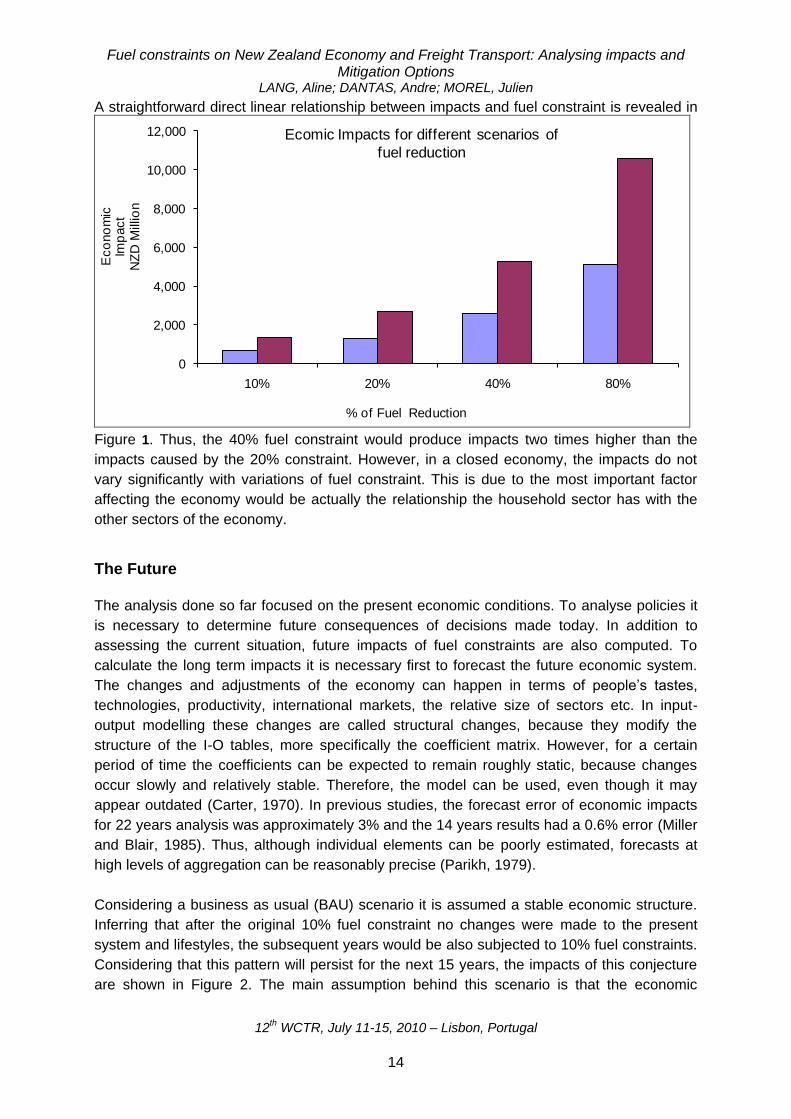
Finally, it is useful to perform a sensitivity analysis of the model to different fuel constraints.
Scenarios of fuel constraints were investigated, 20%, 40% and 80% reductions of fuel
availability were compared to the previous 10% reduction. The results of the sensitivity
Fuel constraints on New Zealand Economy and Freight Transport: Analysing impacts and Mitigation Options
LANG, Aline; DANTAS, Andre; MOREL, Julien
12th WCTR, July 11-15, 2010 – Lisbon, Portugal
13
analysis are illustrated on
0
2,000
4,000
6,000
8,000
10,000
12,000
10% 20% 40% 80%
Eco
no
mic
Im
pact
NZ
D M
illio
n
% of Fuel Reduction
Ecomic Impacts for different scenarios of
fuel reduction
Figure 1.
0
2,000
4,000
6,000
8,000
10,000
12,000
10% 20% 40% 80%
Eco
no
mic
Im
pact
NZ
D M
illio
n
% of Fuel Reduction
Ecomic Impacts for different scenarios of
fuel reduction
Figure 1 – Impacts of Different Scenarios of Fuel Reduction (NZD million)
Fuel constraints on New Zealand Economy and Freight Transport: Analysing impacts and Mitigation Options
LANG, Aline; DANTAS, Andre; MOREL, Julien
12th WCTR, July 11-15, 2010 – Lisbon, Portugal
14
A straightforward direct linear relationship between impacts and fuel constraint is revealed in
0
2,000
4,000
6,000
8,000
10,000
12,000
10% 20% 40% 80%
Eco
no
mic
Im
pact
NZ
D M
illio
n
% of Fuel Reduction
Ecomic Impacts for different scenarios of
fuel reduction
Figure 1. Thus, the 40% fuel constraint would produce impacts two times higher than the
impacts caused by the 20% constraint. However, in a closed economy, the impacts do not
vary significantly with variations of fuel constraint. This is due to the most important factor
affecting the economy would be actually the relationship the household sector has with the
other sectors of the economy.
The Future
The analysis done so far focused on the present economic conditions. To analyse policies it
is necessary to determine future consequences of decisions made today. In addition to
assessing the current situation, future impacts of fuel constraints are also computed. To
calculate the long term impacts it is necessary first to forecast the future economic system.
The changes and adjustments of the economy can happen in terms of people‘s tastes,
technologies, productivity, international markets, the relative size of sectors etc. In input-
output modelling these changes are called structural changes, because they modify the
structure of the I-O tables, more specifically the coefficient matrix. However, for a certain
period of time the coefficients can be expected to remain roughly static, because changes
occur slowly and relatively stable. Therefore, the model can be used, even though it may
appear outdated (Carter, 1970). In previous studies, the forecast error of economic impacts
for 22 years analysis was approximately 3% and the 14 years results had a 0.6% error (Miller
and Blair, 1985). Thus, although individual elements can be poorly estimated, forecasts at
high levels of aggregation can be reasonably precise (Parikh, 1979).
Considering a business as usual (BAU) scenario it is assumed a stable economic structure.
Inferring that after the original 10% fuel constraint no changes were made to the present
system and lifestyles, the subsequent years would be also subjected to 10% fuel constraints.
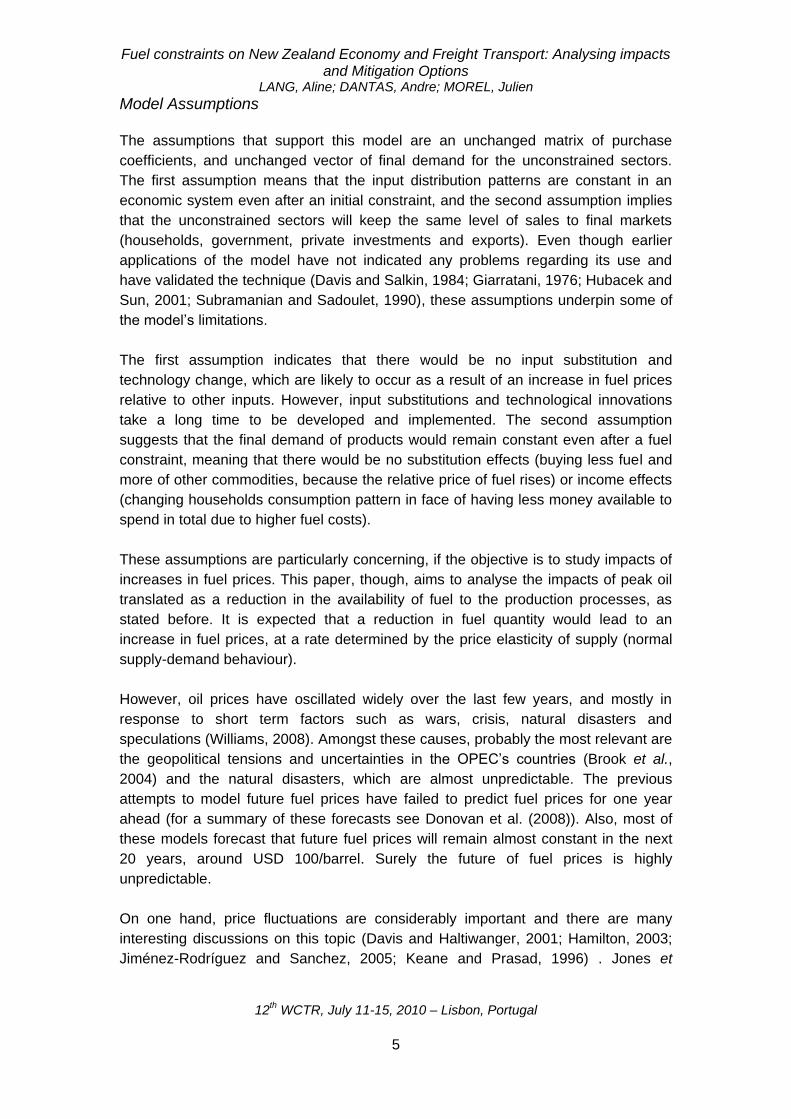
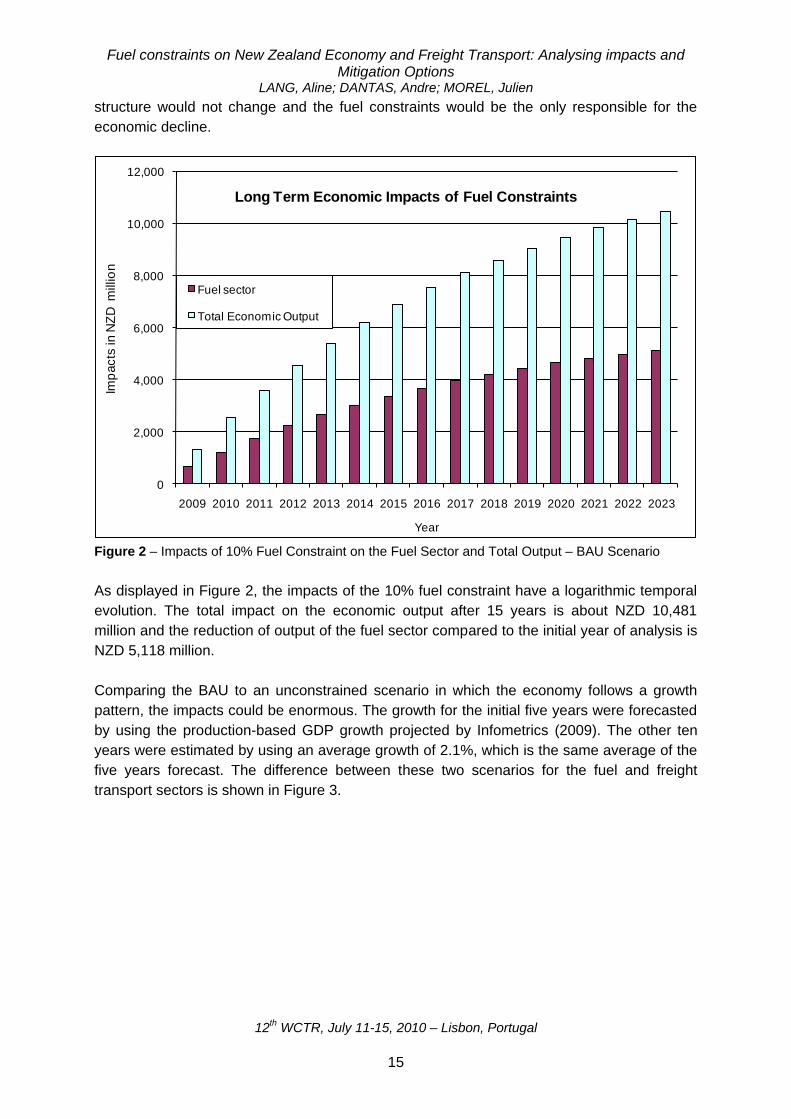
Considering that this pattern will persist for the next 15 years, the impacts of this conjecture
are shown in Figure 2. The main assumption behind this scenario is that the economic
Fuel constraints on New Zealand Economy and Freight Transport: Analysing impacts and Mitigation Options
LANG, Aline; DANTAS, Andre; MOREL, Julien
12th WCTR, July 11-15, 2010 – Lisbon, Portugal
15
structure would not change and the fuel constraints would be the only responsible for the
economic decline.
0
2,000
4,000
6,000
8,000
10,000
12,000
2009 2010 2011 2012 2013 2014 2015 2016 2017 2018 2019 2020 2021 2022 2023
Imp
acts
in N
ZD
mill
ion
Year
Long Term Economic Impacts of Fuel Constraints
Fuel sector
Total Economic Output
Figure 2 – Impacts of 10% Fuel Constraint on the Fuel Sector and Total Output – BAU Scenario
As displayed in Figure 2, the impacts of the 10% fuel constraint have a logarithmic temporal
evolution. The total impact on the economic output after 15 years is about NZD 10,481
million and the reduction of output of the fuel sector compared to the initial year of analysis is
NZD 5,118 million.
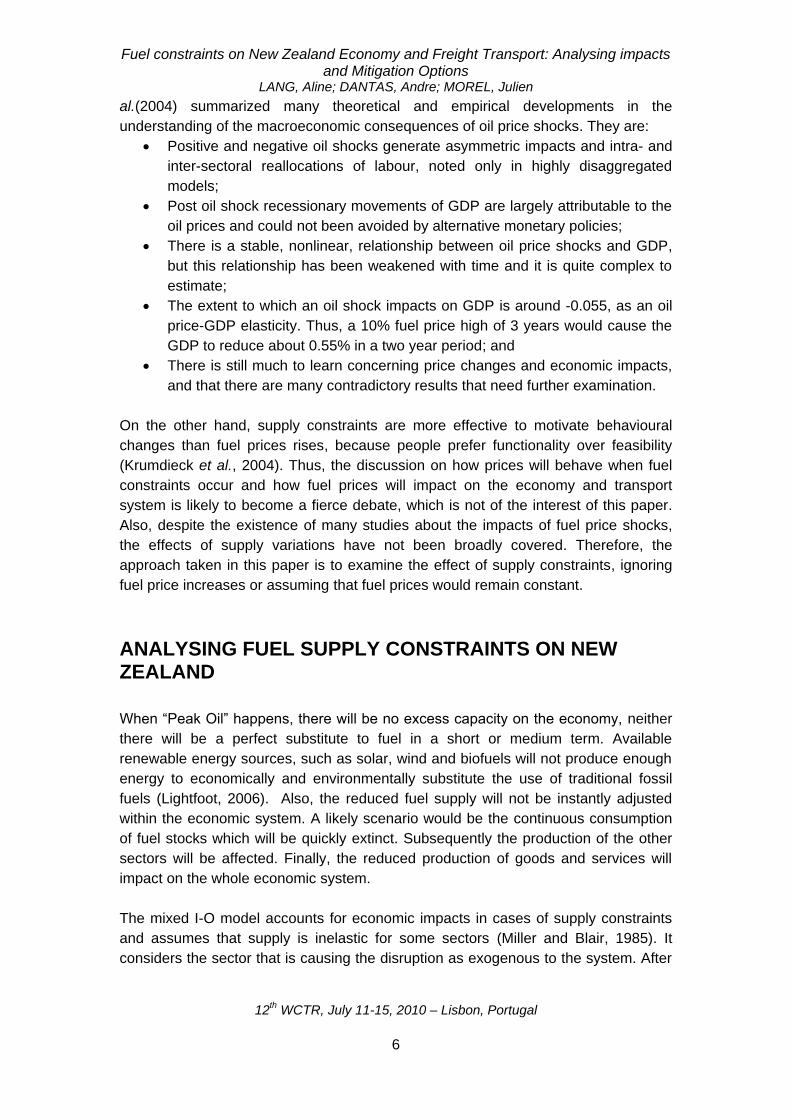
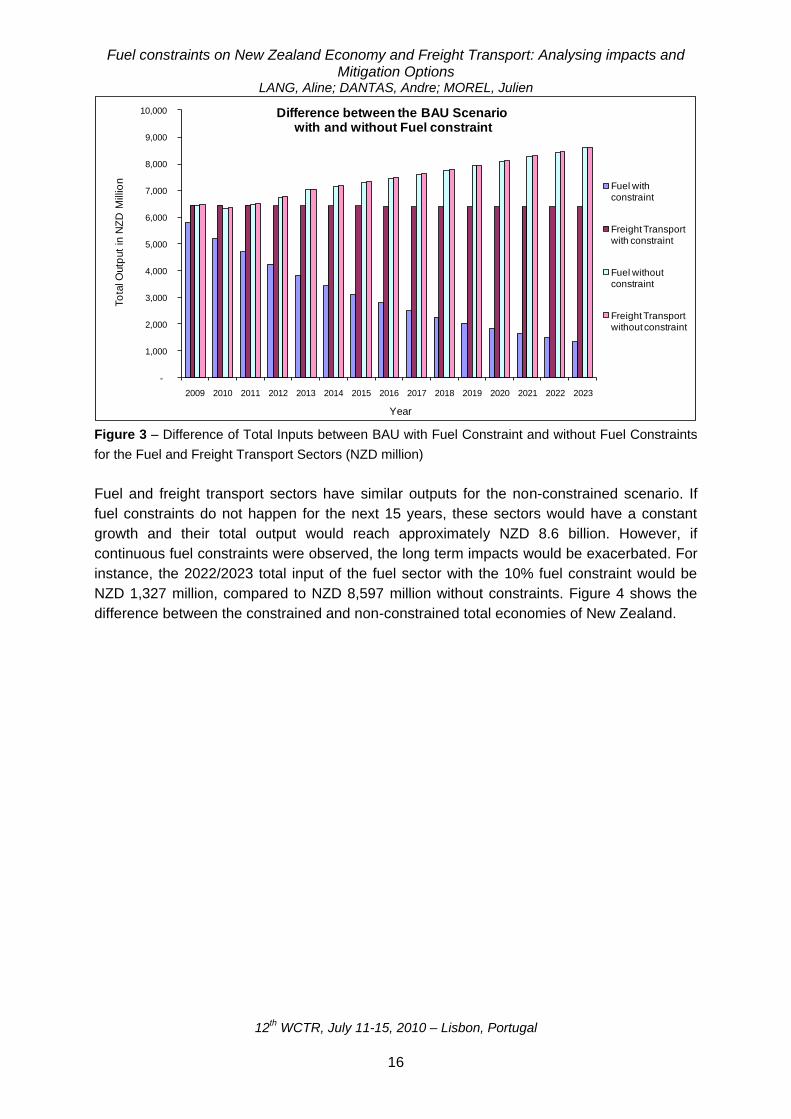
Comparing the BAU to an unconstrained scenario in which the economy follows a growth
pattern, the impacts could be enormous. The growth for the initial five years were forecasted
by using the production-based GDP growth projected by Infometrics (2009). The other ten
years were estimated by using an average growth of 2.1%, which is the same average of the
five years forecast. The difference between these two scenarios for the fuel and freight
transport sectors is shown in Figure 3.
Fuel constraints on New Zealand Economy and Freight Transport: Analysing impacts and Mitigation Options
LANG, Aline; DANTAS, Andre; MOREL, Julien
12th WCTR, July 11-15, 2010 – Lisbon, Portugal
16
-
1,000
2,000
3,000
4,000
5,000
6,000
7,000
8,000
9,000
10,000
2009 2010 2011 2012 2013 2014 2015 2016 2017 2018 2019 2020 2021 2022 2023
To
tal O
utp
ut
in N
ZD
Mill
ion
Year
Difference between the BAU Scenariowith and without Fuel constraint
Fuel with constraint
Freight Transport with constraint
Fuel without constraint
Freight Transport without constraint
Figure 3 – Difference of Total Inputs between BAU with Fuel Constraint and without Fuel Constraints
for the Fuel and Freight Transport Sectors (NZD million)
Fuel and freight transport sectors have similar outputs for the non-constrained scenario. If
fuel constraints do not happen for the next 15 years, these sectors would have a constant
growth and their total output would reach approximately NZD 8.6 billion. However, if
continuous fuel constraints were observed, the long term impacts would be exacerbated. For
instance, the 2022/2023 total input of the fuel sector with the 10% fuel constraint would be
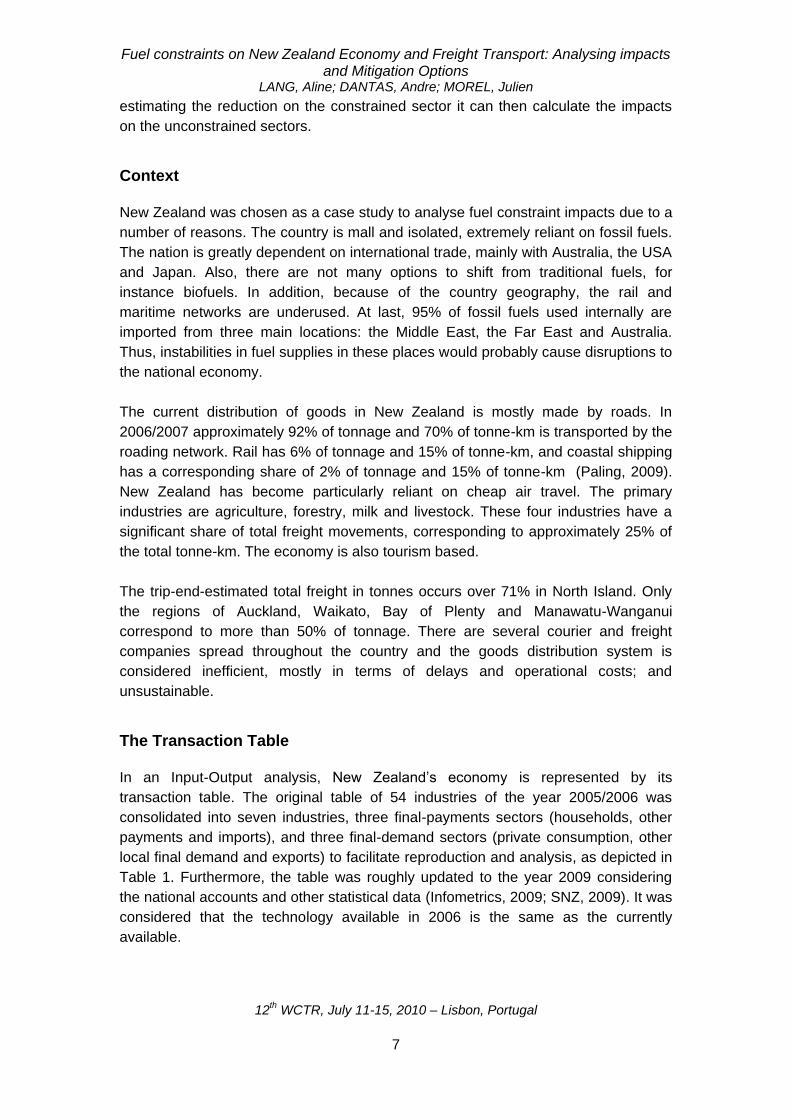
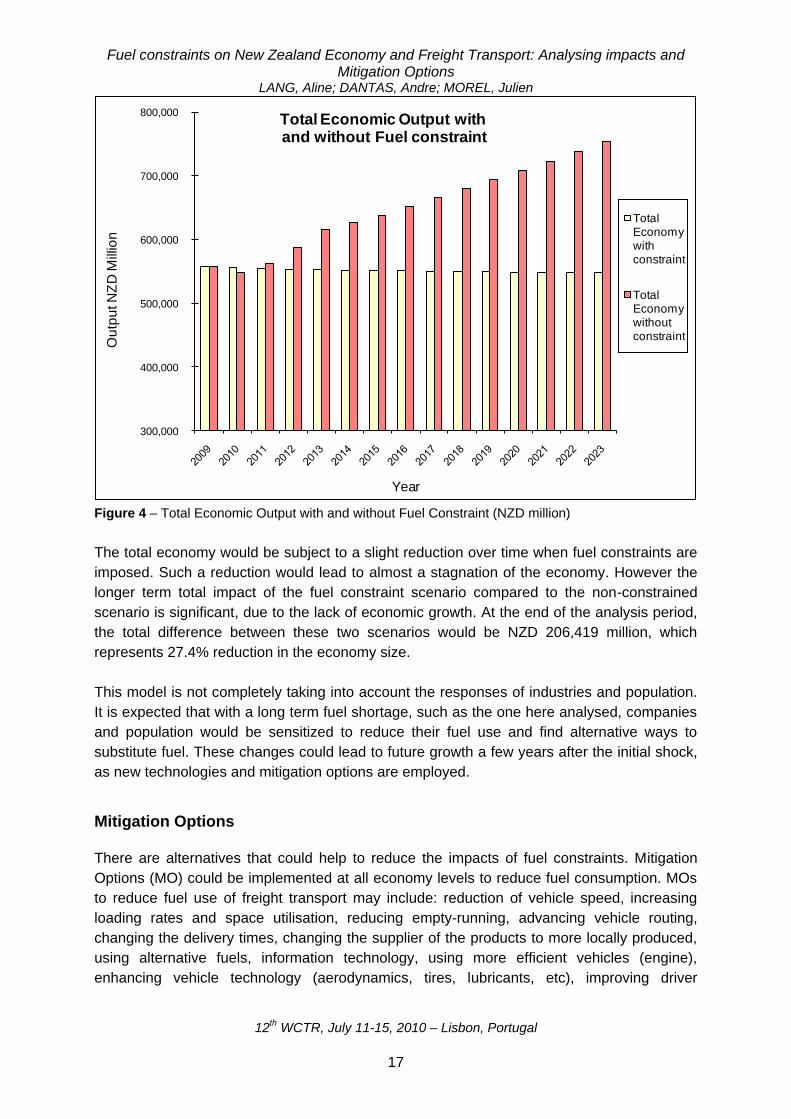
NZD 1,327 million, compared to NZD 8,597 million without constraints. Figure 4 shows the
difference between the constrained and non-constrained total economies of New Zealand.
Fuel constraints on New Zealand Economy and Freight Transport: Analysing impacts and Mitigation Options
LANG, Aline; DANTAS, Andre; MOREL, Julien
12th WCTR, July 11-15, 2010 – Lisbon, Portugal
17
300,000
400,000
500,000
600,000
700,000
800,000 O
utp
ut N
ZD
Mill
ion
Year
Total Economic Output withand without Fuel constraint
Total Economy with constraint
Total Economy without constraint
Figure 4 – Total Economic Output with and without Fuel Constraint (NZD million)
The total economy would be subject to a slight reduction over time when fuel constraints are
imposed. Such a reduction would lead to almost a stagnation of the economy. However the
longer term total impact of the fuel constraint scenario compared to the non-constrained
scenario is significant, due to the lack of economic growth. At the end of the analysis period,
the total difference between these two scenarios would be NZD 206,419 million, which
represents 27.4% reduction in the economy size.
This model is not completely taking into account the responses of industries and population.
It is expected that with a long term fuel shortage, such as the one here analysed, companies
and population would be sensitized to reduce their fuel use and find alternative ways to
substitute fuel. These changes could lead to future growth a few years after the initial shock,
as new technologies and mitigation options are employed.
Mitigation Options
There are alternatives that could help to reduce the impacts of fuel constraints. Mitigation
Options (MO) could be implemented at all economy levels to reduce fuel consumption. MOs
to reduce fuel use of freight transport may include: reduction of vehicle speed, increasing
loading rates and space utilisation, reducing empty-running, advancing vehicle routing,
changing the delivery times, changing the supplier of the products to more locally produced,
using alternative fuels, information technology, using more efficient vehicles (engine),
enhancing vehicle technology (aerodynamics, tires, lubricants, etc), improving driver
Fuel constraints on New Zealand Economy and Freight Transport: Analysing impacts and Mitigation Options
LANG, Aline; DANTAS, Andre; MOREL, Julien
12th WCTR, July 11-15, 2010 – Lisbon, Portugal
18
behaviour (through training and monitoring programs), using vehicles with greater capacity
(less vans and small trucks), changing the land-use, adopting superior logistical trends (such
as reverse logistics, rationalization of the supply chain, etc). Some of these MOs can reduce
not only the fuel consumption of the freight transport but also help other sectors.
The mitigation options investigated in this study were mechanical and technological
alternatives: biofuels (for ships, trucks and trains), regenerative brake (for trains and trucks),
wheel motor technology (for trucks), electrification of the rail network, electric hybrid vehicles,
fuel cells and hydrogen engines and skysail technology. The selection of the best
alternatives should include an analysis of the options that consume less energy and are also
available sooner for the three most representative freight transport modes in New Zealand:
trucks, trains and ships. Data was collected in terms of vehicles energy consumption, price of
energy, EROI, Mton-km carried per year and implementation costs of the mitigation options.
The EROI which stands for the Energy Return On Investment is the ratio of the energy
delivered by a process to the energy used directly and indirectly in that process. This case
study also considers geographical and geopolitical characteristics of New Zealand.
Some of the proposed mitigation options would require significant infrastructure investments.
However, the implementation costs of the mitigation options could not be calculated,
especially because some are not yet available and others have not had their costs estimated
elsewhere.
Biofuels
Biofuels offer the possibility of producing energy without a net increase of carbon into the
atmosphere. The biggest advantage of biofuels is that they can be used with all classic
engines. Trucks manufacturers as Daimler, Daf, Renault, explore various fuel types, and
pride their selves for being able to produce trucks to run on bio-diesel, or bio-gas, a bio-
diesel/bio-gas combo, DME (dimethyl ether), hydrogen/bio-gas and methanol/ethanol. At the
same time, existing biofuels alternatives are controversial due to the use of food crops and
soil resources to produce fuel.
The production of biofuels can be made by different ways, the most common way being by
growing crops high in sugar and produce ethanol through fermentation, as it is observed in
the USA with their corn ethanol and the sugar cane ethanol produced in Brazil. Another
common method is to grow plants that contain high amounts of vegetable oil, after these oils
are heated they can be burned directly in a diesel engine, or they can be chemically
processed to produce fuels such as biodiesel.
The literature review studied showed that biodiesel is not an option for New Zealand,
because it would require a great amount of effort to improvethe efficiency of this fuel. For
instance, it was found that the energy return in one Mega Joule (MJ) of biodiesel is 0.334, or
when one MJ of biodiesel is used, three MJ of energy have been consumed through the
process. The price of one litre of biodiesel is about 1.76 times higher than the price of normal
diesel, albeit diesel has higher taxes than biodiesel. The average fuel efficiency of a biodiesel
Fuel constraints on New Zealand Economy and Freight Transport: Analysing impacts and Mitigation Options
LANG, Aline; DANTAS, Andre; MOREL, Julien
12th WCTR, July 11-15, 2010 – Lisbon, Portugal
19
truck is similar with a diesel one. Therefore, biodiesel uses the same amount of energy than
the normal diesel engine, but it costs about 45% more. Finally, even though New Zealand
has a strong potential for biofuels, its current infrastructure to produce biofuel is almost non-
existent (Clark et al., 2001).
Considerable improvement has been observed in the technology to produce biofuels. The
traditional first generation of biofuels, produced from food crops, has been substituted, at
least in the theoretical ground, to the so called second, third and fourth generation of
biofuels. Second generation of biofuels are produced from the whole plant and non-food
crops, but they are still carbon positive, for instance the BTL-fuels (biomass-to-liquid). Lately
some analysis has been made towards different plants or genetically modified crops to
produce carbon neutral (third generation), such as algae, and carbon negative biofuels
(fourth generation), such as electrofuels. Still, there is no established concept for these
technologies. While new generations of biofuels can be promising, they will take many years
to produce acceptable results and most importantly to reduce their capital and production
costs (Lane, 2010).
Electrification of the Rail Network
The topography of the North and South Islands dictates that rail network features many
sinuous and hilly sections. This characteristic suggests that electric rail systems would not be
very efficient and quite slow. Additionally, it is important to consider the nature of the
electricity production in New Zealand, mostly supplied by hydraulic dams. (52.3%). The
remaining electricity generation comes from gas (23.7%), coal (10.5%), geothermal (9.4%)
and wind (2.5%), the remaining sources include wood, biogas, oil and waste heat (MED,
2009). New Zealand is nuclear free, i.e. it is prohibited to produce electricity from nuclear
sources, leaving the country only with the current sources of energy. All the hydro generation
is already currently exploited and the government does not intend to approve new dams to
mass electricity production, due its environmental impacts. Thus, to electrify its rail network,
New Zealand would have to find other means to generate electricity.
Another daunting point is the cost of the network electrification. For this calculation, the costs
of a 50km electrification project of the Auckland rail network were extrapolated for the 3898
km of the New Zealand rail network. This project has shown that electrification would cost
about NZD 10 billion/km. Thus, considering only the electrification costs, this alternative
would take an absurd time to pay off and a huge investment. For the financial reasons
electrification of New Zealand railway network was also found not to be a good option.
However, this analysis has not taken into account the implementation costs of a new power
plant, as well as the benefits of pollution and congestion reduction, which indicated that
further analysis is required for a more accurate conclusion.
Fuel constraints on New Zealand Economy and Freight Transport: Analysing impacts and Mitigation Options
LANG, Aline; DANTAS, Andre; MOREL, Julien
12th WCTR, July 11-15, 2010 – Lisbon, Portugal
20
Regenerative brakes and In-Wheel motor technology
A regenerative brake is a mechanism that reduces vehicle speed by converting some of its
kinetic energy into a storable form of energy instead of dissipating it as heat, as with a
conventional brake (Cheng et al., 2009). The captured energy is normally stored for future
use in battery packs, but may also be stored by compressing air or by a rotating flywheel
(Trabesinger, 2007). Two types of regenerative brake are currently employed on vehicles;
the KERS (Kinetic Energy Regenerative System) is a hydraulic system and the electric
system with storage of energy in a battery pack. Both systems are applied on few new trucks
such as the Class8 Volvo truck and the USB Hybrid Truck, and also on hybrid trains.
The KERS is an extremely efficient process, enabling over 70 percent of the energy normally
wasted during braking to be used, minimising the load on the engine and reducing fuel
consumption. Previous applications in rubbish collection trucks showed that the fuel
reduction could be over 40 percent, plus lower brake wear. It is also possible to reduce the
size of the vehicle engine as this can be sized for peak speeds, by up to 25 percent. For
original equipment manufacturers, hydraulic hybrid systems can be incorporated into existing
vehicles without major modifications, minimising the cost of new technology while adding
value to the product. Similarly, for end users, the technology can deliver real savings in fuel
consumption and brake use while reducing both emissions and noise pollution.
The other type of regenerative brake is the electric systems, which is currently used on
electric vehicles, such as the Toyota Hybrid and the Venturi fetish. The hybrid electric
vehicles (HEVs) are vehicles that combine a conventional propulsion system with a
Rechargeable Energy Storage System (RESS) to achieve better fuel economy than a
conventional vehicle (O'Donnell, 2007). Modern mass-produced HEVs prolong the energy
stored in their batteries by capturing kinetic energy by means of regenerative braking.
Regenerative brakes can also be used in trains, in which the energy put into accelerating a
train and into moving it uphill is ―stored‖ in the train as kinetic and potential energy. In
vehicles with electric traction (this includes electric, diesel-electric and hybrid stock) a great
part of this energy can be reconverted into electric energy by using the motors as generators
when braking. The electric energy is transmitted ―backwards‖ along the conversion chain and
fed back into the catenaries. Similarly, rotating flywheels can also be used in trains.
The electric regenerative brakes can easily be coupled with another technology, the wheel
motor. The wheel motor is an electric motor that is incorporated into the hub of a wheel.
Thus, the internal combustion engine normally found under the hood is simply not necessary;
it is replaced with at least two motors located in the hub of the wheels. These wheels contain
not only the braking components, but also all of the functionality that was formerly performed
by the engine, transmission, clutch, suspension and other related parts. With In-wheel
technology, more batteries can be installed in the space, which would otherwise be occupied
by the transmission and differential gear. It provides a significant weight and manufacturing
cost economy by eliminating mechanical transmission, gearboxes, differentials, drive shafts
and axles.
Fuel constraints on New Zealand Economy and Freight Transport: Analysing impacts and Mitigation Options
LANG, Aline; DANTAS, Andre; MOREL, Julien
12th WCTR, July 11-15, 2010 – Lisbon, Portugal
21
To apply the in-wheel motor technology it is important to notice that this is effective only for
electric vehicle or hybrid vehicle. However, there is not any hybrid truck on the freight
network. Thus, the study was based on the efficiency of the Wheel motor system in
comparison with a conventional truck engine and implementation costs could not be
calculated as the technology is not yet available in the market. The conventional truck has an
efficiency of 33% and the in-wheel motor engine has an efficiency between 85% to 92%.
The regenerative breaking which can be associated with wheel motor technology can save in
average 25% of energy. The price of applying this system on a vehicle has not been set
precisely by the supplier, but some publications suggest that it would cost about NZD 75
thousand to implement the KERS system on a truck. Again, the implementation cost here
indicated only includes the price to apply it in the truck, ignoring the infrastructure to
implement the system on trucks.
Hydrogen and fuel cells
Hydrogen could be an important energy solution because it is the most abundant chemical
element of the universe and produces energy when combined with oxygen. The energy
stored in the hydrogen can be harnessed with the help of technologies such as fuel cells. A
fuel cell is an electrochemical conversion device which converts the chemical energy of fuel
to electricity. However, hydrogen is not an energy resource, except if nuclear fusion is
commercially developed. To use hydrogen as a fuel, it first has to be generated by
electrolysis of water or another method, such as obtained from fossil fuel. The process of
producing hydrogen normally consumes more energy than the energy released when it is
used as a fuel.
Some believe that hydrogen is the fuel of the future. Yet, it may take another 20 years before
hydrogen engines trucks can be widely available. Some key factors which prohibit the
hydrogen engines from being widely available include producing the vehicles at a reasonable
price, developing the product that meets customer‘s demands for power and fuel savings,
finding ways to directly converse the chemical energy in the form of hydrogen into
mechanical energy and integrating the technology into vehicle mass production.
The Hytruck is a hydrogen-powered prototype truck, based on a Mitsubishi Canter 7.5-
tonner, but its manufacturer says its technology can be mated to other makes and models.
To create the vehicle, the company replaced the existing diesel motor, gearbox, differential
and fuel tanks with a completely new-concept driveline, called the Hytruck H2E (Hytruck,
2009). It has fuel cells mounted under the cab producing 16kW that draw hydrogen from the
227-litre fuel tank containing 5.8kg of hydrogen at a pressure of 350bar. The energy from the
fuel cells is transferred to the batteries, which are mounted where the diesel fuel tanks used
to be. The fuel cells provide continuous charge to the batteries.
Nevertheless, the Hytruck is just a prototype for the moment and it is very expensive (around
NZD 4million). In addition it would be necessary to adapt the fuel stations to hydrogen and
Fuel constraints on New Zealand Economy and Freight Transport: Analysing impacts and Mitigation Options
LANG, Aline; DANTAS, Andre; MOREL, Julien
12th WCTR, July 11-15, 2010 – Lisbon, Portugal
22
produce hydrogen in large scale. Finally, the EROI of the Hytruck was estimated as 0.25,
meaning that 4 MJ of energy are required for each MJ of energy used in the Hytruck, making
this only a dream of technology for the moment.
Wind for ships
When it comes to transporting freight around the world, ships move by far the greatest
amount, but shipping has so far been exempt from emissions restrictions. Cargo ships emit
about 2.7% of the global total of greenhouse gases. This equates to 800 million tones of
emissions per year — a figure that could double by 2030 as global trade increases.
One of the easiest ways to make shipping more efficient would be to slow the ships down.
Fuel consumption increases rapidly with speed: doubling a ship's speed means using eight
times as much fuel. Nevertheless, with the amount of freight to be shipped on the rise, and
shippers demanding quick transit times, ship owners are under pressure to accelerate their
vessels (Corbett and Koehler, 2003). Another way would be to use the wind as a source of
energy.
The sail is another example of how the shipping industry is trying to tackle the question of
energy efficiency. Wind is a free energy source and is the most economic and
environmentally sound source of energy on the high seas. Yet, shipping companies are not
taking advantage of this attractive savings potential at present. The reason for this is that, so
far, no sail system has been able to meet the requirements of today‘s maritime shipping
industry.
Skysail is a product developed by a German company that consists of a large kite that is
affixed to large ships. It is based in the same system developed to kite surfing and other kite
sports. The SkySails propulsion system consists of a large foil kite, an electronic control
system for the kite and an automatic system to retract the kite. The control system is on the
tower of the boat (super structure) and the towing rope is connected close to the bow, the
system is designed in such a way that optimal aero-dynamic efficiency can be achieved. A
multi-level security system and redundant components guarantee the highest possible safety
during operation of the SkySails propulsion. The optional weather routing system provides
shipping companies with a means to guide their ships to their destinations on the most cost-
effective routes and according to schedule.
The profile of the towing kite is designed in such a way that optimal aero-dynamic efficiency
can be achieved. Their double-wall profile gives the SkySails towing kites aerodynamic
similar to the wing of an aircraft. Thus, the SkySails-System can operate not just downwind,
but at courses of up to 50° to the wind as well. In case of very strong winds, the power of the
towing kite is reduced by changing its position in the wind window (relative to the horizon),
without having to minimize the towing kite area. Presently, SkySails is offering towing kites
for cargo ships with kite areas of approx. 150 to 600m². An experience with a container cargo
ship (MS Beluga Skysails) from Germany to Venezuela, then to the United States, and
ultimately arriving in Norway have show that high propulsion power can be achieved on half-
Fuel constraints on New Zealand Economy and Freight Transport: Analysing impacts and Mitigation Options
LANG, Aline; DANTAS, Andre; MOREL, Julien
12th WCTR, July 11-15, 2010 – Lisbon, Portugal
23
wind, reaching and downwind courses from 90° to 270°. While the kite was in use, the ship
saved an estimated 10-15% fuel. Depending on the prevailing wind conditions, a ship‘s
average annual fuel costs can be reduced by 10 to 35% by using the SkySails-System and
under optimal wind conditions fuel consumption can be cut by up to 50%.
Even though the idea of having a huge kite attached to a ship seams completely crazy at first
sight, this options has showed to be very efficient. The technology was studied for the New
Zealand coastal shipping network, using the average speed and energy consumption of
ships in the coastal waters. The analyses showed that the costs of implementing a Skysail to
a ship were almost paid off in the first year of use of the system, only through the energy
saved.
Final remarks for Mitigation Options
We have observed that is very difficult to collect data, even general values, specially in terms
of costs of the technologies and implementation costs. Also, mitigation options have to take
in account the country‘s geographical, political and economical situation. Therefore, some
alternatives that had bad results in this study might have better performance if applied in
different countries.
After studying the mechanical mitigation options, it has been observed that the available
technology is probably not enough to reduce fuel constraint impacts in a timely manner, so it
is also important to study the other mitigation options, such as logistics of freight deliveries,
that could probably be put in practice in a shorter time.
Finally, after studying several mitigation options it would be necessary to include them into
the I-O analysis framework. Each MO could be explored in several fashions. For example, a
MO that focuses on the use of an alternative fuel could take scenarios of high, moderate or
no improvements. To analyse MOs it would be necessary to use either a dynamic model or
integrated I-O and econometric models. When dealing with future years where mitigation
options and policies are implemented, probably major modifications on the structure of the
economic system would occur due to behavioural changes of households and companies.
These changes would have to be modelled on a case by case basis. Hence, the
characteristics of the mitigation options should be previously defined.
In this study the mitigation options were not studied in a more detailed manner due to the
lack of specific data. It is important to emphasize that structural changes and calculation of
future impacts are particularly important for the analysis of mitigation options. We can not
treat the economy as stable after the introduction of mitigation options. These MOs will
change the economic systems by means of application of new technologies, behavioural
changes, production patterns and changes on the international trade market.
Fuel constraints on New Zealand Economy and Freight Transport: Analysing impacts and Mitigation Options
LANG, Aline; DANTAS, Andre; MOREL, Julien
12th WCTR, July 11-15, 2010 – Lisbon, Portugal
24
CONCLUSIONS AND RECOMMENDATIONS
This paper has analysed the economic impacts of fuel constraints by means of long-term
continuous fuel shortages, measured in terms of quantity restrictions. Nonetheless, fuel
constraints could happen for several reasons, such as wars, natural disasters, hikes of oil
prices, climate change policies, international crisis and others. A supply constraint input-
output analysis was used to model the relationship between scenarios of fuel constraints and
economic impacts to the New Zealand economy and to its individual sectors. Even though
the model was applied for New Zealand, any country could be investigated, requiring mainly
its transaction table and some secondary statistical data.
The investigated scenario was a 10% reduction of fuel availability. According to the mixed I-
O technique this would cause the final demand of the fuel sector of New Zealand to drop
25.3%. The most affected sector in relative terms would be the freight transport sector due to
its high dependence on fossil fuels. The total economy would decline about 0.2%, from NZD
556,980 million to NZD 555,660 million. This shows that a 10% fuel constraint would not
cause an impact on the total economic output of 10%, as previously assumed by other
authors.
A business as usual (BAU) scenario was compared to a scenario of economic growth on
longer term. It was observed that if no changes were made to mitigate impacts of fuel
constraints, the total impacts on the fuel sector, freight transport sector and on the total
economy would tend to increase almost linearly. In a 15 years analysis period the BAU
scenario with fuel constraint would have a total economic output of 27.4% smaller than the
BAU scenario without fuel constraints.
Finally, mitigation options could be put in practice to potentially reduce the impacts of fuel
constraints. This study has examined vehicle and energy technologies that could help to
reduce the energy consumption of freight activities. The analysis of these mitigation options
in the New Zealand Freight transport system reveals the complexity of their implementation.
Considering the mitigation options‘ energy consumption and implementation costs as part of
the New Zealand economic and geographic contexts is concluded that improvements of the
existing mitigation options are necessary to provide a positive balance between benefits and
costs. The results have shown that the best alternatives for the New Zealand freight transport
system are probably regenerative brake systems for trucks and trains, wheel motor
technology for trucks and the skysail for ships. The results have also shown that biodiesel
and electrification are not good alternatives for New Zealand, due to the high cost of
production of energy. It would also be interesting to evaluate if the energy savings provided
by the mitigation options could eliminate the economic impacts caused by fuel constraints to
the freight transport sector, which is a recommendation for future work.
The approach and results presented here indicated promising opportunities to further apply I-
O to model fuel constraints scenarios in the context of freight transportation. Although
limitations were observed in this work, a series of recommendations can be presented in
order to improve and better specify the proposed methodology. Future modelling attempts
Fuel constraints on New Zealand Economy and Freight Transport: Analysing impacts and Mitigation Options
LANG, Aline; DANTAS, Andre; MOREL, Julien
12th WCTR, July 11-15, 2010 – Lisbon, Portugal
25
could incorporate price fluctuations in order to improve the representation of the reality.
Alternatively, the current method could be improved by developing a questionnaire survey
with industries to compare estimated with foreseen impacts of fuel constraints. In addition,
technical coefficients need to be dynamically addressed in Transaction Tables according to
future projections. Nonetheless, it is envisaged that possible modelling refinements should
consider parameters that express the highly complex environment in which economic
systems operate, as well as the lack of an appropriate substitute to fuel. In this backdrop, this
work revealed that there is potential for studying fuel constraints through a system dynamics
methodology. The system dynamics approach would be able to incorporate the mentioned
characteristics of consistent changes on the economic environment, household and
industries after a fuel constraint.
Finally, an integration platform between the quantitative analysis provided by the I-O Method
and qualitative assessments of mitigation options could be developed. Such platform would
provide both academia and industry with a powerful tool to comprehensively analyse and
make decisions towards the reduction of impacts of fuel constraints in national economic
systems as well as in people‘s wellbeing. Ultimately, decision makers cannot be deprived
from such a platform, because fuel constraints have already proved to significantly change
societal behaviours and the economy. Therefore, sole quantitative or qualitative approaches
would possibly not incorporate all complexities needed to understand future scenarios.
REFERENCES
Ang-Olson, J. and W. Schroeer (2002). "Energy Efficiency Strategies for Freight Trucking: Potential Impact on Fuel Use and Greenhouse Gas Emissions." Transportation Research Record 1815(1): 11-18.
Brook, A., R. Price, D. Sutherland, N. Westerlund and C. André (2004). Oil price developments: drivers, economic consequences and policy responses. EEconomics Department Working Papers, No. 412, OECD.
Campbell, C. J. (1997). The Coming Oil Crisis. Brentwood, England, Multiscience Publishing Co. & Petroconsultants S. A.
Carter, A. P. (1970). Structural Changes in the American Economy. Cambridge, Mass., Harvard University Press.
Cheng, I., M. Martin, Y. Morimoto, A. Poulizac, D. Wong, S. Yao, I. Sidhu, P. Kaminsky, B. Tenderich, P. Kaminsky and B. Tenderich (2009). The Technical and Business Challenges of Building an Electric Vehicle Sport Utility Vehicle. Technical Brief, Center for Entrepreneurship & Technology (CET), University of California, Berkeley.
Clark, H., C. de Klein and P. Newton (2001). "Potential management practices and technologies to reduce nitrous oxide, methane and carbon dioxide emissions from New Zealand agriculture." Ministry of Agriculture & Forestry, New Zealand.
Corbett, J. and H. Koehler (2003). "Updated emissions from ocean shipping." J. Geophys. Res 108(D20): 4650-64.
Dantas, A., S. Krumdieck and S. Page (2007). Energy Risk to Activity Systems as a Function of Urban Form. Christchurch, New Zealand, Land Transport New Zealand Research Report 311.
Davis, H. C. and E. L. Salkin (1984). "Alternative approaches to the estimation of economic impacts resulting from supply constraints." The Annals of Regional Science 18(2): 25-34.
Fuel constraints on New Zealand Economy and Freight Transport: Analysing impacts and Mitigation Options
LANG, Aline; DANTAS, Andre; MOREL, Julien
12th WCTR, July 11-15, 2010 – Lisbon, Portugal
26
Davis, S. and J. Haltiwanger (2001). "Sectoral job creation and destruction responses to oil price changes." Journal of Monetary Economics 48(3): 465-512.
Deffeyes, K. S. (2001). Hubbert's peak : the impending world oil shortage. USA, Princeton, N.J.: Princeton University Press.
Donovan, S., J. Genter, B. Petrenas, N. Mumby, T. Hazledine, T. Litman, G. Hewison, T. Guidera, L. O‘Reilly, A. Green and G. Leyland (2008). Managing Transport Challenges when Oil Prices Rise, NZ Transport Agency. Research Report 04/08 (357): 148.
Dunlop, I. (2007). "Climate Change and Peak Oil: An Integrated Strategy for Australia. ." Pacific Ecologist Winter 2007: pp 40-46.
EIA (2000). Long Term World Oil Supply. Washington, DC, Energy Information Administration, U.S. Department of Energy.
Giarratani, F. (1976). "Application of an interindustry supply model to energy issues." Environment and Planning A 8(4): 447–54.
Hamilton, J. D. (2003). "What is an oil shock?" Journal of econometrics 113(2): 363-398. Hirsch, R. L. (2008). "Mitigation of maximum world oil production: Shortage scenarios."
Energy Policy 36(2): 881-889. Hubacek, K. and L. Sun (2001). Land Use Change at the National and Regional Level in
China: A Scenario Analysis Based on Input-Output Modeling. Laxenburg, Austria, International Institute for Applied Systems Analysis. 12.
Hudson, I. (2001). "The Use and Misuse of Economic Impact Analysis: The Case of Professional Sports." Journal of Sport and Social Issues 25(1): 20-39.
Hytruck. (2009). "http://www.hytruck.nl/." IEA (2008). World Energy Outlook 2008. Available from: http://www.worldenergyoutlook.org/
International Energy Agency. Infometrics. (2009). "Economic Forecasts July 2009." from http://www.infometrics.co.nz. Jiménez-Rodríguez, R. and M. Sanchez (2005). "Oil price shocks and real GDP growth:
empirical evidence for some OECD countries." Applied Economics 37(2): 201-228. Jones, D., P. Leiby and I. Paik (2004). "Oil price shocks and the macroeconomy: What has
been learned since 1996." Energy Journal 25(2): 1-32. Keane, M. and E. Prasad (1996). "The employment and wage effects of oil price changes: a
sectoral analysis." The Review of Economics and Statistics: 389-400. Krumdieck, S., A. Dantas and T. Burton (2004). Supply and demand is not sustainable.
International Conference on Sustainability Engineering and Science, Auckland, New Zealand.
Krumdieck, S., S. Page and A. Dantas (2010). "Urban form and long-term fuel supply decline: A method to investigate the peak oil risks to essential activities." Transportation Research Part A: Policy and Practice 44(5): 306-322.
Kveiborg, O. and M. Fosgerau (2007). "Decomposing the decoupling of Danish road freight traffic growth and economic growth." Transport Policy 14(1): 39-48.
Lane, J. (2010) "What are – and who‘s making – 2G, 3G and 4G biofuels?" Biofuels Digest. May 18, 2010
Lee, H. (2006). The Energy Problem. National Energy Symposium, Los Angeles, USA. Lightfoot, H. (2006). "A strategy for adequate future world energy supply and carbon
emission control." 2006 IEEE EIC Climate Change Technology: 1-10. Lyons, G. and K. Chatterjee (2002). Transport Lessons from the Fuel Tax Protests of 2000.
Aldershot, Ashgate. McKinnon, A. (1999). A logistical perspective on the fuel efficiency of road freight transport.,
Report presented to the workshop ‗Improving Fuel Efficiency in Road Freight: The Role of Information Technologies‘ organised by the International Energy Agency and European Conference of Ministers of Transport, APRIS, 24th February 1999.
McKinnon, A. (2007). "Decoupling of road freight transport and economic growth trends in the UK: An exploratory analysis." Transport Reviews 27(1): 37-64.
Fuel constraints on New Zealand Economy and Freight Transport: Analysing impacts and Mitigation Options
LANG, Aline; DANTAS, Andre; MOREL, Julien
12th WCTR, July 11-15, 2010 – Lisbon, Portugal
27
MED (2006). Discussion Paper: Options for Government Response to an Oil Supply Disruption. Wellington, New Zealand, Ministry of Economic Development.
MED (2009). New Zealand Energy Data File, Ministry of Economic Development. Miller, R. E. and P. D. Blair (1985). Input-output analysis : foundations and extensions.
Englewood Cliffs, N.J., Prentice-Hall. Noland, R. and Z. Wadud (2009). "Review of Oil Demand Restraint Policies for Heavy-goods
Vehicles." Energy Sources, Part B: Economics, Planning, and Policy 4(1): 84-99. O'Donnell, C. (2007). "Total effect on the environment of electric/hybrid electric vehicle
batteries." Paling, C. R. (2009). National Freight Demands Study. Parikh, A. (1979). "Forecasts of Input-Output Matrices Using the R.A.S. Method " The
Review of Economics and Statistics 6(3): pp. 477-481. Schafer, A. (2000). "Carbon Dioxide Emissions from World Passenger Transport: Reduction
Options." Transportation Research Record 1738(-1): 20-29. Schleicher-Tappeser, R., C. Hey and P. Steen (1998). Policy approaches for decoupling
freight transport from economic growth. 8th World Conference on Transport Research, Antwerp.
Seetharaman, A., K. Kawamura and S. D. Bhatta (2003). " Economic Benefits of Freight Policy relating to the Trucking Industry: An Evaluation of the RTP Freight Policy for the Chicago Six County Region." Transportation Research Record 1833: pp 17-23.
SNZ. (2009). "National Accounts." Statistics New Zealand. Stone, R. (1961). Input-output and National Accounts. Paris, Organisation for European
Economic Co-operation. Subramanian, S. and E. Sadoulet (1990). "The transmission of production fluctuations and
technical change in a village economy: a social accounting matrix approach." Economic Development and Cultural Change 39(1): 131-173.
Trabesinger, A. (2007) "Formula 1 racing: Power games." Nature 447, 900-903. Tverberg, G. E. (2008) "The disconnect between oil reserves and production." The Oil Drum. WEC (1995). Global Transport Sector Energy Demand Towards 2020. London, World
Energy Council. Williams, J. (2008). "Oil price history and analysis." WTRG Economics Home Page, available
at http://www.wtrg.com/prices.