Embed Size (px)
Citation preview
United States Department of Agriculture
www.ers.usda.gov
Electronic Outlook Report from the Economic Research Service
FTS-320-01
February 2006
Abstract
China has raised its profile in global fruit and vegetable markets. The valueof its exports during 2002-04 were more than double the value from a decadeearlier. Most of China’s exports are processed fruits and vegetables that do notyet pose a serious challenge to U.S. exports. China’s fresh vegetable sales toJapan and several other Asian markets and its apple exports to SoutheastAsia compete directly with U.S. products. The United States has been thelargest market for China’s exports of apple juice. China’s export competi-tiveness arises from low costs, a growing processing industry, and policiesthat encourage fruit and vegetable production. However, China’s growingdomestic market may absorb more of its production. China also faces stiffchallenges in improving the quality and safety of products, upgradingmarketing and distribution infrastructure, and reducing marketing costs.
Keywords: Fruit, vegetables, China, Asia, apples, exports, competition,marketing, costs of production, food safety
Acknowledgments
The authors received helpful comments from many USDA staff: John Dyck,John Dunmore, Joy Harwood, Barry Krissoff, Bryan Lohmar, Gary Lucier,Agnes Perez, Daniel Pick, and Susan Pollack, Economic Research Service;Kevin Latner, Wade Sheppard, and Heather Velthuis, Foreign AgriculturalService; and John Love, World Agricultural Outlook Board. The authorsalso benefited from reviews by Dinghuan Hu, Chinese Academy of Agricul-tural Sciences, and Mechel Paggi, California State University, Fresno. LindaHatcher provided excellent editorial and production assistance.
China’s Rising Fruit andVegetable Exports ChallengeU.S. IndustriesSophia Huang and Fred Gale
Introduction . . . . . . . .2
China’s Rapid Rise in Exports . . . .3
Points of Rivalry Withthe United States . .5
Factors Behind China’s Competitiveness . .11
Factors That May SlowChina’s Exports . .14
Conclusions and Trade Prospects . .19
References . . . . . . .20
Table of Contents
Approved byUSDA’s
World AgriculturalOutlook Board
Since the 1990s, China has substantially raised its profile in the globalmarket for fruits and vegetables. Total export value of China’s fruits andvegetables (here including fresh fruit, fresh vegetables, processed fruit andvegetables, fruit and vegetable juices, pulses, and tree nuts) more thandoubled between 1992-94 and 2002-04, from $2.3 billion to $5.1 billion(see box, “Fruit and Vegetable Foreign Trade Data”). China has become aleading exporter in some markets where its presence was negligible 10 yearsearlier. China’s exports go mainly to Asian countries, which also are impor-tant markets for U.S. exporters. A sharp decline in U.S. market share hascoincided with the surge in Chinese exports in a number of markets.
2China’s Rising Fruit and Vegetable Exports Challenge U.S. Industries/FTS-320-01
Economic Research Service/USDA
Introduction
Fruit and Vegetable Foreign Trade Data
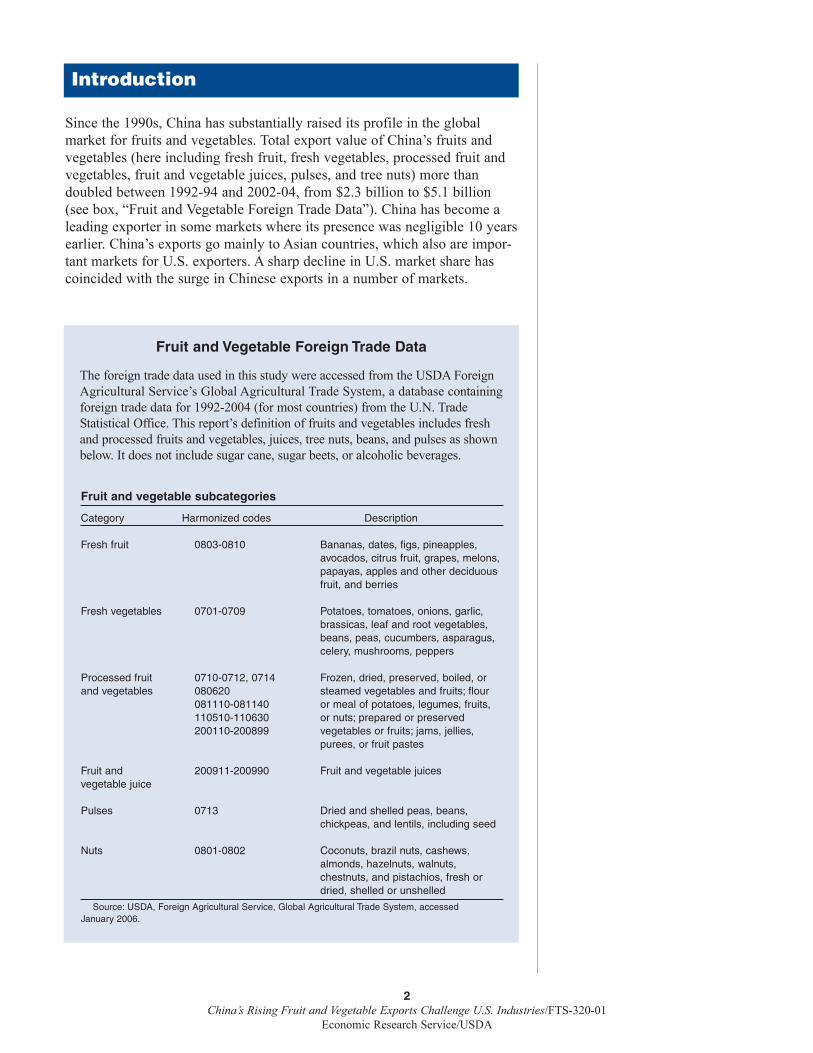
The foreign trade data used in this study were accessed from the USDA ForeignAgricultural Service’s Global Agricultural Trade System, a database containingforeign trade data for 1992-2004 (for most countries) from the U.N. TradeStatistical Office. This report’s definition of fruits and vegetables includes freshand processed fruits and vegetables, juices, tree nuts, beans, and pulses as shownbelow. It does not include sugar cane, sugar beets, or alcoholic beverages.
Fruit and vegetable subcategories
Category Harmonized codes Description
Fresh fruit 0803-0810 Bananas, dates, figs, pineapples, avocados, citrus fruit, grapes, melons, papayas, apples and other deciduous fruit, and berries
Fresh vegetables 0701-0709 Potatoes, tomatoes, onions, garlic, brassicas, leaf and root vegetables, beans, peas, cucumbers, asparagus, celery, mushrooms, peppers
Processed fruit 0710-0712, 0714 Frozen, dried, preserved, boiled, or and vegetables 080620 steamed vegetables and fruits; flour
081110-081140 or meal of potatoes, legumes, fruits, 110510-110630 or nuts; prepared or preserved 200110-200899 vegetables or fruits; jams, jellies,
purees, or fruit pastes
Fruit and 200911-200990 Fruit and vegetable juicesvegetable juice
Pulses 0713 Dried and shelled peas, beans, chickpeas, and lentils, including seed
Nuts 0801-0802 Coconuts, brazil nuts, cashews, almonds, hazelnuts, walnuts, chestnuts, and pistachios, fresh or dried, shelled or unshelled
Source: USDA, Foreign Agricultural Service, Global Agricultural Trade System, accessed January 2006.
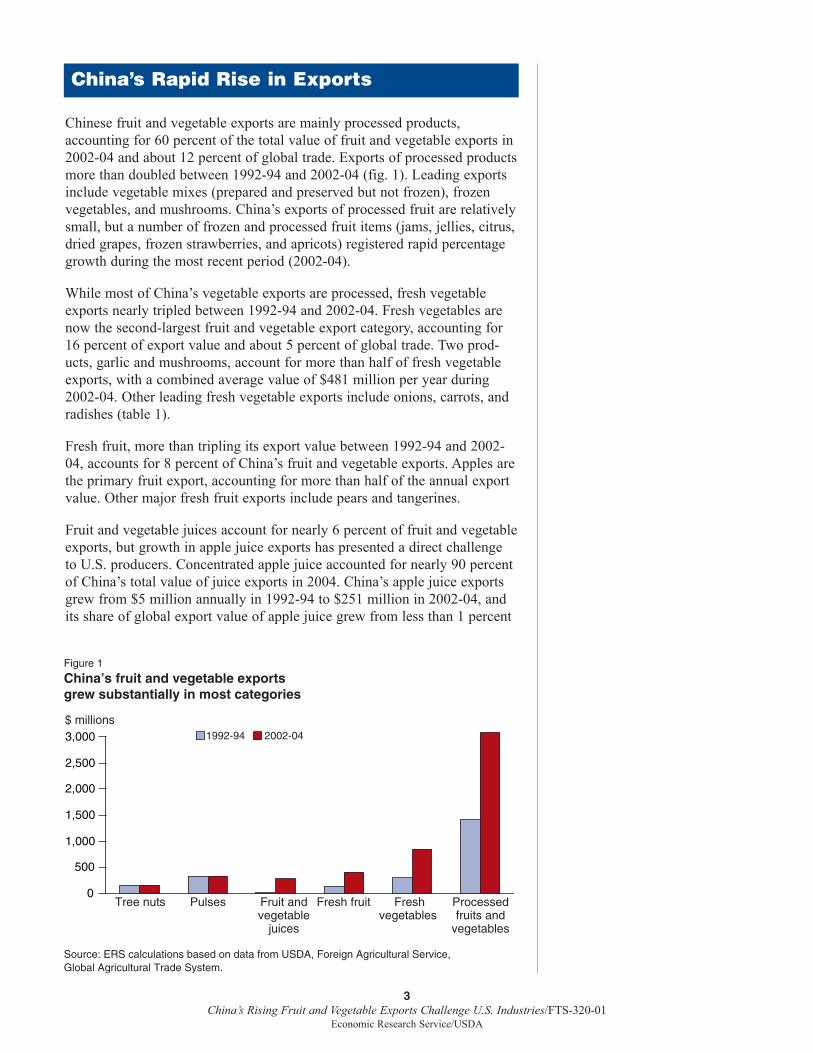
Chinese fruit and vegetable exports are mainly processed products,accounting for 60 percent of the total value of fruit and vegetable exports in2002-04 and about 12 percent of global trade. Exports of processed productsmore than doubled between 1992-94 and 2002-04 (fig. 1). Leading exportsinclude vegetable mixes (prepared and preserved but not frozen), frozenvegetables, and mushrooms. China’s exports of processed fruit are relativelysmall, but a number of frozen and processed fruit items (jams, jellies, citrus,dried grapes, frozen strawberries, and apricots) registered rapid percentagegrowth during the most recent period (2002-04).
While most of China’s vegetable exports are processed, fresh vegetableexports nearly tripled between 1992-94 and 2002-04. Fresh vegetables arenow the second-largest fruit and vegetable export category, accounting for16 percent of export value and about 5 percent of global trade. Two prod-ucts, garlic and mushrooms, account for more than half of fresh vegetableexports, with a combined average value of $481 million per year during2002-04. Other leading fresh vegetable exports include onions, carrots, andradishes (table 1).
Fresh fruit, more than tripling its export value between 1992-94 and 2002-04, accounts for 8 percent of China’s fruit and vegetable exports. Apples arethe primary fruit export, accounting for more than half of the annual exportvalue. Other major fresh fruit exports include pears and tangerines.
Fruit and vegetable juices account for nearly 6 percent of fruit and vegetableexports, but growth in apple juice exports has presented a direct challengeto U.S. producers. Concentrated apple juice accounted for nearly 90 percentof China’s total value of juice exports in 2004. China’s apple juice exportsgrew from $5 million annually in 1992-94 to $251 million in 2002-04, andits share of global export value of apple juice grew from less than 1 percent
3China’s Rising Fruit and Vegetable Exports Challenge U.S. Industries/FTS-320-01
Economic Research Service/USDA
China’s Rapid Rise in Exports
Figure 1
China’s fruit and vegetable exportsgrew substantially in most categories
Tree nuts Pulses Fruit andvegetable
juices
Fresh fruit Freshvegetables
Processedfruits and
vegetables
$ millions1992-94 2002-04
Source: ERS calculations based on data from USDA, Foreign Agricultural Service,Global Agricultural Trade System.
0
500
1,000
1,500
2,000
2,500
3,000
to more than 18 percent. Since 2001, China has been the world’s leadingapple juice exporter.
The remainder of China’s fruit and vegetable exports includes pulses (7percent) and tree nuts (3 percent). In contrast to the remarkable growth inother fruit and vegetable categories, pulse and nut exports have been rela-tively stable over the past decade. China’s exports of nuts are primarilychestnuts, walnuts, pine nuts, and gingko nuts.
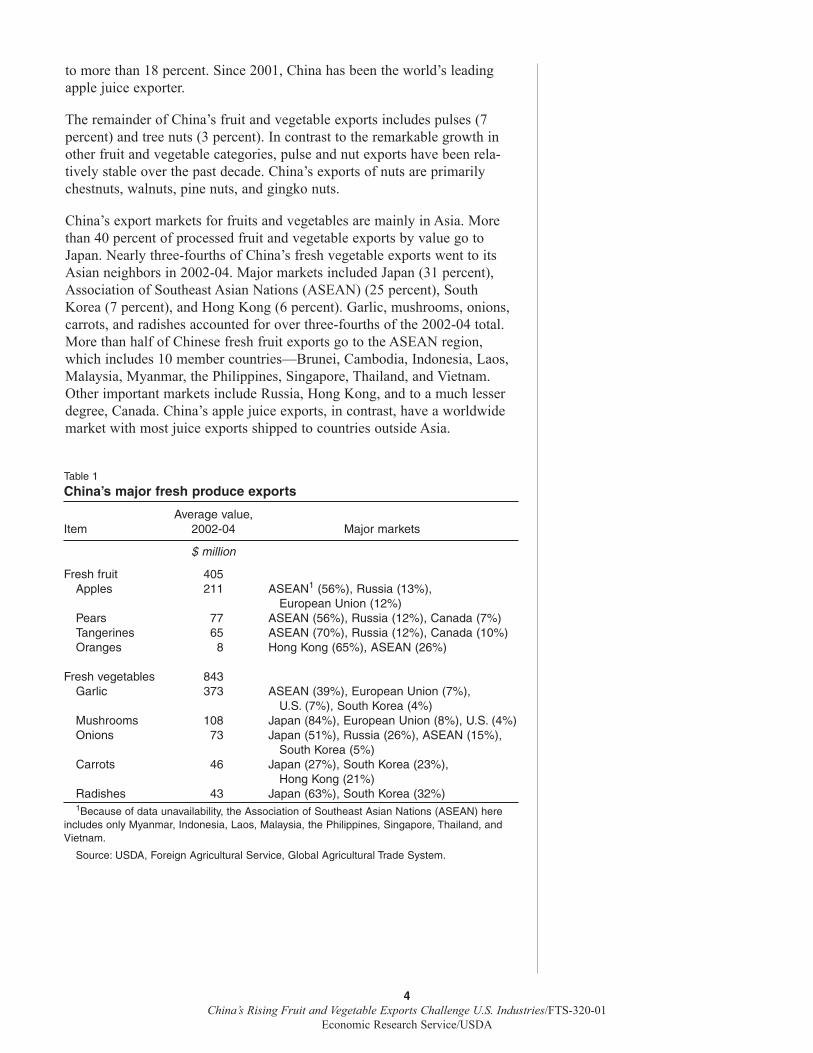
China’s export markets for fruits and vegetables are mainly in Asia. Morethan 40 percent of processed fruit and vegetable exports by value go toJapan. Nearly three-fourths of China’s fresh vegetable exports went to itsAsian neighbors in 2002-04. Major markets included Japan (31 percent),Association of Southeast Asian Nations (ASEAN) (25 percent), SouthKorea (7 percent), and Hong Kong (6 percent). Garlic, mushrooms, onions,carrots, and radishes accounted for over three-fourths of the 2002-04 total.More than half of Chinese fresh fruit exports go to the ASEAN region,which includes 10 member countries—Brunei, Cambodia, Indonesia, Laos,Malaysia, Myanmar, the Philippines, Singapore, Thailand, and Vietnam.Other important markets include Russia, Hong Kong, and to a much lesserdegree, Canada. China’s apple juice exports, in contrast, have a worldwidemarket with most juice exports shipped to countries outside Asia.
4China’s Rising Fruit and Vegetable Exports Challenge U.S. Industries/FTS-320-01
Economic Research Service/USDA
Table 1
China’s major fresh produce exports
Average value,Item 2002-04 Major markets
$ million
Fresh fruit 405Apples 211 ASEAN1 (56%), Russia (13%),
European Union (12%)Pears 77 ASEAN (56%), Russia (12%), Canada (7%)Tangerines 65 ASEAN (70%), Russia (12%), Canada (10%)Oranges 8 Hong Kong (65%), ASEAN (26%)
Fresh vegetables 843Garlic 373 ASEAN (39%), European Union (7%),
U.S. (7%), South Korea (4%)Mushrooms 108 Japan (84%), European Union (8%), U.S. (4%)Onions 73 Japan (51%), Russia (26%), ASEAN (15%),
South Korea (5%)Carrots 46 Japan (27%), South Korea (23%),
Hong Kong (21%)Radishes 43 Japan (63%), South Korea (32%)1Because of data unavailability, the Association of Southeast Asian Nations (ASEAN) here
includes only Myanmar, Indonesia, Laos, Malaysia, the Philippines, Singapore, Thailand, andVietnam.
Source: USDA, Foreign Agricultural Service, Global Agricultural Trade System.
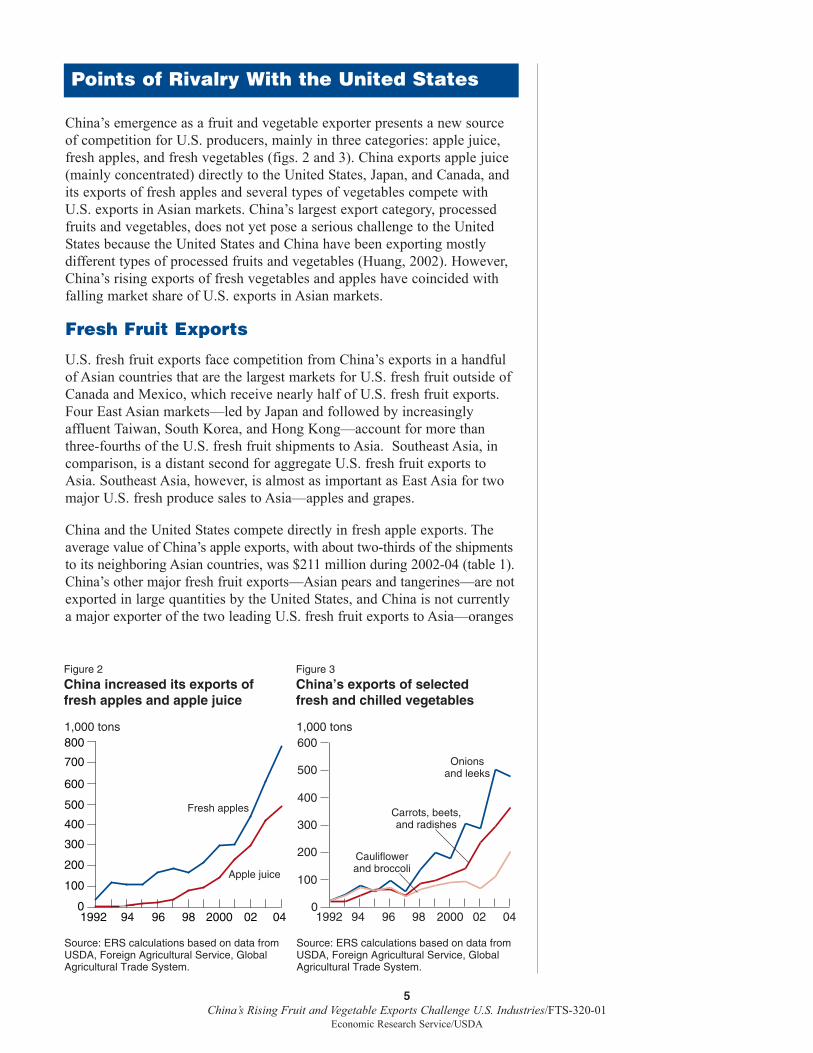
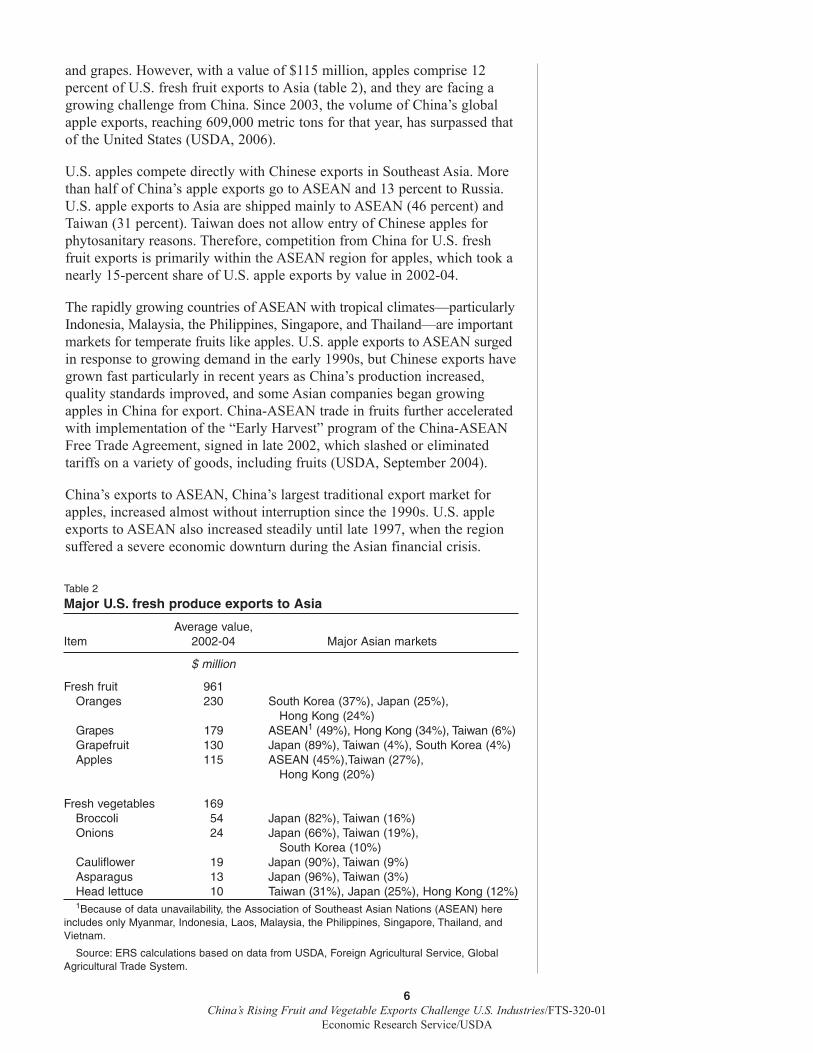
China’s emergence as a fruit and vegetable exporter presents a new sourceof competition for U.S. producers, mainly in three categories: apple juice,fresh apples, and fresh vegetables (figs. 2 and 3). China exports apple juice(mainly concentrated) directly to the United States, Japan, and Canada, andits exports of fresh apples and several types of vegetables compete withU.S. exports in Asian markets. China’s largest export category, processedfruits and vegetables, does not yet pose a serious challenge to the UnitedStates because the United States and China have been exporting mostlydifferent types of processed fruits and vegetables (Huang, 2002). However,China’s rising exports of fresh vegetables and apples have coincided withfalling market share of U.S. exports in Asian markets.
Fresh Fruit Exports
U.S. fresh fruit exports face competition from China’s exports in a handfulof Asian countries that are the largest markets for U.S. fresh fruit outside ofCanada and Mexico, which receive nearly half of U.S. fresh fruit exports.Four East Asian markets—led by Japan and followed by increasinglyaffluent Taiwan, South Korea, and Hong Kong—account for more thanthree-fourths of the U.S. fresh fruit shipments to Asia. Southeast Asia, incomparison, is a distant second for aggregate U.S. fresh fruit exports toAsia. Southeast Asia, however, is almost as important as East Asia for twomajor U.S. fresh produce sales to Asia—apples and grapes.
China and the United States compete directly in fresh apple exports. Theaverage value of China’s apple exports, with about two-thirds of the shipmentsto its neighboring Asian countries, was $211 million during 2002-04 (table 1).China’s other major fresh fruit exports—Asian pears and tangerines—are notexported in large quantities by the United States, and China is not currentlya major exporter of the two leading U.S. fresh fruit exports to Asia—oranges
5China’s Rising Fruit and Vegetable Exports Challenge U.S. Industries/FTS-320-01
Economic Research Service/USDA
Points of Rivalry With the United States
Figure 2
China increased its exports of fresh apples and apple juice
Source: ERS calculations based on data from USDA, Foreign Agricultural Service, Global Agricultural Trade System.
0
100
200
300
400
500
600
700
800
1992 94 96 98 2000 02 04
Fresh apples
Apple juice
1,000 tons
Figure 3
China’s exports of selected fresh and chilled vegetables
Source: ERS calculations based on data from USDA, Foreign Agricultural Service, Global Agricultural Trade System.
1,000 tons
0
100
200
300
400
500
600
1992 94 96 98 2000 02 04
Onionsand leeks
Carrots, beets,and radishes
Cauliflowerand broccoli
and grapes. However, with a value of $115 million, apples comprise 12percent of U.S. fresh fruit exports to Asia (table 2), and they are facing agrowing challenge from China. Since 2003, the volume of China’s globalapple exports, reaching 609,000 metric tons for that year, has surpassed thatof the United States (USDA, 2006).
U.S. apples compete directly with Chinese exports in Southeast Asia. Morethan half of China’s apple exports go to ASEAN and 13 percent to Russia.U.S. apple exports to Asia are shipped mainly to ASEAN (46 percent) andTaiwan (31 percent). Taiwan does not allow entry of Chinese apples forphytosanitary reasons. Therefore, competition from China for U.S. freshfruit exports is primarily within the ASEAN region for apples, which took anearly 15-percent share of U.S. apple exports by value in 2002-04.
The rapidly growing countries of ASEAN with tropical climates—particularlyIndonesia, Malaysia, the Philippines, Singapore, and Thailand—are importantmarkets for temperate fruits like apples. U.S. apple exports to ASEAN surgedin response to growing demand in the early 1990s, but Chinese exports havegrown fast particularly in recent years as China’s production increased,quality standards improved, and some Asian companies began growingapples in China for export. China-ASEAN trade in fruits further acceleratedwith implementation of the “Early Harvest” program of the China-ASEANFree Trade Agreement, signed in late 2002, which slashed or eliminatedtariffs on a variety of goods, including fruits (USDA, September 2004).
China’s exports to ASEAN, China’s largest traditional export market forapples, increased almost without interruption since the 1990s. U.S. appleexports to ASEAN also increased steadily until late 1997, when the regionsuffered a severe economic downturn during the Asian financial crisis.
6China’s Rising Fruit and Vegetable Exports Challenge U.S. Industries/FTS-320-01
Economic Research Service/USDA
Table 2
Major U.S. fresh produce exports to Asia
Average value,Item 2002-04 Major Asian markets
$ million
Fresh fruit 961Oranges 230 South Korea (37%), Japan (25%),
Hong Kong (24%)Grapes 179 ASEAN1 (49%), Hong Kong (34%), Taiwan (6%)Grapefruit 130 Japan (89%), Taiwan (4%), South Korea (4%)Apples 115 ASEAN (45%),Taiwan (27%),
Hong Kong (20%)
Fresh vegetables 169Broccoli 54 Japan (82%), Taiwan (16%)Onions 24 Japan (66%), Taiwan (19%),
South Korea (10%)Cauliflower 19 Japan (90%), Taiwan (9%)Asparagus 13 Japan (96%), Taiwan (3%)Head lettuce 10 Taiwan (31%), Japan (25%), Hong Kong (12%)1Because of data unavailability, the Association of Southeast Asian Nations (ASEAN) here
includes only Myanmar, Indonesia, Laos, Malaysia, the Philippines, Singapore, Thailand, andVietnam.
Source: ERS calculations based on data from USDA, Foreign Agricultural Service, GlobalAgricultural Trade System.
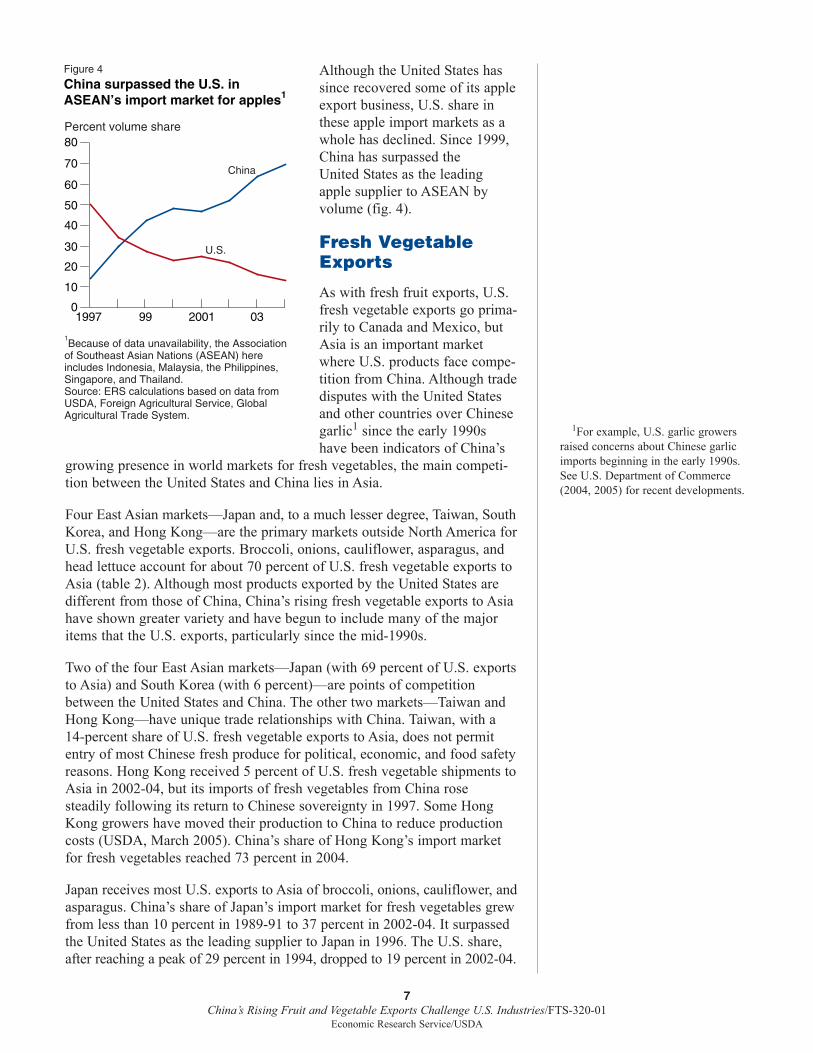
Although the United States hassince recovered some of its appleexport business, U.S. share inthese apple import markets as awhole has declined. Since 1999,China has surpassed the United States as the leadingapple supplier to ASEAN byvolume (fig. 4).
Fresh VegetableExports
As with fresh fruit exports, U.S.fresh vegetable exports go prima-rily to Canada and Mexico, butAsia is an important marketwhere U.S. products face compe-tition from China. Although tradedisputes with the United Statesand other countries over Chinesegarlic1 since the early 1990shave been indicators of China’s
growing presence in world markets for fresh vegetables, the main competi-tion between the United States and China lies in Asia.
Four East Asian markets—Japan and, to a much lesser degree, Taiwan, SouthKorea, and Hong Kong—are the primary markets outside North America forU.S. fresh vegetable exports. Broccoli, onions, cauliflower, asparagus, andhead lettuce account for about 70 percent of U.S. fresh vegetable exports toAsia (table 2). Although most products exported by the United States aredifferent from those of China, China’s rising fresh vegetable exports to Asiahave shown greater variety and have begun to include many of the majoritems that the U.S. exports, particularly since the mid-1990s.
Two of the four East Asian markets—Japan (with 69 percent of U.S. exportsto Asia) and South Korea (with 6 percent)—are points of competitionbetween the United States and China. The other two markets—Taiwan andHong Kong—have unique trade relationships with China. Taiwan, with a14-percent share of U.S. fresh vegetable exports to Asia, does not permitentry of most Chinese fresh produce for political, economic, and food safetyreasons. Hong Kong received 5 percent of U.S. fresh vegetable shipments toAsia in 2002-04, but its imports of fresh vegetables from China rosesteadily following its return to Chinese sovereignty in 1997. Some HongKong growers have moved their production to China to reduce productioncosts (USDA, March 2005). China’s share of Hong Kong’s import marketfor fresh vegetables reached 73 percent in 2004.
Japan receives most U.S. exports to Asia of broccoli, onions, cauliflower, andasparagus. China’s share of Japan’s import market for fresh vegetables grewfrom less than 10 percent in 1989-91 to 37 percent in 2002-04. It surpassedthe United States as the leading supplier to Japan in 1996. The U.S. share,after reaching a peak of 29 percent in 1994, dropped to 19 percent in 2002-04.
7China’s Rising Fruit and Vegetable Exports Challenge U.S. Industries/FTS-320-01
Economic Research Service/USDA
Figure 4
China surpassed the U.S. in ASEAN’s import market for apples1
Percent volume share
0
10
20
30
40
50
60
70
80
1997 99 2001 03
China
U.S.
1Because of data unavailability, the Association
of Southeast Asian Nations (ASEAN) hereincludes Indonesia, Malaysia, the Philippines, Singapore, and Thailand.Source: ERS calculations based on data from USDA, Foreign Agricultural Service, Global Agricultural Trade System.
1For example, U.S. garlic growersraised concerns about Chinese garlicimports beginning in the early 1990s.See U.S. Department of Commerce(2004, 2005) for recent developments.
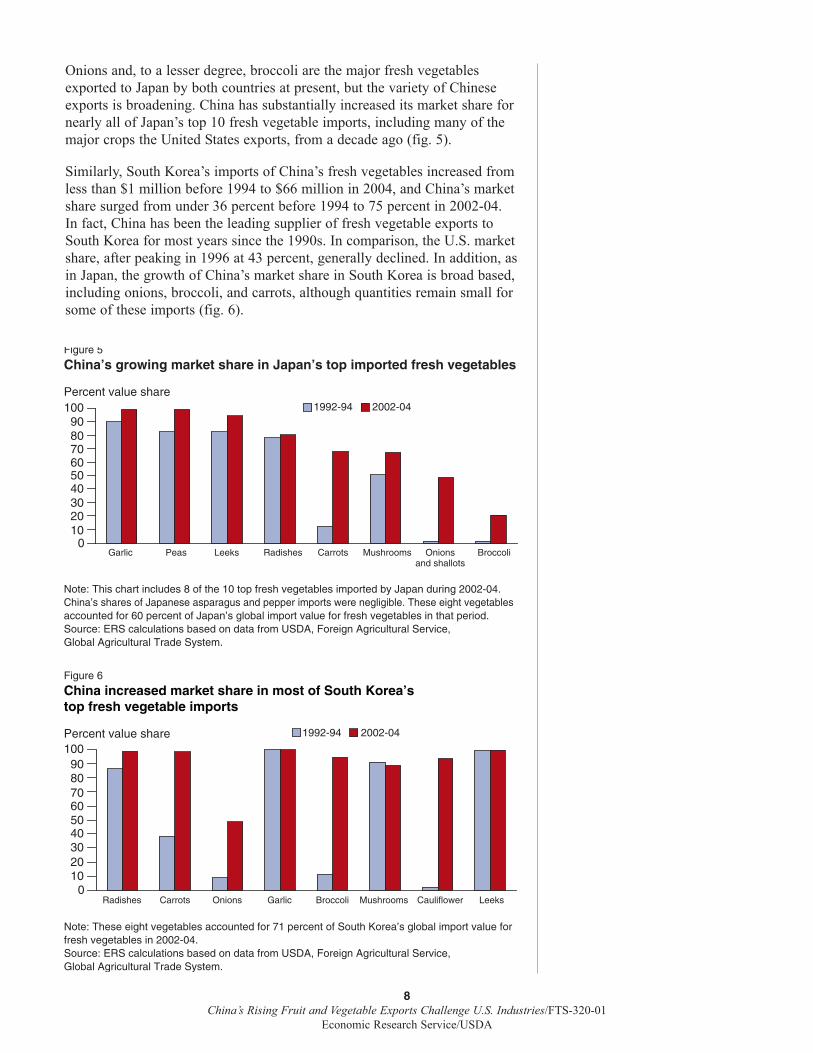
Onions and, to a lesser degree, broccoli are the major fresh vegetablesexported to Japan by both countries at present, but the variety of Chineseexports is broadening. China has substantially increased its market share fornearly all of Japan’s top 10 fresh vegetable imports, including many of themajor crops the United States exports, from a decade ago (fig. 5).
Similarly, South Korea’s imports of China’s fresh vegetables increased fromless than $1 million before 1994 to $66 million in 2004, and China’s marketshare surged from under 36 percent before 1994 to 75 percent in 2002-04.In fact, China has been the leading supplier of fresh vegetable exports toSouth Korea for most years since the 1990s. In comparison, the U.S. marketshare, after peaking in 1996 at 43 percent, generally declined. In addition, asin Japan, the growth of China’s market share in South Korea is broad based,including onions, broccoli, and carrots, although quantities remain small forsome of these imports (fig. 6).
8China’s Rising Fruit and Vegetable Exports Challenge U.S. Industries/FTS-320-01
Economic Research Service/USDA
Figure 6
China increased market share in most of South Korea’s top fresh vegetable imports
Percent value share 1992-94 2002-04
Note: These eight vegetables accounted for 71 percent of South Korea’s global import value forfresh vegetables in 2002-04.Source: ERS calculations based on data from USDA, Foreign Agricultural Service,Global Agricultural Trade System.
Radishes Carrots Onions Garlic Broccoli Mushrooms Cauliflower Leeks
100
30405060708090
20
010
Figure 5
China’s growing market share in Japan’s top imported fresh vegetables
Percent value share
Note: This chart includes 8 of the 10 top fresh vegetables imported by Japan during 2002-04.China’s shares of Japanese asparagus and pepper imports were negligible. These eight vegetablesaccounted for 60 percent of Japan’s global import value for fresh vegetables in that period.Source: ERS calculations based on data from USDA, Foreign Agricultural Service,Global Agricultural Trade System.
Garlic Peas Leeks Radishes Carrots Mushrooms Onionsand shallots
Broccoli
100
30405060708090
20
010
1992-94 2002-04
Juice Exports
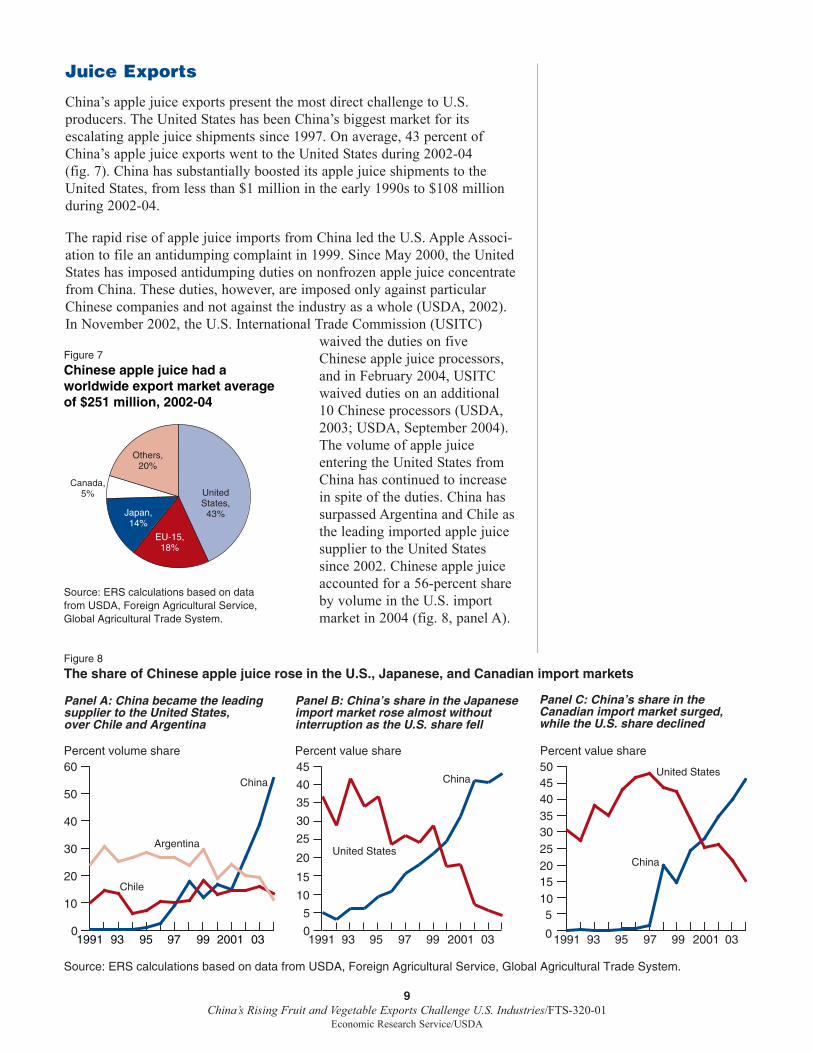
China’s apple juice exports present the most direct challenge to U.S.producers. The United States has been China’s biggest market for its escalating apple juice shipments since 1997. On average, 43 percent ofChina’s apple juice exports went to the United States during 2002-04 (fig. 7). China has substantially boosted its apple juice shipments to theUnited States, from less than $1 million in the early 1990s to $108 millionduring 2002-04.
The rapid rise of apple juice imports from China led the U.S. Apple Associ-ation to file an antidumping complaint in 1999. Since May 2000, the UnitedStates has imposed antidumping duties on nonfrozen apple juice concentratefrom China. These duties, however, are imposed only against particularChinese companies and not against the industry as a whole (USDA, 2002).In November 2002, the U.S. International Trade Commission (USITC)
waived the duties on fiveChinese apple juice processors,and in February 2004, USITCwaived duties on an additional10 Chinese processors (USDA,2003; USDA, September 2004).The volume of apple juiceentering the United States fromChina has continued to increasein spite of the duties. China hassurpassed Argentina and Chile asthe leading imported apple juicesupplier to the United Statessince 2002. Chinese apple juiceaccounted for a 56-percent shareby volume in the U.S. importmarket in 2004 (fig. 8, panel A).
9China’s Rising Fruit and Vegetable Exports Challenge U.S. Industries/FTS-320-01
Economic Research Service/USDA
Figure 7
Chinese apple juice had aworldwide export market average of $251 million, 2002-04
Japan,14%
Canada,5%
Others,20%
UnitedStates,43%
EU-15,18%
Source: ERS calculations based on datafrom USDA, Foreign Agricultural Service, Global Agricultural Trade System.
Figure 8
The share of Chinese apple juice rose in the U.S., Japanese, and Canadian import markets
Source: ERS calculations based on data from USDA, Foreign Agricultural Service, Global Agricultural Trade System.
Percent volume share
Panel A: China became the leadingsupplier to the United States, over Chile and Argentina
0
10
20
30
40
50
60
1991 93 95 97 99 2001 03
China
Chile
Argentina
Percent value share
Panel B: China’s share in the Japaneseimport market rose almost without interruption as the U.S. share fell
United States
China
Percent value share
Panel C: China’s share in the Canadian import market surged, while the U.S. share declined
0
5101520253035404550
0
5
10
15
20
25
30
35
40
45
1991 93 95 97 99 2001 03 1991 93 95 97 99 2001 03
United States
China
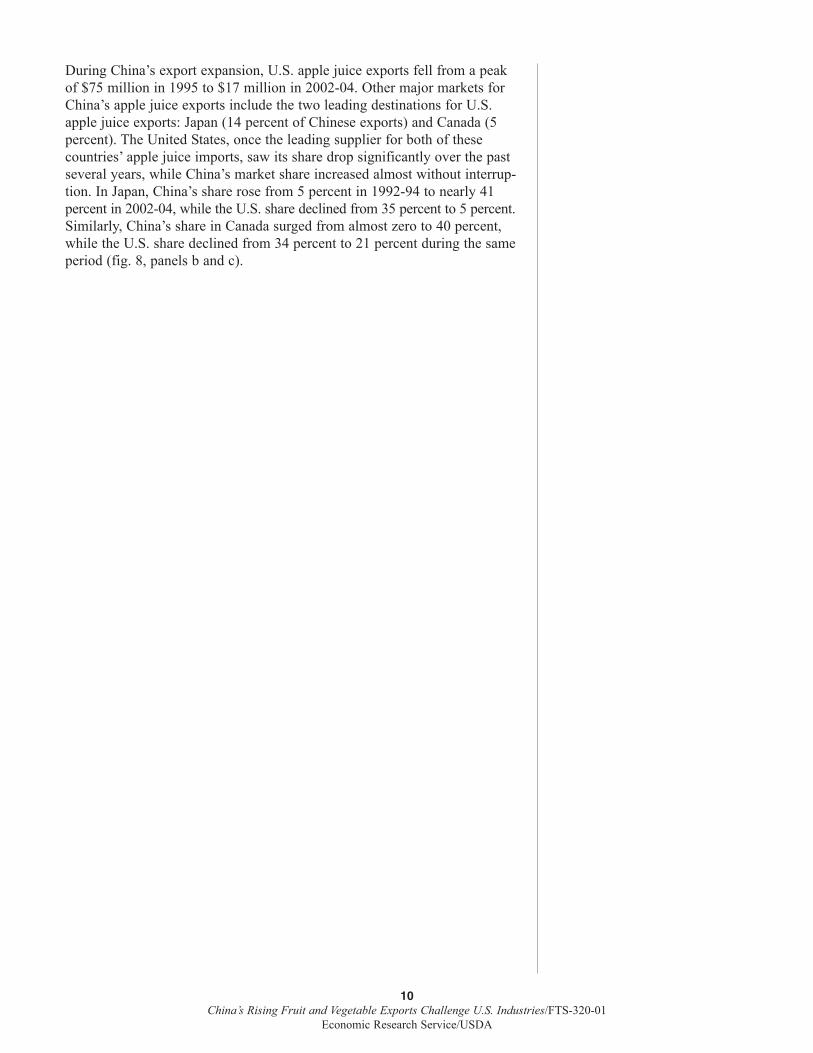
During China’s export expansion, U.S. apple juice exports fell from a peakof $75 million in 1995 to $17 million in 2002-04. Other major markets forChina’s apple juice exports include the two leading destinations for U.S.apple juice exports: Japan (14 percent of Chinese exports) and Canada (5percent). The United States, once the leading supplier for both of thesecountries’ apple juice imports, saw its share drop significantly over the pastseveral years, while China’s market share increased almost without interrup-tion. In Japan, China’s share rose from 5 percent in 1992-94 to nearly 41percent in 2002-04, while the U.S. share declined from 35 percent to 5 percent.Similarly, China’s share in Canada surged from almost zero to 40 percent,while the U.S. share declined from 34 percent to 21 percent during the sameperiod (fig. 8, panels b and c).
10China’s Rising Fruit and Vegetable Exports Challenge U.S. Industries/FTS-320-01
Economic Research Service/USDA
Farmers Respond to Profits
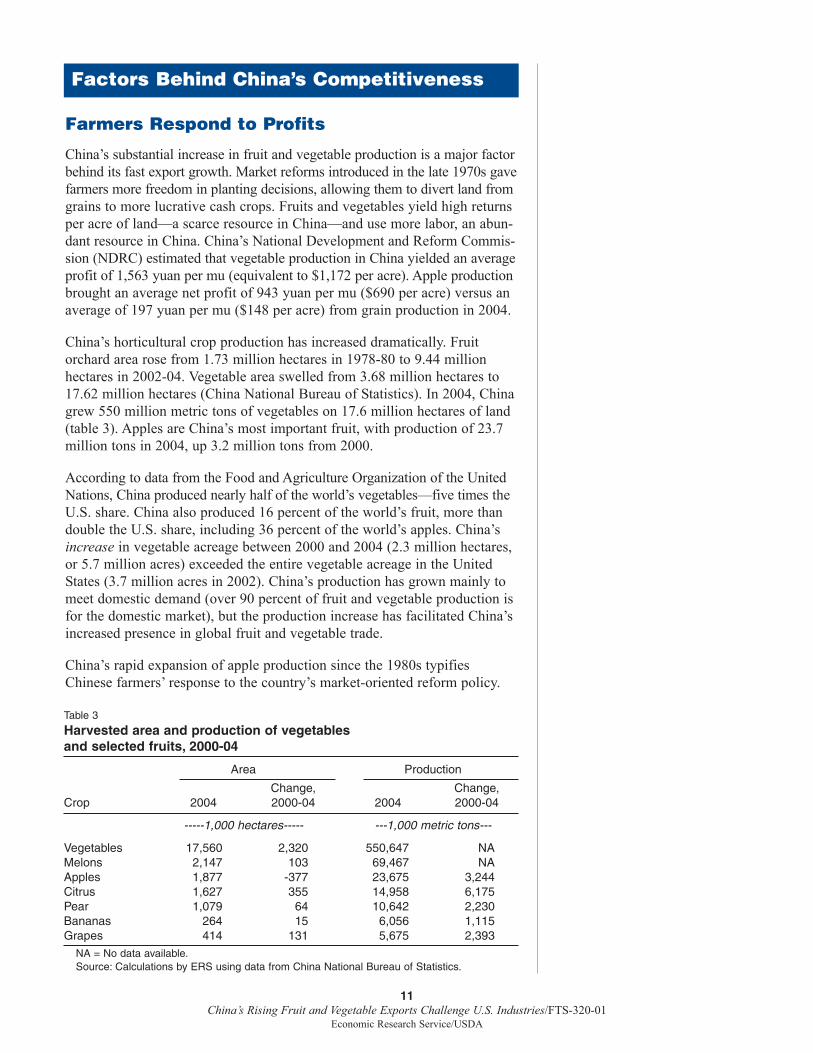
China’s substantial increase in fruit and vegetable production is a major factorbehind its fast export growth. Market reforms introduced in the late 1970s gavefarmers more freedom in planting decisions, allowing them to divert land fromgrains to more lucrative cash crops. Fruits and vegetables yield high returnsper acre of land—a scarce resource in China—and use more labor, an abun-dant resource in China. China’s National Development and Reform Commis-sion (NDRC) estimated that vegetable production in China yielded an averageprofit of 1,563 yuan per mu (equivalent to $1,172 per acre). Apple productionbrought an average net profit of 943 yuan per mu ($690 per acre) versus anaverage of 197 yuan per mu ($148 per acre) from grain production in 2004.
China’s horticultural crop production has increased dramatically. Fruitorchard area rose from 1.73 million hectares in 1978-80 to 9.44 millionhectares in 2002-04. Vegetable area swelled from 3.68 million hectares to17.62 million hectares (China National Bureau of Statistics). In 2004, Chinagrew 550 million metric tons of vegetables on 17.6 million hectares of land(table 3). Apples are China’s most important fruit, with production of 23.7million tons in 2004, up 3.2 million tons from 2000.
According to data from the Food and Agriculture Organization of the UnitedNations, China produced nearly half of the world’s vegetables—five times theU.S. share. China also produced 16 percent of the world’s fruit, more thandouble the U.S. share, including 36 percent of the world’s apples. China’sincrease in vegetable acreage between 2000 and 2004 (2.3 million hectares,or 5.7 million acres) exceeded the entire vegetable acreage in the UnitedStates (3.7 million acres in 2002). China’s production has grown mainly tomeet domestic demand (over 90 percent of fruit and vegetable production isfor the domestic market), but the production increase has facilitated China’sincreased presence in global fruit and vegetable trade.
China’s rapid expansion of apple production since the 1980s typifiesChinese farmers’ response to the country’s market-oriented reform policy.
11China’s Rising Fruit and Vegetable Exports Challenge U.S. Industries/FTS-320-01
Economic Research Service/USDA
Factors Behind China’s Competitiveness
Table 3
Harvested area and production of vegetables and selected fruits, 2000-04
Area Production
Change, Change,Crop 2004 2000-04 2004 2000-04
-----1,000 hectares----- ---1,000 metric tons---
Vegetables 17,560 2,320 550,647 NAMelons 2,147 103 69,467 NAApples 1,877 -377 23,675 3,244Citrus 1,627 355 14,958 6,175Pear 1,079 64 10,642 2,230Bananas 264 15 6,056 1,115Grapes 414 131 5,675 2,393
NA = No data available.Source: Calculations by ERS using data from China National Bureau of Statistics.
China’s apple production rose from 2.5 million tons in 1978-80 to 201.2million tons in 2001-03 (China National Bureau of Statistics). Since theearly 1990s, China has overtaken the United States as the world’s largestapple producer and now accounts for more than one-third of world appleproduction (Food and Agriculture Organization of the United Nations,2005). While apple orchard acreage in China has fallen after peaking in1996, production has continued to increase because of better managementtechniques and commercialization of orchards (USDA, 2003).
Low Production Costs
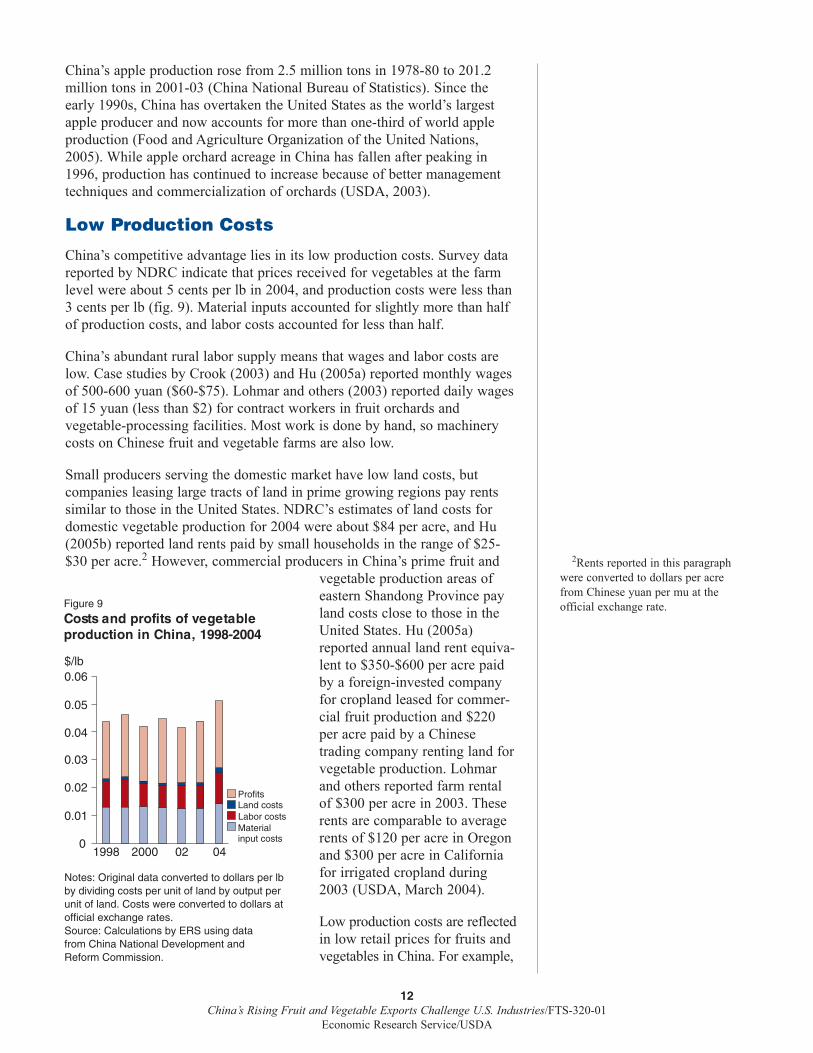
China’s competitive advantage lies in its low production costs. Survey datareported by NDRC indicate that prices received for vegetables at the farmlevel were about 5 cents per lb in 2004, and production costs were less than3 cents per lb (fig. 9). Material inputs accounted for slightly more than halfof production costs, and labor costs accounted for less than half.
China’s abundant rural labor supply means that wages and labor costs arelow. Case studies by Crook (2003) and Hu (2005a) reported monthly wagesof 500-600 yuan ($60-$75). Lohmar and others (2003) reported daily wagesof 15 yuan (less than $2) for contract workers in fruit orchards andvegetable-processing facilities. Most work is done by hand, so machinerycosts on Chinese fruit and vegetable farms are also low.
Small producers serving the domestic market have low land costs, butcompanies leasing large tracts of land in prime growing regions pay rentssimilar to those in the United States. NDRC’s estimates of land costs fordomestic vegetable production for 2004 were about $84 per acre, and Hu(2005b) reported land rents paid by small households in the range of $25-$30 per acre.2 However, commercial producers in China’s prime fruit and
vegetable production areas ofeastern Shandong Province payland costs close to those in theUnited States. Hu (2005a)reported annual land rent equiva-lent to $350-$600 per acre paidby a foreign-invested companyfor cropland leased for commer-cial fruit production and $220per acre paid by a Chinesetrading company renting land forvegetable production. Lohmarand others reported farm rentalof $300 per acre in 2003. Theserents are comparable to averagerents of $120 per acre in Oregonand $300 per acre in Californiafor irrigated cropland during2003 (USDA, March 2004).
Low production costs are reflectedin low retail prices for fruits andvegetables in China. For example,
12China’s Rising Fruit and Vegetable Exports Challenge U.S. Industries/FTS-320-01
Economic Research Service/USDA
Figure 9
Costs and profits of vegetable production in China, 1998-2004
$/lb
0
0.01
0.02
0.03
0.04
0.05
0.06
1998 2000 02 04
Material input costs
ProfitsLand costsLabor costs
Notes: Original data converted to dollars per lbby dividing costs per unit of land by output per unit of land. Costs were converted to dollars at official exchange rates.Source: Calculations by ERS using data from China National Development and Reform Commission.
2Rents reported in this paragraphwere converted to dollars per acrefrom Chinese yuan per mu at the official exchange rate.
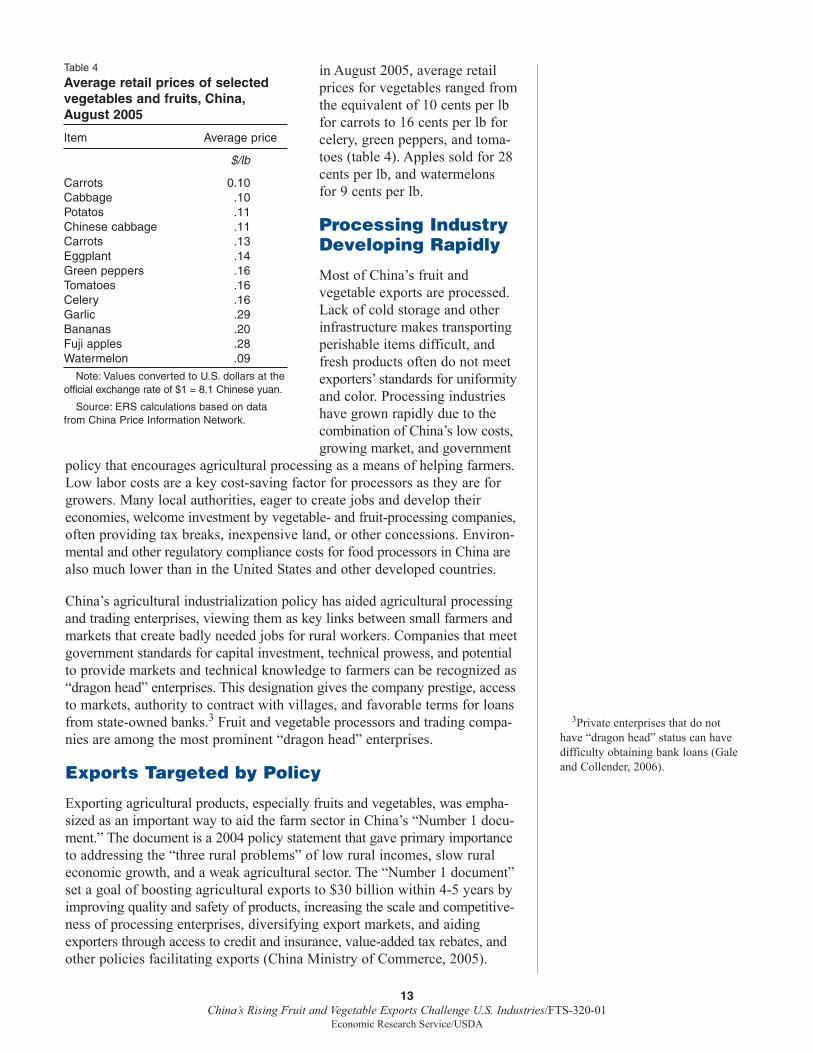
in August 2005, average retailprices for vegetables ranged fromthe equivalent of 10 cents per lbfor carrots to 16 cents per lb forcelery, green peppers, and toma-toes (table 4). Apples sold for 28cents per lb, and watermelons for 9 cents per lb.
Processing IndustryDeveloping Rapidly
Most of China’s fruit andvegetable exports are processed.Lack of cold storage and otherinfrastructure makes transportingperishable items difficult, andfresh products often do not meetexporters’ standards for uniformityand color. Processing industrieshave grown rapidly due to thecombination of China’s low costs,growing market, and government
policy that encourages agricultural processing as a means of helping farmers.Low labor costs are a key cost-saving factor for processors as they are forgrowers. Many local authorities, eager to create jobs and develop theireconomies, welcome investment by vegetable- and fruit-processing companies,often providing tax breaks, inexpensive land, or other concessions. Environ-mental and other regulatory compliance costs for food processors in China arealso much lower than in the United States and other developed countries.
China’s agricultural industrialization policy has aided agricultural processingand trading enterprises, viewing them as key links between small farmers andmarkets that create badly needed jobs for rural workers. Companies that meetgovernment standards for capital investment, technical prowess, and potentialto provide markets and technical knowledge to farmers can be recognized as“dragon head” enterprises. This designation gives the company prestige, accessto markets, authority to contract with villages, and favorable terms for loansfrom state-owned banks.3 Fruit and vegetable processors and trading compa-nies are among the most prominent “dragon head” enterprises.
Exports Targeted by Policy
Exporting agricultural products, especially fruits and vegetables, was empha-sized as an important way to aid the farm sector in China’s “Number 1 docu-ment.” The document is a 2004 policy statement that gave primary importanceto addressing the “three rural problems” of low rural incomes, slow ruraleconomic growth, and a weak agricultural sector. The “Number 1 document”set a goal of boosting agricultural exports to $30 billion within 4-5 years byimproving quality and safety of products, increasing the scale and competitive-ness of processing enterprises, diversifying export markets, and aidingexporters through access to credit and insurance, value-added tax rebates, andother policies facilitating exports (China Ministry of Commerce, 2005).
13China’s Rising Fruit and Vegetable Exports Challenge U.S. Industries/FTS-320-01
Economic Research Service/USDA
3Private enterprises that do not have “dragon head” status can havedifficulty obtaining bank loans (Galeand Collender, 2006).
Table 4
Average retail prices of selectedvegetables and fruits, China,August 2005
Item Average price
$/lb
Carrots 0.10Cabbage .10Potatos .11Chinese cabbage .11Carrots .13Eggplant .14Green peppers .16Tomatoes .16Celery .16Garlic .29Bananas .20Fuji apples .28Watermelon .09
Note: Values converted to U.S. dollars at theofficial exchange rate of $1 = 8.1 Chinese yuan.
Source: ERS calculations based on datafrom China Price Information Network.
While the Chinese fruit and vegetable sector appears to have the potential tobecome an export juggernaut, several factors may impede China’s exportgrowth.
High Marketing Costs
China’s advantage in production costs does not necessarily translate intocompetitiveness in final markets. As produce moves through the marketingchain, high markups, losses, waste, and other inefficiencies dramaticallyraise the cost. One Chinese official estimated that about 30 percent ofvegetables in China are lost post-harvest due to poor storage and that 90percent of vegetables arrive at market with inadequate grading, washing, orpackaging (Lohmar and others, 2003).
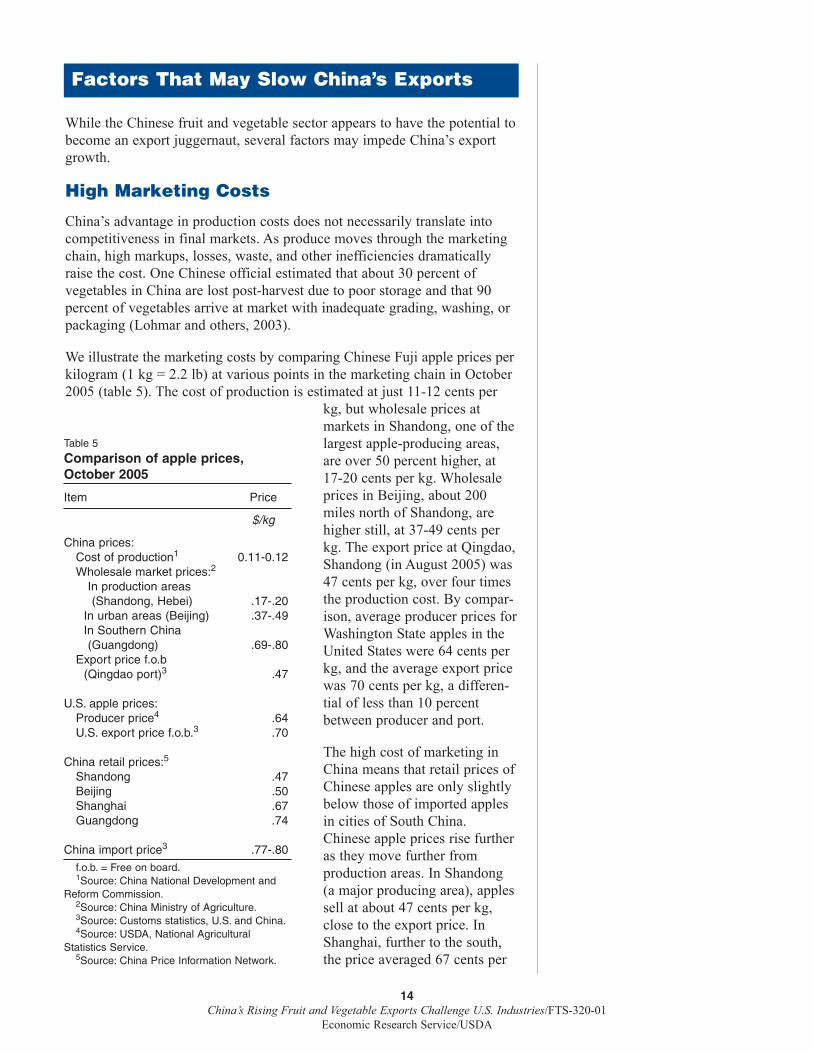
We illustrate the marketing costs by comparing Chinese Fuji apple prices perkilogram (1 kg = 2.2 lb) at various points in the marketing chain in October2005 (table 5). The cost of production is estimated at just 11-12 cents per
kg, but wholesale prices atmarkets in Shandong, one of thelargest apple-producing areas,are over 50 percent higher, at17-20 cents per kg. Wholesaleprices in Beijing, about 200miles north of Shandong, arehigher still, at 37-49 cents perkg. The export price at Qingdao,Shandong (in August 2005) was47 cents per kg, over four timesthe production cost. By compar-ison, average producer prices forWashington State apples in theUnited States were 64 cents perkg, and the average export pricewas 70 cents per kg, a differen-tial of less than 10 percentbetween producer and port.
The high cost of marketing inChina means that retail prices ofChinese apples are only slightlybelow those of imported applesin cities of South China.Chinese apple prices rise furtheras they move further fromproduction areas. In Shandong(a major producing area), applessell at about 47 cents per kg,close to the export price. InShanghai, further to the south,the price averaged 67 cents per
14China’s Rising Fruit and Vegetable Exports Challenge U.S. Industries/FTS-320-01
Economic Research Service/USDA
Factors That May Slow China’s Exports
Table 5
Comparison of apple prices,October 2005
Item Price
$/kg
China prices:Cost of production1 0.11-0.12Wholesale market prices:2
In production areas (Shandong, Hebei) .17-.20
In urban areas (Beijing) .37-.49In Southern China(Guangdong) .69-.80
Export price f.o.b (Qingdao port)3 .47
U.S. apple prices:Producer price4 .64U.S. export price f.o.b.3 .70
China retail prices:5
Shandong .47Beijing .50Shanghai .67Guangdong .74
China import price3 .77-.80
f.o.b. = Free on board.1Source: China National Development and
Reform Commission.2Source: China Ministry of Agriculture.3Source: Customs statistics, U.S. and China.4Source: USDA, National Agricultural
Statistics Service.5Source: China Price Information Network.
kg. In Guangdong Province (adjacent to Hong Kong), the average was 74cents per kg, very close to the average price of imports of 77-80 cents perkg. About 40 percent of China’s apple imports came from the United Statesin 2005, and about one-third came from Chile.
While Chinese apples appear to have a tremendous cost advantage at the farmlevel, high marketing costs mean that they have only a slight advantage overapples from the United States, Chile, and other countries by the time theyreach markets in southern China. High marketing costs stem from a variety ofsources, including poor rural roads, lack of refrigerated storage and transporta-tion, spoilage and waste, inefficiency in the transportation sector, and longmarketing chains with numerous middlemen, each of whom takes a markup.
While marketing remains a problem, China is improving its market infra-structure rapidly. A vast system of toll roads now connects nearly all majorcities and most towns, and the Government is in the midst of a campaign tobuild roads in rural areas. Since 1995, China’s Government has promotedconstruction of a “green corridor” network of roads designed to connectareas that produce fresh agricultural produce with urban markets. Many coldstorage facilities have been built in recent years (Crook, 2003; Lohmar andothers, 2003).
The emergence of modern supermarket chains with advanced procurementsystems is advancing marketing efficiency greatly. The opening of thewholesale and distribution sectors to foreign competitors in 2005 as a resultof China’s commitments as a World Trade Organization member is likely tobring even greater competition and efficiency in marketing as well asincreased investment in cold chain facilities (USDA, December 2005).
Growing Domestic Market
Growing domestic demand for fruits and vegetables is providing an increas-ingly attractive alternative to exports, a factor that may constrain growth inChinese exports in coming years. Vegetables are a major part of Chinesemeals, whether at home or in banquet halls. Chinese consumers are cuttingback on consumption of traditional cabbage and other low-end vegetables anddiversifying their consumption to include a wider variety of vegetables. Fruitsare popular as desserts and snacks, and imported fruits are a luxury itemoften given as gifts. Between 1990 and 2004, urban per capita consumptionof fruits and melons rose 37 percent, and rural consumption nearly tripled.
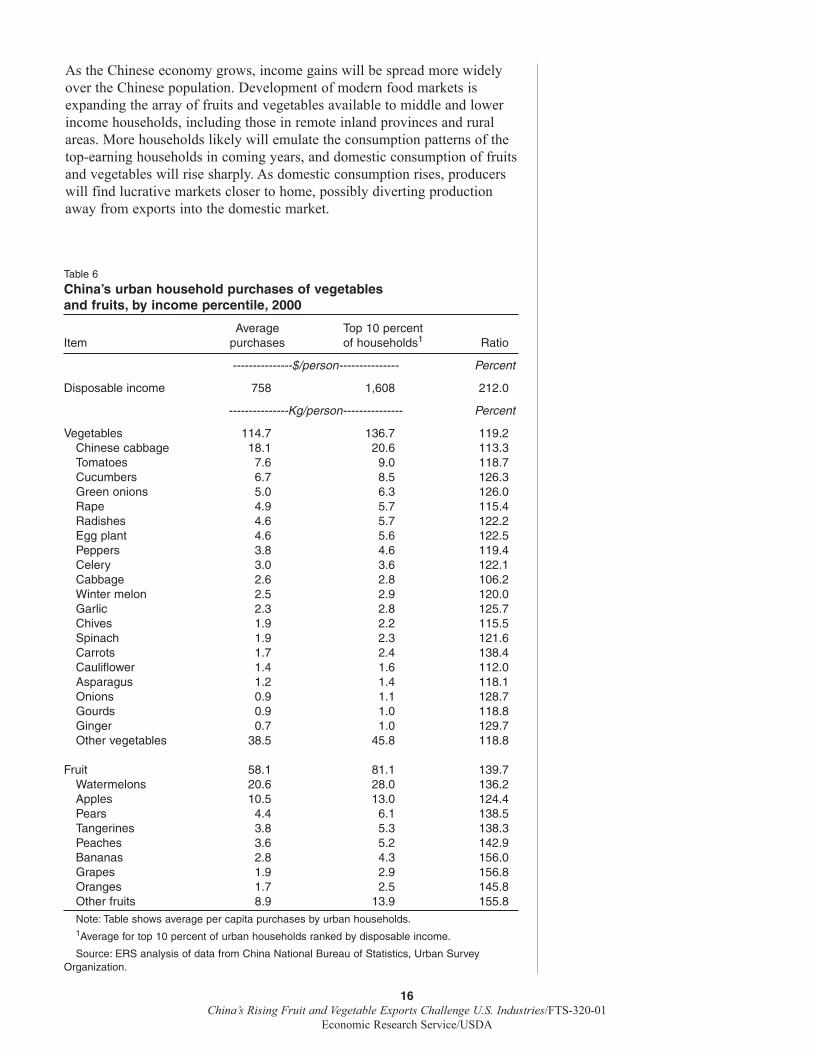
As Chinese household incomes rise, fruit and vegetable consumption willrise. The relationship between income and fruit and vegetable consumptionis evident from a comparison of per capita purchases by high-income house-holds in China with the overall average. For example, household surveydata for 2000 show that the top 10 percent of households (ranked by dispos-able income per capita) purchased 19 percent more vegetables and 40percent more fruit than did the urban per capita average (table 6). Purchasesof several important export crops—carrots, onions, garlic, eggplant, celery,and spinach—are especially popular among high-income Chinese house-holds, with purchases by the top 10 percent exceeding the urban average by20-40 percent. The top 10 percent of Chinese urban households purchased24 percent more apples than did the average urban household, and theirpurchases of other fruits were even higher.
15China’s Rising Fruit and Vegetable Exports Challenge U.S. Industries/FTS-320-01
Economic Research Service/USDA
As the Chinese economy grows, income gains will be spread more widelyover the Chinese population. Development of modern food markets isexpanding the array of fruits and vegetables available to middle and lowerincome households, including those in remote inland provinces and ruralareas. More households likely will emulate the consumption patterns of thetop-earning households in coming years, and domestic consumption of fruitsand vegetables will rise sharply. As domestic consumption rises, producerswill find lucrative markets closer to home, possibly diverting productionaway from exports into the domestic market.
16China’s Rising Fruit and Vegetable Exports Challenge U.S. Industries/FTS-320-01
Economic Research Service/USDA
Table 6
China’s urban household purchases of vegetables and fruits, by income percentile, 2000
Average Top 10 percentItem purchases of households1 Ratio
---------------$/person--------------- Percent
Disposable income 758 1,608 212.0
---------------Kg/person--------------- Percent
Vegetables 114.7 136.7 119.2Chinese cabbage 18.1 20.6 113.3Tomatoes 7.6 9.0 118.7Cucumbers 6.7 8.5 126.3Green onions 5.0 6.3 126.0Rape 4.9 5.7 115.4Radishes 4.6 5.7 122.2Egg plant 4.6 5.6 122.5Peppers 3.8 4.6 119.4Celery 3.0 3.6 122.1Cabbage 2.6 2.8 106.2Winter melon 2.5 2.9 120.0Garlic 2.3 2.8 125.7Chives 1.9 2.2 115.5Spinach 1.9 2.3 121.6Carrots 1.7 2.4 138.4Cauliflower 1.4 1.6 112.0Asparagus 1.2 1.4 118.1Onions 0.9 1.1 128.7Gourds 0.9 1.0 118.8Ginger 0.7 1.0 129.7Other vegetables 38.5 45.8 118.8
Fruit 58.1 81.1 139.7Watermelons 20.6 28.0 136.2Apples 10.5 13.0 124.4Pears 4.4 6.1 138.5Tangerines 3.8 5.3 138.3Peaches 3.6 5.2 142.9Bananas 2.8 4.3 156.0Grapes 1.9 2.9 156.8Oranges 1.7 2.5 145.8Other fruits 8.9 13.9 155.8
Note: Table shows average per capita purchases by urban households.1Average for top 10 percent of urban households ranked by disposable income.
Source: ERS analysis of data from China National Bureau of Statistics, Urban SurveyOrganization.
Food Safety and Phytosanitary Concerns
High-quality requirements and strict phytosanitary regulations in Japan andother Asian countries deter the entry of Chinese fresh fruits. In 2002,Chinese vegetables suffered a series of widely publicized setbacks in Japandue to pesticide residues on produce imported by Japan. In 2004, pest prob-lems also interrupted Chinese apple exports to Canada. Food safety hasbecome a much bigger concern in the domestic Chinese market as well.
Chinese fruits and vegetables often have high levels of pesticide residues,heavy metals, and other contaminants. Water, soil, and air are dangerouslypolluted in many rural areas as a result of heavy industrialization and laxenvironmental regulation. Heavy chemical use results from the intensivecultivation of China’s relatively scarce cropland. Chinese farmers rely onchemical fertilizer to coax high yields out of soil that has little organicmatter, and pesticides are applied in high doses to control pest infestationsthat result from monocropping (when one type of crop is grown). Farmersgenerally know little about the proper use of fertilizers and pesticides, andthe agricultural extension service is weak. Pesticides, fertilizers, and seedspurchased by farmers are often fake or mislabeled.
China is trying to raise quality standards through “green food” and “pollutionfree” production standards promoted by China’s Ministry of Agriculture.4These standards prohibit or limit the use of potentially harmful chemicals bygrowers and set limits on the presence of contaminants in soil, water, and air inproduction areas. These standards are primarily for the domestic market butalso are part of a general escalation of quality and safety standards.
Many enterprises are contracting with farmers to produce vegetables forexport and increasingly for the domestic market. One of the motivations forcontracting is to gain direct control over the use of chemical substances.Contracts often specify the chemicals to be used, and farmers often obtainchemicals on credit from the contracting enterprise (Crook, 2003; Hu,2005a; The Nikkei Weekly, 2002). One of the purposes of China’s “dragonhead” enterprises is to disseminate information on chemical use and otherproduction techniques to farmers, playing the role, in effect, of an agricul-tural extension service.
In addition, China also has a small organic food industry that has beenmainly targeted at export markets but is starting to catch on domestically.The high labor requirements of organic farming make it well-suited toChina, with its low-cost labor force. But widespread pollution, high pestinfestations, and a long history of heavy chemical fertilizer and pesticideuse make growing crops organically difficult in most areas of China.
Currency Appreciation
China’s domestic fruit and vegetable prices and production costs are lowwhen converted to U.S. dollars at the official exchange rate, but an apprecia-tion of the Chinese currency would narrow China’s price advantage on inter-national markets. For example, in early February 2006, the average wholesalemarket price of Fuji Apples at Qingdao (the port at Qingdao accounts for
17China’s Rising Fruit and Vegetable Exports Challenge U.S. Industries/FTS-320-01
Economic Research Service/USDA
4The Chinese term wu gong hai,translated here as “pollution free,” isvariously translated as “no harm,”“hazard free,” or “safe.”
about half of Chinese apple exports) was 3.8 yuan per kg. That price wasequivalent to 47 cents per kg (in U.S. dollars) at the prevailing exchange rateof 8.1 Chinese yuan per dollar, and 40 percent less than the U.S. free-on-board export price for apples of about 80 cents per kg.
If the Chinese currency appreciated, Chinese exporters would receive feweryuan for each dollar earned by exports. If the currency appreciated to 6 yuanper dollar, an exporter buying apples at the Qingdao price of 3.8 yuan per kgwould have to sell them at 63 cents per kg to cover the cost of the apples. IfChinese exporters raised their price to 63 cents per kg, the differentialbetween Chinese and U.S. apples would be narrowed to 20 percent.
Economists generally agree that the Chinese yuan is undervalued at thecurrent exchange rate, but estimates of the magnitude vary widely, from 5percent to 40 percent. China appreciated its currency by a modest 2 percent inJuly 2005 in response to strong pressure from trading partners, but China’strade surplus was virtually unaffected. Chinese authorities appear reluctant toallow further appreciation of the currency.5
While labor costs and fruit and vegetable prices are astoundingly low at thecurrent exchange rate, other prices—for example, for land, grain, soybeans,and automobiles—are close to international prices. Consequently, the “true”value of the Chinese yuan is unknown and appreciation is highly controver-sial. The new currency regime allows the Chinese yuan to appreciate ordepreciate within a narrow band each day, but the currency’s value did notappreciate further in the second half of 2005.
If China’s currency does eventually appreciate against the U.S. dollar, thegrowth in its exports of industrial goods as well as fruits and vegetableswould slow. Currency appreciation would also reduce the price of importedcommodities, making them more competitive in the Chinese market.
18China’s Rising Fruit and Vegetable Exports Challenge U.S. Industries/FTS-320-01
Economic Research Service/USDA
5The currency value is now deter-mined by daily trading of an unspeci-fied market basket of currenciestraded by Chinese banks, but thevalue did not change significantlyduring the 6 months after the initialappreciation. China’s central banklikely intervenes to prevent the valueof the yuan from falling.
China, the world’s largest producer and one of the world’s top exporters offruits and vegetables, has raised its profile in the global market since the 1990s,resulting in increasing challenges for U.S. fruit and vegetable industries. Inaddition to surpassing the United States in the import markets for apple juice inJapan and Canada, China has been the leading supplier of U.S. apple juiceimports. China also has edged out the United States to become the leadingsupplier for fresh apple imports in the ASEAN region and for freshvegetable imports in Japan and South Korea. Indeed, China has emerged asa serious competitor in many kinds of U.S. fruit and vegetable industries.
The challenge to the U. S. apple juice industry both at home and abroadfrom Chinese apple juice is expected to continue. State-of-the-art facilitiesand low-cost labor and raw materials enable Chinese processors to improvequality and keep prices competitive (USDA, September 2004). Challengesfacing China’s apple juice industry are that too-rapid export growth mayresult in safeguard measures by importing countries or that too few appleswill be available for processing. Chinese processors are contracting morehigh-acid or “high-sour” apple varieties, which are more suitable for juiceprocessing (USDA, May 2005). After the recent “sunset” review process,the USITC and the U.S. Department of Commerce announced in Septemberan extension of the current antidumping duties on Chinese apple juice foranother 5 years.
The strong pace of fresh apple exports from China is also expected tocontinue because quality is improving and prices are competitive (USDA,September 2004), particularly in the ASEAN market. The agreementbetween China and ASEAN to establish a comprehensive free trade area by2010 bodes well for Chinese apple exports to the region. The United Stateshas lost market share in fresh-market vegetables, notably in Japan and SouthKorea. Exports of fresh vegetables from China to these two markets havebeen bolstered by many factors, especially foreign investment by tradingcompanies from these two countries. Attracted by China’s low productioncosts and its geographic proximity, these companies have rushed to invest inChina to provide seeds, spores, and techniques of production and packingand then to import the harvest back for retailers. Improved ocean freightservice from major Chinese ports to these two countries has been anotherimportant factor.
However, China’s looming threat to the U.S. industry is somewhat offset byhigh marketing costs, uneven quality, and chemical residues on Chinese fruitsand vegetables. China still faces stiff challenges in improving the qualityand safety of products, upgrading marketing and distribution infrastructure,and reducing marketing costs. China is making great strides to address all ofthese issues, but improving these weaknesses is a time-consuming process.In addition, the growth of the domestic market will absorb more of China’sfruit and vegetable production, a factor that may slow the growth of Chineseexports. In the final analysis, China’s rising global presence remains alongrun factor, and China’s recent investments in the quality and marketingof its fruit and vegetable exports and in upgrading its port facilities point toincreasing competition for U.S. fruit and vegetable industries.
19China’s Rising Fruit and Vegetable Exports Challenge U.S. Industries/FTS-320-01
Economic Research Service/USDA
Conclusions and Trade Prospects
China Ministry of Agriculture. “Price Quotations,” October 2005, accessedat http://www.agri.gov.cn/jghq/ly/.
China Ministry of Commerce. “Guidance Ideas on Enlarging AgriculturalProducts Export,” Xiaofang Wang and Zhi Chen (editors), Yearbook ofChina Agricultural Products Processing Industries (2004), Beijing: ChinaAgricultural Press, 2005.
China National Bureau of Statistics. Rural Statistical Yearbook, Beijing:China Statistics Press, various issues.
China National Bureau of Statistics, Urban Survey Organization. Yearbookof China Price and Urban Household Income and Expenditure SurveyStatistics, Beijing: China Statistics Press, various years.
China National Development and Reform Commission (NDRC). “NationalProduct Cost Survey,” October 2005, accessed athttp://www.npcs.gov.cn/web/index.asp.
China Price Information Network. “Agricultural Product Prices,” October2005, accessed at http://www.cpic.gov.cn/agri/J_0_0_0_0.htm.
Crook, Frederick W. An Assessment of Shan Dong Province’s VegetableSituation, unpublished trip report, November 2003.
Food and Agriculture Organization of the United Nations. FAOSTAT On-line Database, November 2005, accessed at http://faostat.fao.org.
Gale, Fred, and Robert Collender. New Directions in China’s AgriculturalLending, WRS-06-01, U.S. Department of Agriculture, Economic ResearchService, January 2006, accessed athttp://www.ers.usda.gov/Publications/WRS0601/.
Hu, Dinghuan. Case Study of Food Safety in China, China Academy ofAgricultural Sciences, unpublished manuscript, 2005a.
Hu, Dinghuan. Personal communication to authors, December 2005b.
Huang, Sophia Wu. China Increases Exports of Fresh and Frozen Vegetables to Japan, VGS-292-01, U.S. Department of Agriculture,Economic Research Service, August 2002, accessed athttp://www.ers.usda.gov/publications/vgs/aug02/vgs292-01/.
Lohmar, Bryan, and others. Drought Mitigation Practices and HorticulturalProduction in China, unpublished trip report, U.S.-China ScientificExchange Program, November 2003.
The Nikkei Weekly. “China hit by charges of tainted veggies,” Japan: NihonKeizai Shimbun, Inc., October 7, 2002.
20China’s Rising Fruit and Vegetable Exports Challenge U.S. Industries/FTS-320-01
Economic Research Service/USDA
References
U.S. Department of Agriculture (USDA), Foreign Agricultural Service.China: Competitor, China’s Apple Juice Concentrate Situation, 2002, GAIN Report No. CH2626, July 2002.
U.S. Department of Agriculture (USDA), Foreign Agricultural Service.China, Peoples Republic of: Fresh Deciduous Fruit, Annual 2003, GAIN Report No. CH3121, September 2003, accessed athttp://www.fas.usda.gov/gainfiles/200309/145986081.pdf.
U.S. Department of Agriculture (USDA), Foreign Agricultural Service.China, Peoples Republic of: Fresh Deciduous Fruit, Annual 2004, GAIN Report No. CH4003, September 2004, accessed athttp://www.fas.usda.gov/gainfiles/200409/146107541.pdf.
U.S. Department of Agriculture (USDA), Foreign Agricultural Service.China, Peoples Republic of: Market Development Reports, Cold Storage inSouth China: Keeping US Chilled Exports Competitive in the ChineseMarket, 2005, GAIN Report No. CH5617, December 2005, accessed athttp://www.fas.usda.gov/gainfiles/200309/145986081.pdf.
U.S. Department of Agriculture (USDA), Foreign Agricultural Service. GlobalAgricultural Trade System, unpublished database, accessed January 2006.
U.S. Department of Agriculture (USDA), Foreign Agricultural Service.Hong Kong: HRI Food Service Sector, Annual 2005, GAIN Report No. HK5006, March 2005, accessed at http://www.fas.usda.gov/gainfiles/200503/146118968.pdf.
U.S. Department of Agriculture (USDA), Foreign Agricultural Service.World Apple Juice Situation, May 2005, accessed athttp://www.fas.usda.gov/htp/horticulture/Apple%20Juice/Apple%20Juice%20Feature%20May%202005.pdf.
U.S. Department of Agriculture (USDA), National Agricultural StatisticsService. Agricultural Land Values and Cash Rents: Final Estimates 1999-2003. SB-993, March 2004, accessed athttp://usda.mannlib.cornell.edu/reports/general/sb/sb993.pdf.
U.S. Department of Commerce, International Trade Administration, ImportAdministration. Fresh Garlic From the People’s Republic of China: Extensionof Time Limit for the Preliminary Results of New Shipper Reviews,December 2005, accessed at http://www.ia.ita.doc.gov/frn/0512frn/E5-6901.txt.
U.S. Department of Commerce, International Trade Administration, ImportAdministration. Fresh Garlic From the People’s Republic of China: FinalResults of Antidumping Duty Administrative Review and New Shipper Reviews,June 2004, accessed at http://ia.ita.doc.gov/frn/summary/prc/04-13494.txt.
21China’s Rising Fruit and Vegetable Exports Challenge U.S. Industries/FTS-320-01
Economic Research Service/USDA