Embed Size (px)
Citation preview
Journal of
www.elsevier.com/locate/jelechem
Journal of Electroanalytical Chemistry 585 (2005) 230–239
ElectroanalyticalChemistry
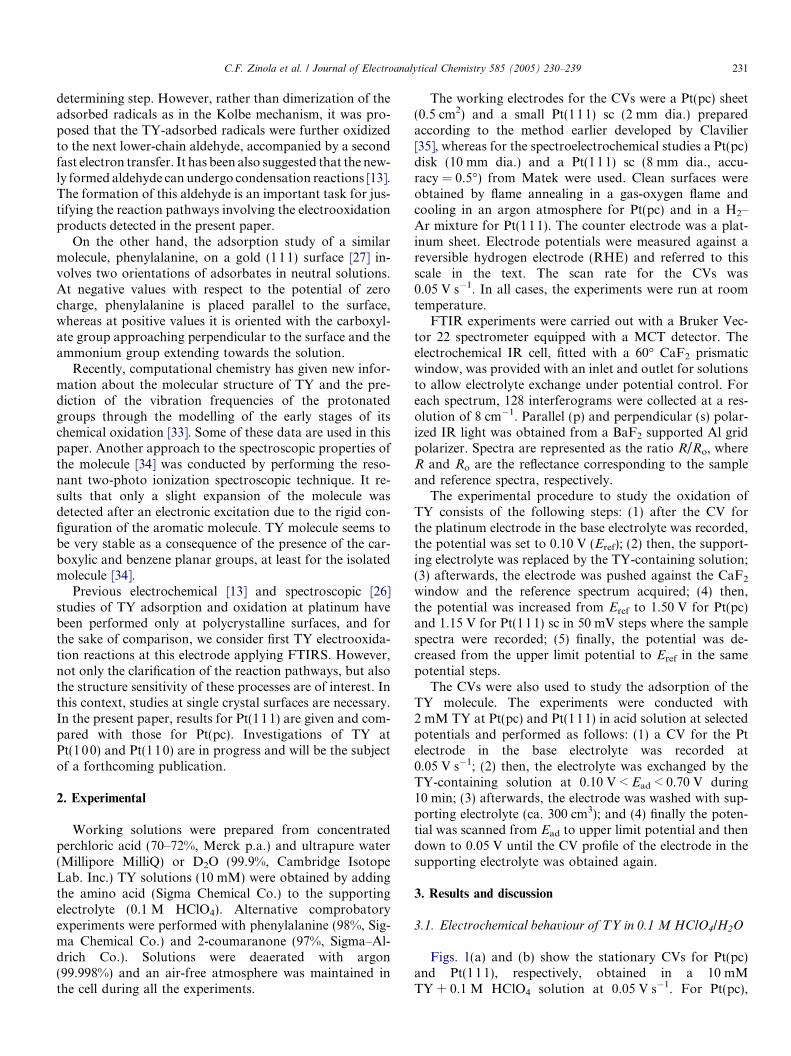
FTIR studies of tyrosine oxidation at polycrystalline Pt andPt(111) electrodes
Carlos F. Zinola b, Jose L. Rodrıguez a, M. Carmen Arevalo a, Elena Pastor a,*
a Departamento de Quımica Fısica, Facultad de Quımica, Universidad de La Laguna 38071, La Laguna, Tenerife, Spainb Laboratorio de Electroquımica Fundamental, Facultad de Ciencias, Universidad de la Republica, C.P.11400 Montevideo, Uruguay
Received 3 March 2005; received in revised form 5 July 2005; accepted 19 August 2005Available online 10 October 2005
Abstract
The electrochemical oxidation of tyrosine has been studied on polycrystalline and (111) single crystal platinum electrodes in 0.1 MHClO4. No surface sensitivity of bulk tyrosine reactions has been detected for these two electrodes, although the adsorption processseems to be structure-sensitive. The onset for tyrosine electrooxidation is observed at ca. 0.7 V for both surfaces. In situ FTIR techniquewas used to discern the nature of the products formed during the oxidation processes. The early stages of tyrosine oxidation occur via adecarboxylation to carbon dioxide. Two complex parallel reactions were found at E > 1.10 V vs. RHE: one of them leading to a c-lactoneof hydroxy-substituted benzofurane, and the second with the formation of p-benzoquinone. The assignment of these products is based onthe corresponding transmission spectra.� 2005 Elsevier B.V. All rights reserved.
Keywords: Tyrosine; Platinum; FTIR spectroscopy; Amino acid electrooxidation; c-Lactone; Benzoquinone
1. Introduction
The interfacial behaviour of proteins is of fundamentalimportance in the understanding of the mechanisms in-volved in the course of some biochemical processes [1–3].However, in order to get a deeper insight into this behav-iour, it is better to understand first the adsorption and elec-trochemistry of some essential amino acids. In particular,the study of amino acids containing aromatic groups, suchas phenylalanine and tyrosine (4-hydroxy-phenylala-nine ” TY) are interesting because they exhibit biochemicalfunctionalities in the regulation of the growth, survival andrepair of the nervous system [4]. In the present paper, wepay attention on the adsorption and interaction of TY atplatinum in an electrochemical environment.
The adsorption and differentiation of various aminoacids on biomembranes and solid surfaces have been exper-imentally approached by the application of different in situ
0022-0728/$ - see front matter � 2005 Elsevier B.V. All rights reserved.
doi:10.1016/j.jelechem.2005.08.014
* Corresponding author. Tel.: +34 922 318028; fax: +34 922 318002.E-mail address: [email protected] (E. Pastor).
electrochemical [5–18] and non-electrochemical techniques[19]. In particular, the combination of cyclic voltammetry(CV), current transients and in situ Fourier-transform infra-red spectroscopy (FTIRS) have demonstrated to be power-ful tools to study the adsorption, nature and configurationof amino acids [20–27]. Most of these studies dealt with gly-cine, alanine, serine and lysine electrode reactions on noblemetals [20–25], but there are also some reports on mercuryelectrodes, especially for cystine and cysteine [28–32]. Prop-erly in the case of aromatic-containing amino acids, such asTY, tryptophan, histidine and phenylalanine, the spectro-scopic information available about the nature and configu-ration of the adsorbates covers only polycrystalline (pc)platinum and gold single crystal (sc) surfaces [13,26,27].
Specially interesting are the results of the study ofTYelec-trochemical oxidation performed by conventional electro-chemical techniques at Pt(pc) in neutral buffered solutions[13]. It is assumed that, in a first step, the oxidation proceedsin amanner similar to theKolbemechanismwith adsorptionto platinum through the carboxylate group accompanied byelectron transfer, followed by decarboxylation as the rate
C.F. Zinola et al. / Journal of Electroanalytical Chemistry 585 (2005) 230–239 231
determining step. However, rather than dimerization of theadsorbed radicals as in the Kolbe mechanism, it was pro-posed that the TY-adsorbed radicals were further oxidizedto the next lower-chain aldehyde, accompanied by a secondfast electron transfer. It has been also suggested that the new-ly formed aldehyde can undergo condensation reactions [13].The formation of this aldehyde is an important task for jus-tifying the reaction pathways involving the electrooxidationproducts detected in the present paper.
On the other hand, the adsorption study of a similarmolecule, phenylalanine, on a gold (111) surface [27] in-volves two orientations of adsorbates in neutral solutions.At negative values with respect to the potential of zerocharge, phenylalanine is placed parallel to the surface,whereas at positive values it is oriented with the carboxyl-ate group approaching perpendicular to the surface and theammonium group extending towards the solution.
Recently, computational chemistry has given new infor-mation about the molecular structure of TY and the pre-diction of the vibration frequencies of the protonatedgroups through the modelling of the early stages of itschemical oxidation [33]. Some of these data are used in thispaper. Another approach to the spectroscopic properties ofthe molecule [34] was conducted by performing the reso-nant two-photo ionization spectroscopic technique. It re-sults that only a slight expansion of the molecule wasdetected after an electronic excitation due to the rigid con-figuration of the aromatic molecule. TY molecule seems tobe very stable as a consequence of the presence of the car-boxylic and benzene planar groups, at least for the isolatedmolecule [34].
Previous electrochemical [13] and spectroscopic [26]studies of TY adsorption and oxidation at platinum havebeen performed only at polycrystalline surfaces, and forthe sake of comparison, we consider first TY electrooxida-tion reactions at this electrode applying FTIRS. However,not only the clarification of the reaction pathways, but alsothe structure sensitivity of these processes are of interest. Inthis context, studies at single crystal surfaces are necessary.In the present paper, results for Pt(111) are given and com-pared with those for Pt(pc). Investigations of TY atPt(100) and Pt(110) are in progress and will be the subjectof a forthcoming publication.
2. Experimental
Working solutions were prepared from concentratedperchloric acid (70–72%, Merck p.a.) and ultrapure water(Millipore MilliQ) or D2O (99.9%, Cambridge IsotopeLab. Inc.) TY solutions (10 mM) were obtained by addingthe amino acid (Sigma Chemical Co.) to the supportingelectrolyte (0.1 M HClO4). Alternative comprobatoryexperiments were performed with phenylalanine (98%, Sig-ma Chemical Co.) and 2-coumaranone (97%, Sigma–Al-drich Co.). Solutions were deaerated with argon(99.998%) and an air-free atmosphere was maintained inthe cell during all the experiments.
The working electrodes for the CVs were a Pt(pc) sheet(0.5 cm2) and a small Pt(111) sc (2 mm dia.) preparedaccording to the method earlier developed by Clavilier[35], whereas for the spectroelectrochemical studies a Pt(pc)disk (10 mm dia.) and a Pt(111) sc (8 mm dia., accu-racy = 0.5�) from Matek were used. Clean surfaces wereobtained by flame annealing in a gas-oxygen flame andcooling in an argon atmosphere for Pt(pc) and in a H2–Ar mixture for Pt(111). The counter electrode was a plat-inum sheet. Electrode potentials were measured against areversible hydrogen electrode (RHE) and referred to thisscale in the text. The scan rate for the CVs was0.05 V s�1. In all cases, the experiments were run at roomtemperature.
FTIR experiments were carried out with a Bruker Vec-tor 22 spectrometer equipped with a MCT detector. Theelectrochemical IR cell, fitted with a 60� CaF2 prismaticwindow, was provided with an inlet and outlet for solutionsto allow electrolyte exchange under potential control. Foreach spectrum, 128 interferograms were collected at a res-olution of 8 cm�1. Parallel (p) and perpendicular (s) polar-ized IR light was obtained from a BaF2 supported Al gridpolarizer. Spectra are represented as the ratio R/Ro, whereR and Ro are the reflectance corresponding to the sampleand reference spectra, respectively.
The experimental procedure to study the oxidation ofTY consists of the following steps: (1) after the CV forthe platinum electrode in the base electrolyte was recorded,the potential was set to 0.10 V (Eref); (2) then, the support-ing electrolyte was replaced by the TY-containing solution;(3) afterwards, the electrode was pushed against the CaF2
window and the reference spectrum acquired; (4) then,the potential was increased from Eref to 1.50 V for Pt(pc)and 1.15 V for Pt(111) sc in 50 mV steps where the samplespectra were recorded; (5) finally, the potential was de-creased from the upper limit potential to Eref in the samepotential steps.
The CVs were also used to study the adsorption of theTY molecule. The experiments were conducted with2 mM TY at Pt(pc) and Pt(111) in acid solution at selectedpotentials and performed as follows: (1) a CV for the Ptelectrode in the base electrolyte was recorded at0.05 V s�1; (2) then, the electrolyte was exchanged by theTY-containing solution at 0.10 V < Ead < 0.70 V during10 min; (3) afterwards, the electrode was washed with sup-porting electrolyte (ca. 300 cm3); and (4) finally the poten-tial was scanned from Ead to upper limit potential and thendown to 0.05 V until the CV profile of the electrode in thesupporting electrolyte was obtained again.
3. Results and discussion
3.1. Electrochemical behaviour of TY in 0.1 M HClO4/H2O
Figs. 1(a) and (b) show the stationary CVs for Pt(pc)and Pt(111), respectively, obtained in a 10 mMTY + 0.1 M HClO4 solution at 0.05 V s�1. For Pt(pc),
1.2 1.6
-0.2
-0.1
0.0
0.1
0.2
j / m
A c
m-2
0.0 0.4 0.8
-0.05
0.00
0.05
E / V vs. RHE
j / m
A c
m-2
a
b
0.0 0.4 0.8 1.2 1.6
-0.05
0.00
0.05
E / V vs. RHE
j / m
A c
m-2
-0.2
0.0
0.2
0.4
0.6
j / m
A c
m-2
a
b
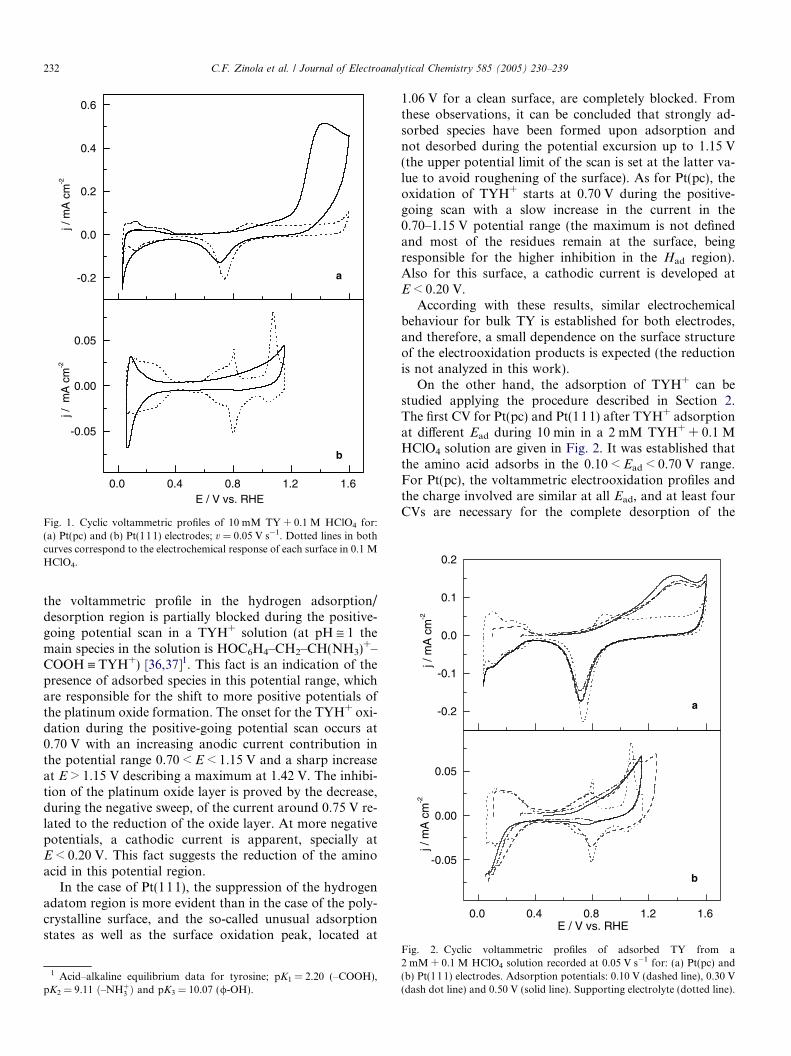
Fig. 1. Cyclic voltammetric profiles of 10 mM TY + 0.1 M HClO4 for:(a) Pt(pc) and (b) Pt(111) electrodes; v = 0.05 V s�1. Dotted lines in bothcurves correspond to the electrochemical response of each surface in 0.1 MHClO4.
232 C.F. Zinola et al. / Journal of Electroanalytical Chemistry 585 (2005) 230–239
the voltammetric profile in the hydrogen adsorption/desorption region is partially blocked during the positive-going potential scan in a TYH+ solution (at pH @ 1 themain species in the solution is HOC6H4–CH2–CH(NH3)
+–COOH ” TYH+) [36,37]1. This fact is an indication of thepresence of adsorbed species in this potential range, whichare responsible for the shift to more positive potentials ofthe platinum oxide formation. The onset for the TYH+ oxi-dation during the positive-going potential scan occurs at0.70 V with an increasing anodic current contribution inthe potential range 0.70 < E < 1.15 V and a sharp increaseat E > 1.15 V describing a maximum at 1.42 V. The inhibi-tion of the platinum oxide layer is proved by the decrease,during the negative sweep, of the current around 0.75 V re-lated to the reduction of the oxide layer. At more negativepotentials, a cathodic current is apparent, specially atE < 0.20 V. This fact suggests the reduction of the aminoacid in this potential region.
In the case of Pt(111), the suppression of the hydrogenadatom region is more evident than in the case of the poly-crystalline surface, and the so-called unusual adsorptionstates as well as the surface oxidation peak, located at
1 Acid–alkaline equilibrium data for tyrosine; pK1 = 2.20 (–COOH),pK2 = 9.11 ð–NHþ
3 Þ and pK3 = 10.07 (/-OH).
1.06 V for a clean surface, are completely blocked. Fromthese observations, it can be concluded that strongly ad-sorbed species have been formed upon adsorption andnot desorbed during the potential excursion up to 1.15 V(the upper potential limit of the scan is set at the latter va-lue to avoid roughening of the surface). As for Pt(pc), theoxidation of TYH+ starts at 0.70 V during the positive-going scan with a slow increase in the current in the0.70–1.15 V potential range (the maximum is not definedand most of the residues remain at the surface, beingresponsible for the higher inhibition in the Had region).Also for this surface, a cathodic current is developed atE < 0.20 V.
According with these results, similar electrochemicalbehaviour for bulk TY is established for both electrodes,and therefore, a small dependence on the surface structureof the electrooxidation products is expected (the reductionis not analyzed in this work).
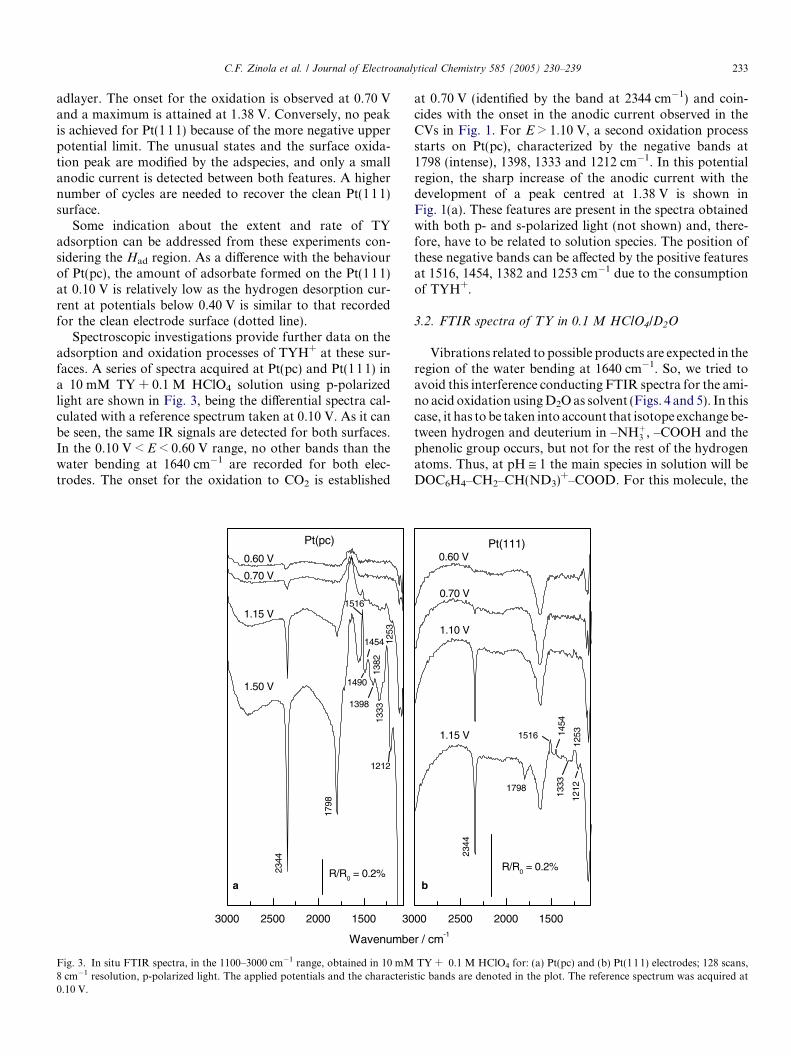
On the other hand, the adsorption of TYH+ can bestudied applying the procedure described in Section 2.The first CV for Pt(pc) and Pt(111) after TYH+ adsorptionat different Ead during 10 min in a 2 mM TYH+ + 0.1 MHClO4 solution are given in Fig. 2. It was established thatthe amino acid adsorbs in the 0.10 < Ead < 0.70 V range.For Pt(pc), the voltammetric electrooxidation profiles andthe charge involved are similar at all Ead, and at least fourCVs are necessary for the complete desorption of the
Fig. 2. Cyclic voltammetric profiles of adsorbed TY from a2 mM + 0.1 M HClO4 solution recorded at 0.05 V s�1 for: (a) Pt(pc) and(b) Pt(111) electrodes. Adsorption potentials: 0.10 V (dashed line), 0.30 V(dash dot line) and 0.50 V (solid line). Supporting electrolyte (dotted line).
C.F. Zinola et al. / Journal of Electroanalytical Chemistry 585 (2005) 230–239 233
adlayer. The onset for the oxidation is observed at 0.70 Vand a maximum is attained at 1.38 V. Conversely, no peakis achieved for Pt(111) because of the more negative upperpotential limit. The unusual states and the surface oxida-tion peak are modified by the adspecies, and only a smallanodic current is detected between both features. A highernumber of cycles are needed to recover the clean Pt(111)surface.
Some indication about the extent and rate of TYadsorption can be addressed from these experiments con-sidering the Had region. As a difference with the behaviourof Pt(pc), the amount of adsorbate formed on the Pt(111)at 0.10 V is relatively low as the hydrogen desorption cur-rent at potentials below 0.40 V is similar to that recordedfor the clean electrode surface (dotted line).
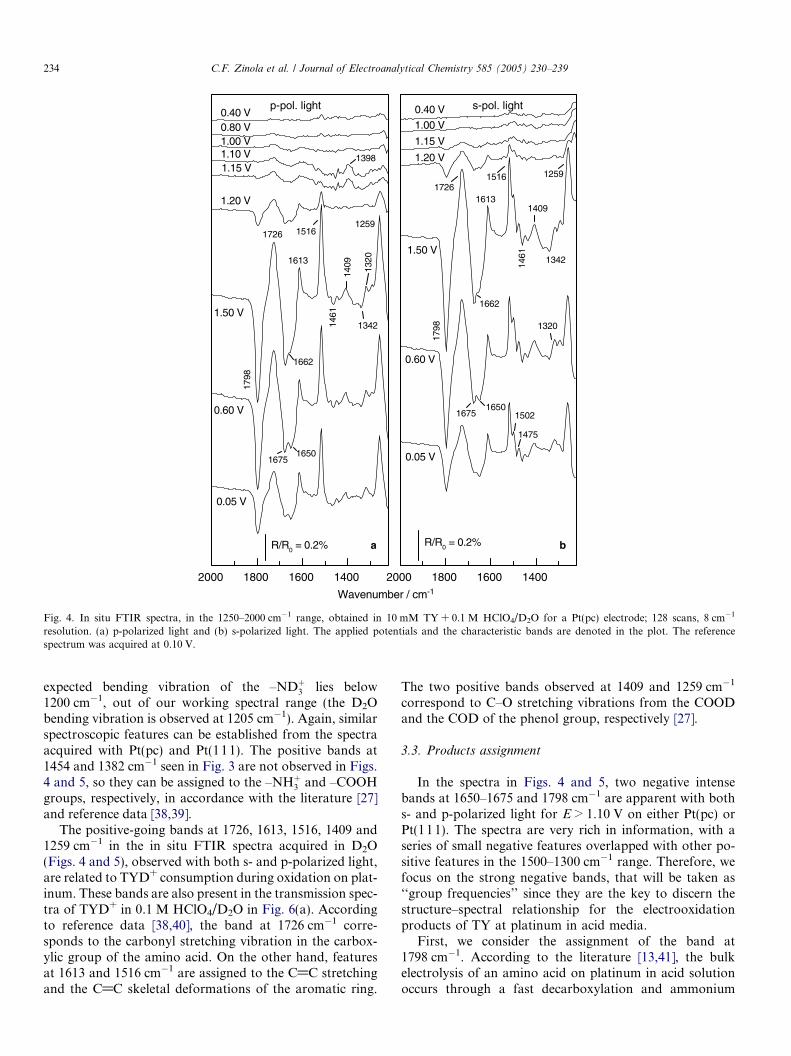
Spectroscopic investigations provide further data on theadsorption and oxidation processes of TYH+ at these sur-faces. A series of spectra acquired at Pt(pc) and Pt(111) ina 10 mM TY + 0.1 M HClO4 solution using p-polarizedlight are shown in Fig. 3, being the differential spectra cal-culated with a reference spectrum taken at 0.10 V. As it canbe seen, the same IR signals are detected for both surfaces.In the 0.10 V < E < 0.60 V range, no other bands than thewater bending at 1640 cm�1 are recorded for both elec-trodes. The onset for the oxidation to CO2 is established
3000 2500 2000 1500
1490
1333
Pt(pc)
1382
1212
1398
1253
1454
1516
1798
2344
1.50 V
1.15 V
0.70 V
0.60 V
R/R0 = 0.2%
Wavenumbe
30
a
Fig. 3. In situ FTIR spectra, in the 1100–3000 cm�1 range, obtained in 10 mM8 cm�1 resolution, p-polarized light. The applied potentials and the characteris0.10 V.
at 0.70 V (identified by the band at 2344 cm�1) and coin-cides with the onset in the anodic current observed in theCVs in Fig. 1. For E > 1.10 V, a second oxidation processstarts on Pt(pc), characterized by the negative bands at1798 (intense), 1398, 1333 and 1212 cm�1. In this potentialregion, the sharp increase of the anodic current with thedevelopment of a peak centred at 1.38 V is shown inFig. 1(a). These features are present in the spectra obtainedwith both p- and s-polarized light (not shown) and, there-fore, have to be related to solution species. The position ofthese negative bands can be affected by the positive featuresat 1516, 1454, 1382 and 1253 cm�1 due to the consumptionof TYH+.
3.2. FTIR spectra of TY in 0.1 M HClO4/D2O
Vibrations related to possible products are expected in theregion of the water bending at 1640 cm�1. So, we tried toavoid this interference conducting FTIR spectra for the ami-no acid oxidation usingD2Oas solvent (Figs. 4 and 5). In thiscase, it has to be taken into account that isotope exchange be-tween hydrogen and deuterium in –NHþ
3 , –COOH and thephenolic group occurs, but not for the rest of the hydrogenatoms. Thus, at pH @ 1 the main species in solution will beDOC6H4–CH2–CH(ND3)
+–COOD. For this molecule, the
r / cm-1
00 2500 2000 1500
Pt(111)
1253
1333
1212
1454
1516
1798
2344
1.15 V
1.10 V
0.70 V
0.60 V
R/R0 = 0.2%
b
TY + 0.1 M HClO4 for: (a) Pt(pc) and (b) Pt(111) electrodes; 128 scans,tic bands are denoted in the plot. The reference spectrum was acquired at
2000 1800 1600 1400
16501675
1398
1259
1320
1409
13421461
1516
1613
1726
1662
1798
p-pol. light
0.05 V
0.60 V
1.50 V
1.20 V
1.15 V1.10 V1.00 V0.80 V0.40 V
R/R0 = 0.2%
2000 1800 1600 1400
1342
1461
16501675
1320
1475
1502
1516
Wavenumber / cm-1
1409
1259
16131726
1662
1798
s-pol. light
0.05 V
0.60 V
1.50 V
1.20 V
1.15 V
1.00 V
0.40 V
R/R0 = 0.2%a b
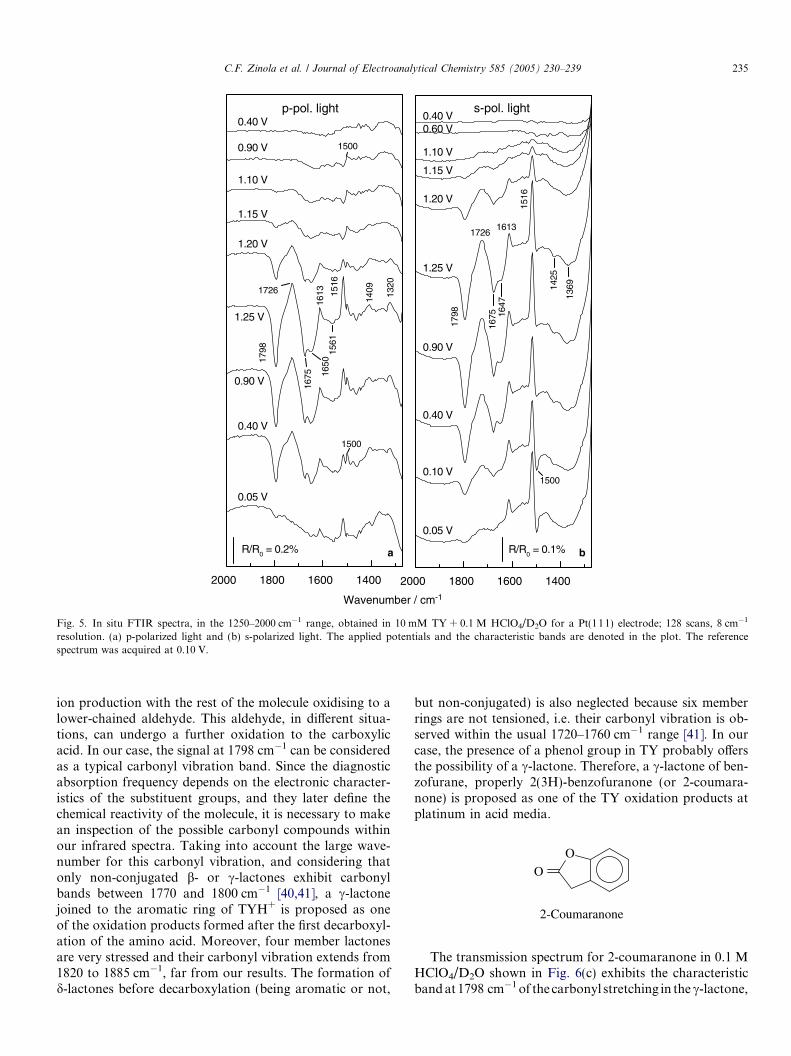
Fig. 4. In situ FTIR spectra, in the 1250–2000 cm�1 range, obtained in 10 mM TY + 0.1 M HClO4/D2O for a Pt(pc) electrode; 128 scans, 8 cm�1
resolution. (a) p-polarized light and (b) s-polarized light. The applied potentials and the characteristic bands are denoted in the plot. The referencespectrum was acquired at 0.10 V.
234 C.F. Zinola et al. / Journal of Electroanalytical Chemistry 585 (2005) 230–239
expected bending vibration of the –NDþ3 lies below
1200 cm�1, out of our working spectral range (the D2Obending vibration is observed at 1205 cm�1). Again, similarspectroscopic features can be established from the spectraacquired with Pt(pc) and Pt(111). The positive bands at1454 and 1382 cm�1 seen in Fig. 3 are not observed in Figs.4 and 5, so they can be assigned to the –NHþ
3 and –COOHgroups, respectively, in accordance with the literature [27]and reference data [38,39].
The positive-going bands at 1726, 1613, 1516, 1409 and1259 cm�1 in the in situ FTIR spectra acquired in D2O(Figs. 4 and 5), observed with both s- and p-polarized light,are related to TYD+ consumption during oxidation on plat-inum. These bands are also present in the transmission spec-tra of TYD+ in 0.1 M HClO4/D2O in Fig. 6(a). Accordingto reference data [38,40], the band at 1726 cm�1 corre-sponds to the carbonyl stretching vibration in the carbox-ylic group of the amino acid. On the other hand, featuresat 1613 and 1516 cm�1 are assigned to the C@C stretchingand the C@C skeletal deformations of the aromatic ring.
The two positive bands observed at 1409 and 1259 cm�1
correspond to C–O stretching vibrations from the COODand the COD of the phenol group, respectively [27].
3.3. Products assignment
In the spectra in Figs. 4 and 5, two negative intensebands at 1650–1675 and 1798 cm�1 are apparent with boths- and p-polarized light for E > 1.10 V on either Pt(pc) orPt(111). The spectra are very rich in information, with aseries of small negative features overlapped with other po-sitive features in the 1500–1300 cm�1 range. Therefore, wefocus on the strong negative bands, that will be taken as‘‘group frequencies’’ since they are the key to discern thestructure–spectral relationship for the electrooxidationproducts of TY at platinum in acid media.
First, we consider the assignment of the band at1798 cm�1. According to the literature [13,41], the bulkelectrolysis of an amino acid on platinum in acid solutionoccurs through a fast decarboxylation and ammonium
2000 1800 1600 1400
1500
1320
140915
1615
6116
1316
50
1675
1726
1798
0.05 V
0.40 V
0.90 V
1.25 V
1.20 V
1.15 V
1.10 V
0.90 V
0.40 Vp-pol. light
R/R0 = 0.2%
Wavenumber / cm-1
2000 1800 1600 1400
1500
1425
1369
1500
1516
1613
1647
1675
1726
1798
0.05 V
0.10 V
0.40 V
0.90 V
1.25 V
1.20 V
1.15 V
1.10 V
0.60 V0.40 V
s-pol. light
R/R0 = 0.1%a b
Fig. 5. In situ FTIR spectra, in the 1250–2000 cm�1 range, obtained in 10 mM TY + 0.1 M HClO4/D2O for a Pt(111) electrode; 128 scans, 8 cm�1
resolution. (a) p-polarized light and (b) s-polarized light. The applied potentials and the characteristic bands are denoted in the plot. The referencespectrum was acquired at 0.10 V.
C.F. Zinola et al. / Journal of Electroanalytical Chemistry 585 (2005) 230–239 235
ion production with the rest of the molecule oxidising to alower-chained aldehyde. This aldehyde, in different situa-tions, can undergo a further oxidation to the carboxylicacid. In our case, the signal at 1798 cm�1 can be consideredas a typical carbonyl vibration band. Since the diagnosticabsorption frequency depends on the electronic character-istics of the substituent groups, and they later define thechemical reactivity of the molecule, it is necessary to makean inspection of the possible carbonyl compounds withinour infrared spectra. Taking into account the large wave-number for this carbonyl vibration, and considering thatonly non-conjugated b- or c-lactones exhibit carbonylbands between 1770 and 1800 cm�1 [40,41], a c-lactonejoined to the aromatic ring of TYH+ is proposed as oneof the oxidation products formed after the first decarboxyl-ation of the amino acid. Moreover, four member lactonesare very stressed and their carbonyl vibration extends from1820 to 1885 cm�1, far from our results. The formation ofd-lactones before decarboxylation (being aromatic or not,
but non-conjugated) is also neglected because six memberrings are not tensioned, i.e. their carbonyl vibration is ob-served within the usual 1720–1760 cm�1 range [41]. In ourcase, the presence of a phenol group in TY probably offersthe possibility of a c-lactone. Therefore, a c-lactone of ben-zofurane, properly 2(3H)-benzofuranone (or 2-coumara-none) is proposed as one of the TY oxidation products atplatinum in acid media.
O
O
2-Coumaranone
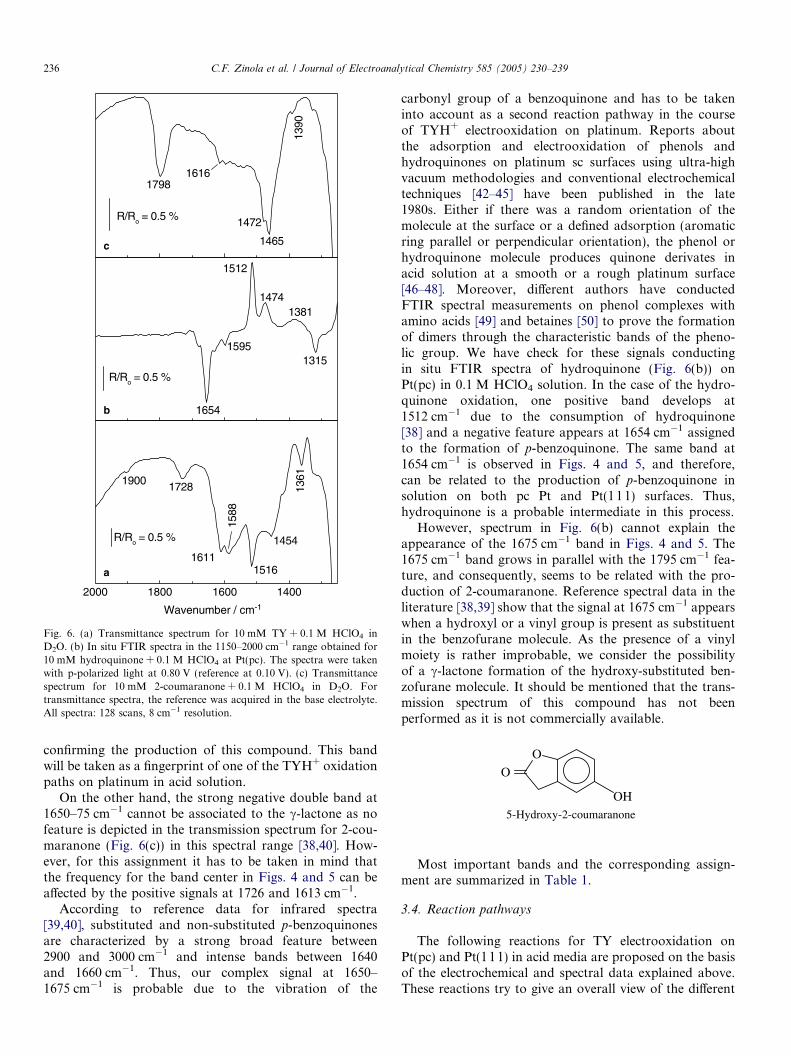
The transmission spectrum for 2-coumaranone in 0.1 MHClO4/D2O shown in Fig. 6(c) exhibits the characteristicbandat 1798 cm�1of the carbonyl stretching in thec-lactone,
1390
R/Ro = 0.5 %
1616
1472
1465
1798
1315
13811474
1512
1595
1654
R/Ro = 0.5 %
2000 1800 1600 1400
1516
1454
13611900
1588
1611
1728
R/Ro = 0.5 %
Wavenumber / cm-1
a
b
c
Fig. 6. (a) Transmittance spectrum for 10 mM TY + 0.1 M HClO4 inD2O. (b) In situ FTIR spectra in the 1150–2000 cm�1 range obtained for10 mM hydroquinone + 0.1 M HClO4 at Pt(pc). The spectra were takenwith p-polarized light at 0.80 V (reference at 0.10 V). (c) Transmittancespectrum for 10 mM 2-coumaranone + 0.1 M HClO4 in D2O. Fortransmittance spectra, the reference was acquired in the base electrolyte.All spectra: 128 scans, 8 cm�1 resolution.
236 C.F. Zinola et al. / Journal of Electroanalytical Chemistry 585 (2005) 230–239
confirming the production of this compound. This bandwill be taken as a fingerprint of one of the TYH+ oxidationpaths on platinum in acid solution.
On the other hand, the strong negative double band at1650–75 cm�1 cannot be associated to the c-lactone as nofeature is depicted in the transmission spectrum for 2-cou-maranone (Fig. 6(c)) in this spectral range [38,40]. How-ever, for this assignment it has to be taken in mind thatthe frequency for the band center in Figs. 4 and 5 can beaffected by the positive signals at 1726 and 1613 cm�1.
According to reference data for infrared spectra[39,40], substituted and non-substituted p-benzoquinonesare characterized by a strong broad feature between2900 and 3000 cm�1 and intense bands between 1640and 1660 cm�1. Thus, our complex signal at 1650–1675 cm�1 is probable due to the vibration of the
carbonyl group of a benzoquinone and has to be takeninto account as a second reaction pathway in the courseof TYH+ electrooxidation on platinum. Reports aboutthe adsorption and electrooxidation of phenols andhydroquinones on platinum sc surfaces using ultra-highvacuum methodologies and conventional electrochemicaltechniques [42–45] have been published in the late1980s. Either if there was a random orientation of themolecule at the surface or a defined adsorption (aromaticring parallel or perpendicular orientation), the phenol orhydroquinone molecule produces quinone derivates inacid solution at a smooth or a rough platinum surface[46–48]. Moreover, different authors have conductedFTIR spectral measurements on phenol complexes withamino acids [49] and betaines [50] to prove the formationof dimers through the characteristic bands of the pheno-lic group. We have check for these signals conductingin situ FTIR spectra of hydroquinone (Fig. 6(b)) onPt(pc) in 0.1 M HClO4 solution. In the case of the hydro-quinone oxidation, one positive band develops at1512 cm�1 due to the consumption of hydroquinone[38] and a negative feature appears at 1654 cm�1 assignedto the formation of p-benzoquinone. The same band at1654 cm�1 is observed in Figs. 4 and 5, and therefore,can be related to the production of p-benzoquinone insolution on both pc Pt and Pt(111) surfaces. Thus,hydroquinone is a probable intermediate in this process.
However, spectrum in Fig. 6(b) cannot explain theappearance of the 1675 cm�1 band in Figs. 4 and 5. The1675 cm�1 band grows in parallel with the 1795 cm�1 fea-ture, and consequently, seems to be related with the pro-duction of 2-coumaranone. Reference spectral data in theliterature [38,39] show that the signal at 1675 cm�1 appearswhen a hydroxyl or a vinyl group is present as substituentin the benzofurane molecule. As the presence of a vinylmoiety is rather improbable, we consider the possibilityof a c-lactone formation of the hydroxy-substituted ben-zofurane molecule. It should be mentioned that the trans-mission spectrum of this compound has not beenperformed as it is not commercially available.
O
O
OH5-Hydroxy-2-coumaranone
Most important bands and the corresponding assign-ment are summarized in Table 1.
3.4. Reaction pathways
The following reactions for TY electrooxidation onPt(pc) and Pt(111) in acid media are proposed on the basisof the electrochemical and spectral data explained above.These reactions try to give an overall view of the different
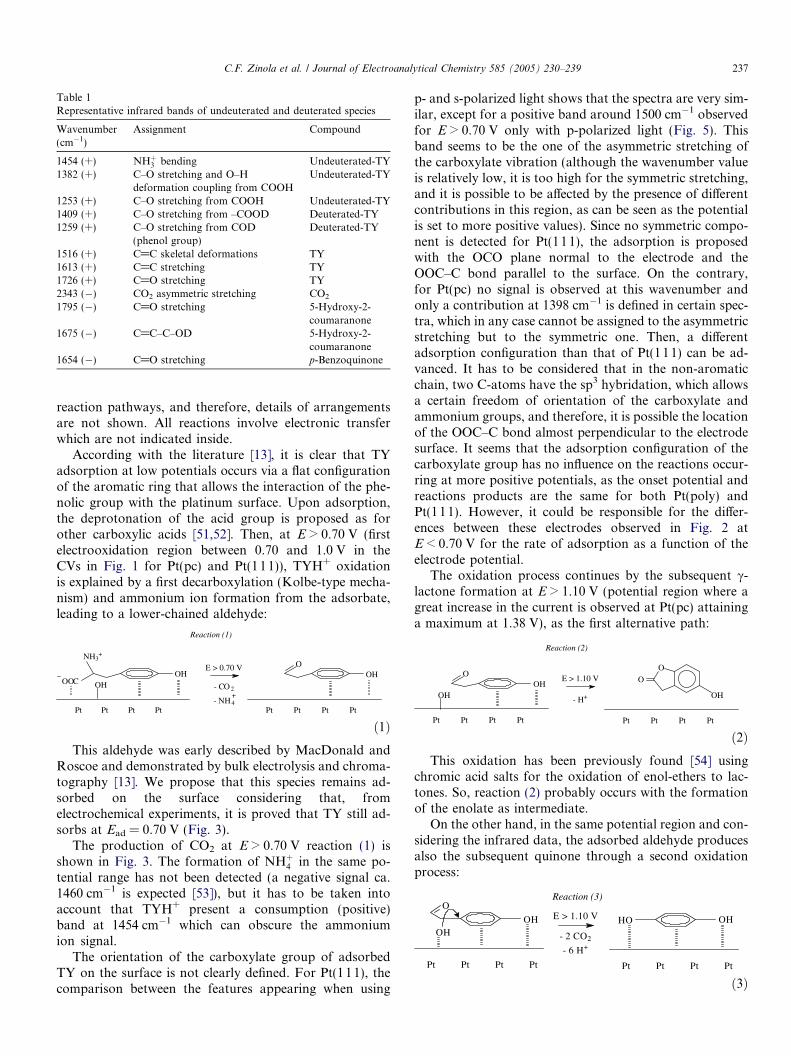
Table 1Representative infrared bands of undeuterated and deuterated species
Wavenumber(cm�1)
Assignment Compound
1454 (+) NHþ3 bending Undeuterated-TY
1382 (+) C–O stretching and O–Hdeformation coupling from COOH
Undeuterated-TY
1253 (+) C–O stretching from COOH Undeuterated-TY1409 (+) C–O stretching from –COOD Deuterated-TY1259 (+) C–O stretching from COD
(phenol group)Deuterated-TY
1516 (+) C@C skeletal deformations TY1613 (+) C@C stretching TY1726 (+) C@O stretching TY2343 (�) CO2 asymmetric stretching CO2
1795 (�) C@O stretching 5-Hydroxy-2-coumaranone
1675 (�) C@C–C–OD 5-Hydroxy-2-coumaranone
1654 (�) C@O stretching p-Benzoquinone
C.F. Zinola et al. / Journal of Electroanalytical Chemistry 585 (2005) 230–239 237
reaction pathways, and therefore, details of arrangementsare not shown. All reactions involve electronic transferwhich are not indicated inside.
According with the literature [13], it is clear that TYadsorption at low potentials occurs via a flat configurationof the aromatic ring that allows the interaction of the phe-nolic group with the platinum surface. Upon adsorption,the deprotonation of the acid group is proposed as forother carboxylic acids [51,52]. Then, at E > 0.70 V (firstelectrooxidation region between 0.70 and 1.0 V in theCVs in Fig. 1 for Pt(pc) and Pt(111)), TYH+ oxidationis explained by a first decarboxylation (Kolbe-type mecha-nism) and ammonium ion formation from the adsorbate,leading to a lower-chained aldehyde:
Reaction (1)
OOH
Pt Pt Pt Pt
NH3+
OHOOC
Pt Pt Pt Pt
OH
E > 0.70 V
- CO 2
- NH 4
ð1ÞThis aldehyde was early described by MacDonald and
Roscoe and demonstrated by bulk electrolysis and chroma-tography [13]. We propose that this species remains ad-sorbed on the surface considering that, fromelectrochemical experiments, it is proved that TY still ad-sorbs at Ead = 0.70 V (Fig. 3).
The production of CO2 at E > 0.70 V reaction (1) isshown in Fig. 3. The formation of NHþ
4 in the same po-tential range has not been detected (a negative signal ca.1460 cm�1 is expected [53]), but it has to be taken intoaccount that TYH+ present a consumption (positive)band at 1454 cm�1 which can obscure the ammoniumion signal.
The orientation of the carboxylate group of adsorbedTY on the surface is not clearly defined. For Pt(111), thecomparison between the features appearing when using
p- and s-polarized light shows that the spectra are very sim-ilar, except for a positive band around 1500 cm�1 observedfor E > 0.70 V only with p-polarized light (Fig. 5). Thisband seems to be the one of the asymmetric stretching ofthe carboxylate vibration (although the wavenumber valueis relatively low, it is too high for the symmetric stretching,and it is possible to be affected by the presence of differentcontributions in this region, as can be seen as the potentialis set to more positive values). Since no symmetric compo-nent is detected for Pt(111), the adsorption is proposedwith the OCO plane normal to the electrode and theOOC–C bond parallel to the surface. On the contrary,for Pt(pc) no signal is observed at this wavenumber andonly a contribution at 1398 cm�1 is defined in certain spec-tra, which in any case cannot be assigned to the asymmetricstretching but to the symmetric one. Then, a differentadsorption configuration than that of Pt(111) can be ad-vanced. It has to be considered that in the non-aromaticchain, two C-atoms have the sp3 hybridation, which allowsa certain freedom of orientation of the carboxylate andammonium groups, and therefore, it is possible the locationof the OOC–C bond almost perpendicular to the electrodesurface. It seems that the adsorption configuration of thecarboxylate group has no influence on the reactions occur-ring at more positive potentials, as the onset potential andreactions products are the same for both Pt(poly) andPt(111). However, it could be responsible for the differ-ences between these electrodes observed in Fig. 2 atE < 0.70 V for the rate of adsorption as a function of theelectrode potential.
The oxidation process continues by the subsequent c-lactone formation at E > 1.10 V (potential region where agreat increase in the current is observed at Pt(pc) attaininga maximum at 1.38 V), as the first alternative path:
Reaction (2)
E > 1.10 V
Pt Pt Pt Pt
O
O
OH
OOH
Pt Pt Pt Pt
OH - H+
ð2ÞThis oxidation has been previously found [54] using
chromic acid salts for the oxidation of enol-ethers to lac-tones. So, reaction (2) probably occurs with the formationof the enolate as intermediate.
On the other hand, in the same potential region and con-sidering the infrared data, the adsorbed aldehyde producesalso the subsequent quinone through a second oxidationprocess:
Reaction (3)
OH
Pt Pt Pt Pt
O
OH
- 6 H+
E > 1.10 V
- 2 CO2
OH
Pt Pt Pt Pt
HO
ð3Þ
1600 1500 1400 1300
1617
1405
1648
1407
1436
1688
1728
1648
1617R/Ro = 0.5 %
2000 1900 1800 1700
1678
1725
p-pol. light
s-pol. light
Wave number / cm-1
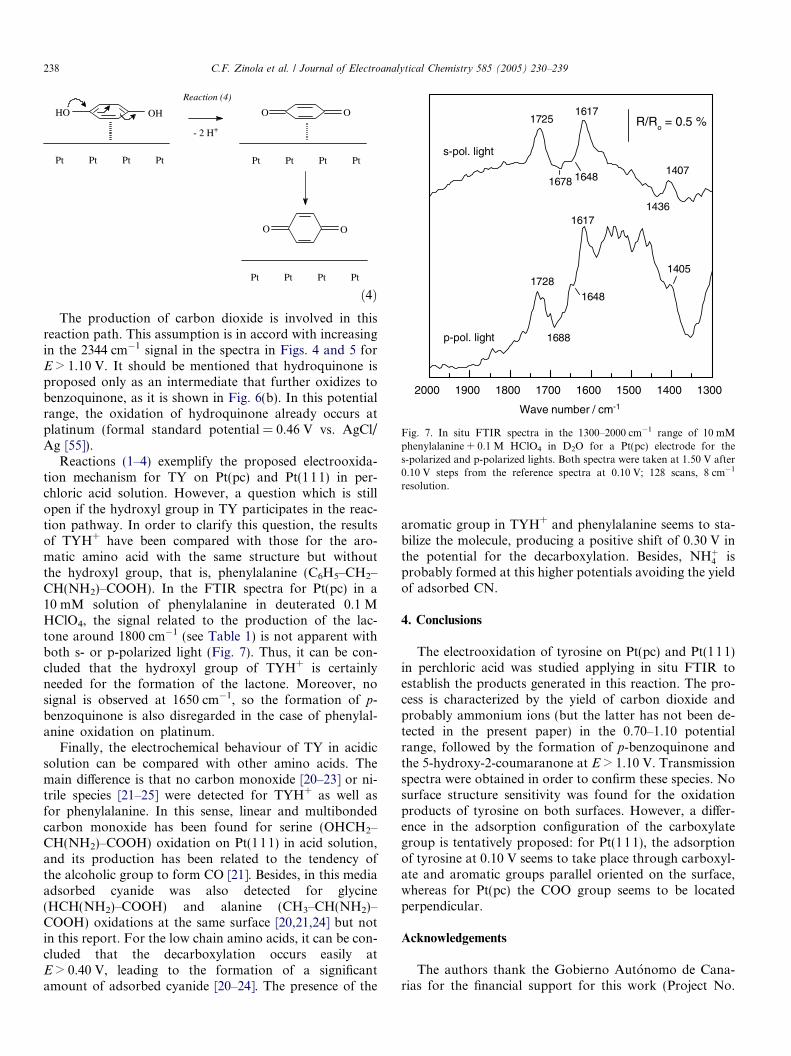
Fig. 7. In situ FTIR spectra in the 1300–2000 cm�1 range of 10 mMphenylalanine + 0.1 M HClO4 in D2O for a Pt(pc) electrode for thes-polarized and p-polarized lights. Both spectra were taken at 1.50 V after0.10 V steps from the reference spectra at 0.10 V; 128 scans, 8 cm�1
resolution.
238 C.F. Zinola et al. / Journal of Electroanalytical Chemistry 585 (2005) 230–239
- 2 H+
OH
Pt Pt Pt Pt
HO
Pt Pt Pt Pt
OO
O O
Pt Pt Pt Pt
Reaction (4)
ð4ÞThe production of carbon dioxide is involved in this
reaction path. This assumption is in accord with increasingin the 2344 cm�1 signal in the spectra in Figs. 4 and 5 forE > 1.10 V. It should be mentioned that hydroquinone isproposed only as an intermediate that further oxidizes tobenzoquinone, as it is shown in Fig. 6(b). In this potentialrange, the oxidation of hydroquinone already occurs atplatinum (formal standard potential = 0.46 V vs. AgCl/Ag [55]).
Reactions (1–4) exemplify the proposed electrooxida-tion mechanism for TY on Pt(pc) and Pt(111) in per-chloric acid solution. However, a question which is stillopen if the hydroxyl group in TY participates in the reac-tion pathway. In order to clarify this question, the resultsof TYH+ have been compared with those for the aro-matic amino acid with the same structure but withoutthe hydroxyl group, that is, phenylalanine (C6H5–CH2–CH(NH2)–COOH). In the FTIR spectra for Pt(pc) in a10 mM solution of phenylalanine in deuterated 0.1 MHClO4, the signal related to the production of the lac-tone around 1800 cm�1 (see Table 1) is not apparent withboth s- or p-polarized light (Fig. 7). Thus, it can be con-cluded that the hydroxyl group of TYH+ is certainlyneeded for the formation of the lactone. Moreover, nosignal is observed at 1650 cm�1, so the formation of p-benzoquinone is also disregarded in the case of phenylal-anine oxidation on platinum.
Finally, the electrochemical behaviour of TY in acidicsolution can be compared with other amino acids. Themain difference is that no carbon monoxide [20–23] or ni-trile species [21–25] were detected for TYH+ as well asfor phenylalanine. In this sense, linear and multibondedcarbon monoxide has been found for serine (OHCH2–CH(NH2)–COOH) oxidation on Pt(111) in acid solution,and its production has been related to the tendency ofthe alcoholic group to form CO [21]. Besides, in this mediaadsorbed cyanide was also detected for glycine(HCH(NH2)–COOH) and alanine (CH3–CH(NH2)–COOH) oxidations at the same surface [20,21,24] but notin this report. For the low chain amino acids, it can be con-cluded that the decarboxylation occurs easily atE > 0.40 V, leading to the formation of a significantamount of adsorbed cyanide [20–24]. The presence of the
aromatic group in TYH+ and phenylalanine seems to sta-bilize the molecule, producing a positive shift of 0.30 V inthe potential for the decarboxylation. Besides, NHþ
4 isprobably formed at this higher potentials avoiding the yieldof adsorbed CN.
4. Conclusions
The electrooxidation of tyrosine on Pt(pc) and Pt(111)in perchloric acid was studied applying in situ FTIR toestablish the products generated in this reaction. The pro-cess is characterized by the yield of carbon dioxide andprobably ammonium ions (but the latter has not been de-tected in the present paper) in the 0.70–1.10 potentialrange, followed by the formation of p-benzoquinone andthe 5-hydroxy-2-coumaranone at E > 1.10 V. Transmissionspectra were obtained in order to confirm these species. Nosurface structure sensitivity was found for the oxidationproducts of tyrosine on both surfaces. However, a differ-ence in the adsorption configuration of the carboxylategroup is tentatively proposed: for Pt(111), the adsorptionof tyrosine at 0.10 V seems to take place through carboxyl-ate and aromatic groups parallel oriented on the surface,whereas for Pt(pc) the COO group seems to be locatedperpendicular.
Acknowledgements
The authors thank the Gobierno Autonomo de Cana-rias for the financial support for this work (Project No.
C.F. Zinola et al. / Journal of Electroanalytical Chemistry 585 (2005) 230–239 239
PI2003/070). C.F.Z. thanks the Programa de CooperacionA.L.E./Intercampus and the University of La Laguna forthe fellowship granted.
References
[1] S.K. Hanks, A.M. Quinn, T. Hunter, Science 241 (1988) 42.[2] J. Herrington, C. Carter-Su, Trends Endocrinol. Metab. 12 (2001)
252.[3] K. Uvdal, J. Ekeroth, P. Konradsson, B.J. Liedberg, Coll. Interf. Sci.
260 (2003) 361.[4] D.R. Kaplan, F.D. Miller, Curr. Opin. Neurobiol. 10 (2000) 381.[5] S.G. Roscoe, K.L. Fuller, J. Coll. Interf. Sci. 152 (1992) 429.[6] S.G. Roscoe, K.L. Fuller, G. Robitaille, J. Coll. Interf. Sci. 160
(1993) 243.[7] J.A. Lori, T. Hanawa, Corros. Sci. 43 (2001) 2111.[8] R. Slojkowska, M. Jurkiewicz-Herbich, Coll. Surf. 178 (2001) 325.[9] R. Parsons, R. Payne, J. Electroanal. Chem. 357 (1993) 327.[10] D.G. Marangoni, R.S. Smith, S.G. Roscoe, Can. J. Chem. 67 (1989)
921.[11] R.J. Petrie, S.M. MacDonald, K.L. Fuller, S.G. Roscoe, Bioelectro-
chem. Bioenerg. 25 (1991) 269.[12] I.G.N. Wylie, S.G. Roscoe, Bioelectrochem. Bioenerg. 28 (1992) 367.[13] S.M. MacDonald, S.G. Roscoe, Electrochim. Acta 42 (1997) 1189.[14] G. Horanyi, E.M. Rizmayer, E.P. Simon, J. Szammer, J. Electroanal.
Chem. 323 (1992) 329.[15] B. Malfoy, J.A. Renaud, J. Electroanal. Chem. 114 (1980) 213.[16] W.R. Fawcett, M. Fedurco, Z. Kovacova, Z. Borkowska, Langmuir
10 (1994) 912.[17] Y. Zhou, T. Nagaoka, G. Zhu, Biophys. Chem. 79 (1999) 55.[18] K.A. Marx, T. Zhou, J. Electroanal. Chem. 1–2 (2002) 53.[19] K.H. Ernst, K. Christmann, Surf. Sci. 224 (1989) 277.[20] F. Huerta, E. Morallon, F. Cases, A. Rodes, J.L. Vazquez, A. Aldaz,
J. Electroanal. Chem. 421 (1997) 179.[21] F. Huerta, E. Morallon, F. Cases, A. Rodes, J.L. Vazquez, A. Aldaz,
J. Electroanal. Chem. 431 (1997) 269.[22] F. Huerta, E. Morallon, J.L. Vazquez, J.M. Perez, A. Aldaz, J.
Electroanal. Chem. 445 (1998) 155.[23] F. Huerta, E. Morallon, J.L. Vazquez, A. Aldaz, J. Electroanal.
Chem. 475 (1999) 38.[24] F. Huerta, E. Morallon, C. Quijada, J.L. Vazquez, L.E.A. Berlouis,
J. Electroanal. Chem. 489 (2000) 92.[25] K. Ogura, M. Kobayashi, M. Nakayama, Y. Miho, J. Electroanal.
Chem. 449 (1998) 101.[26] K. Ogura, M. Kobayashi, M. Nakayama, Y. Miho, J. Electroanal.
Chem. 463 (1999) 218.[27] H-Q. Li, A. Chen, S.G. Roscoe, J. Lipkowski, J. Electroanal. Chem.
500 (2001) 299.
[28] G.A. Dobrankov, G.D. Shilotkach, S.L. Gilmanshina, Russ. J.Electrochem. 31 (1995) 607.
[29] M. Heyrovsky, P. Mader, S. Vavricka, V. Vesela, M. Fedurco, J.Electroanal. Chem. 430 (1997) 103.
[30] M. Heyrovsky, P. Mader, V. Vesela, M. Fedurco, J. Electroanal.Chem. 369 (1994) 53.
[31] T.R. Ralph, M.L. Hitchman, J.P. Millington, F.C. Walsh, J.Electroanal. Chem. 375 (1994) 1.
[32] T.R. Ralph, M.L. Hitchman, J.P. Millington, F.C. Walsh, J.Electroanal. Chem. 375 (1994) 17.
[33] P. O�Malley, J. Biochim. Biophys. Acta Bioenerg. 1553 (2002) 212.[34] L.I. Grace, R. Cohen, T.M. Dunn, D.M. Lubman, M.S. de Vries, J.
Mol. Spec. 215 (2002) 204.[35] J. Clavilier, D. Armand, S.G. Sun, M. Petit, J. Electroanal. Chem.
205 (1986) 267.[36] J.H. Wilson, R.M. Benlow, L.E. Wood, in: Biochemistry, A Problems
Approach, W.A. Benjamin Inc., London, 1974.[37] A. White, P. Handlen, E. Smith, in: Principles of Biochemistry; Del
Castillo, Madrid, 1970, p. 103.[38] G. Socrates, Infrared Characteristic Group Frequencies, Wiley, New
York, 1980.[39] C.J. Pouchert (Ed.), The Aldrich Library of Infrared Spectra, Aldrich
Chemical Co., London, 1975.[40] M.M. Baizer (Ed.), Organic Electrochemistry. An Introduction and a
Guide, Marcel Dekker, NewYork, 1973, p. 514.[41] R.M. Silverstein, G. Clayton Bassler, T.C. Morrill (Eds.), Spectro-
metric Identification of Organic Compounds, Wiley, New York, 1991.[42] V. Chia, M.P. Soriaga, A.T. Hubbard, J. Electroanal. Chem. 167
(1984) 97.[43] J.H. White, M.P. Soriaga, A.T. Hubbard, J. Electroanal. Chem. 177
(1984) 89.[44] M.P. Soriaga, J.L. Stickney, A.T. Hubbard, J. Mol. Catal. 21 (1993)
211.[45] D. Ren, A.T. Hubbard, J. Coll. Interf. Sci. 209 (1999) 435.[46] M.P. Soriaga, P.H. Wilson, A.T. Hubbard, J. Electroanal. Chem. 142
(1982) 317.[47] V. Chia, J.H. White, M.P. Soriaga, A.T. Hubbard, J. Electroanal.
Chem. 217 (1987) 121.[48] J.H. White, M.P. Soriaga, A.T. Hubbard, J. Electroanal. Chem. 185
(1985) 331.[49] C. Bruyneel, Th. Zeegers-Huyskens, J. Mol. Str. 508 (1999) 163.[50] Z. Dega-Szafran, M. Szafran, E. Sokolowska, M. Grundwald-
Wyspianska, J. Mol. Str. 614 (2002) 189.[51] A. Rodes, E. Pastor, T. Iwasita, J. Electroanal. Chem. 376 (1994) 109.[52] A. Rodes, E. Pastor, T. Iwasita, J. Electroanal. Chem. 404 (1996) 61.[53] K. Nakamoto, Infrared and Raman Spectra of Inorganic and
Coordination Compounds, Wiley, New York, 1997.[54] G. Piancatelli, A. Scettri, M. D�Auria, Tetrahedron Lett. 39 (1977)
3483.[55] M.P. Soriaga, A.T. Hubbard, J. Am. Chem. Soc. 104 (1982) 2735.