Embed Size (px)
Citation preview
Fine Organic Industries Limited (Formerly known as Fine Organic Industries Private Limited)
Regd. Office : Fine House, Anandji Street, Off M G Road, Ghatkopar East, Mumbai 400 077, India.
CIN : L24119MH2002PLC136003 Tel : + 91 (22) 2102 5000 Fax : + 91 (22) 2102 8899 I 2102 6666 Email : [email protected] Web : www.fineorganics.com
Date: 12/02/2020
To BSE Limited Phiroze Jeejeebhoy Towers, Dalal St, Kala Ghoda, Fort, Mumbai - 400 001
Security Code: 541557
ft=FINE ORGANICS
To National Stock Exchange of India Limited Plot No. C/1, "6" Block, Exchange Plaza Bandra Kurla Complex, Bandra (East) Mumbai - 400 051
Symbol: FINEORG
Sub: Disclosure of information under Regulation 30 of SEBI (Listing Obligations and Disclosure Requirements) Regulation, 2015.
Dear Sir/Madam,
Pursuant to Regulation 30 of SEBI (Listing Obligations and Disclosure Requirements) Regulation, 2015, please find attached herewith investor presentation- February 2020 ofthe Company.
The aforesaid presentation is also available on the Company's website www.fineorganics.com
We request you to take the above information on your record.
Thanking You,
Sincerely,
Pooja Lohor Company Secretary and Compliance Officer
Encl. As Above
Investor PresentationNovember-2019
Investor PresentationFebruary-2020
Safe Harbor
This presentation and the accompanying slides (the “Presentation”), which have been prepared by Fine Organic Industries Limited (the “Company”), have
been prepared solely for information purposes and do not constitute any offer, recommendation or invitation to purchase or subscribe for any securities,
and shall not form the basis or be relied on in connection with any contract or binding commitment whatsoever. No offering of securities of the Company
will be made except by means of a statutory offering document containing detailed information about the Company.
This Presentation has been prepared by the Company based on information and data which the Company considers reliable, but the Company makes no
representation or warranty, express or implied, whatsoever, and no reliance shall be placed on, the truth, accuracy, completeness, fairness and
reasonableness of the contents of this Presentation. This Presentation may not be all inclusive and may not contain all of the information that you may
consider material. Any liability in respect of the contents of, or any omission from, this Presentation is expressly excluded.
This presentation contains certain forward looking statements concerning the Company’s future business prospects and business profitability, which are
subject to a number of risks and uncertainties and the actual results could materially differ from those in such forward looking statements. The risks and
uncertainties relating to these statements include, but are not limited to, risks and uncertainties regarding fluctuations in earnings, our ability to manage
growth, competition (both domestic and international), economic growth in India and abroad, ability to attract and retain highly skilled professionals, time
and cost over runs on contracts, our ability to manage our international operations, government policies and actions regulations, interest and other fiscal
costs generally prevailing in the economy. The Company does not undertake to make any announcement in case any of these forward looking statements
become materially incorrect in future or update any forward looking statements made from time to time by or on behalf of the Company.
2
THE FINE STORY OF
SUCCESS
Expertise in Oleo-chemistry
4
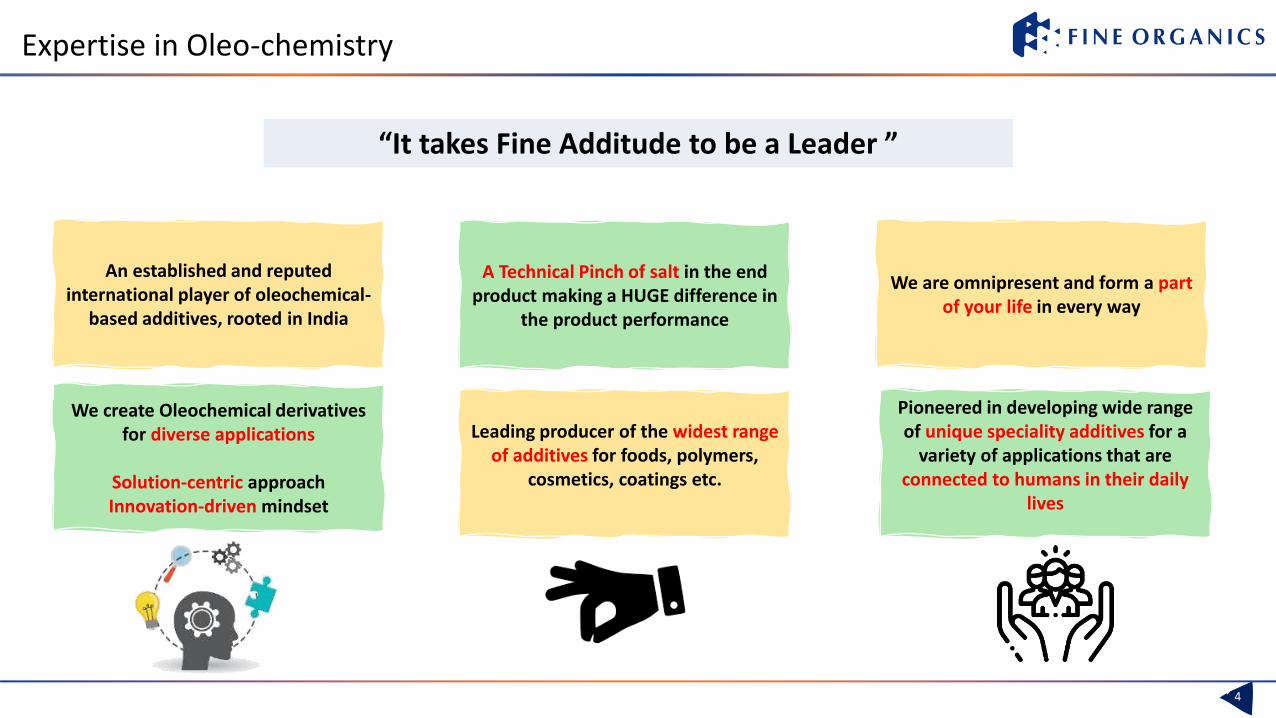
An established and reputed international player of oleochemical-
based additives, rooted in India
A Technical Pinch of salt in the end product making a HUGE difference in
the product performance
We are omnipresent and form a part of your life in every way
Pioneered in developing wide range of unique speciality additives for a
variety of applications that are connected to humans in their daily
lives
Leading producer of the widest range of additives for foods, polymers,
cosmetics, coatings etc.
We create Oleochemical derivatives for diverse applications
Solution-centric approachInnovation-driven mindset
“It takes Fine Additude to be a Leader ”
Why Fine additives are preferred?
5
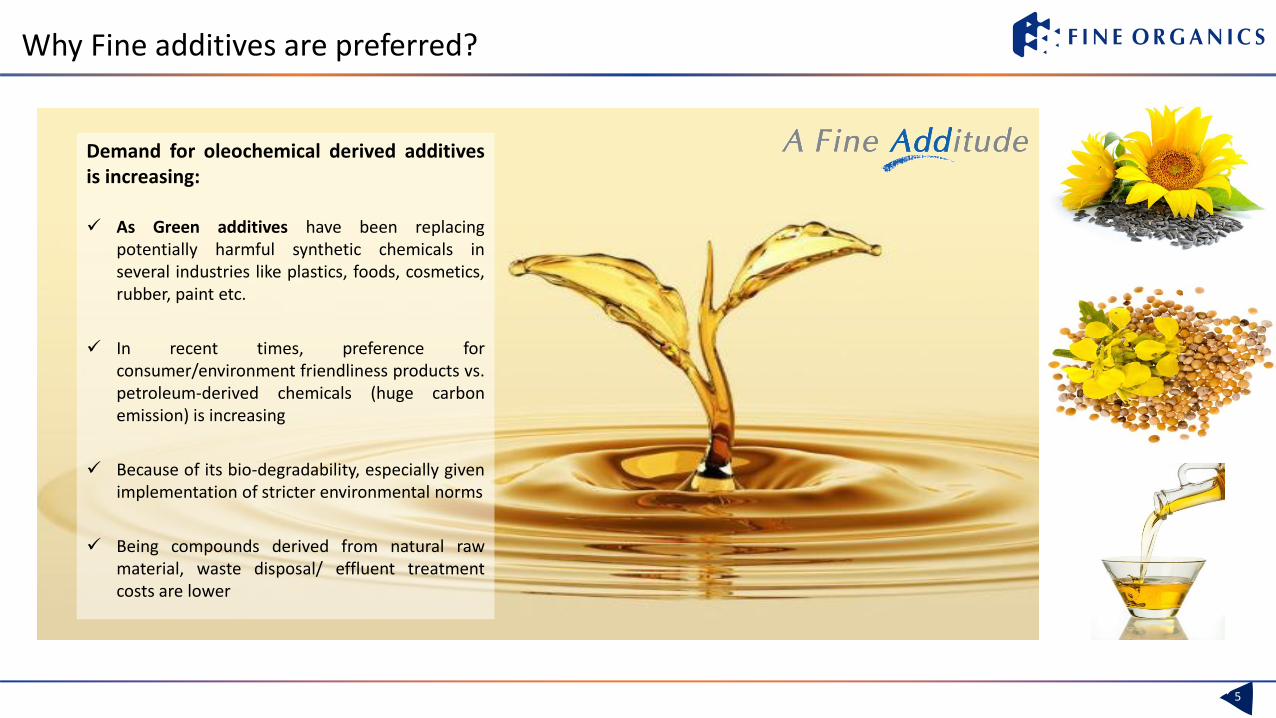
Demand for oleochemical derived additivesis increasing:
✓ As Green additives have been replacingpotentially harmful synthetic chemicals inseveral industries like plastics, foods, cosmetics,rubber, paint etc.
✓ In recent times, preference forconsumer/environment friendliness products vs.petroleum-derived chemicals (huge carbonemission) is increasing
✓ Because of its bio-degradability, especially givenimplementation of stricter environmental norms
✓ Being compounds derived from natural rawmaterial, waste disposal/ effluent treatmentcosts are lower
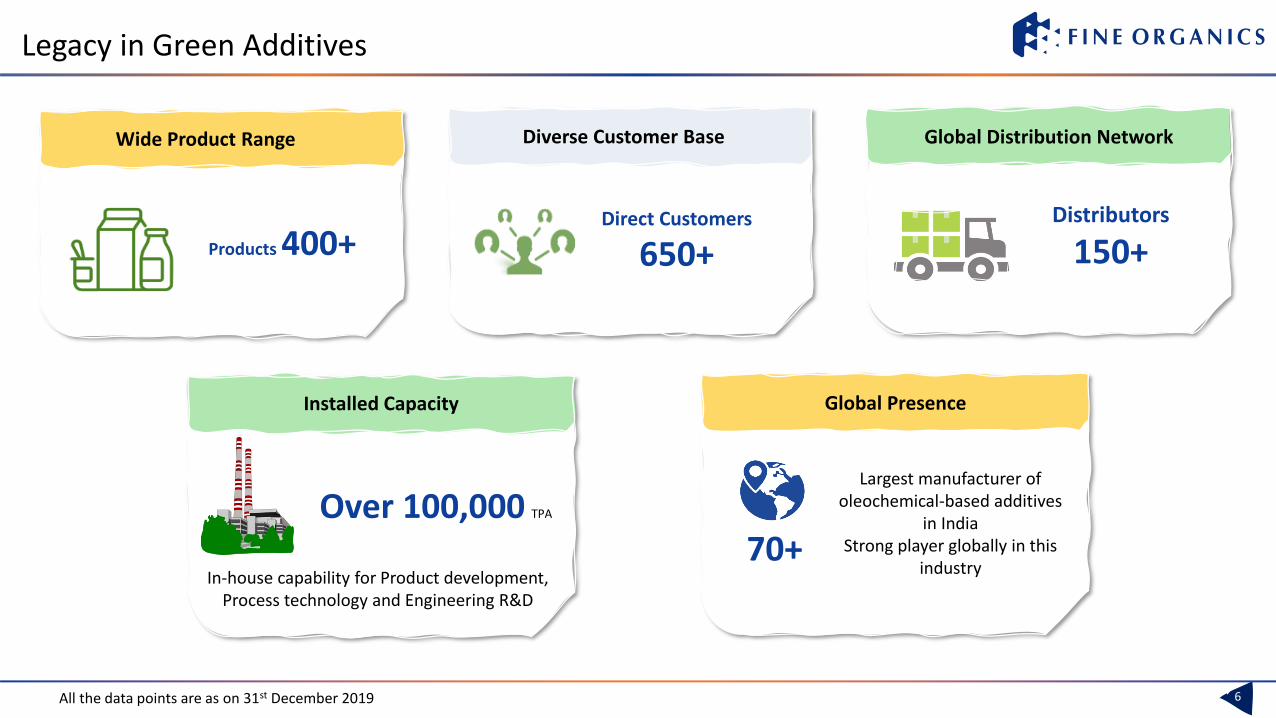
Legacy in Green Additives
6All the data points are as on 31st December 2019
Products 400+
Wide Product Range
Direct Customers
650+
Diverse Customer Base
Distributors
150+
Global Distribution Network
Inhouse capability for product development, Process technology
and engineering R&D
Installed Capacity
Over 100,000 TPA
In-house capability for Product development, Process technology and Engineering R&D
Inhouse capability for product development, Process technology
and engineering R&D
Global Presence
Largest manufacturer of oleochemical-based additives
in India Strong player globally in this
industry70+
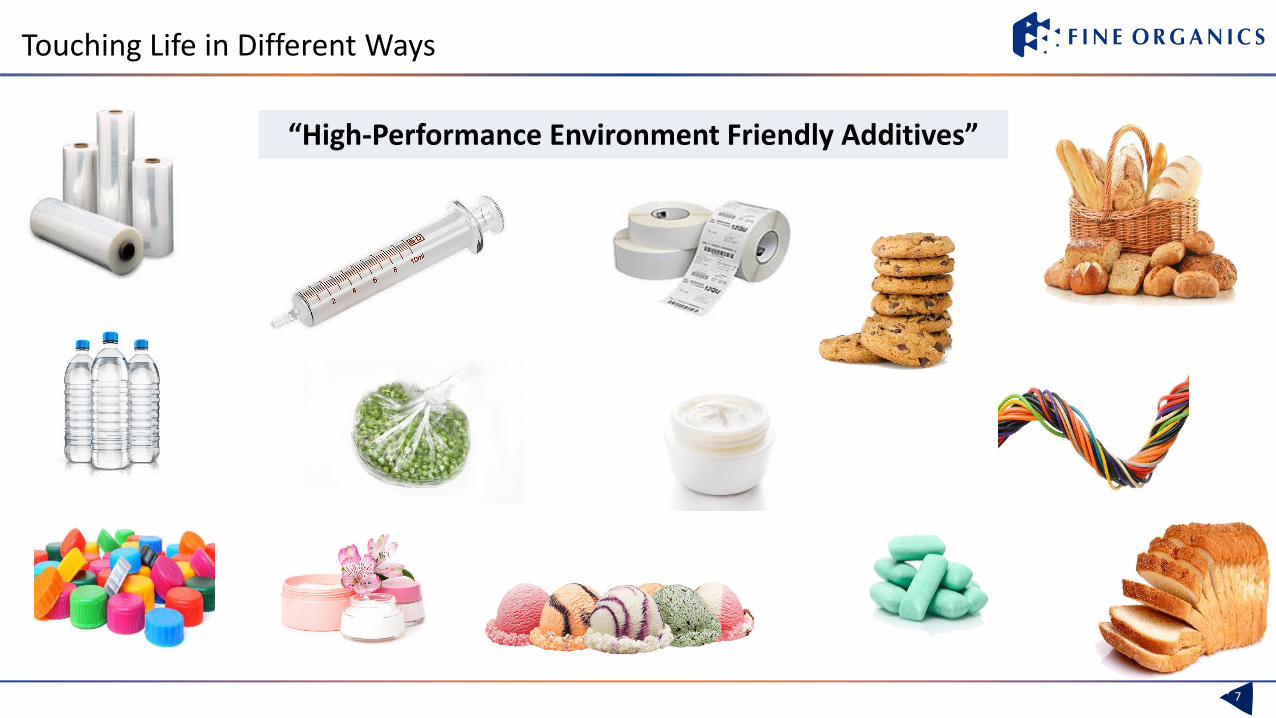
Touching Life in Different Ways
7
“High-Performance Environment Friendly Additives”
8
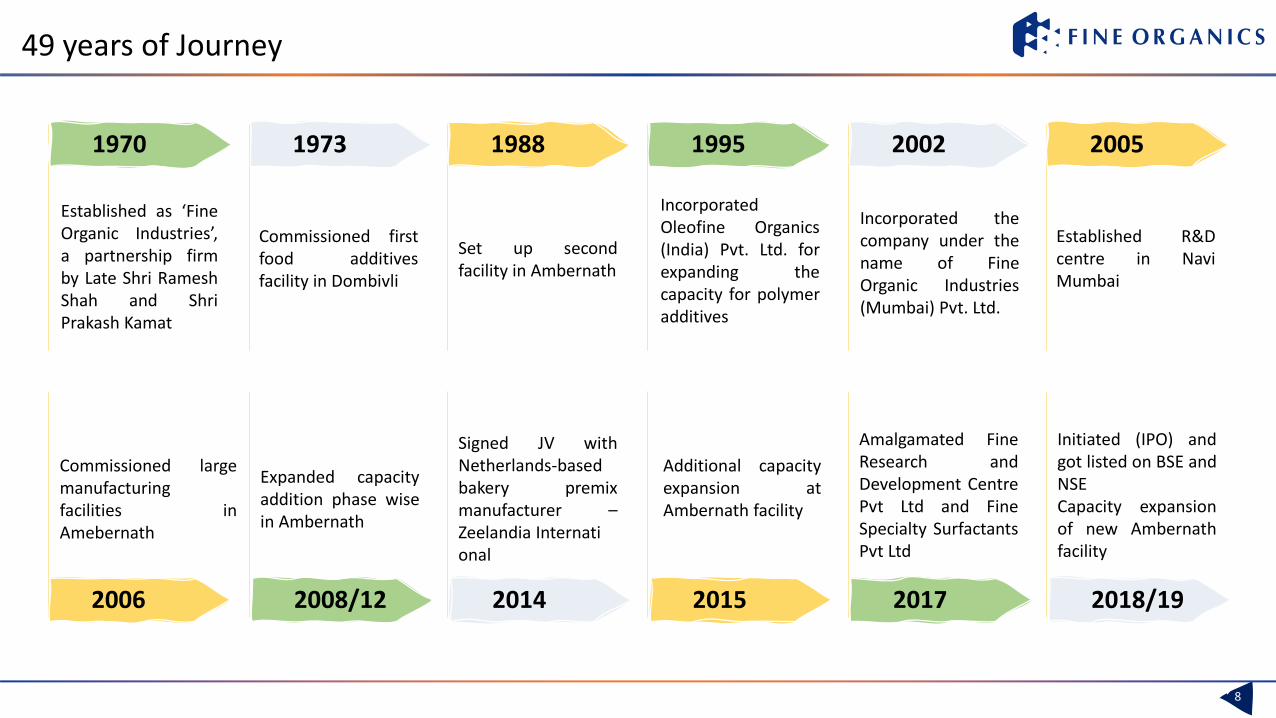
Established as ‘FineOrganic Industries’,a partnership firmby Late Shri RameshShah and ShriPrakash Kamat
1970
Commissioned firstfood additivesfacility in Dombivli
1973
Set up secondfacility in Ambernath
1988
IncorporatedOleofine Organics(India) Pvt. Ltd. forexpanding thecapacity for polymeradditives
1995
Incorporated thecompany under thename of FineOrganic Industries(Mumbai) Pvt. Ltd.
2002
Established R&Dcentre in NaviMumbai
2005
Commissioned largemanufacturingfacilities inAmebernath
2006
Expanded capacityaddition phase wisein Ambernath
2008/12
Signed JV withNetherlands-basedbakery premixmanufacturer –Zeelandia International
2014
Additional capacityexpansion atAmbernath facility
2015
Amalgamated FineResearch andDevelopment CentrePvt Ltd and FineSpecialty SurfactantsPvt Ltd
2017
Initiated (IPO) andgot listed on BSE andNSECapacity expansionof new Ambernathfacility
2018/19
49 years of Journey
9
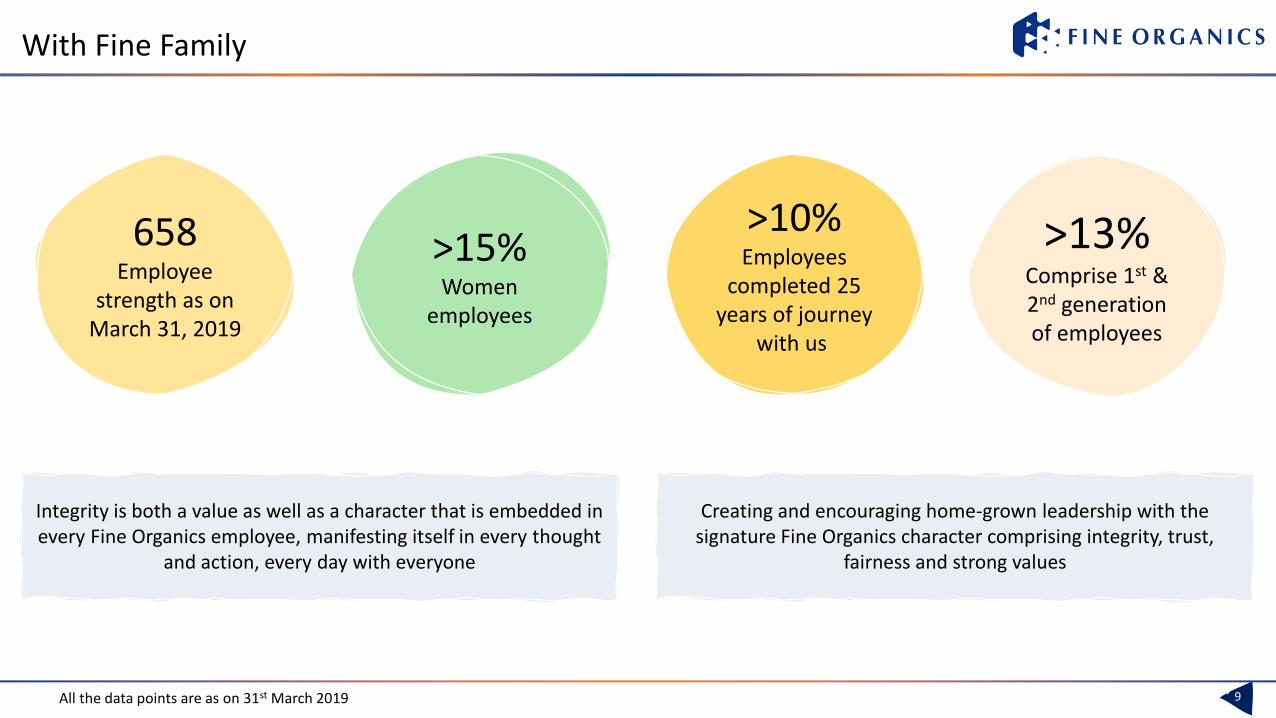
658Employee
strength as on March 31, 2019
>15%Women
employees
>10%Employees
completed 25 years of journey
with us
>13%Comprise 1st & 2nd generation of employees
Integrity is both a value as well as a character that is embedded in every Fine Organics employee, manifesting itself in every thought
and action, every day with everyone
With Fine Family
All the data points are as on 31st March 2019
Creating and encouraging home-grown leadership with the signature Fine Organics character comprising integrity, trust,
fairness and strong values
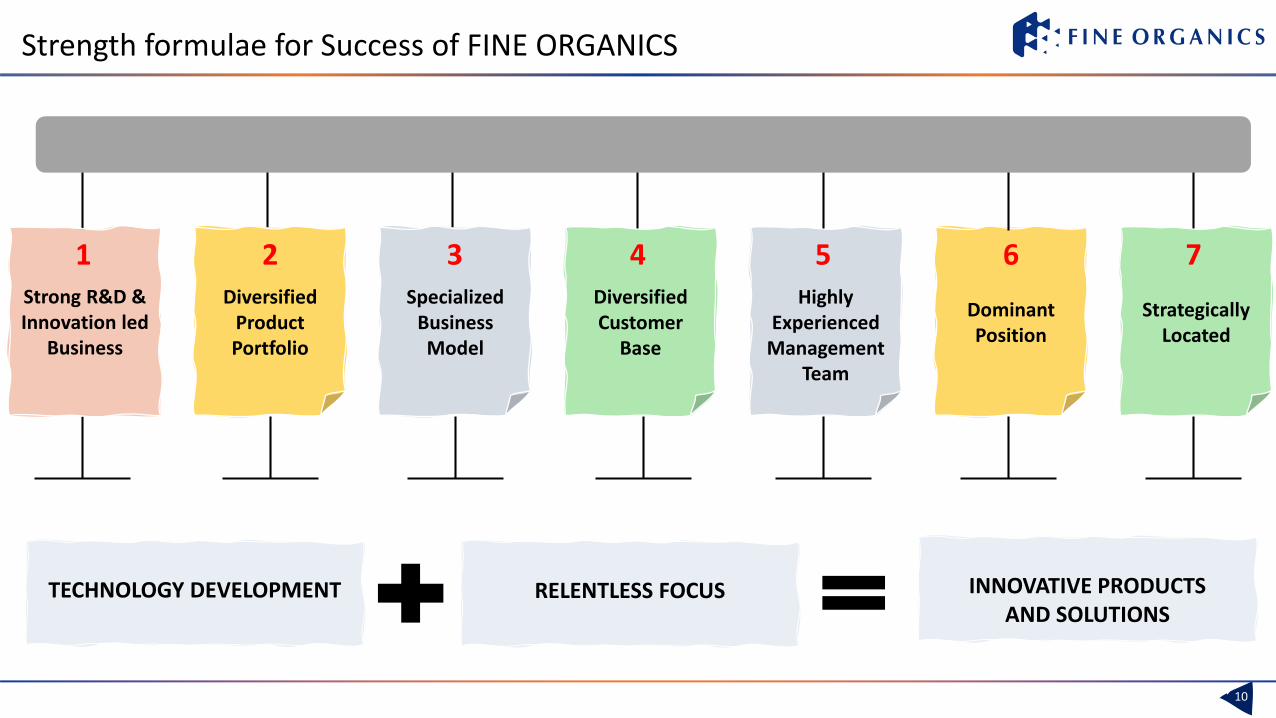
Strength formulae for Success of FINE ORGANICS
10
Specialized Business Model
Strong R&D & Innovation led
Business
Diversified Product Portfolio
Diversified Customer
Base
Dominant Position
Highly Experienced
Management Team
Strategically Located
TECHNOLOGY DEVELOPMENT RELENTLESS FOCUS INNOVATIVE PRODUCTSAND SOLUTIONS
1 2 3 4 5 6 7
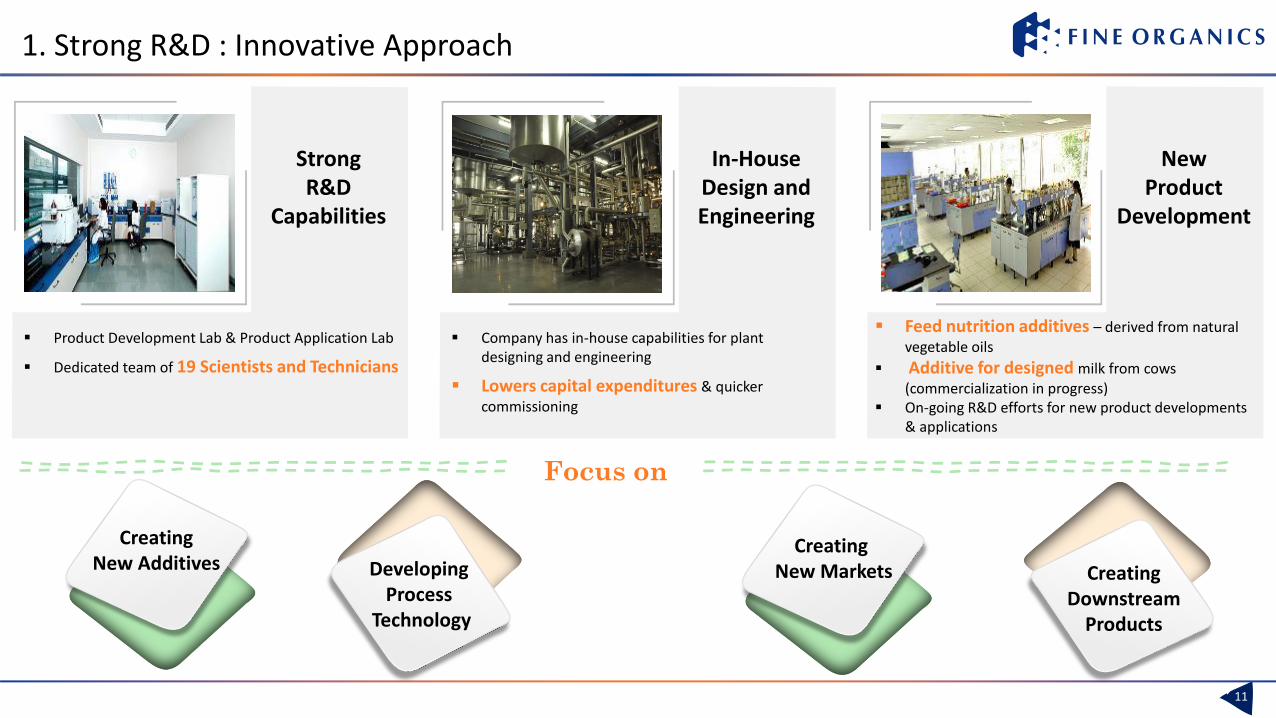
1. Strong R&D : Innovative Approach
11
▪ Feed nutrition additives – derived from natural vegetable oils
▪ Additive for designed milk from cows (commercialization in progress)
▪ On-going R&D efforts for new product developments & applications
New Product
Development
▪ Product Development Lab & Product Application Lab
▪ Dedicated team of 19 Scientists and Technicians
Strong R&D
Capabilities
Creating Downstream
Products
Creating New Additives
00
Creating New MarketsDeveloping
Process Technology
Focus on
▪ Company has in-house capabilities for plant designing and engineering
▪ Lowers capital expenditures & quicker commissioning
In-House Design and Engineering
with Industry Standards and Regulatory Credentials
12
✓ Setting new benchmarks in quality and consistency
✓ High safety and productivity standards
✓ Products are appreciated by customers worldwide for their consistent quality and packaging standards
Fine’s facilities are fully geared towards
meeting growing Global Demands
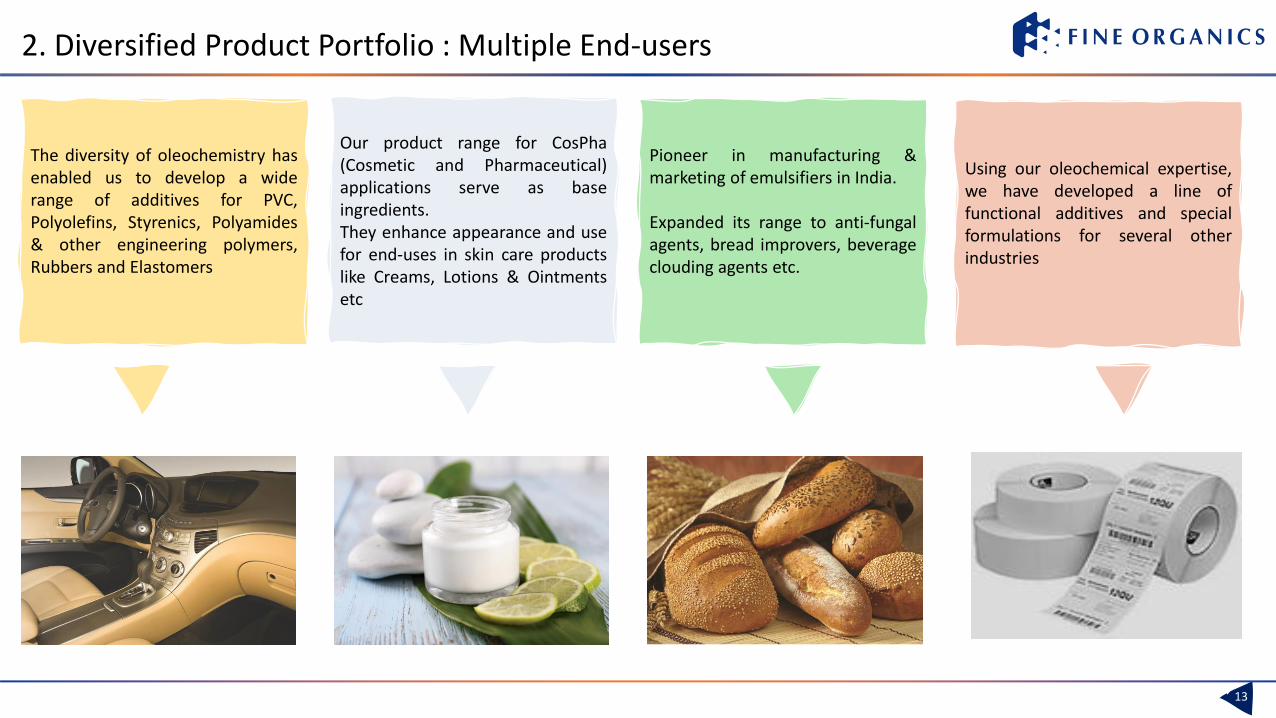
2. Diversified Product Portfolio : Multiple End-users
13
The diversity of oleochemistry hasenabled us to develop a widerange of additives for PVC,Polyolefins, Styrenics, Polyamides& other engineering polymers,Rubbers and Elastomers
Pioneer in manufacturing &marketing of emulsifiers in India.
Expanded its range to anti-fungalagents, bread improvers, beverageclouding agents etc.
Using our oleochemical expertise,we have developed a line offunctional additives and specialformulations for several otherindustries
Our product range for CosPha(Cosmetic and Pharmaceutical)applications serve as baseingredients.They enhance appearance and usefor end-uses in skin care productslike Creams, Lotions & Ointmentsetc
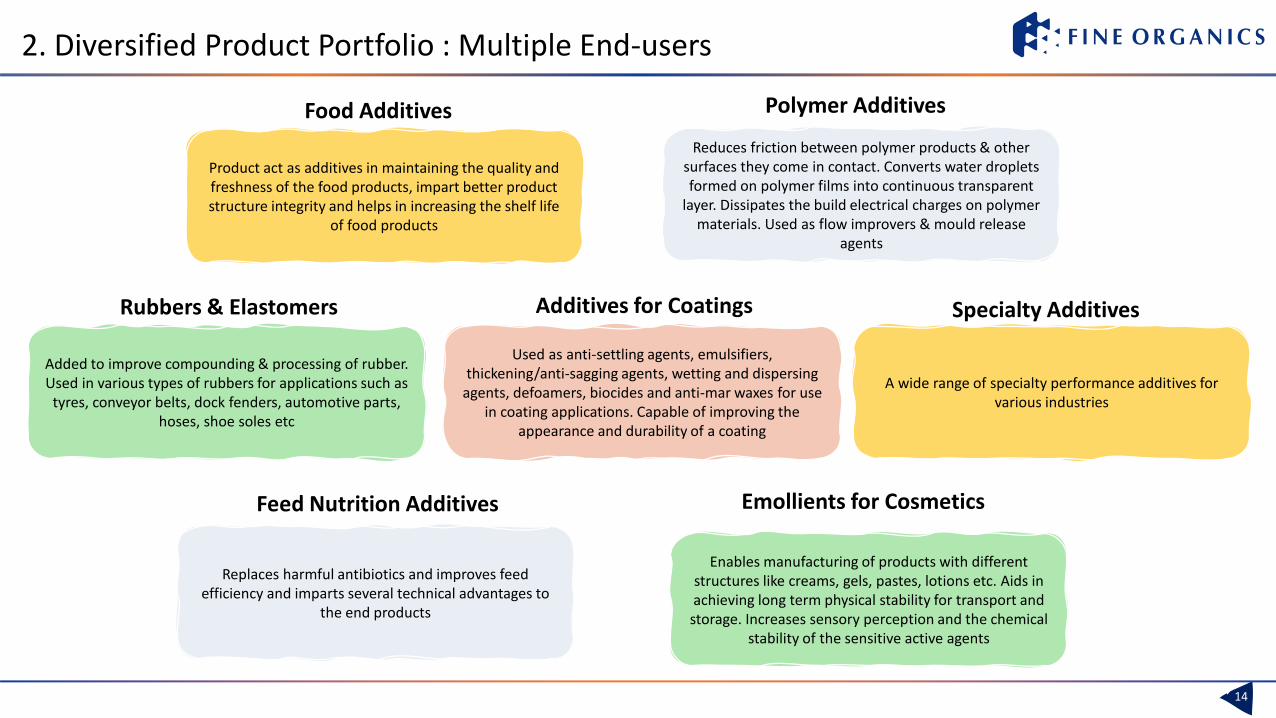
2. Diversified Product Portfolio : Multiple End-users
14
Enables manufacturing of products with different structures like creams, gels, pastes, lotions etc. Aids in achieving long term physical stability for transport and storage. Increases sensory perception and the chemical
stability of the sensitive active agents
A wide range of specialty performance additives for various industries
Reduces friction between polymer products & other surfaces they come in contact. Converts water droplets formed on polymer films into continuous transparent
layer. Dissipates the build electrical charges on polymer materials. Used as flow improvers & mould release
agents
Product act as additives in maintaining the quality and freshness of the food products, impart better product structure integrity and helps in increasing the shelf life
of food products
14
Food Additives Polymer Additives
Specialty Additives
Emollients for Cosmetics
Rubbers & Elastomers Additives for Coatings
Feed Nutrition Additives
Added to improve compounding & processing of rubber. Used in various types of rubbers for applications such as
tyres, conveyor belts, dock fenders, automotive parts, hoses, shoe soles etc
Used as anti-settling agents, emulsifiers, thickening/anti-sagging agents, wetting and dispersing
agents, defoamers, biocides and anti-mar waxes for use in coating applications. Capable of improving the
appearance and durability of a coating
Replaces harmful antibiotics and improves feed efficiency and imparts several technical advantages to
the end products
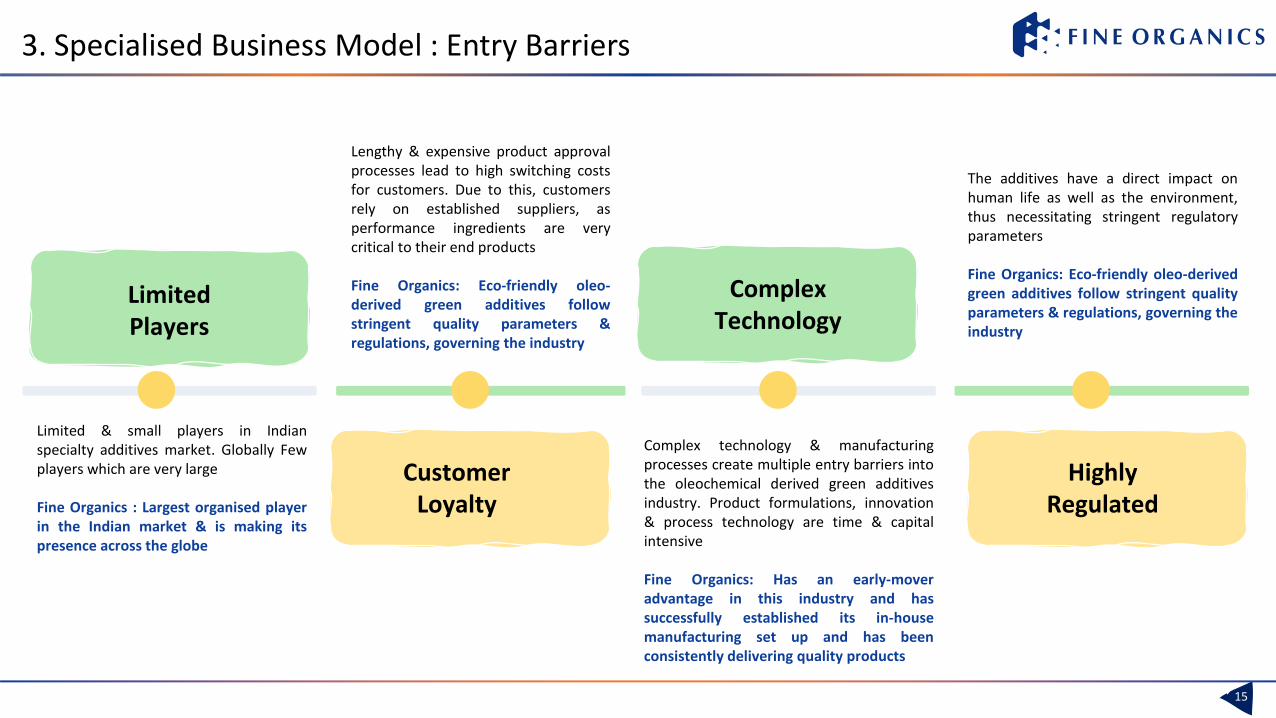
Limited Players
Limited & small players in Indianspecialty additives market. Globally Fewplayers which are very large
Fine Organics : Largest organised playerin the Indian market & is making itspresence across the globe
Customer Loyalty
15
Lengthy & expensive product approvalprocesses lead to high switching costsfor customers. Due to this, customersrely on established suppliers, asperformance ingredients are verycritical to their end products
Fine Organics: Eco-friendly oleo-derived green additives followstringent quality parameters ®ulations, governing the industry
Complex technology & manufacturingprocesses create multiple entry barriers intothe oleochemical derived green additivesindustry. Product formulations, innovation& process technology are time & capitalintensive
Fine Organics: Has an early-moveradvantage in this industry and hassuccessfully established its in-housemanufacturing set up and has beenconsistently delivering quality products
The additives have a direct impact onhuman life as well as the environment,thus necessitating stringent regulatoryparameters
Fine Organics: Eco-friendly oleo-derivedgreen additives follow stringent qualityparameters & regulations, governing theindustry
Complex Technology
Highly Regulated
3. Specialised Business Model : Entry Barriers
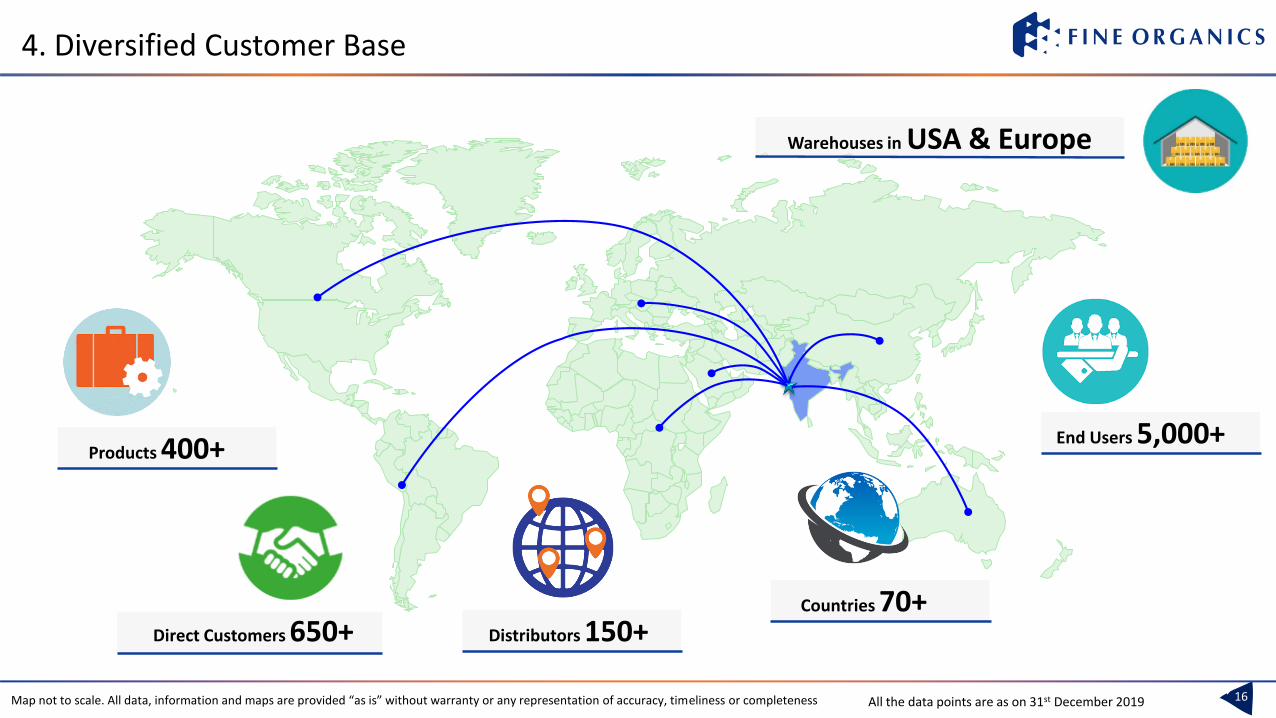
Products 400+
Direct Customers 650+ Distributors 150+
End Users 5,000+
Countries 70+
Warehouses in USA & Europe
16All the data points are as on 31st December 2019
4. Diversified Customer Base
Map not to scale. All data, information and maps are provided “as is” without warranty or any representation of accuracy, timeliness or completeness
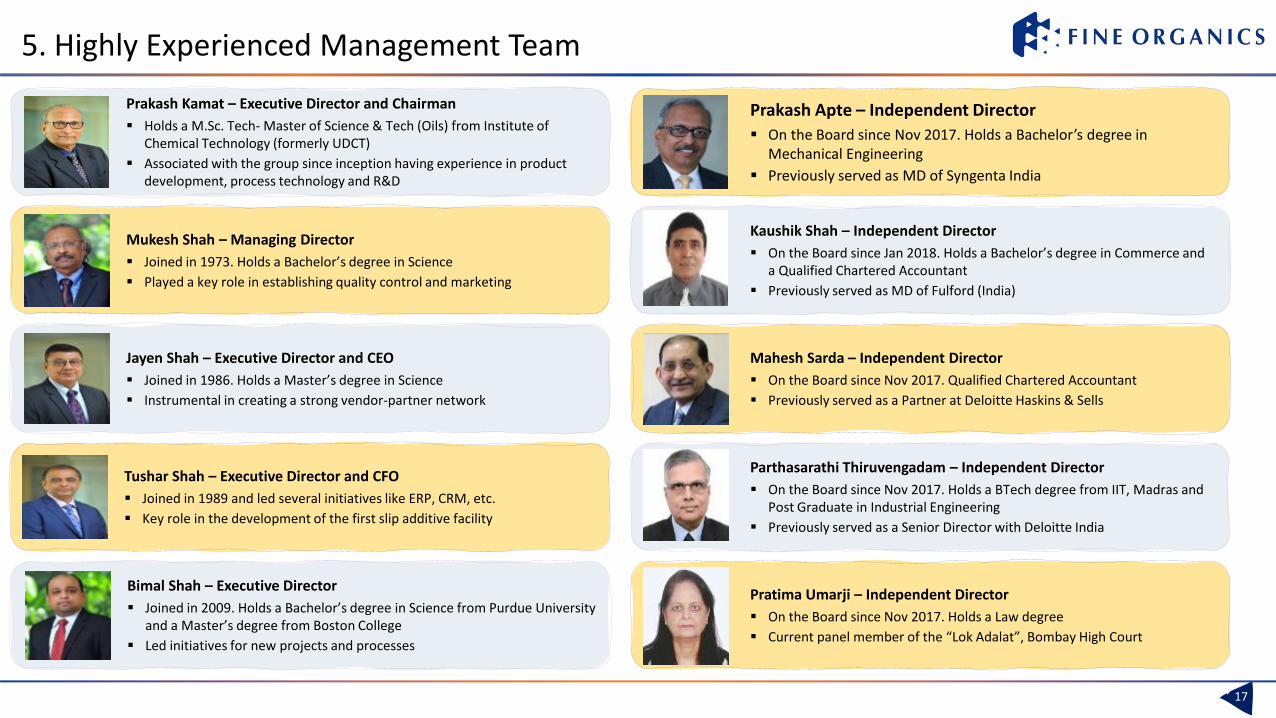
5. Highly Experienced Management Team
17
Parthasarathi Thiruvengadam – Independent Director
▪ On the Board since Nov 2017. Holds a BTech degree from IIT, Madras and Post Graduate in Industrial Engineering
▪ Previously served as a Senior Director with Deloitte India
Prakash Kamat – Executive Director and Chairman
▪ Holds a M.Sc. Tech- Master of Science & Tech (Oils) from Institute of Chemical Technology (formerly UDCT)
▪ Associated with the group since inception having experience in product development, process technology and R&D
Mukesh Shah – Managing Director
▪ Joined in 1973. Holds a Bachelor’s degree in Science
▪ Played a key role in establishing quality control and marketing
Jayen Shah – Executive Director and CEO
▪ Joined in 1986. Holds a Master’s degree in Science
▪ Instrumental in creating a strong vendor-partner network
Tushar Shah – Executive Director and CFO
▪ Joined in 1989 and led several initiatives like ERP, CRM, etc.
▪ Key role in the development of the first slip additive facility
Bimal Shah – Executive Director
▪ Joined in 2009. Holds a Bachelor’s degree in Science from Purdue University and a Master’s degree from Boston College
▪ Led initiatives for new projects and processes
Pratima Umarji – Independent Director
▪ On the Board since Nov 2017. Holds a Law degree
▪ Current panel member of the “Lok Adalat”, Bombay High Court
Prakash Apte – Independent Director
▪ On the Board since Nov 2017. Holds a Bachelor’s degree in Mechanical Engineering
▪ Previously served as MD of Syngenta India
Kaushik Shah – Independent Director
▪ On the Board since Jan 2018. Holds a Bachelor’s degree in Commerce and a Qualified Chartered Accountant
▪ Previously served as MD of Fulford (India)
Mahesh Sarda – Independent Director
▪ On the Board since Nov 2017. Qualified Chartered Accountant
▪ Previously served as a Partner at Deloitte Haskins & Sells
18
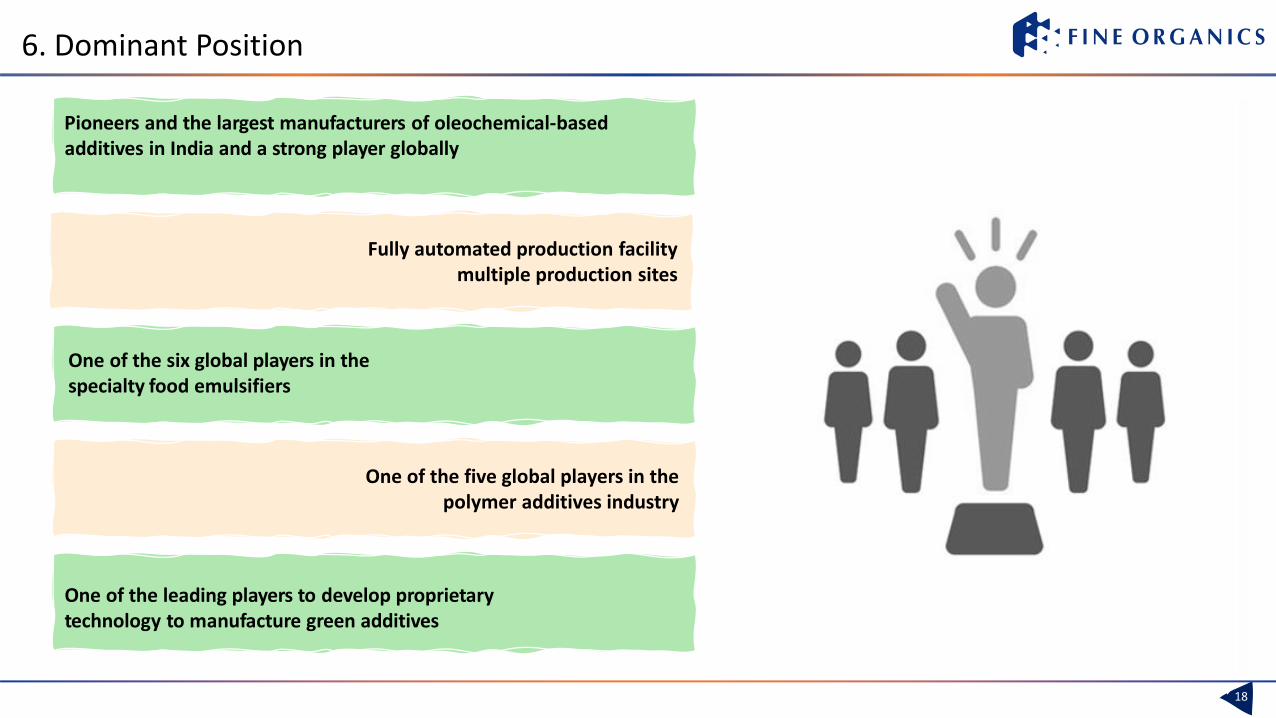
One of the five global players in the polymer additives industry
One of the leading players to develop proprietarytechnology to manufacture green additives
One of the six global players in thespecialty food emulsifiers
Fully automated production facilitymultiple production sites
Pioneers and the largest manufacturers of oleochemical-basedadditives in India and a strong player globally
6. Dominant Position
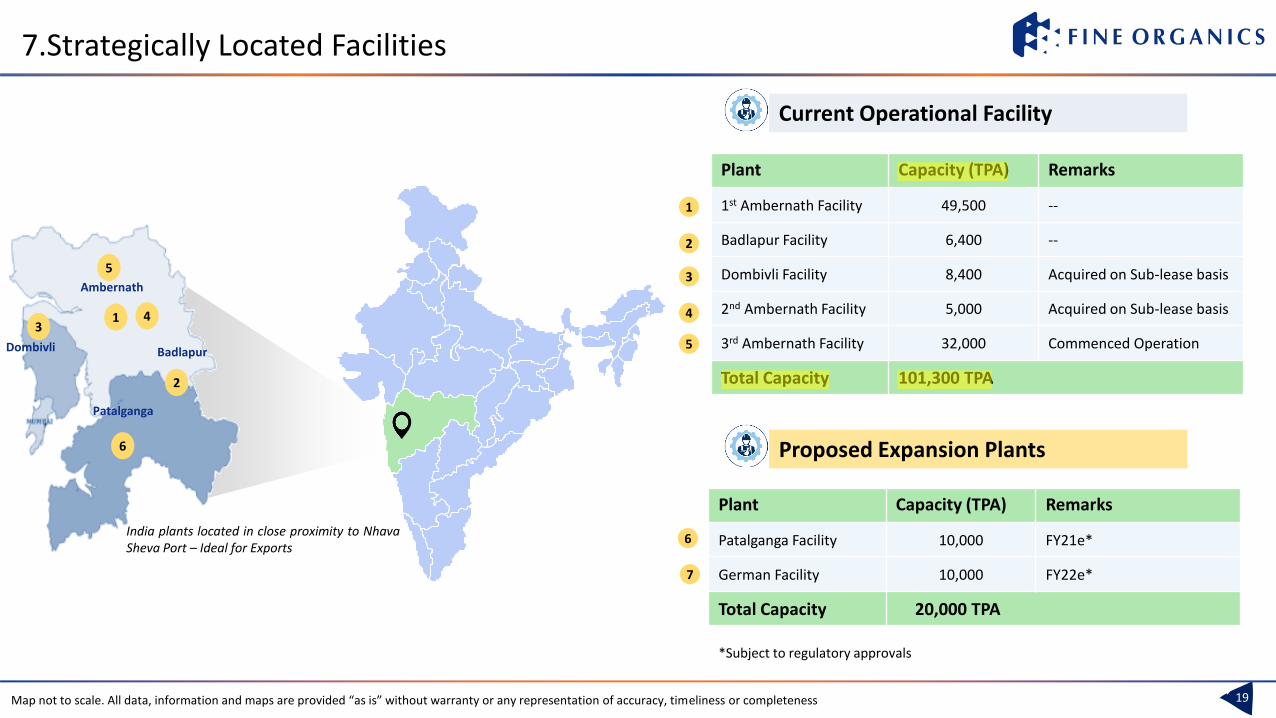
7.Strategically Located Facilities
19
Plant Capacity (TPA) Remarks
1st Ambernath Facility 49,500 --
Badlapur Facility 6,400 --
Dombivli Facility 8,400 Acquired on Sub-lease basis
2nd Ambernath Facility 5,000 Acquired on Sub-lease basis
3rd Ambernath Facility 32,000 Commenced Operation
Total Capacity 101,300 TPA
Current Operational Facility
1
2
3
4
5
Plant Capacity (TPA) Remarks
Patalganga Facility 10,000 FY21e*
German Facility 10,000 FY22e*
Total Capacity 20,000 TPA
7
6India plants located in close proximity to NhavaSheva Port – Ideal for Exports
Ambernath
Dombivli Badlapur
2
13
4
5
6
Patalganga
Proposed Expansion Plants
*Subject to regulatory approvals
Map not to scale. All data, information and maps are provided “as is” without warranty or any representation of accuracy, timeliness or completeness
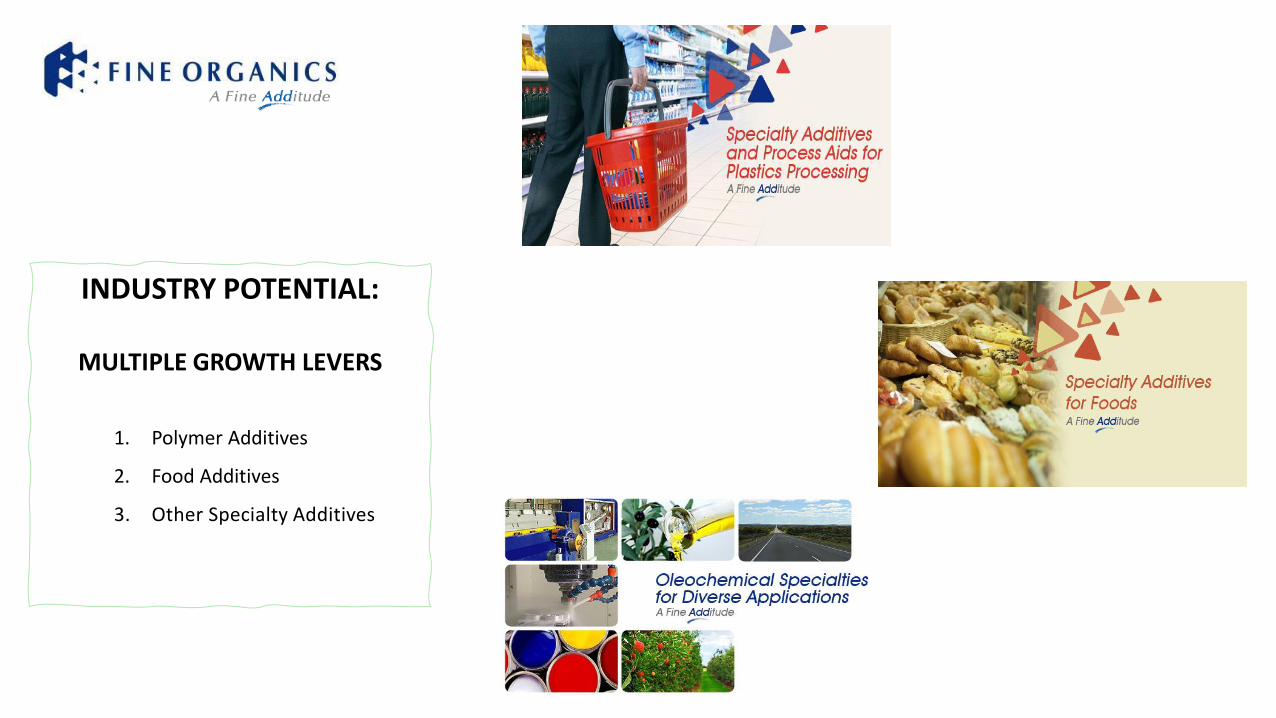
INDUSTRY POTENTIAL:
MULTIPLE GROWTH LEVERS
1. Polymer Additives
2. Food Additives
3. Other Specialty Additives
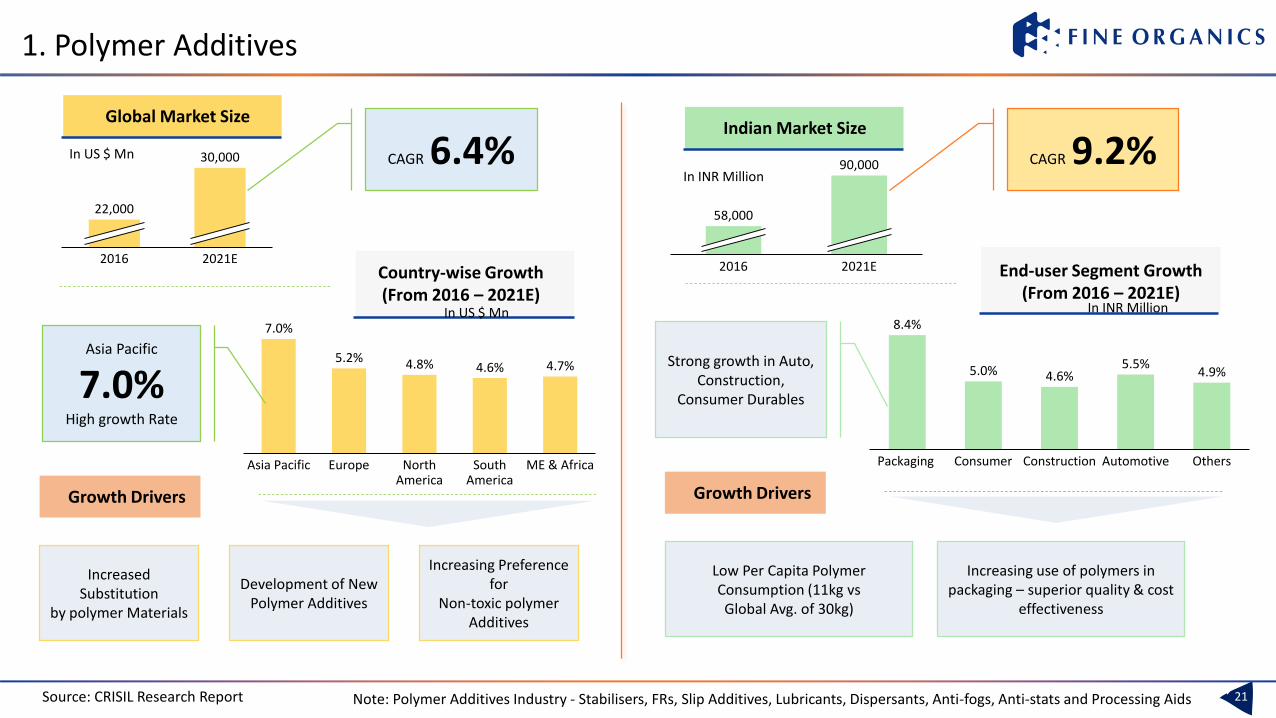
1. Polymer Additives
Note: Polymer Additives Industry - Stabilisers, FRs, Slip Additives, Lubricants, Dispersants, Anti-fogs, Anti-stats and Processing Aids
Global Market Size
In US $ Mn
Indian Market Size
2021E2016
22,000
30,000
2021E2016
90,000
58,000
Country-wise Growth (From 2016 – 2021E)
4.8%
Asia Pacific Europe North America
ME & Africa
7.0%
South America
5.2%4.6% 4.7%
CAGR 6.4%
Asia Pacific
7.0%High growth Rate
Increased Substitution
by polymer Materials
Development of New Polymer Additives
Increasing Preference for
Non-toxic polymer Additives
CAGR 9.2%
End-user Segment Growth(From 2016 – 2021E)
8.4%
Packaging Consumer Others
4.6%
Construction Automotive
5.0% 5.5%4.9%
Strong growth in Auto, Construction,
Consumer Durables
Growth Drivers
Low Per Capita Polymer Consumption (11kg vs Global Avg. of 30kg)
Increasing use of polymers in packaging – superior quality & cost
effectiveness
21Source: CRISIL Research Report
In INR Million
In INR MillionIn US $ Mn
Growth Drivers
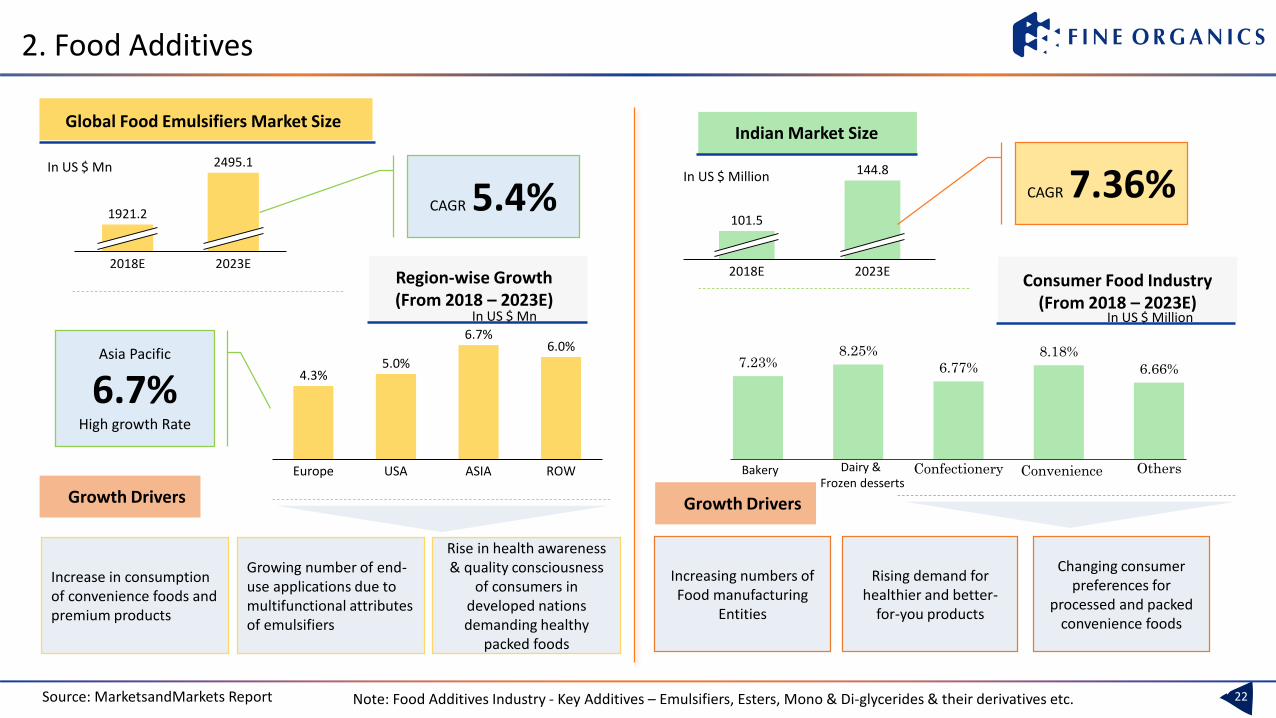
2. Food Additives
Note: Food Additives Industry - Key Additives – Emulsifiers, Esters, Mono & Di-glycerides & their derivatives etc.
Global Food Emulsifiers Market Size
In US $ Mn
Indian Market Size
2018E 2023E
1921.2
2495.1
2018E 2023E
101.5
144.8
Region-wise Growth (From 2018 – 2023E)
CAGR 5.4%
Asia Pacific
6.7%High growth Rate
Increase in consumption of convenience foods and premium products
Growing number of end-use applications due to multifunctional attributes of emulsifiers
Rise in health awareness & quality consciousness
of consumers in developed nations demanding healthy
packed foods
CAGR 7.36%
Consumer Food Industry(From 2018 – 2023E)
Increasing numbers of Food manufacturing
Entities
Rising demand for healthier and better-
for-you products
Changing consumer preferences for
processed and packed convenience foods
22
In US $ Million
In US $ Mn In US $ Million
Source: MarketsandMarkets Report
7.23%8.25%
6.77%8.18%
6.66%
Bakery Dairy & Frozen desserts
Confectionery Convenience Others
6.0%
USAEurope ASIA
4.3%
ROW
5.0%
6.7%
Growth Drivers Growth Drivers
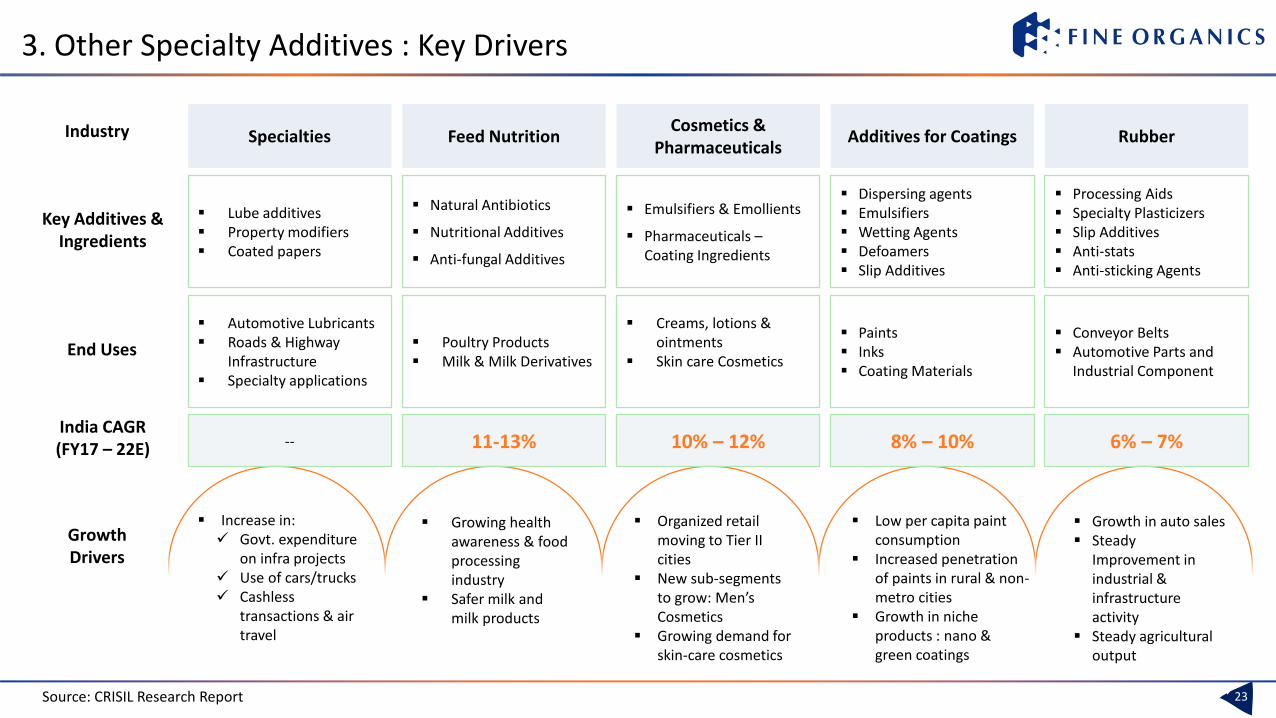
3. Other Specialty Additives : Key Drivers
Specialties Feed Nutrition Additives for Coatings RubberCosmetics &
Pharmaceuticals
▪ Lube additives▪ Property modifiers▪ Coated papers
▪ Natural Antibiotics
▪ Nutritional Additives
▪ Anti-fungal Additives
▪ Dispersing agents▪ Emulsifiers▪ Wetting Agents▪ Defoamers▪ Slip Additives
▪ Processing Aids▪ Specialty Plasticizers▪ Slip Additives▪ Anti-stats▪ Anti-sticking Agents
▪ Emulsifiers & Emollients
▪ Pharmaceuticals –Coating Ingredients
▪ Automotive Lubricants▪ Roads & Highway
Infrastructure▪ Specialty applications
▪ Poultry Products▪ Milk & Milk Derivatives
▪ Paints▪ Inks▪ Coating Materials
▪ Conveyor Belts▪ Automotive Parts and
Industrial Component
▪ Creams, lotions & ointments
▪ Skin care Cosmetics
-- 11-13% 8% – 10% 6% – 7%10% – 12%
Key Additives & Ingredients
End Uses
India CAGR(FY17 – 22E)
Growth Drivers
Industry
▪ Increase in: ✓ Govt. expenditure
on infra projects✓ Use of cars/trucks✓ Cashless
transactions & air travel
▪ Growing health awareness & food processing industry
▪ Safer milk and milk products
▪ Organized retail moving to Tier II cities
▪ New sub-segments to grow: Men’s Cosmetics
▪ Growing demand for skin-care cosmetics
▪ Low per capita paint consumption
▪ Increased penetration of paints in rural & non-metro cities
▪ Growth in niche products : nano & green coatings
▪ Growth in auto sales▪ Steady
Improvement in industrial & infrastructure activity
▪ Steady agricultural output
23Source: CRISIL Research Report

Financial Highlights
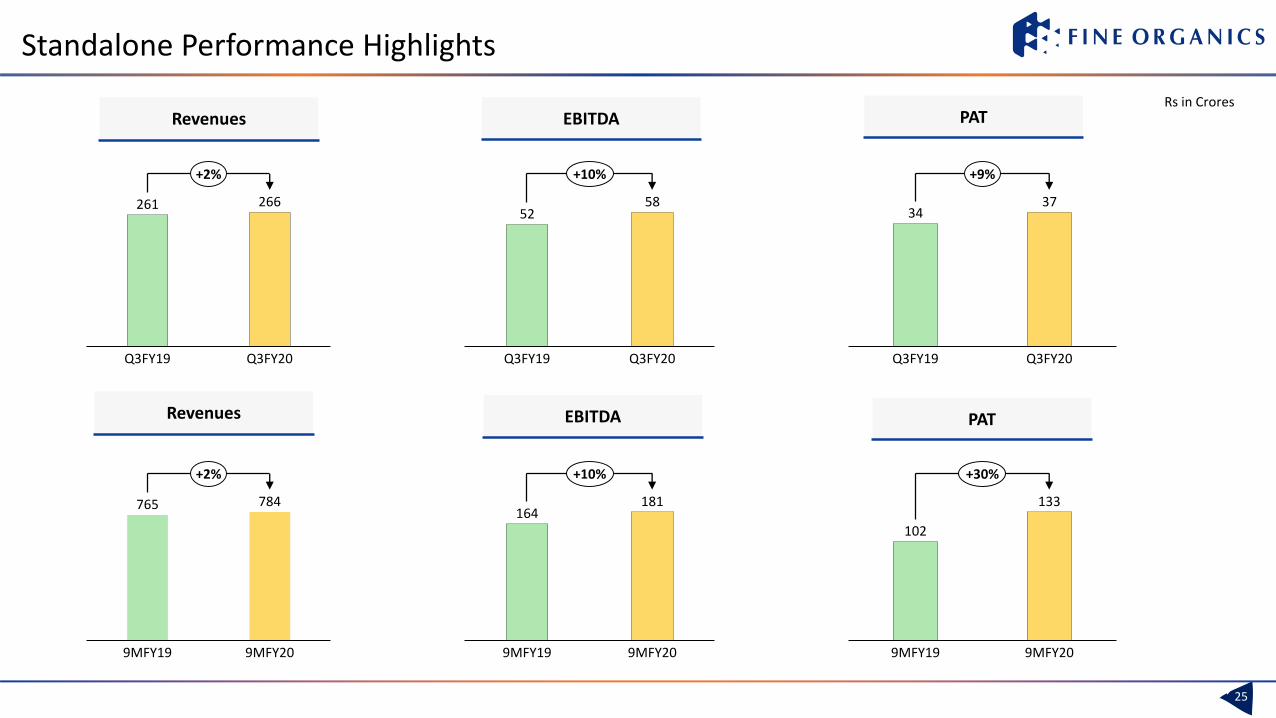
Standalone Performance Highlights
Revenues EBITDARs in Crores
25
261 266
Q3FY19 Q3FY20
+2%
PAT
765 784
9MFY19 9MFY20
+2%
Revenues
5258
Q3FY19 Q3FY20
+10%
3437
Q3FY20Q3FY19
+9%
EBITDA PAT
164181
9MFY19 9MFY20
+10%
102
133
9MFY19 9MFY20
+30%
PAT & Margins
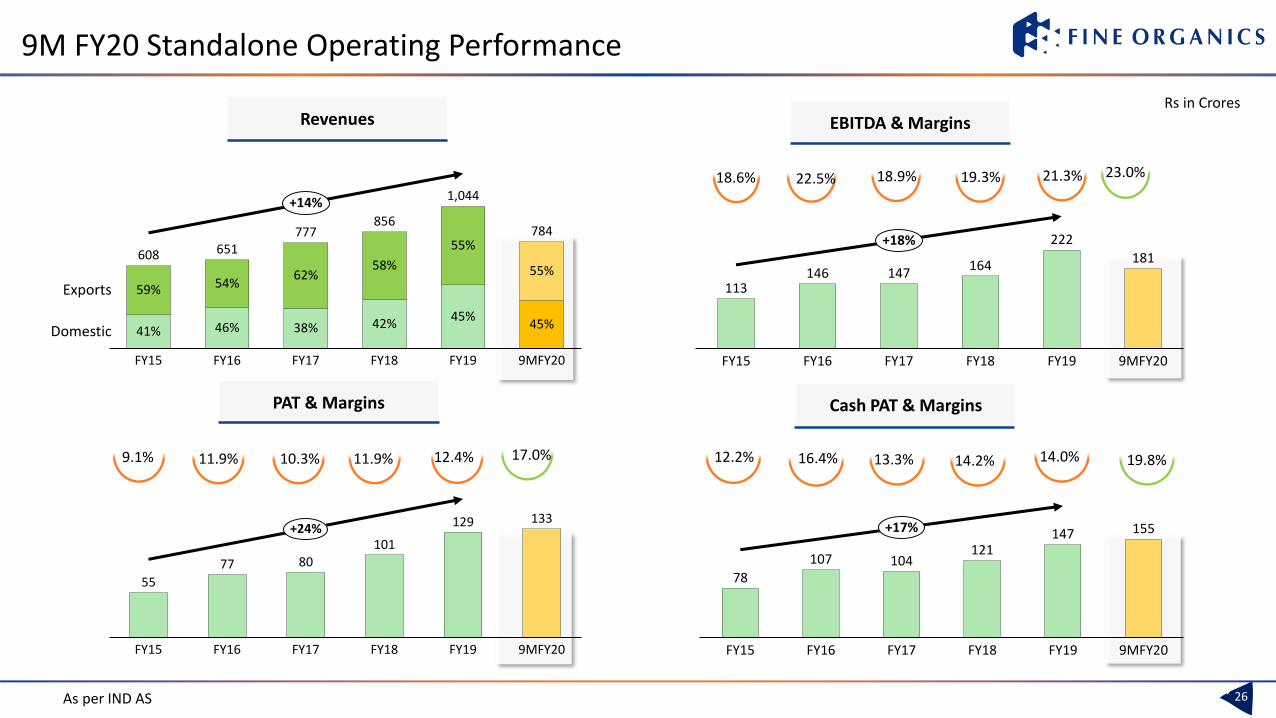
9M FY20 Standalone Operating Performance
113146 147
164
222
181
FY15 FY16 FY19 9MFY20FY17 FY18
+18%
55
77 80101
129 133
FY19FY15 FY16 9MFY20FY18FY17
+24%
Revenues EBITDA & Margins
Cash PAT & Margins
18.6% 22.5% 18.9%
9.1% 11.9% 10.3% 17.0%
Rs in Crores
78
107 104121
147 155
FY18 9MFY20FY19FY15 FY16 FY17
+17%
12.2% 16.4% 13.3% 19.8%
26As per IND AS
11.9% 14.2%
46%Domestic
54%59%
41% 38%
1,044
FY16FY15
Exports62%
FY17
58%
45%42%
FY18
55%
FY19
45%
55%
9MFY20
608 651777
856784
+14%
23.0%21.3%
14.0%12.4%
19.3%
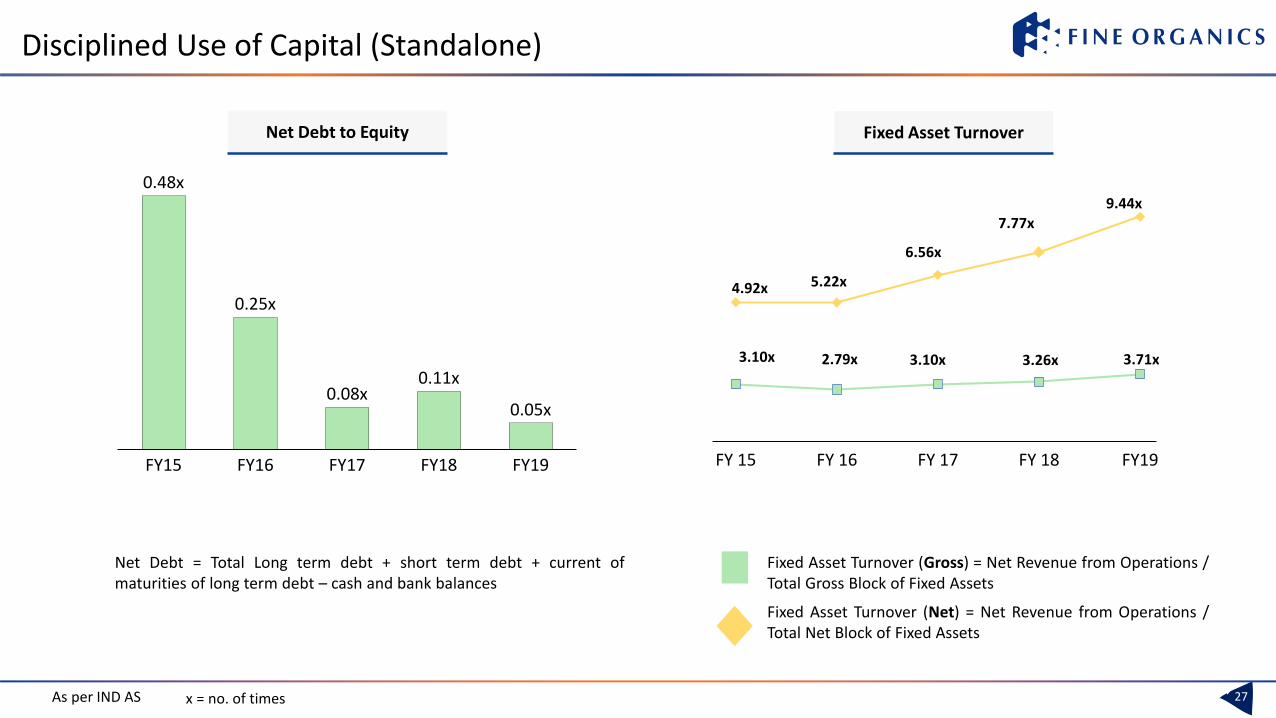
Disciplined Use of Capital (Standalone)
0.05x0.08x
0.25x
FY15
0.48x
FY16 FY17 FY19FY18
0.11x3.10x 2.79x 3.10x 3.26x 3.71x
4.92x 5.22x
6.56x
7.77x9.44x
FY 15 FY 16 FY 17 FY 18 FY19
27
Net Debt to Equity Fixed Asset Turnover
Net Debt = Total Long term debt + short term debt + current ofmaturities of long term debt – cash and bank balances
Fixed Asset Turnover (Gross) = Net Revenue from Operations /Total Gross Block of Fixed Assets
Fixed Asset Turnover (Net) = Net Revenue from Operations /Total Net Block of Fixed Assets
As per IND AS x = no. of times
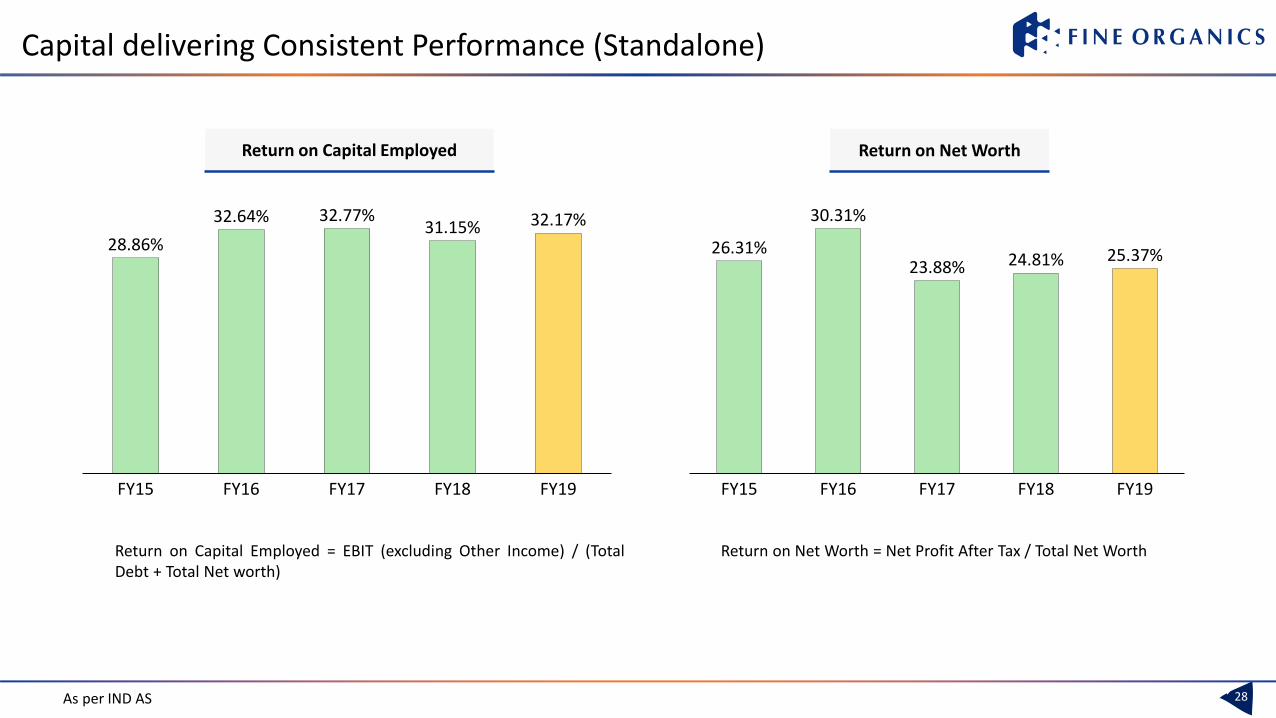
Capital delivering Consistent Performance (Standalone)
FY15 FY16
28.86%
FY19
32.64%
FY17 FY18
32.77%31.15% 32.17%
23.88%
FY18
24.81%
FY15 FY16 FY17 FY19
26.31%
30.31%
25.37%
28
Return on Net WorthReturn on Capital Employed
Return on Capital Employed = EBIT (excluding Other Income) / (TotalDebt + Total Net worth)
Return on Net Worth = Net Profit After Tax / Total Net Worth
As per IND AS
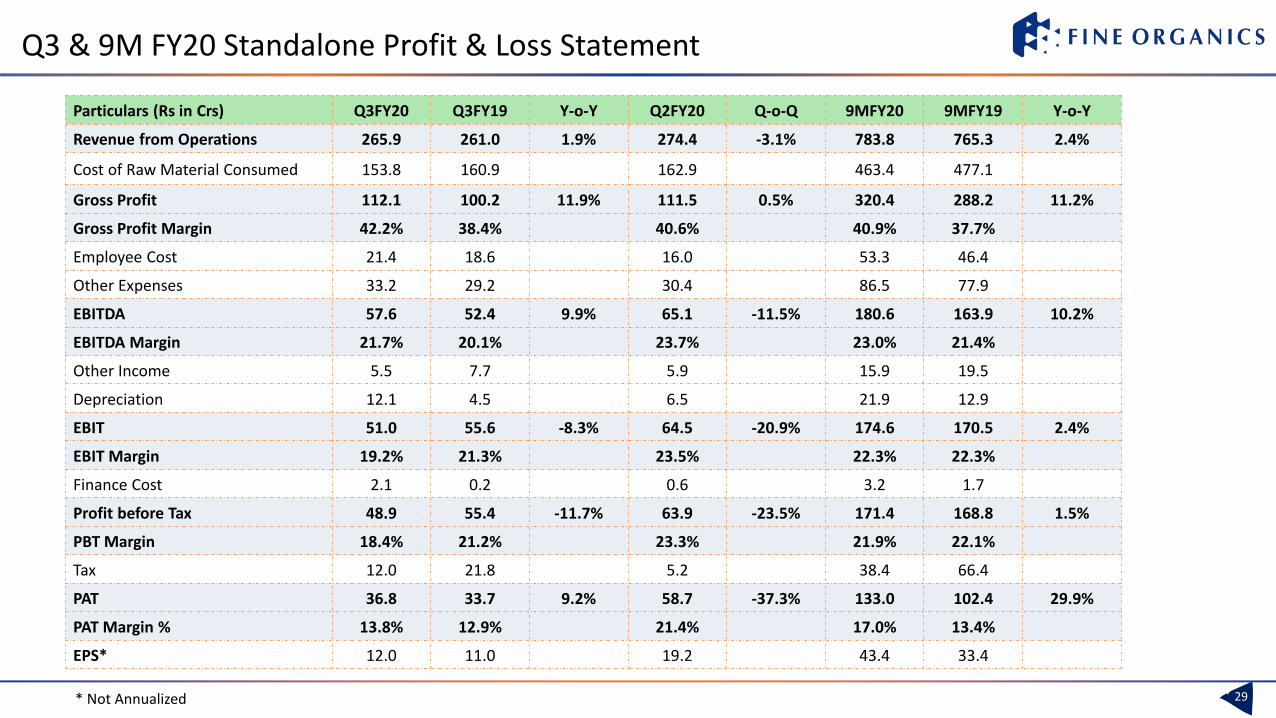
Q3 & 9M FY20 Standalone Profit & Loss Statement
29* Not Annualized
Particulars (Rs in Crs) Q3FY20 Q3FY19 Y-o-Y Q2FY20 Q-o-Q 9MFY20 9MFY19 Y-o-Y
Revenue from Operations 265.9 261.0 1.9% 274.4 -3.1% 783.8 765.3 2.4%
Cost of Raw Material Consumed 153.8 160.9 162.9 463.4 477.1
Gross Profit 112.1 100.2 11.9% 111.5 0.5% 320.4 288.2 11.2%
Gross Profit Margin 42.2% 38.4% 40.6% 40.9% 37.7%
Employee Cost 21.4 18.6 16.0 53.3 46.4
Other Expenses 33.2 29.2 30.4 86.5 77.9
EBITDA 57.6 52.4 9.9% 65.1 -11.5% 180.6 163.9 10.2%
EBITDA Margin 21.7% 20.1% 23.7% 23.0% 21.4%
Other Income 5.5 7.7 5.9 15.9 19.5
Depreciation 12.1 4.5 6.5 21.9 12.9
EBIT 51.0 55.6 -8.3% 64.5 -20.9% 174.6 170.5 2.4%
EBIT Margin 19.2% 21.3% 23.5% 22.3% 22.3%
Finance Cost 2.1 0.2 0.6 3.2 1.7
Profit before Tax 48.9 55.4 -11.7% 63.9 -23.5% 171.4 168.8 1.5%
PBT Margin 18.4% 21.2% 23.3% 21.9% 22.1%
Tax 12.0 21.8 5.2 38.4 66.4
PAT 36.8 33.7 9.2% 58.7 -37.3% 133.0 102.4 29.9%
PAT Margin % 13.8% 12.9% 21.4% 17.0% 13.4%
EPS* 12.0 11.0 19.2 43.4 33.4
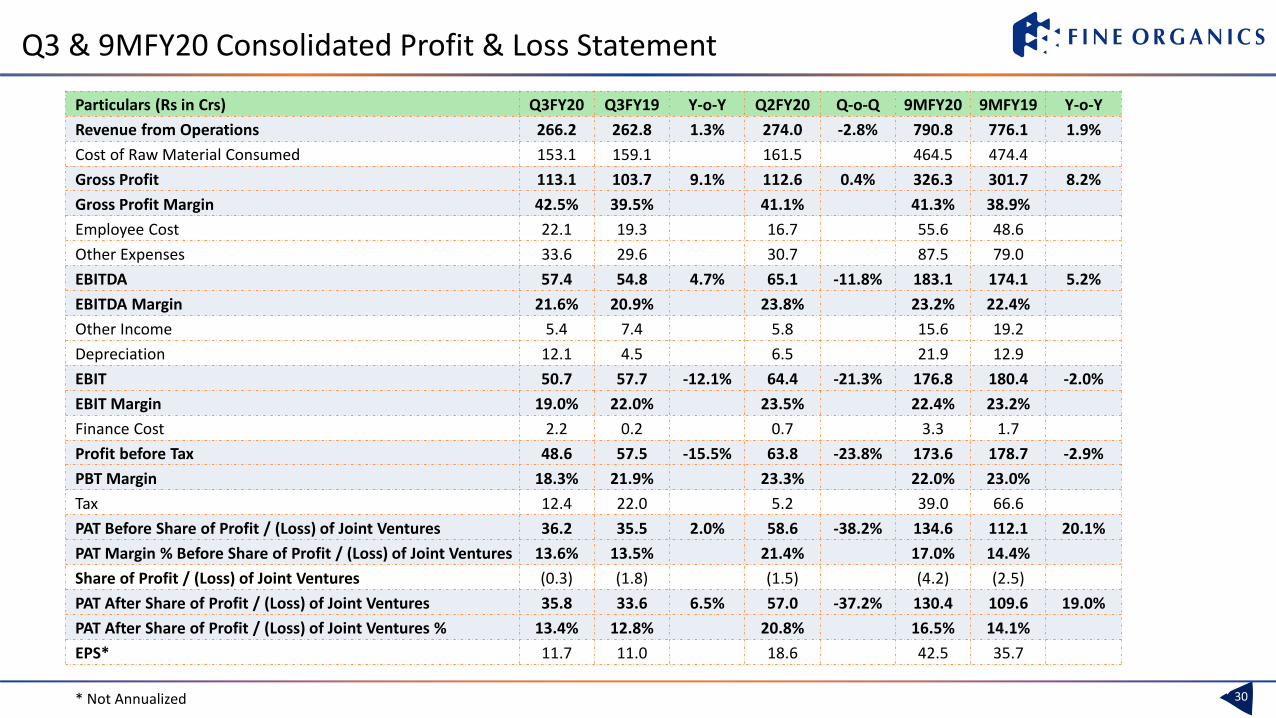
Q3 & 9MFY20 Consolidated Profit & Loss Statement
30
Particulars (Rs in Crs) Q3FY20 Q3FY19 Y-o-Y Q2FY20 Q-o-Q 9MFY20 9MFY19 Y-o-Y
Revenue from Operations 266.2 262.8 1.3% 274.0 -2.8% 790.8 776.1 1.9%
Cost of Raw Material Consumed 153.1 159.1 161.5 464.5 474.4
Gross Profit 113.1 103.7 9.1% 112.6 0.4% 326.3 301.7 8.2%
Gross Profit Margin 42.5% 39.5% 41.1% 41.3% 38.9%
Employee Cost 22.1 19.3 16.7 55.6 48.6
Other Expenses 33.6 29.6 30.7 87.5 79.0
EBITDA 57.4 54.8 4.7% 65.1 -11.8% 183.1 174.1 5.2%
EBITDA Margin 21.6% 20.9% 23.8% 23.2% 22.4%
Other Income 5.4 7.4 5.8 15.6 19.2
Depreciation 12.1 4.5 6.5 21.9 12.9
EBIT 50.7 57.7 -12.1% 64.4 -21.3% 176.8 180.4 -2.0%
EBIT Margin 19.0% 22.0% 23.5% 22.4% 23.2%
Finance Cost 2.2 0.2 0.7 3.3 1.7
Profit before Tax 48.6 57.5 -15.5% 63.8 -23.8% 173.6 178.7 -2.9%
PBT Margin 18.3% 21.9% 23.3% 22.0% 23.0%
Tax 12.4 22.0 5.2 39.0 66.6
PAT Before Share of Profit / (Loss) of Joint Ventures 36.2 35.5 2.0% 58.6 -38.2% 134.6 112.1 20.1%
PAT Margin % Before Share of Profit / (Loss) of Joint Ventures 13.6% 13.5% 21.4% 17.0% 14.4%
Share of Profit / (Loss) of Joint Ventures (0.3) (1.8) (1.5) (4.2) (2.5)
PAT After Share of Profit / (Loss) of Joint Ventures 35.8 33.6 6.5% 57.0 -37.2% 130.4 109.6 19.0%
PAT After Share of Profit / (Loss) of Joint Ventures % 13.4% 12.8% 20.8% 16.5% 14.1%
EPS* 11.7 11.0 18.6 42.5 35.7
* Not Annualized
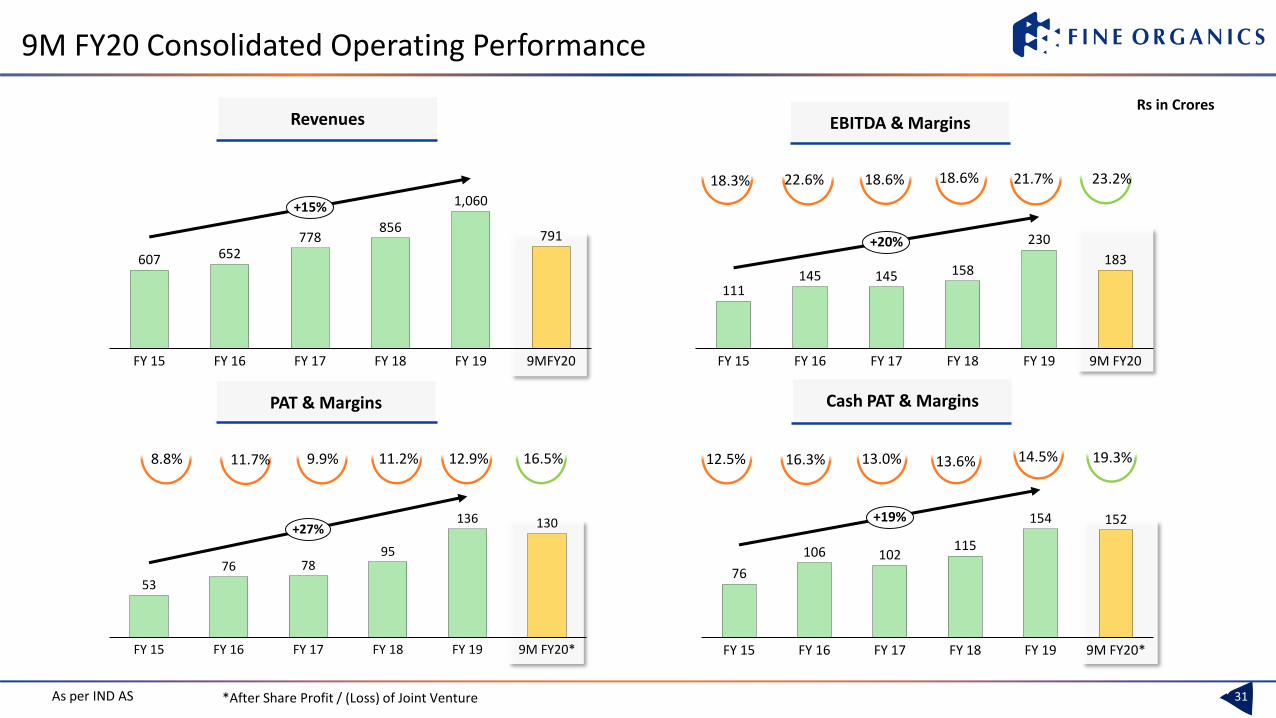
9M FY20 Consolidated Operating Performance
607 652778
856
1,060
791
9MFY20FY 17FY 15 FY 16 FY 19FY 18
+15%
111145 145 158
230
183
FY 18FY 17FY 15 FY 16 FY 19 9M FY20
+20%
53
76 7895
136 130
FY 19FY 16FY 15 FY 17 9M FY20*FY 18
+27%
Revenues EBITDA & Margins
PAT & Margins
Rs in Crores
76
106 102115
154 152
FY 15 FY 16 FY 17 9M FY20*FY 19FY 18
+19%
Cash PAT & Margins
31As per IND AS
18.3% 22.6% 18.6% 18.6% 23.2%
8.8% 11.7% 9.9% 11.2% 16.5% 12.5% 16.3% 13.0% 13.6% 19.3%
21.7%
12.9% 14.5%
*After Share Profit / (Loss) of Joint Venture
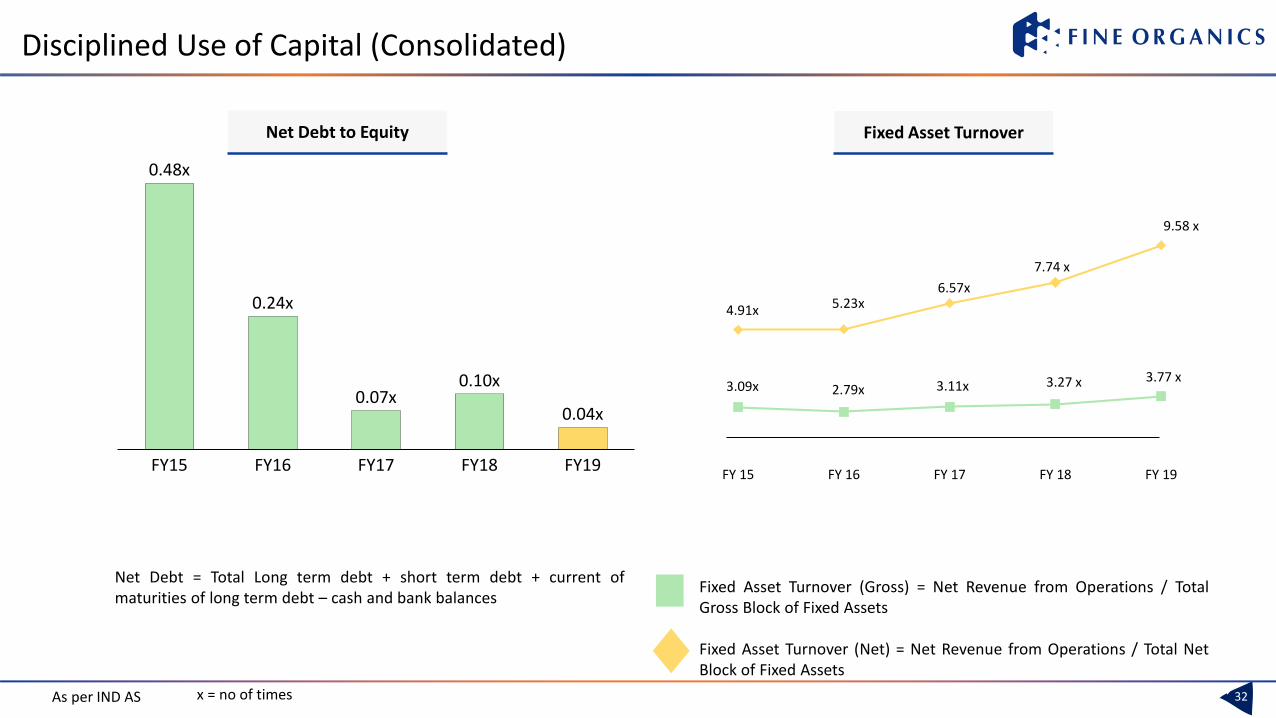
Disciplined Use of Capital (Consolidated)
FY19FY15 FY16 FY17
0.04x
FY18
0.48x
0.07x
0.24x
0.10x 3.09x 2.79x 3.11x 3.27 x 3.77 x
4.91x 5.23x6.57x
7.74 x
9.58 x
FY 15 FY 16 FY 17 FY 18 FY 19
32
Net Debt to Equity Fixed Asset Turnover
Net Debt = Total Long term debt + short term debt + current ofmaturities of long term debt – cash and bank balances
Fixed Asset Turnover (Gross) = Net Revenue from Operations / TotalGross Block of Fixed Assets
Fixed Asset Turnover (Net) = Net Revenue from Operations / Total NetBlock of Fixed Assets
As per IND AS x = no of times
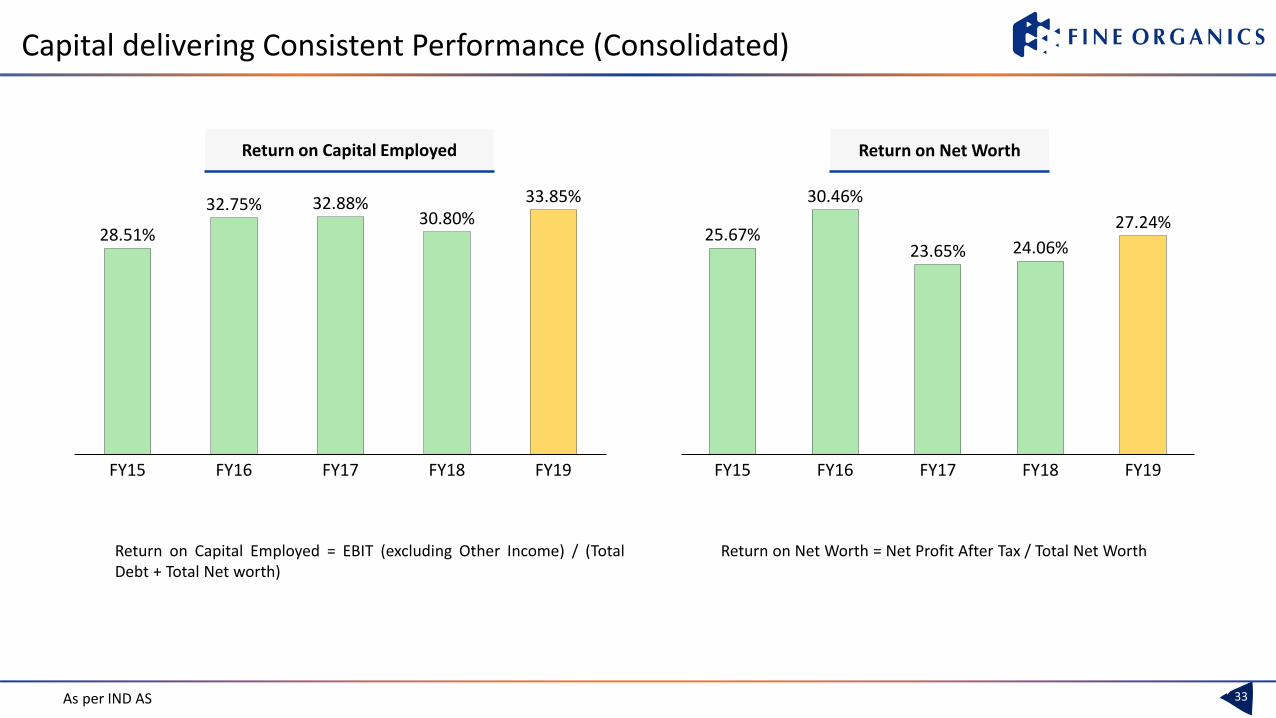
32.88%
FY18FY16FY15 FY19FY17
30.80%28.51%
32.75% 33.85%
25.67%27.24%
23.65%
FY15 FY17FY16 FY18
30.46%
FY19
24.06%
33
Return on Net WorthReturn on Capital Employed
Return on Capital Employed = EBIT (excluding Other Income) / (TotalDebt + Total Net worth)
Return on Net Worth = Net Profit After Tax / Total Net Worth
As per IND AS
Capital delivering Consistent Performance (Consolidated)
For further information, please contact:
Company : Investor Relations Advisors :
CIN: L24119MH2002PLC136003
Ms. Sonali BhadaniVice President - Finance
www.fineorganics.com
CIN: U74140MH2010PTC204285
Ms. Neha Shroff
+91 773807 3466
Email: [email protected]
www.sgapl.net
34