Embed Size (px)
Citation preview
d
UNIVERSITY OF DELAWARE FSAE CHASSIS: PHASE IV REPORT
Date: 12/10/10
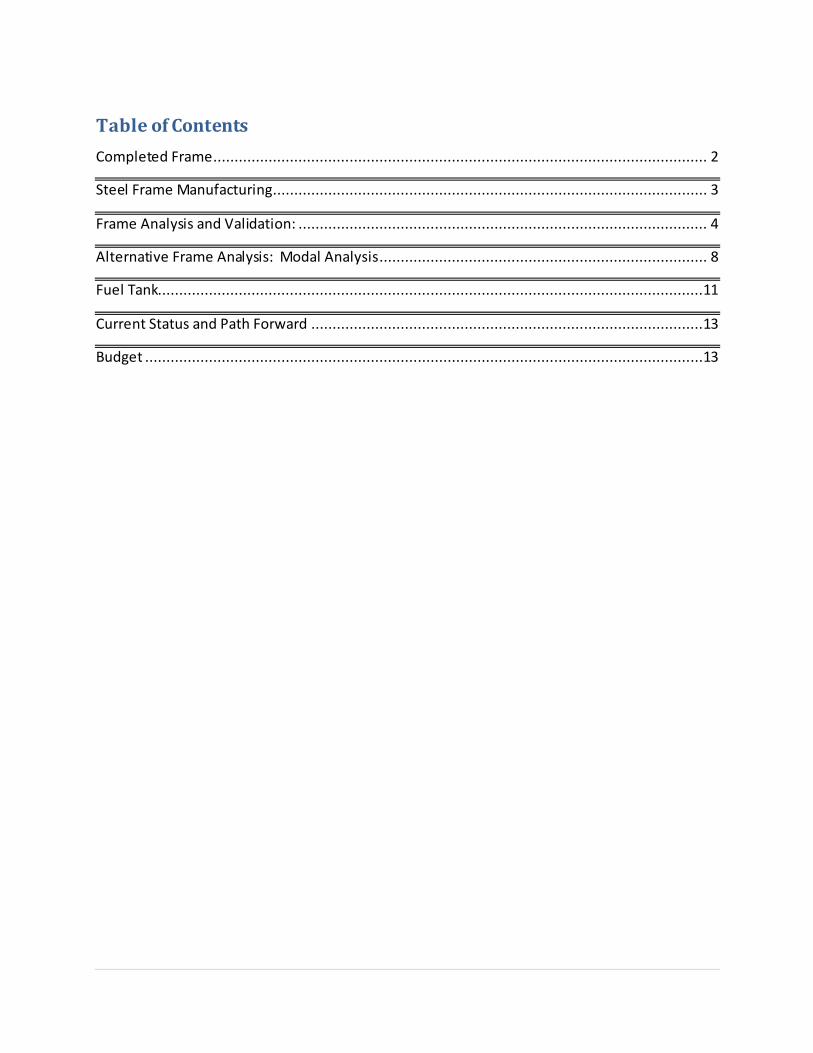
Table of Contents
Completed Frame .................................................................................................................... 2
Steel Frame Manufacturing...................................................................................................... 3
Frame Analysis and Validation: ................................................................................................ 4
Alternative Frame Analysis: Modal Analysis ............................................................................. 8
Fuel Tank................................................................................................................................11
Current Status and Path Forward ............................................................................................13
Budget ...................................................................................................................................13
2 | P a g e
Completed Frame
The follow images show the manufactured chassis with the suspension, steering wheel, pedal
box, engine, fuel tank, and differential all mocked up. It is evident from these images that the vehicle
systems all integrate into the chassis purposefully.
The images following (Fig 5 and Fig 6) illustrate the front end suspension packaging. Note the
positioning of the upper shock mount. The upper shock mount has to bear the majority of the load that
the suspension carries. The chassis design has a triangular truss structure supporting this mount for the
sole purpose of supporting this load.
Figure 1) Front Isometric View of Frame Figure 2) Rear Isometric View of Frame
Figure 3) Rear Suspension Box Figure 4) Radiator View
3 | P a g e
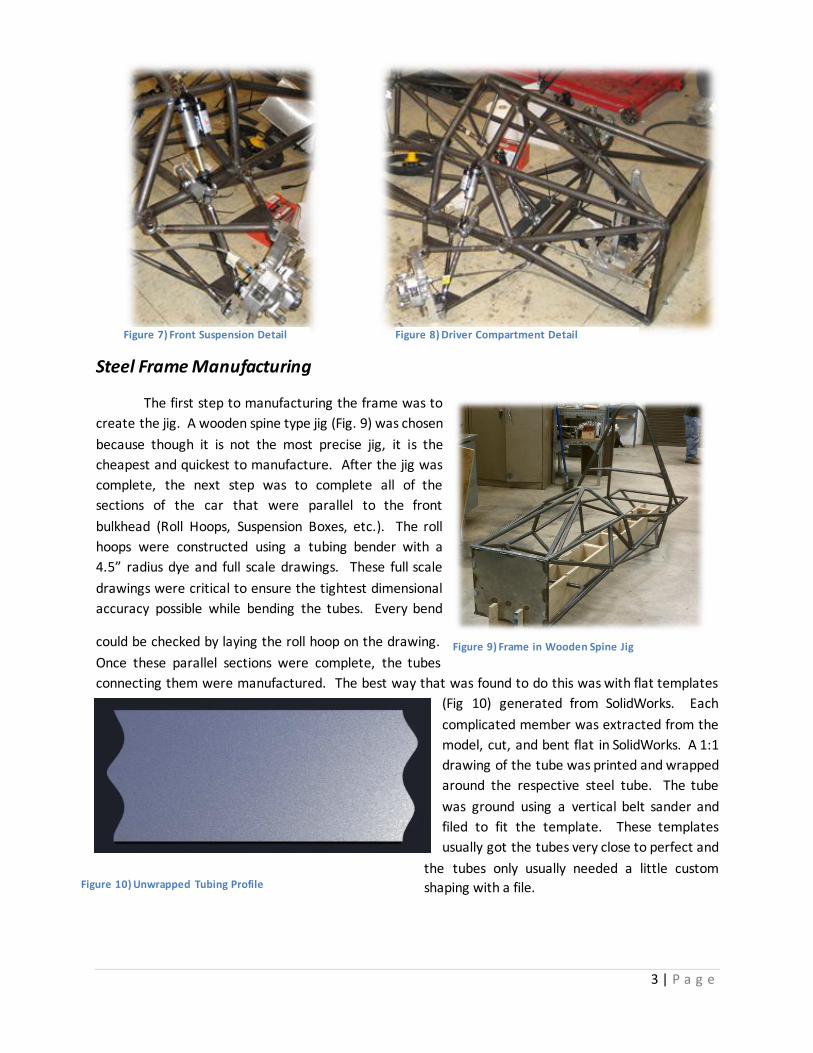
Steel Frame Manufacturing
The first step to manufacturing the frame was to
create the jig. A wooden spine type jig (Fig. 9) was chosen
because though it is not the most precise jig, it is the
cheapest and quickest to manufacture. After the jig was
complete, the next step was to complete all of the
sections of the car that were parallel to the front
bulkhead (Roll Hoops, Suspension Boxes, etc.). The roll
hoops were constructed using a tubing bender with a
4.5” radius dye and full scale drawings. These full scale
drawings were critical to ensure the tightest dimensional
accuracy possible while bending the tubes. Every bend
could be checked by laying the roll hoop on the drawing.
Once these parallel sections were complete, the tubes
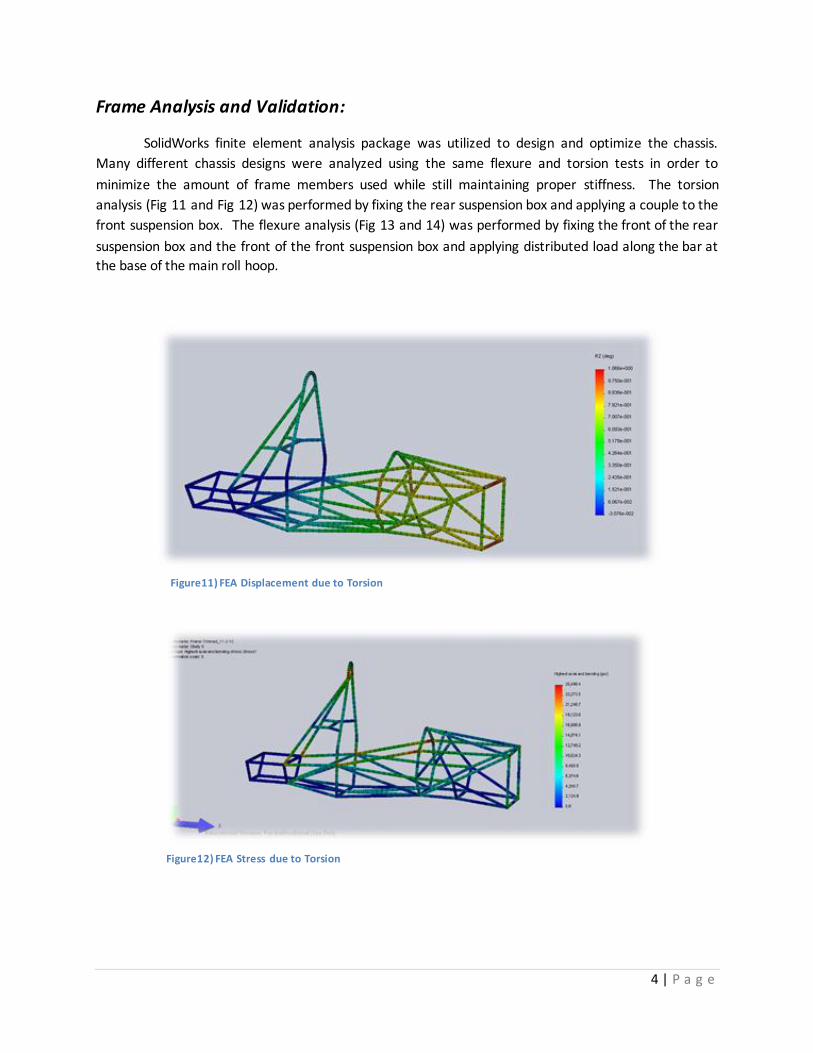
connecting them were manufactured. The best way that was found to do this was with flat templates
(Fig 10) generated from SolidWorks. Each
complicated member was extracted from the
model, cut, and bent flat in SolidWorks. A 1:1
drawing of the tube was printed and wrapped
around the respective steel tube. The tube
was ground using a vertical belt sander and
filed to fit the template. These templates
usually got the tubes very close to perfect and
the tubes only usually needed a little custom
shaping with a file.
Figure 7) Front Suspension Detail Figure 8) Driver Compartment Detail
Figure 9) Frame in Wooden Spine Jig
Figure 10) Unwrapped Tubing Profile
4 | P a g e
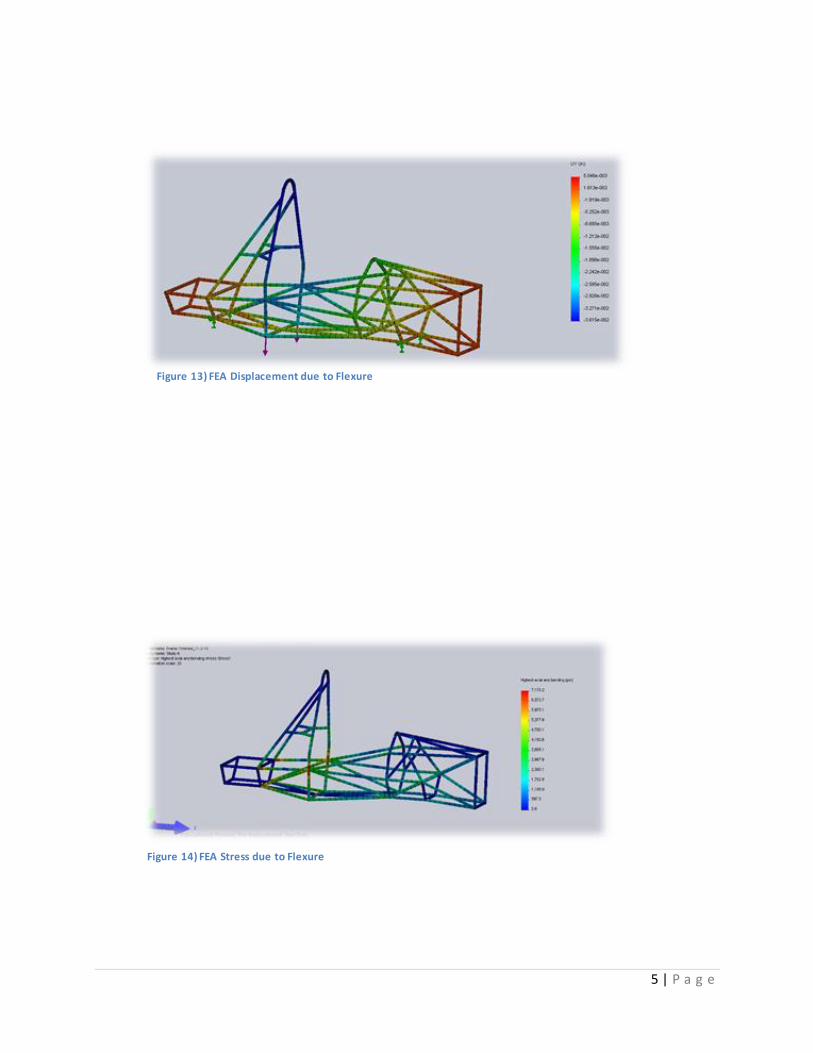
Frame Analysis and Validation:
SolidWorks finite element analysis package was utilized to design and optimize the chassis.
Many different chassis designs were analyzed using the same flexure and torsion tests in order to
minimize the amount of frame members used while still maintaining proper stiffness. The torsion
analysis (Fig 11 and Fig 12) was performed by fixing the rear suspension box and applying a couple to the
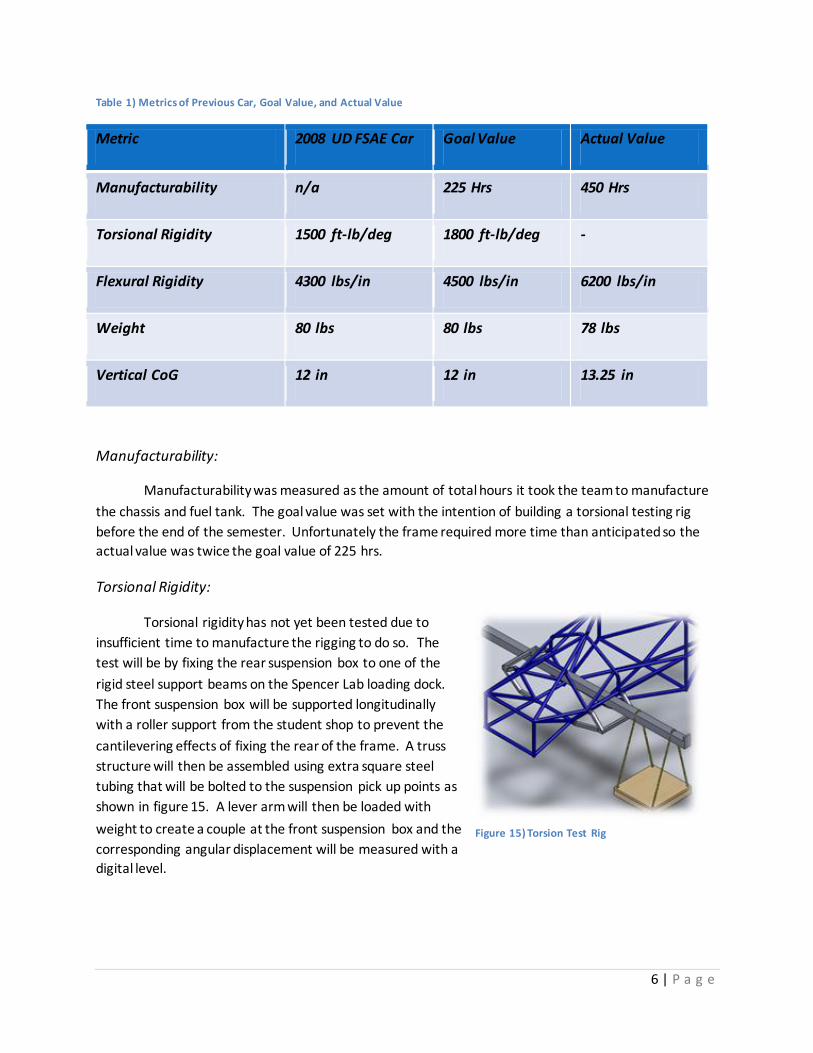
front suspension box. The flexure analysis (Fig 13 and 14) was performed by fixing the front of the rear
suspension box and the front of the front suspension box and applying distributed load along the bar at
the base of the main roll hoop.
Figure11) FEA Displacement due to Torsion
Figure12) FEA Stress due to Torsion
5 | P a g e
Figure 13) FEA Displacement due to Flexure
Figure 14) FEA Stress due to Flexure
6 | P a g e
Table 1) Metrics of Previous Car, Goal Value, and Actual Value
Metric 2008 UD FSAE Car Goal Value Actual Value
Manufacturability n/a 225 Hrs 450 Hrs
Torsional Rigidity 1500 ft-lb/deg 1800 ft-lb/deg -
Flexural Rigidity 4300 lbs/in 4500 lbs/in 6200 lbs/in
Weight 80 lbs 80 lbs 78 lbs
Vertical CoG 12 in 12 in 13.25 in
Manufacturability:
Manufacturability was measured as the amount of total hours it took the team to manufacture
the chassis and fuel tank. The goal value was set with the intention of building a torsional testing rig
before the end of the semester. Unfortunately the frame required more time than anticipated so the
actual value was twice the goal value of 225 hrs.
Torsional Rigidity:
Torsional rigidity has not yet been tested due to
insufficient time to manufacture the rigging to do so. The
test will be by fixing the rear suspension box to one of the
rigid steel support beams on the Spencer Lab loading dock.
The front suspension box will be supported longitudinally
with a roller support from the student shop to prevent the
cantilevering effects of fixing the rear of the frame. A truss
structure will then be assembled using extra square steel
tubing that will be bolted to the suspension pick up points as
shown in figure 15. A lever arm will then be loaded with
weight to create a couple at the front suspension box and the
corresponding angular displacement will be measured with a
digital level.
Figure 15) Torsion Test Rig
7 | P a g e
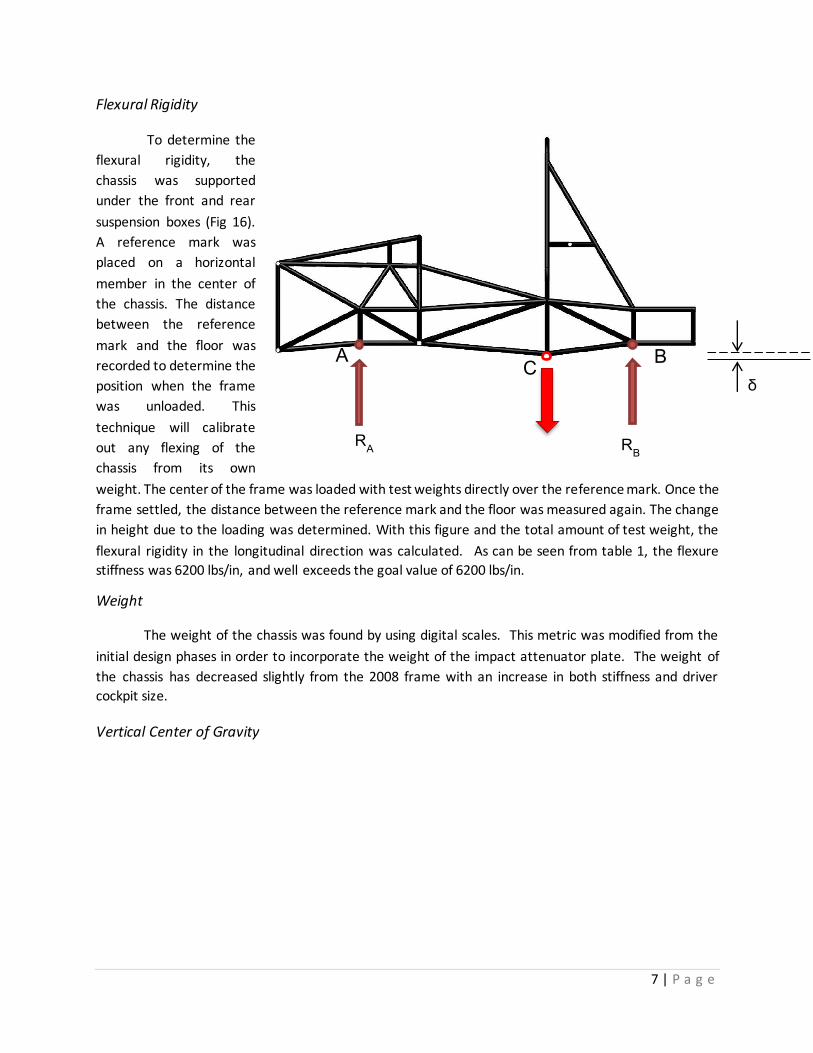
Flexural Rigidity
To determine the
flexural rigidity, the
chassis was supported
under the front and rear
suspension boxes (Fig 16).
A reference mark was
placed on a horizontal
member in the center of
the chassis. The distance
between the reference
mark and the floor was
recorded to determine the
position when the frame
was unloaded. This
technique will calibrate
out any flexing of the
chassis from its own
weight. The center of the frame was loaded with test weights directly over the reference mark. Once the
frame settled, the distance between the reference mark and the floor was measured again. The change
in height due to the loading was determined. With this figure and the total amount of test weight, the
flexural rigidity in the longitudinal direction was calculated. As can be seen from table 1, the flexure
stiffness was 6200 lbs/in, and well exceeds the goal value of 6200 lbs/in.
Weight
The weight of the chassis was found by using digital scales. This metric was modified from the
initial design phases in order to incorporate the weight of the impact attenuator plate. The weight of
the chassis has decreased slightly from the 2008 frame with an increase in both stiffness and driver
cockpit size.
Vertical Center of Gravity
Figure16) Flexure Testing Method
RA R
B
A B C
δ
8 | P a g e
x
y
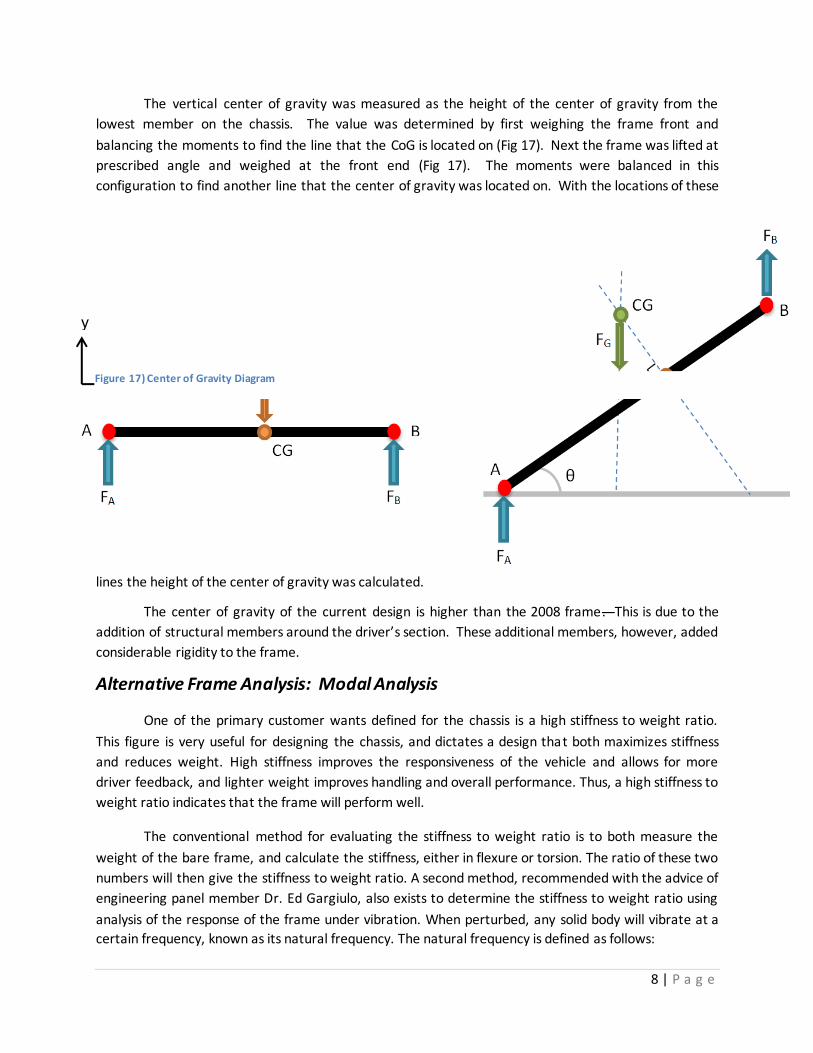
The vertical center of gravity was measured as the height of the center of gravity from the
lowest member on the chassis. The value was determined by first weighing the frame front and
balancing the moments to find the line that the CoG is located on (Fig 17). Next the frame was lifted at
prescribed angle and weighed at the front end (Fig 17). The moments were balanced in this
configuration to find another line that the center of gravity was located on. With the locations of these
lines the height of the center of gravity was calculated.
The center of gravity of the current design is higher than the 2008 frame. This is due to the
addition of structural members around the driver’s section. These additional members, however, added
considerable rigidity to the frame.
Alternative Frame Analysis: Modal Analysis
One of the primary customer wants defined for the chassis is a high stiffness to weight ratio.
This figure is very useful for designing the chassis, and dictates a design that both maximizes stiffness
and reduces weight. High stiffness improves the responsiveness of the vehicle and allows for more
driver feedback, and lighter weight improves handling and overall performance. Thus, a high stiffness to
weight ratio indicates that the frame will perform well.
The conventional method for evaluating the stiffness to weight ratio is to both measure the
weight of the bare frame, and calculate the stiffness, either in flexure or torsion. The ratio of these two
numbers will then give the stiffness to weight ratio. A second method, recommended with the advice of
engineering panel member Dr. Ed Gargiulo, also exists to determine the stiffness to weight ratio using
analysis of the response of the frame under vibration. When perturbed, any solid body will vibrate at a
certain frequency, known as its natural frequency. The natural frequency is defined as follows:
Figure 17) Center of Gravity Diagram
9 | P a g e
√
where is the natural frequency, k is the stiffness of the frame, and m is the mass of the frame.
Conveniently, the term under the radical is stiffness over weight. This indicates that the natural
frequency is a function of the square root of the stiffness to weight ratio. Thus, a higher natural
frequency indicates a higher stiffness to weight ratio. Additionally, many bodies may contain multiple
natural frequencies, called resonant frequencies, at multiples of the natural frequency, known as
harmonics, depending on the vibration type, or “mode”. When a body vibrates at a resonant frequency,
it will oscillate at larger amplitude than other frequencies, even those that may be larger than the
natural frequency. The body will oscillate with more and more amplitude in an attempt to dissipate the
energy stored within it. Since any real object has a certain amount of damping, the amount of amplitude
is limited. However, It may be large enough to still cause damage to the part.
In the context of the chassis, each member has its own set of resonant frequencies. If the
member is allowed to oscillate at one of its resonant frequencies, it may displace itself enough to cause
a failure in one of the welds holding the frame together. The primary source of vibrations in the chassis
is from the engine. The engine uses a single-cylinder configuration, which is inherently unbalanced. As a
result, large vibratory forces are transferred from the engine into the chassis. In fact, in the two previous
chassis designs for the FSAE team, the frame suffered weld joint failures near the engine. This indicates
that the frequencies produced from the engine vibrations corresponded to some of the resonant
frequencies of the chassis. In these chassis, special care was not taken to dampen any of these
vibrations, resulting in structural damage. This leads to two conclusions: the chassis should be analyzed
to find its resonant frequencies, and, should those frequencies correspond to common frequencies
created by the engine, that the engine should be damped to help reduce the chance of structural failure.
Similar to the static finite element analysis performed, the chassis can be analyzed with
Solidworks, using a technique called modal frequency analysis. This method will convert the frame to a
mesh, and simulate vibrations through the chassis using several different frequencies. The frequencies
that create the largest displacements are recorded, and the mode of vibration corresponding to each is
also recorded. The results supply each resonant frequency, and the “mode shape” for each
corresponding frequency. The usefulness of these frequencies and mode shapes is twofold: they can be
used to determine if the vibrations of the engine may cause damage to the chassis, and the mode
shapes can be used to see which frequencies are of relevance to the design of the chassis. Additionally,
this method can be used to compare two frame designs side by side. Since higher natural frequencies
correspond to a higher stiffness to weight ratio, a new frame design can be compared to previous
iterations to see if the stiffness to weight ratio has been improved.
10 | P a g e
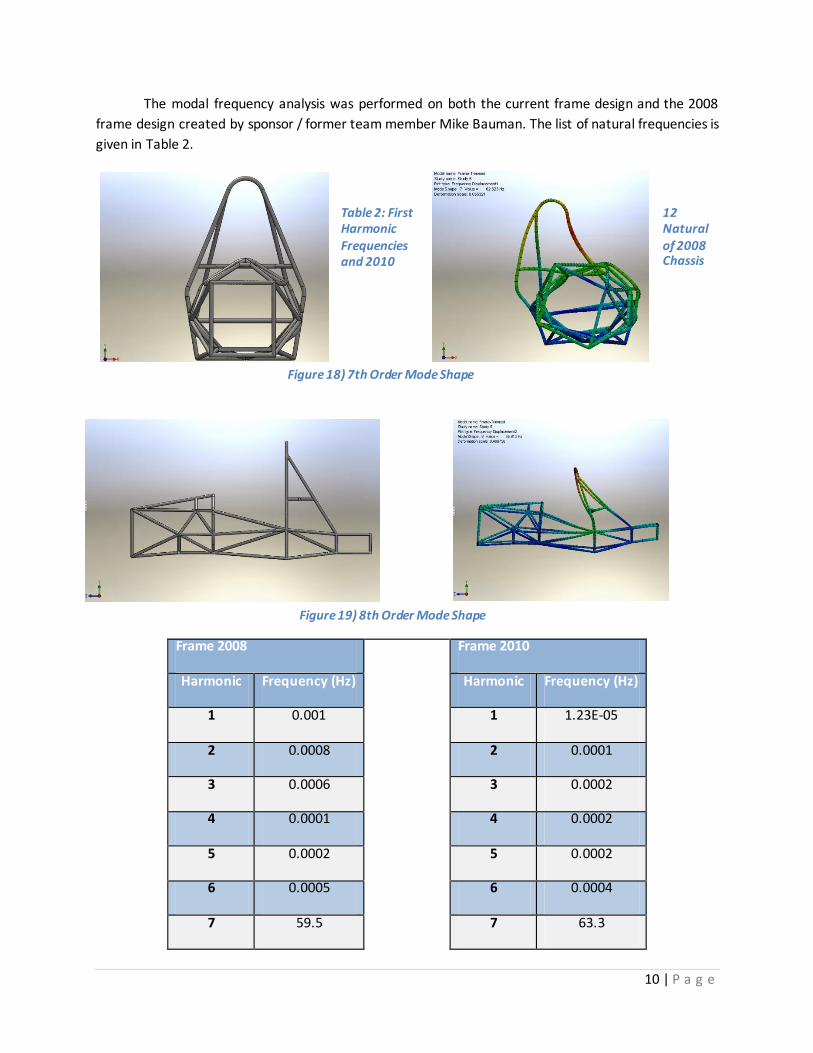
The modal frequency analysis was performed on both the current frame design and the 2008
frame design created by sponsor / former team member Mike Bauman. The list of natural frequencies is
given in Table 2.
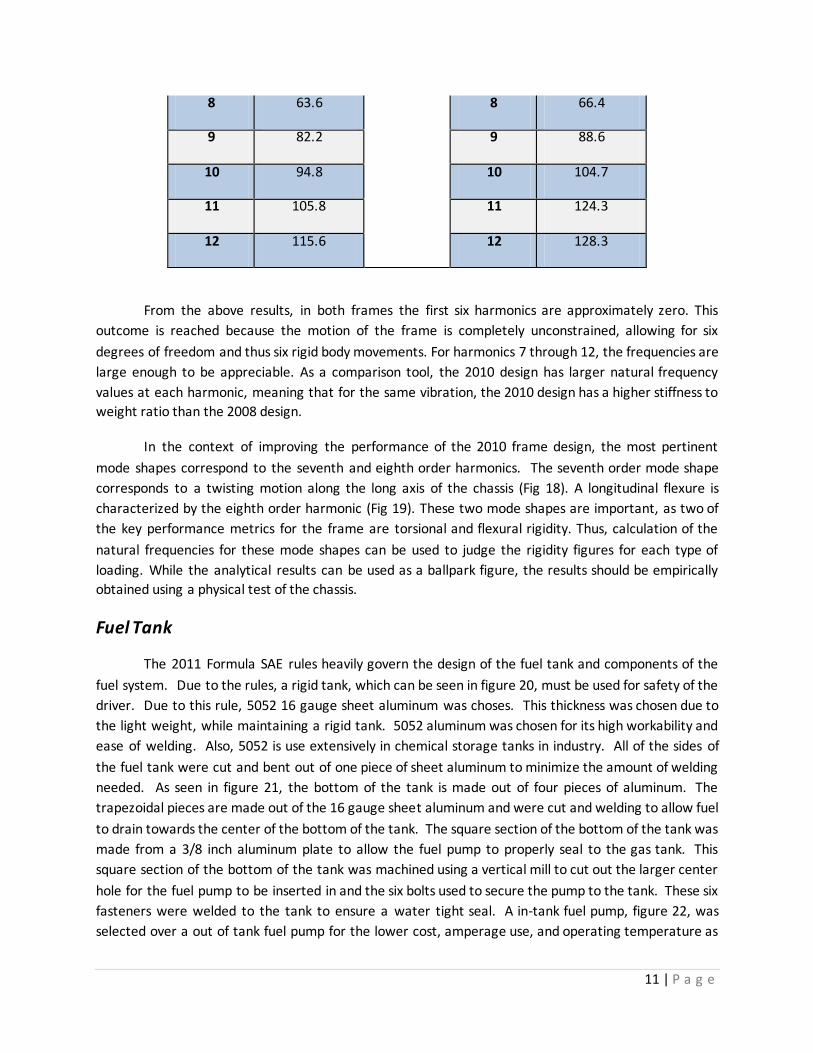
Table 2: First 12 Harmonic Natural Frequencies of 2008 and 2010 Chassis
Frame 2008 Frame 2010
Harmonic Frequency (Hz) Harmonic Frequency (Hz)
1 0.001 1 1.23E-05
2 0.0008 2 0.0001
3 0.0006 3 0.0002
4 0.0001 4 0.0002
5 0.0002 5 0.0002
6 0.0005 6 0.0004
7 59.5 7 63.3
Figure 18) 7th Order Mode Shape
Figure 19) 8th Order Mode Shape
11 | P a g e
8 63.6 8 66.4
9 82.2 9 88.6
10 94.8 10 104.7
11 105.8 11 124.3
12 115.6 12 128.3
From the above results, in both frames the first six harmonics are approximately zero. This
outcome is reached because the motion of the frame is completely unconstrained, allowing for six
degrees of freedom and thus six rigid body movements. For harmonics 7 through 12, the frequencies are
large enough to be appreciable. As a comparison tool, the 2010 design has larger natural frequency
values at each harmonic, meaning that for the same vibration, the 2010 design has a higher stiffness to
weight ratio than the 2008 design.
In the context of improving the performance of the 2010 frame design, the most pertinent
mode shapes correspond to the seventh and eighth order harmonics. The seventh order mode shape
corresponds to a twisting motion along the long axis of the chassis (Fig 18). A longitudinal flexure is
characterized by the eighth order harmonic (Fig 19). These two mode shapes are important, as two of
the key performance metrics for the frame are torsional and flexural rigidity. Thus, calculation of the
natural frequencies for these mode shapes can be used to judge the rigidity figures for each type of
loading. While the analytical results can be used as a ballpark figure, the results should be empirically
obtained using a physical test of the chassis.
Fuel Tank
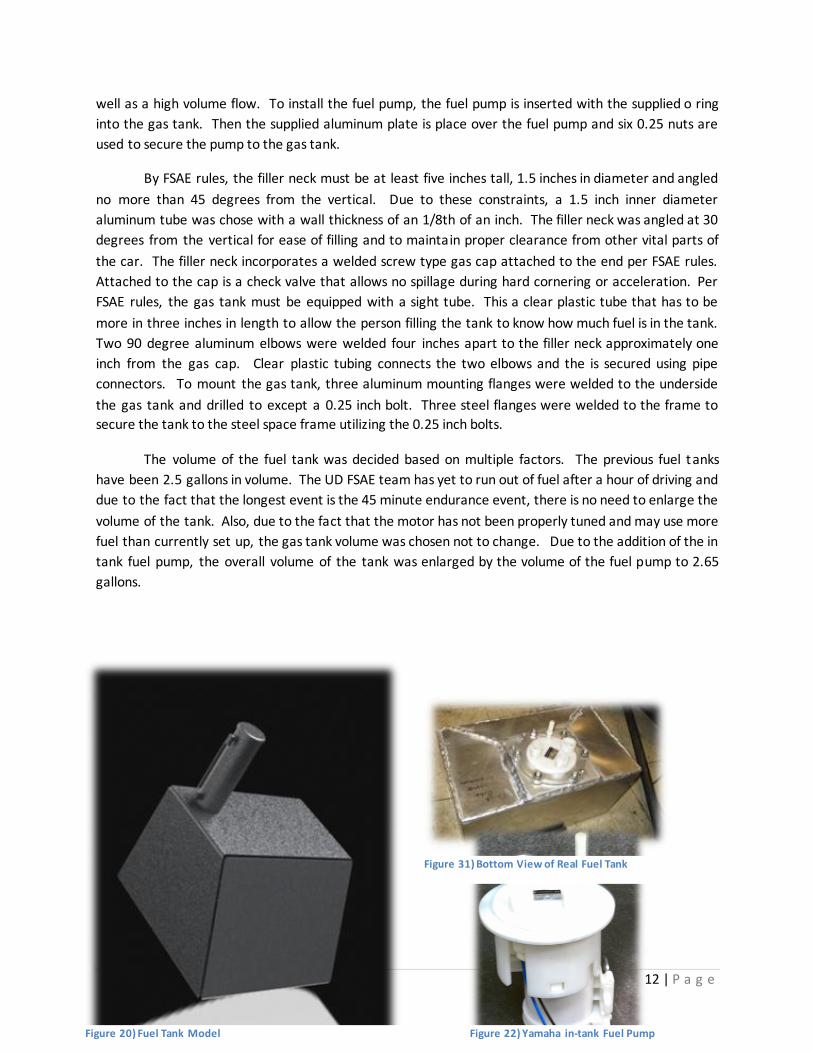
The 2011 Formula SAE rules heavily govern the design of the fuel tank and components of the
fuel system. Due to the rules, a rigid tank, which can be seen in figure 20, must be used for safety of the
driver. Due to this rule, 5052 16 gauge sheet aluminum was choses. This thickness was chosen due to
the light weight, while maintaining a rigid tank. 5052 aluminum was chosen for its high workability and
ease of welding. Also, 5052 is use extensively in chemical storage tanks in industry. All of the sides of
the fuel tank were cut and bent out of one piece of sheet aluminum to minimize the amount of welding
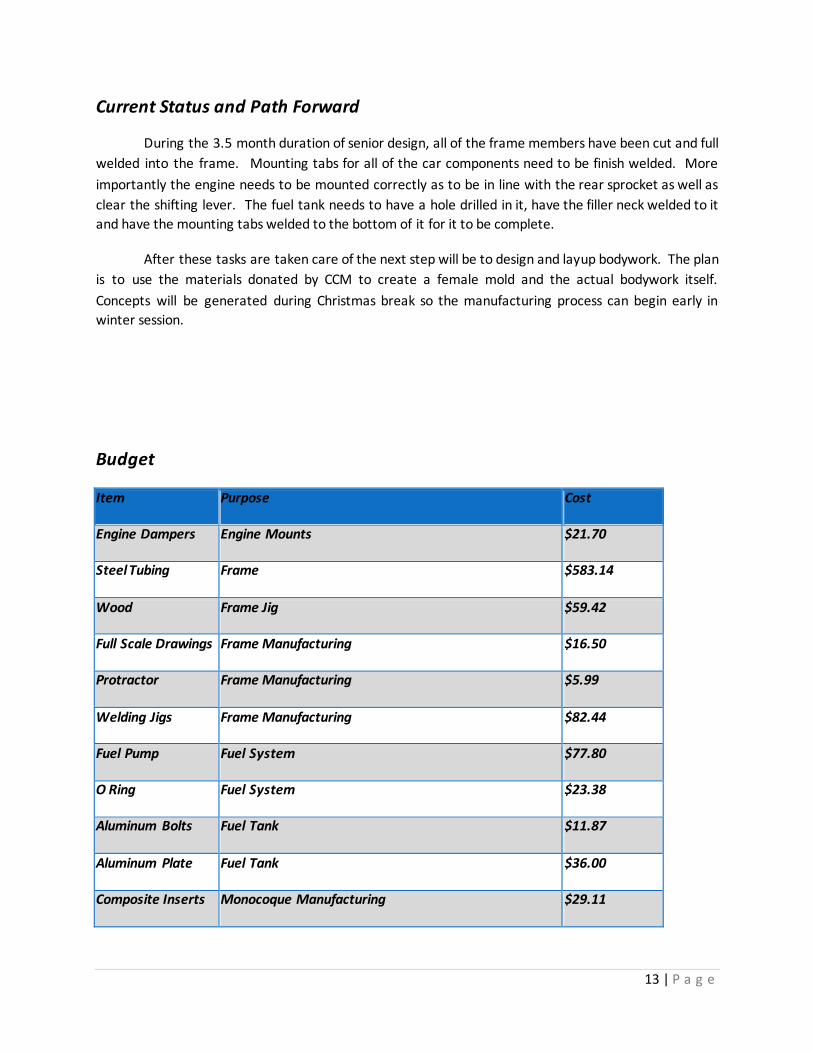
needed. As seen in figure 21, the bottom of the tank is made out of four pieces of aluminum. The
trapezoidal pieces are made out of the 16 gauge sheet aluminum and were cut and welding to allow fuel
to drain towards the center of the bottom of the tank. The square section of the bottom of the tank was
made from a 3/8 inch aluminum plate to allow the fuel pump to properly seal to the gas tank. This
square section of the bottom of the tank was machined using a vertical mill to cut out the larger center
hole for the fuel pump to be inserted in and the six bolts used to secure the pump to the tank. These six
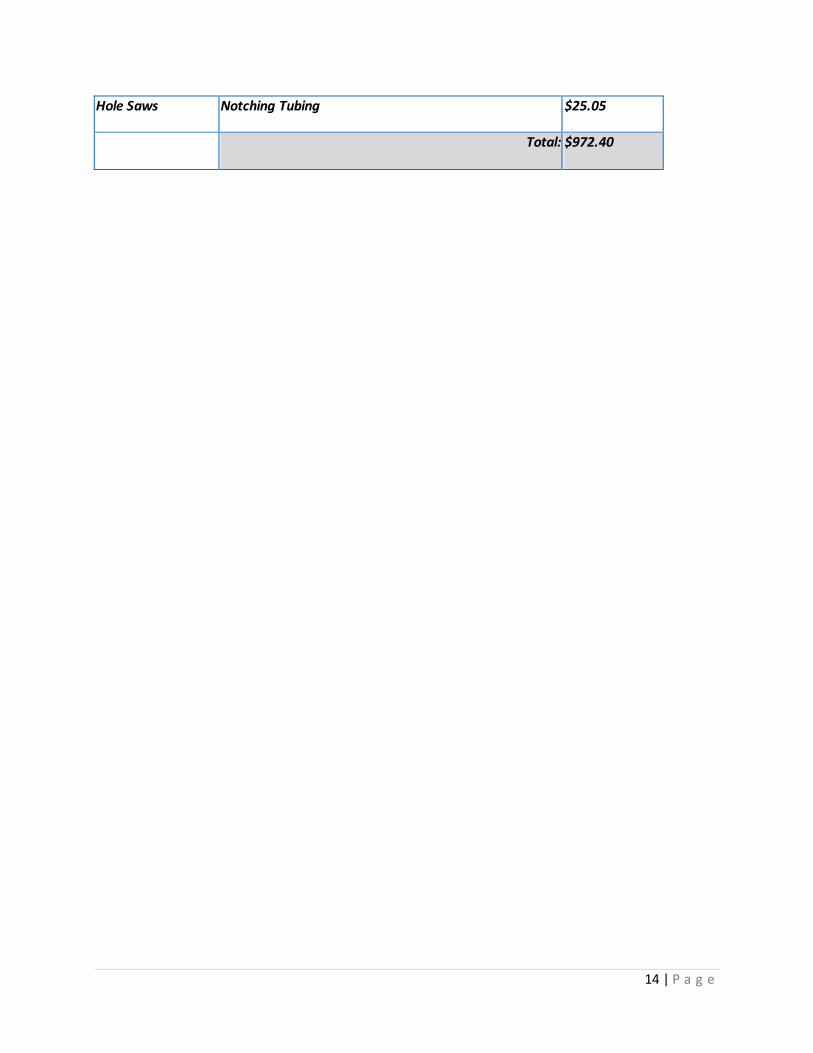
fasteners were welded to the tank to ensure a water tight seal. A in-tank fuel pump, figure 22, was
selected over a out of tank fuel pump for the lower cost, amperage use, and operating temperature as
12 | P a g e
well as a high volume flow. To install the fuel pump, the fuel pump is inserted with the supplied o ring
into the gas tank. Then the supplied aluminum plate is place over the fuel pump and six 0.25 nuts are
used to secure the pump to the gas tank.
By FSAE rules, the filler neck must be at least five inches tall, 1.5 inches in diameter and angled
no more than 45 degrees from the vertical. Due to these constraints, a 1.5 inch inner diameter
aluminum tube was chose with a wall thickness of an 1/8th of an inch. The filler neck was angled at 30
degrees from the vertical for ease of filling and to maintain proper clearance from other vital parts of
the car. The filler neck incorporates a welded screw type gas cap attached to the end per FSAE rules.
Attached to the cap is a check valve that allows no spillage during hard cornering or acceleration. Per
FSAE rules, the gas tank must be equipped with a sight tube. This a clear plastic tube that has to be
more in three inches in length to allow the person filling the tank to know how much fuel is in the tank.
Two 90 degree aluminum elbows were welded four inches apart to the filler neck approximately one
inch from the gas cap. Clear plastic tubing connects the two elbows and the is secured using pipe
connectors. To mount the gas tank, three aluminum mounting flanges were welded to the underside
the gas tank and drilled to except a 0.25 inch bolt. Three steel flanges were welded to the frame to
secure the tank to the steel space frame utilizing the 0.25 inch bolts.
The volume of the fuel tank was decided based on multiple factors. The previous fuel tanks
have been 2.5 gallons in volume. The UD FSAE team has yet to run out of fuel after a hour of driving and
due to the fact that the longest event is the 45 minute endurance event, there is no need to enlarge the
volume of the tank. Also, due to the fact that the motor has not been properly tuned and may use more
fuel than currently set up, the gas tank volume was chosen not to change. Due to the addition of the in
tank fuel pump, the overall volume of the tank was enlarged by the volume of the fuel pump to 2.65
gallons.
Figure 20) Fuel Tank Model
Figure 31) Bottom View of Real Fuel Tank
Figure 22) Yamaha in-tank Fuel Pump
13 | P a g e
Current Status and Path Forward
During the 3.5 month duration of senior design, all of the frame members have been cut and full
welded into the frame. Mounting tabs for all of the car components need to be finish welded. More
importantly the engine needs to be mounted correctly as to be in line with the rear sprocket as well as
clear the shifting lever. The fuel tank needs to have a hole drilled in it, have the filler neck welded to it
and have the mounting tabs welded to the bottom of it for it to be complete.
After these tasks are taken care of the next step will be to design and layup bodywork. The plan
is to use the materials donated by CCM to create a female mold and the actual bodywork itself.
Concepts will be generated during Christmas break so the manufacturing process can begin early in
winter session.
Budget
Item Purpose Cost
Engine Dampers Engine Mounts $21.70
Steel Tubing Frame $583.14
Wood Frame Jig $59.42
Full Scale Drawings Frame Manufacturing $16.50
Protractor Frame Manufacturing $5.99
Welding Jigs Frame Manufacturing $82.44
Fuel Pump Fuel System $77.80
O Ring Fuel System $23.38
Aluminum Bolts Fuel Tank $11.87
Aluminum Plate Fuel Tank $36.00
Composite Inserts Monocoque Manufacturing $29.11
14 | P a g e
Hole Saws Notching Tubing $25.05
Total: $972.40